
 Open Access Article
 This Open Access Article is licensed under a
 Creative Commons Attribution 3.0 Unported Licence
Raman spectroscopy of brain and skin tissue in a minipig model of Huntington's disease†
Kevin
Tipatet
 a,
Isla
Du Boulay
a,
Hamish
Muir
a,
Liam
Davison-Gates
a,
Zdenka
Ellederová
ab and
Andrew
Downes
*a
a,
Isla
Du Boulay
a,
Hamish
Muir
a,
Liam
Davison-Gates
a,
Zdenka
Ellederová
ab and
Andrew
Downes
*a
aa, Institute for Bioengineering, School of Engineering, University of Edinburgh, King's Buildings, Edinburgh EH9 3DW, UK. E-mail: andy.downes@ed.ac.uk
bInstitute of Animal Physiology and Genetics, Czech Academy of Sciences, Rumburská 89, 277 21 Liběchov, UK
First published on 15th December 2023
Abstract
We applied Raman spectroscopy to brain and skin tissues from a minipig model of Huntington's disease. Differences were observed between measured spectra of tissues with and without Huntington's disease, for both brain tissue and skin tissue. There are linked to changes in the chemical composition between tissue types. Using machine learning we correctly classified 96% of test spectra as diseased or wild type, indicating that the test would have a similar accuracy when used as a diagnostic tool for the disease. This suggests the technique has great potential in the rapid and accurate diagnosis of Huntington's and other neurodegenerative diseases in a clinical setting.
Introduction
Huntington's disease (HD) is a neurodegenerative disease affecting 5–10 people per 100![[thin space (1/6-em)]](https://www.rsc.org/images/entities/char_2009.gif) 000 population.1 Its symptoms are of involuntary movements and loss of co-ordination, and later cognitive dysfunction.2 Currently, the onset of disease is diagnosed inaccurately through a collection of behavioural tests after symptoms become unambiguous.2–5 HD is caused by a genetic mutation, with a repeat of cytosine–adenine–guanine (CAG) in the huntingtin gene. This causes a repeat of glutamine in the protein sequence which in turn causes the protein to misfold and aggregate into plaques6 in neurons. Above 40 repeats tends to produce full penetration of the disease, and below 35 repeats tends not to lead to the disease,2 but the number of repeats is not an exact predictor of the severity of the disease, and does not predict the age of onset of the disease. This explains why, although a genetic test is available, less than 5% of those who may have inherited the huntingtin gene choose to perform this test.2
000 population.1 Its symptoms are of involuntary movements and loss of co-ordination, and later cognitive dysfunction.2 Currently, the onset of disease is diagnosed inaccurately through a collection of behavioural tests after symptoms become unambiguous.2–5 HD is caused by a genetic mutation, with a repeat of cytosine–adenine–guanine (CAG) in the huntingtin gene. This causes a repeat of glutamine in the protein sequence which in turn causes the protein to misfold and aggregate into plaques6 in neurons. Above 40 repeats tends to produce full penetration of the disease, and below 35 repeats tends not to lead to the disease,2 but the number of repeats is not an exact predictor of the severity of the disease, and does not predict the age of onset of the disease. This explains why, although a genetic test is available, less than 5% of those who may have inherited the huntingtin gene choose to perform this test.2
There is therefore an unmet need for a quantitative, accurate test for the onset of disease. In order for such a diagnostic test to be taken up in the clinic it should be minimally invasive, affordable and accurate enough to be applied at the onset of symptoms.
Raman spectroscopy is a form of optical spectroscopy whereby a laser focussed onto a region is able to excite vibrational modes within molecules. An individual photon loses energy when exciting the vibration, so by measuring the energy of these interacting photons with a spectrometer we can deduce the energy, and therefore frequency, of a vibration excited within the molecule. A single molecule has several vibrational modes at different frequencies, each frequency relating to a specific vibrational mode within the molecule, such as the symmetric stretching of a C–H bond found in abundance in lipids, or a C–N bond characteristic of proteins. The chemical composition of an unknown sample containing a mixture of molecules can be quantitatively deduced, provided each type of candidate molecule has previously been characterised. Cells and biological tissues contain highly complex mixtures of biomolecules, and subtle changes in chemical composition caused by a disease can be revealed with Raman spectroscopy.7–9 Brain tumours have been diagnosed with Raman spectroscopy10 but neurodegenerative diseases are not localised to the brain – the protein aggregates are formed in various tissues in the body, but affect the physiological functioning of neurons first. One recent study has looked at blood serum with surface enhanced Raman spectroscopy and gold nanoparticles, and found a significant distinction between patients with and without Huntington's disease.11 This suggests that the analysis of tissue and fluids far from the brain can be used to diagnose Huntington's disease. Raman spectroscopy has previously been applied to fibroblast cells from a patient with Huntington's disease12 which separated cells into diseased and healthy controls with an accuracy of 95%. As these fibroblasts – connective tissue cells – are far from the brain, these results raise the hope that a more accessible part of the body than the brain could be analysed with Raman spectroscopy and provide an accurate diagnosis due to the presence of protein aggregates throughout the body in neurodegenerative diseases.
Raman spectroscopy has been used to analyse a variety of neurodegenerative diseases.13 Parkinson's disease was diagnosed with an accuracy of 71% by investigating circulating extracellular vesicles filtered from the blood.14 Alzheimer's disease has received the greatest focus from researchers. Raman spectroscopy of blood serum was able to differentiate patients with more than 95% sensitivity and specificity,15 and this rose to 98% in another study with a tertiary model for differentiating Alzheimer's, other neurodegenerative dementias, and healthy controls.16 Raman spectroscopy of Lewy Bodies in Blood17 achieved 84% sensitivity and 86% specificity in predicting early stage Alzheimer's. Raman studies were performed on cerebrospinal fluid with 84% sensitivity and 84% specificity,18 and mouse retina with an accuracy of 85.9%.19 Saliva was used as a diagnostic fluid for Alzheimer's and Parkinson's disease, achieving an accuracy of 97%.20
Alternative methods for diagnosis of Huntington's disease are an ongoing research theme. Magnetic Resonance Imaging (MRI) and Positron Emission Tomography (PET) imaging are the two methods with most potential but as one review21 concludes, despite continued research “no single technique has been validated as an optimal biomarker”.
In this study we aim to be the first to diagnose Huntington's disease by analysis of brain tissue with Raman spectroscopy, and also investigate the hypothesis that Raman spectroscopy analysis of skin can be used to diagnose Huntington's disease. We chose a minipig model of Huntington's disease22,23 to test this hypothesis, and if successful Raman spectroscopy could be applied to humans in a clinical setting, providing a rapid, minimally invasive diagnostic test on skin with near-instant results for Huntington's disease. This would also open up the potential of diagnosing and discriminating other neurodegenerative diseases with higher prevalence in the population, such as Alzheimer's disease.
Materials & methods
Sample preparation
A minipig animal model of Huntington's disease has been developed by the Czech Academy of Sciences.22,23 HD transgenic (TgHD) minipigs were bred with a modified huntingtin (HTT) gene with the insertion of 124 CAG repeats. No developmental or gross motor deficits were noted up to 40 months of age. Mutant HTT mRNA and protein fragments with these 124 CAG repeats were detected in both brain and peripheral tissues. The emergence of HD-like phenotypes in the TgHD minipigs was clear at 60–70 months: significant cell loss was detected in the caudate nucleus, putamen and cortex. This was accompanied by activation of astrocytes and accumulation of clusters of structures in the neurites of neurons.Samples of brain and skin were taken from minipigs aged 60–70 months – 4 TgHD animals, and 4 wild type (WT) animals without the HTT gene as controls. Only one of the WT animals was male, but all the TgHD animals were female. Tissue of size ∼5 mm was cut from carcasses and stored at −80 °C and transported to Edinburgh on dry ice. Samples were subsequently thawed over 15 minutes, and soaked in ethanol overnight to reduce fluorescence observed in Raman spectra. Samples were rinsed three times in phosphate buffer saline (PBS) 1× and mounted into a sample holder picture in Fig. 1. A glass coverslip (#1, 0.17 mm thick) acts as the base, and the sample is squashed to a thickness of 2 mm by a top quartz coverslip (0.17 mm thick).
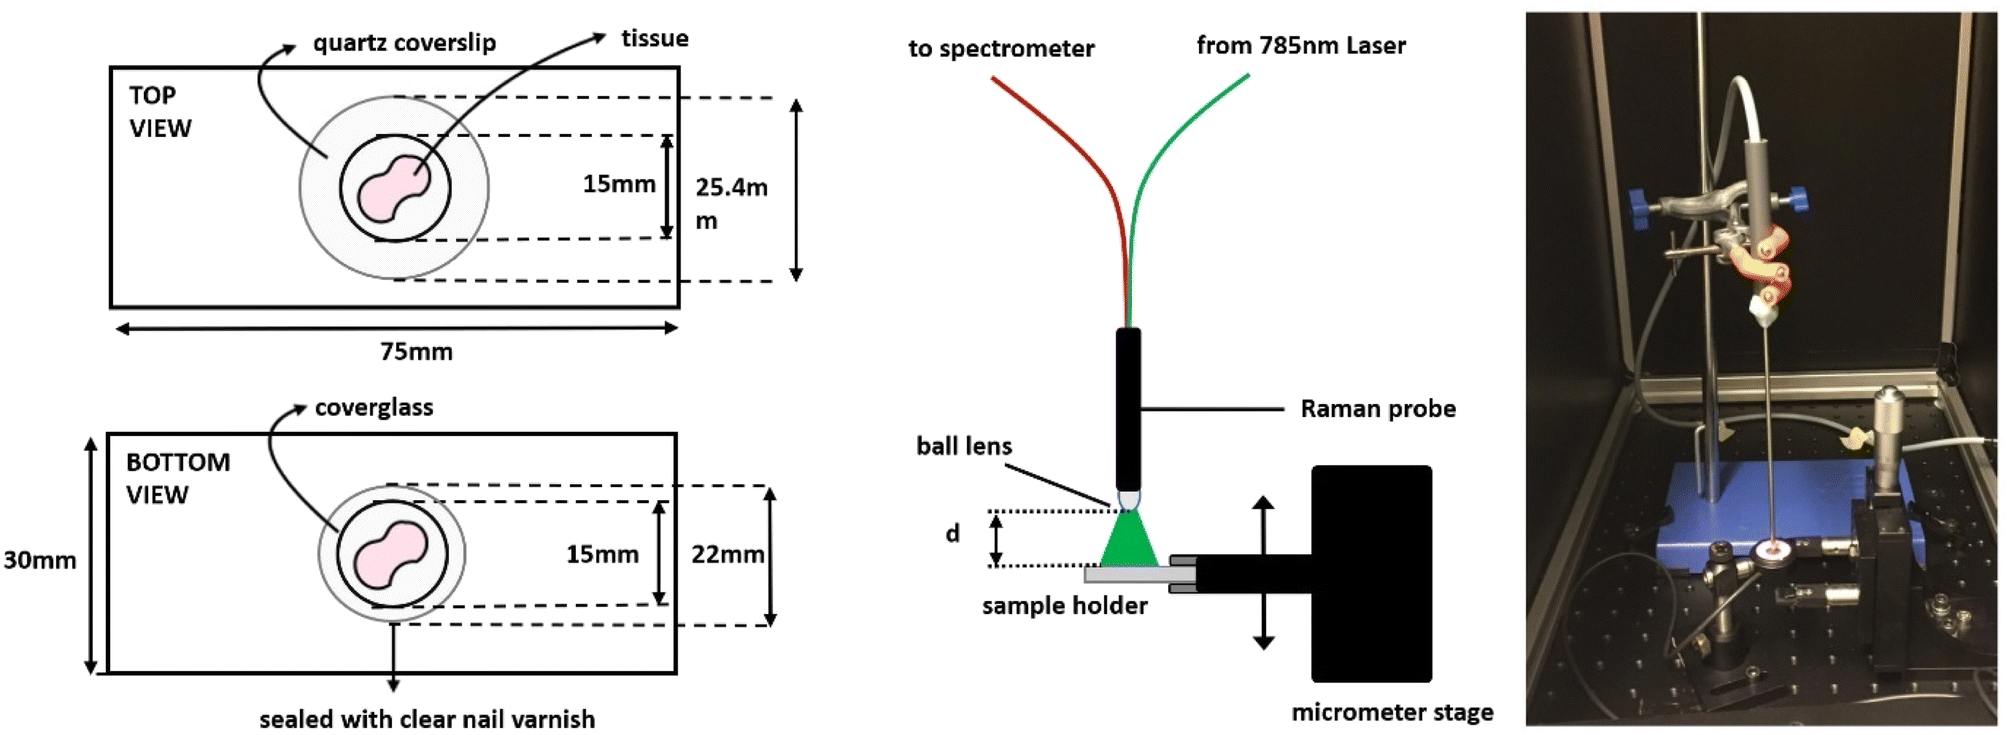 | ||
| Fig. 1 Left: a schematic diagram of the sample slide setup. Centre: a side view of the sample and probe and the arrangement of its fibres. Right: photograph of the probe above a power meter on a glass slide attached to a vertical micrometer stage. | ||
Raman spectroscopy
In order to align with the goal of applying Raman spectroscopy to human subjects, we used a fibre optic probe spectrometer which illuminates a sub-millimeter spot in all 3 dimensions, rather than our confocal Raman spectrometer which focusses the laser to a micron-size spot and hence employs orders of magnitude higher laser intensity unsuitable for safe use on humans. Another benefit of the probe system is that sampling over a larger region produces a more representative spectrum from a larger volume of tissue. Confocal Raman spectroscopy produces spectra which vary considerably according to the lateral position of the focal spot, and has very low depth penetration. Confocal illumination and detection is advantageous in many applications, but not in the spectral analysis of a piece of tissue – due to its heterogeneity and damaging laser intensities. A major drawback of the probe system is its low collection efficiency compared to confocal detection through a microscope objective lens – the probe has a ring of 7 multimode fibers for collection of light, surrounding a central fiber for delivery of the laser. The reduction in collection area and reduced numerical aperture (angle) of collection in optical fibers is apparent in a greatly reduced signal, and our probe system also has inferior noise with its detector compared to the triple Peltier cooled CCDs present in confocal Raman systems.Our Raman fiber optic probe system compromises an Ocean Optics 785 nm laser (350 mW power output), Ocean Optics QEPro spectrometer (cooled silicon photodiode linear array) and Art Photonics Raman probe with ball lens. The laser power at the sample is 184 mW, after losses due to launching into the central fiber. A limit of 296 mW cm−2 applies for the use of a 785 nm laser on skin (IEC 60825/ANSI Z136.1), but when samples are placed at a distance of several centimeters the collection efficiency is greatly reduced. The highest signal to noise ratio is achieved when the probe is in contact with the sample, but with full laser power focused into a sub-millimeter spot this still achieves intensities far higher than that permissible in human skin. Reducing the laser power to achieve this allowable intensity in humans was attempted, but signal levels were too low to be practically applied to tissue. Thus, full power was used at zero distance to achieve good quality spectra, with the knowledge that alternative Raman spectroscopy systems could achieve good signal levels combined with illumination over a large area. These will be discussed later.
After the sample is mounted, the probe is approached carefully as depicted in Fig. 1. Using a micrometer driven translation stage, the point of contact can be sensed by a change in force applied, where separation between probe tip and quartz coverslip, d, is zero. This allows for high signals and reproducibility, without damaging the surface of the ball lens. The probe is fed into a light tight chamber to allow for long acquisition times.
The acquisition time was set as 50 seconds, with 20 averages, giving a total acquisition time for each Raman spectrum of 1000 seconds. The sample is immersed in phosphate buffered saline (PBS) during the acquisition of Raman spectra, and 5–8 spectra were acquired from different regions within the same sample. After a Raman spectrum was acquired, the tissue was removed and replaced by PBS solution, then a background Raman spectrum acquired and subsequently subtracted to remove the contribution from the quartz, glass, PBS, and glass fiber probe, and reduce other potential artefacts such as detector noise. For brain, 23 Raman spectra were taken from 4 tissue samples of wild type (WT) and 25 Raman spectra from 5 transgenic (HD) tissue samples. For skin, 23 Raman spectra were taken from 4 samples of WT, and 29 Raman spectra were taken from 4 samples of WT. Each tissue sample was from a different animal.
Spectral processing
The pre-processing steps for the Raman spectra were carried out as previously described.24 This performs 4 types of pre-processing on spectral data. Raw spectra were first filtered by applying a spectral window 600–1700 cm−1 to select the ‘fingerprint’ region relating to biomolecules. Subsequently, a Savitzky–Golay first derivative filter was applied to reduce low frequency signals associated with the background, and Savitzky–Golay smoothing to compensate for amplification of high frequency signals and noise within spectral peaks. Background subtraction (‘flattening’) of spectra was achieved using the routine ‘msbackadj’ in Matlab 2023b. Finally, spectra were normalized and mean-centred.All processed spectra from HD and WT groups were compared by principal component analysis (PCA). PCA transforms a number of possibly correlated variables into a smaller number of variables called principal components. The first principal component loading, PC1, is a spectrum which contains the most variance between the full set of all Raman spectra (both WT and HD), and subsequent component spectra (PC2, PC3…) contain ever decreasing variance between the full set of Raman spectra.
Machine learning and validation
Classification of spectra can then be performed by plotting principal components against each other, to reveal the pair of components giving best separation. However, higher classification accuracies were observed by excluding principal components which account for the smallest variations which are dominated by noise. To this end, scree tests were performed to determine the number of principal components that explain 95% variance in the data.Subsequently, several classification techniques were performed on these most significant components in custom Python 3.11 code using the Scikit-learn library version 1.3 and employing its default parameters for each of the 5 machine learning methods. These classification techniques were: partial least squares discriminant analysis (PLS-DA), artificial neural networks (ANN), linear discriminant analysis (LDA), linear support vector classification (LSVC), and logistic regression (LR).
Cross-validation was performed using a method called Stratified K-Folds validation that distributes the data into n evenly (not randomly) selected splits, in this case n = 5, therefore 1/5 of the data (test set) is randomly selected iteratively and evaluated against the remaining 4/5 (training set); this process is repeated 5 times i.e. k = 5. In this method, the value of k is fixed to n (k = n) to enable each spectrum to be employed as a test sample. The process of PCA decomposition in this analysis was conducted post k-fold split to enhance robustness, effectively mitigating potential biases. By applying PCA separately within each fold, the risk of the PCA model being overly influenced by the data in the initial split is significantly reduced. Varying the number of layers in ANN from the default size of 1 × 100 neurons produced limited overall effects, and varying the number of latent variables in the PLSDA model had no discernible impact on the data, suggesting that the initial latent variables capture all relevant information and the data has not been over-fitted. Additionally, permutation tests were applied to each data split to validate the significance of the model's results. In these tests, data labels (in this case, wild-type or Huntington's disease) were randomly shuffled 100×, and the model was rerun. As the results given by the model are significant compared to random labels, the model can be considered significant. These measures, while effective in reducing over-fitting, highlight the necessity for more data to strengthen the robustness of the model further.
Results & discussion
Individual Raman spectra are shown in ESI Fig. S1 and S2.† These are already processed to remove the reference spectrum of water in place of tissue. A large variation in intensity and offsets is apparent, due to slightly different focus position and different region of sample with varying material density and composition. Variations in overall signal intensity are corrected for, by normalisation of each flattened spectrum.Average spectra for each group are presented in Fig. 2, after each spectrum has been normalized and a baseline correction applied. Brain spectra are noisier than skin spectra – presumably due to higher water content in brain tissue.
 | ||
| Fig. 2 Average spectra and difference spectra for minipig brain and skin tissues. From top to bottom: wild type (WT) brain, Huntington's disease (HD) brain, brain difference spectrum: HD minus WT, skin difference spectrum: HD minus WT, WT skin, HD skin. Offsets of each curve, to aid clarity: WT brain +0.0002, HD brain +0.0001, skin difference −0.0001, WT skin −0.0006, HD skin −0.0007. | ||
Each spectrum contains peaks which relate to molecular bonds, such as C–H, C–C, C–N within proteins, etc. A full database of Raman peaks at specific frequencies can be found here.25 It is not possible to unambiguously assign peaks to specific biomolecules, as several types of molecule can have the same peak in the spectrum due to having the same type of chemical bond.
A visual comparison between average brain and skin spectra in Fig. 2 reveals some common peaks, but many differences. There is little similarity in chemical composition between brain and skin, or fibroblast cells from a previous Huntington's Raman study.12
The difference spectrum – the WT spectrum subtracted from the HD spectrum – shows clear features far greater than the noise level, in both brain (blue) and skin (green). The difference spectrum for each tissue type contains a mixture of positive peaks, for molecules more abundant in HD tissues, and negative peaks which imply a reduction of those molecules in HD tissues.
The difference spectrum for brain tissue contains some changes in Raman peaks, but also possible variations in broader autofluorescence peaks,26–28 which are also excited by the 785 nm laser, or changes in the amount of quartz substrate and probe fibre in the spectrum due to a difference in laser absorption and scattering. Raman peaks are tentatively assigned in Table 1. A number of other studies have acquired Raman spectra from brain tissue29–31 which show broad similarities in structure with spectra in Fig. 2 and between each other, but differences due to many possible factors such as animal type, site within brain, sample preparation, and spectrometer characteristics. We are not able to attribute the difference Raman spectrum for brain tissue to protein aggregates, instead we appear to see a variety of changes in chemical composition as a result of the disease. Increased lipofuscin has been observed in the brain of people suffering from HD.32–34
| Raman peak (cm−1) | Assignment |
|---|---|
| Brain (positive peaks) | |
| 742 | DNA, tryptophan |
| 880 | Ethanol artefact |
| 998–1004 (negative) | Phenylalanine |
| 1035–1042 | Proline/collagen |
| 1083 | C–N stretching mode of proteins |
| 1109 | Unidentified |
| 1138 | Unidentified |
| 1275 | Amide III of proteins |
| 1480 | Amide II |
| 1660–1676 | Amide I of proteins/beta sheet |
|
|
| Skin (negative peaks) | |
| 639 | Tyrosine |
| 688 | Unidentified |
| 1343 | C–H proteins/carbohydrates |
| 1539 | Red blood cell/amide II |
Ref. 27 states “Enhanced accumulation of autofluorescent material (most probably representing lipofuscin) was specifically observed in layer V pyramidal cells of tgHD rats, resembling enhanced lipofuscin accumulation in the human disease.”
For skin, we measure similar spectra to those previously published,35–37 although extra peaks in Fig. 2 at 1343 and 1539 cm−1 most likely relate to blood.38–40 We see clearer Raman peaks in the difference spectrum, with lower autofluorescence than brain tissue.41 Most positive peaks are also visible in the average spectrum, suggesting an increase in density of material or lower laser absorption, but there are four clear negative peaks which are listed in Table 1.
Although there are detectable changes in biochemical composition for cells (reported previously), skin and brain and a clear spectral signature for HD in each tissue type, this is not down to a common specific molecule nor a common spectral signature for HD in all tissues.
The establishment of a clear spectral signature for HD in brain and skin tissues permits the use of this spectral data as a diagnostic database. Tissue from an animal with unknown HD status could be diagnosed as either HD or WT by comparing a newly acquired spectrum with the database. Firstly, we need to know how each acquired spectrum differs from those in the same group (HD or WT) and from spectra in the other group.
Principal component analysis (PCA) was performed on the whole data set for brain, and separately for skin. Scree plots in Fig. 3 show that the first 4 principal components are sufficient to describe over 95% of the variance between spectra for brain tissue, and 5 components are required for skin tissue. Applying this threshold to data, and rejecting the remaining components which represent less than 5% of variance, leads to significantly improved accuracies when classifying the data. This is because as the principal component number increases, the larger the proportion of noise that component contains.
 | ||
| Fig. 3 Top: scree plot for the first 4 principal components for brain tissue. Values for components 1–4 are 0.566, 0.269, 0.09, and 0.031, and the cumulative value reaches 0.954. Bottom: scree plot for the first 5 principal components for skin tissue. Values for components 1–5 are 0.482, 0.213, 0.125, 0.091, and 0.05, and the cumulative value reaches 0.961. | ||
The reduced number of principal components were then used as inputs to a variety of machine learning methods: partial least squares discriminant analysis (PLS-DA), artificial neural networks (ANN), linear discriminant analysis (LDA), linear support vector classification (LSVC), and logistic regression (LR). Using four fifths of the data to train the classifier and one fifth of the data as a test set, and repeating the process 5 times, linear scores are produced for every spectrum for brain and separately for skin. As each spectrum is used as test data, and its origin as WT or HD is prior knowledge, we can adjust the threshold of score – above or below which a spectrum is assigned as WT (‘negative’) or HD (‘positive’). A receiver operating characteristic (ROC) graph is a plot of the true positive rate (sensitivity) as a function of the false positive rate (1 – specificity), as the threshold is varied. If a method has no predictive ability, it will produce a line close to a gradient of 1, with an area under the curve (AUC) of 0.50 – i.e. a 50% chance as if guessed. A perfect classification with 100% accuracy produces a square shaped curve, with an AUC of 1.00. Hence the area under the cure is a measure of the predictive accuracy of the method. As diagnostic tests do not value false positives and false negatives equally, the plot allows a visualisation of how the specificity varies when the sensitivity is adjusted.
The predictive accuracy for each of our 5 machine learning methods, is presented in Table 2, for brain tissue and for skin. The ROC graph for the most accurate method for both tissues – partial least squares discriminant analysis (PLS-DA) – is plotted in Fig. 4, and ROC graphs for the remaining methods are plotted in ESI Fig. S3 (ANN), S4 (LDA), S5 (LinearSVC) and S6† (Logistic regression). Each fifth of the data is plotted separately (folds 1 to 5) to give an idea of variability within the 5 different test sets, along with a mean value incorporating each fifth.
| Classifiers | Testing accuracies (mean ± standard deviation, in %) | |
|---|---|---|
| Brain | Skin | |
| PLS-DA | 96 ± 5 | 96 ± 4 |
| ANN | 99 | 86 ± 20 |
| LDA | 96 ± 5 | 96 ± 4 |
| LinearSVC | 94 ± 8 | 91 ± 12 |
| Logistic regression | 96 ± 5 | 91 ± 12 |
 | ||
| Fig. 4 Top: ROC plot for brain tissue using PLS-DA as the method of classification, with a mean area under curve of 0.96, indicating a predictive accuracy of 96%. Bottom: ROC plot for skin tissue using PLS-DA as the method of classification, also with a mean area under curve of 0.96, indicating a predictive accuracy of 96%. | ||
The repeatability within each test set, and within tissue type – brain or skin – shows that the most accurate method for classification is PLS-DA. At 96% for both brain and skin, it offers a highly accurate diagnostic test for the disease as the minipig model, so the next step is to use a human cohort to see if similar observations can be made, and if an earlier diagnosis can be made.
It is significant that we detect changes in the chemical composition of skin as a result of HD. This opens the possibility of a simple diagnostic test without the need to access the brain or require any tissue or body fluid to be taken from the patient. This means that mass screening would also be possible, and may also reveal other neurodegenerative diseases.
The accuracy could be further improved, in order to be able to detect the disease at an earlier stage. The Raman probe system used in this study has a low collection efficiency and relatively noisy detector, so produces spectra with a far lower signal to noise ratio than confocal Raman systems, so an optimised Raman system should be able to acquire spectra of superior quality than this study, along with a shorter acquisition time. A confocal system could not be used in practise, as it focusses a laser to a spot usually smaller than 0.01 mm, which results in laser intensities of the order 105 W cm−2 – enough to burn skin. There is a maximum safe exposure limit for laser intensity of 296 mW cm−2 for human skin using 785 nm. This means that the laser needs to illuminate over ∼1 cm2 for good signal levels and acceptable acquisition times for patients. Some Raman techniques can be used over such large areas, as alternatives to confocal systems, and these are discussed in a review paper.42
Conclusion
We investigated brain and skin tissue from minipigs with the Huntingtin gene as a model of Huntington's disease, and observed clear differences in Raman spectra between diseased and wild type animals. Although the assignment of changes to chemical composition is not linked to a simple signal of protein aggregation, differences in chemical composition were clear and repeatable enough to give an accuracy in PLS-DA classification of 96% for brain tissue and 96% for skin. These values suggest that Raman spectroscopy, coupled with machine learning, is suitable for in vivo diagnostics on humans for rapid and accurate diagnosis of Huntington's disease, and likely other neurodegenerative diseases, without any need for a brain biopsy or even a blood sample to be taken.Data availability
Data is available here: https://doi.org/10.7488/ds/3842.Conflicts of interest
No conflicts of interest.Acknowledgements
We would like to acknowledge Vlastimil Sršen from the University of Edinburgh for fostering collaboration, and Mario Kerst and Thomas Johann Tewes from the Rhine Waal University of Applied Sciences for improvements to baseline subtraction.References
- L. Spinney, Uncovering the true prevalence of Huntington's disease, Lancet Neurol., 2010, 9(8), 760–761, DOI:10.1016/S1474-4422(10)70160-5.
- F. O. Walker, Huntington's disease, Lancet, 2007, 369(9557), 218–228, DOI:10.1016/S0140-6736(07)60111-1.
- A. Esteban, D. Mateo and S. Giménez-Roldán, Early detection of Huntington's disease. Blink reflex and levodopa load in presymptomatic and incipient subjects, J. Neurol., Neurosurg. Psychiatry, 1981, 44(1), 43, DOI:10.1136/jnnp.44.1.43.
- N. Mahant, E. A. McCusker, K. Byth and S. Graham, Huntington's disease: clinical correlates of disability and progression, Neurology, 2003, 61(8), 1085–1092, DOI:10.1212/01.wnl.0000086373.32347.16.
- D. Craufurd, J. C. Thompson and J. S. Snowden, Behavioral changes in Huntington Disease, Neuropsychiatry neuropsychol. behav. neurol., 2001, 14(4), 219–226 CAS.
- D. C. Rubinsztein and J. Carmichael, Huntington's disease: molecular basis of neurodegeneration, Expert Rev. Mol. Med., 2003, 5(20), 1–21, DOI:10.1017/s1462399403006549.
- K. Kong, C. Kendall, N. Stone and I. Notingher, Raman spectroscopy for medical diagnostics—From in-vitro biofluid assays to in-vivo cancer detection, Adv. Drug Delivery Rev., 2015, 89, 121–134, DOI:10.1016/j.addr.2015.03.009.
- D. I. Ellis, D. P. Cowcher, L. Ashton, S. O'Hagan and R. Goodacre, Illuminating disease and enlightening biomedicine: Raman spectroscopy as a diagnostic tool, Analyst, 2013, 138(14), 3871–3884, 10.1039/C3AN00698K.
- G. W. Auner, et al., Applications of Raman spectroscopy in cancer diagnosis, Cancer Metastasis Rev., 2018, 37(4), 691–717, DOI:10.1007/s10555-018-9770-9.
- J. Zhang, et al., Accuracy of Raman spectroscopy in differentiating brain tumor from normal brain tissue, Oncotarget, 2017, 8(22), 36824–36831, DOI:10.18632/oncotarget.15975.
- A. Huefner, W.-L. Kuan, S. L. Mason, S. Mahajan and R. A. Barker, Serum Raman spectroscopy as a diagnostic tool in patients with Huntington's disease, Chem. Sci., 2020, 11(2), 525–533, 10.1039/C9SC03711J.
- D. Tsikritsis, A. Elfick and A. Downes, Raman spectroscopy of fibroblast cells from a Huntington's disease patient, Spectrosc. Lett., 2016, 49(8), 535–541, DOI:10.1080/00387010.2016.1213751.
- G. Devitt, K. Howard, A. Mudher and S. Mahajan, Raman Spectroscopy: An Emerging Tool in Neurodegenerative Disease Research and Diagnosis, ACS Chem. Neurosci., 2018, 9(3), 404–420, DOI:10.1021/acschemneuro.7b00413.
- A. Gualerzi, et al., Raman profiling of circulating extracellular vesicles for the stratification of Parkinson's patients, Nanomed. Nanotechnol. Biol. Med., 2019, 22, 102097, DOI:10.1016/j.nano.2019.102097.
- E. Ryzhikova, et al., Raman spectroscopy of blood serum for Alzheimer's disease diagnostics: specificity relative to other types of dementia, J. Biophot., 2015, 8(7), 584–596, DOI:10.1002/jbio.201400060.
- E. Ryzhikova, et al., Multivariate Statistical Analysis of Surface Enhanced Raman Spectra of Human Serum for Alzheimer’s Disease Diagnosis, Appl. Sci., 2019, 9(16), 3256, DOI:10.3390/app9163256.
- M. Paraskevaidi, et al., Raman Spectroscopy to Diagnose Alzheimer's Disease and Dementia with Lewy Bodies in Blood, ACS Chem. Neurosci., 2018, 9(11), 2786–2794, DOI:10.1021/acschemneuro.8b00198.
- E. Ryzhikova, et al., Raman spectroscopy and machine learning for biomedical applications: Alzheimer's disease diagnosis based on the analysis of cerebrospinal fluid, Spectrochim. Acta, Part A, 2021, 248, 119188, DOI:10.1016/j.saa.2020.119188.
- C. Stiebing, et al., Biochemical Characterization of Mouse Retina of an Alzheimer's Disease Model by Raman Spectroscopy, ACS Chem. Neurosci., 2020, 11(20), 3301–3308, DOI:10.1021/acschemneuro.0c00420.
- C. Carlomagno, et al., Identification of the Raman Salivary Fingerprint of Parkinson’s Disease Through the Spectroscopic– Computational Combinatory Approach, Front. Neurosci., 2021, 15, 704963, DOI:10.3389/fnins.2021.704963.
- F. Niccolini and M. Politis, Neuroimaging in Huntington's disease, World. J. Radiol., 2014, 6(6), 301–312, DOI:10.4329/wjr.v6.i6.301.
- M. Baxa, et al., A transgenic minipig model of Huntington's Disease, J. Huntington's Dis., 2013, 2(1), 47–68, DOI:10.3233/jhd-130001.
- T. Ardan, et al., Transgenic minipig model of Huntington’s disease exhibiting gradually progressing neurodegeneration, Dis. Models Mech., 2019, 13(2), dmm041319, DOI:10.1242/dmm.041319.
- K. S. Tipatet, et al., Detection of acquired radioresistance in breast cancer cell lines using Raman spectroscopy and machine learning, Analyst, 2021, 146(11), 3709–3716, 10.1039/d1an00387a.
- A. C. S. Talari, Z. Movasaghi, S. Rehman and I. u. Rehman, Raman Spectroscopy of Biological Tissues, Appl. Spectrosc. Rev., 2015, 50(1), 46–111, DOI:10.1080/05704928.2014.923902.
- A. Moreno-García, A. Kun, O. Calero, M. Medina and M. Calero, An Overview of the Role of Lipofuscin in Age-Related Neurodegeneration, Front. Neurosci., 2018, 12, 464, DOI:10.3389/fnins.2018.00464.
- R. Vlamings, et al., Lessons Learned from the Transgenic Huntington's Disease Rats, Neural Plast., 2012, 2012, 682712, DOI:10.1155/2012/682712.
- A. Messer and J. Plummer, Accumulating autofluorescent material as a marker for early changes in the spinal cord of the Mnd mouse, Neuromuscular Disord., 1993, 3(2), 129–134, DOI:10.1016/0960-8966(93)90004-4.
- J. Desroches, et al., Characterization of a Raman spectroscopy probe system for intraoperative brain tissue classification, Biomed. Opt. Express, 2015, 6(7), 2380–2397, DOI:10.1364/boe.6.002380.
- A. Mizuno, H. Kitajima, K. Kawauchi, S. Muraishi and Y. Ozaki, Near-infrared Fourier transform Raman spectroscopic study of human brain tissues and tumours, J. Raman Spectrosc., 1994, 25(1), 25–29, DOI:10.1002/jrs.1250250105.
- N. Amharref, et al., Discriminating healthy from tumor and necrosis tissue in rat brain tissue samples by Raman spectral imaging, Biochim. Biophys. Acta, Biomembr., 2007, 1768(10), 2605–2615, DOI:10.1016/j.bbamem.2007.06.032.
- I. Tellez-Nagel, A. B. Johnson and R. D. Terry, Studies on Brain Biopsies of Patients with Huntington's Chorea, J. Neuropathol. Exp. Neurol., 1974, 33(2), 308–332, DOI:10.1097/00005072-197404000-00008.
- H. Braak and E. Braak, Allocortical involvement in Huntington's disease, Neuropathol. Appl. Neurobiol., 1992, 18(6), 539–547, DOI:10.1111/j.1365-2990.1992.tb00824.x.
- J. P. Vonsattel and M. DiFiglia, Huntington disease, J. Neuropathol. Exp. Neurol., 1998, 57(5), 369–384, DOI:10.1097/00005072-199805000-00001.
- H. Lui, J. Zhao, D. McLean and H. Zeng, Real-time Raman spectroscopy for in vivo skin cancer diagnosis, Cancer Res., 2012, 72(10), 2491–2500, DOI:10.1158/0008-5472.can-11-4061.
- P. J. Caspers, G. W. Lucassen, R. Wolthuis, H. A. Bruining and G. J. Puppels, In vitro and in vivo Raman spectroscopy of human skin, Biospectroscopy, 1998, 4(S5), S31, DOI:10.1002/(SICI)1520-6343(1998)4:5+<S31::AID-BSPY4>3.0.CO;2-M.
- L. P. Rangaraju, G. Kunapuli, D. Every, O. D. Ayala, P. Ganapathy and A. Mahadevan-Jansen, Classification of burn injury using Raman spectroscopy and optical coherence tomography: An ex-vivo study on porcine skin, Burns, 2019, 45(3), 659–670, DOI:10.1016/j.burns.2018.10.007.
- N. Huang, et al., Full range characterization of the Raman spectra of organs in a murine model, Opt. Express, 2011, 19(23), 22892–22909, DOI:10.1364/OE.19.022892.
- H. Ye, et al., Burn-related Collagen Conformational Changes in ex vivo Porcine Skin using Raman Spectroscopy, Sci. Rep., 2019, 9(1), 19138, DOI:10.1038/s41598-019-55012-1.
- B. R. Wood and D. McNaughton, Raman excitation wavelength investigation of single red blood cells in vivo, J. Raman Spectrosc., 2002, 33(7), 517–523, DOI:10.1002/jrs.870.
- H. Zhiwei, M. D. Harvey Lui, X. K. C. Michael, M. D. Abdulmajeed Alajlan, I. M. M. D. David and Z. Haishan, Raman spectroscopy of in vivo cutaneous melanin, J. Biomed. Opt., 2004, 9(6), 1198–1205, DOI:10.1117/1.1805553.
- A. Downes, Wide area Raman spectroscopy, Appl. Spectrosc. Rev., 2019, 54(5), 445–456, DOI:10.1080/05704928.2019.1576190.
Footnote |
| † Electronic supplementary information (ESI) available. See DOI: https://doi.org/10.1039/d3ay00970j |
| This journal is © The Royal Society of Chemistry 2024 |