
 Open Access Article
 This Open Access Article is licensed under a Creative Commons Attribution-Non Commercial 3.0 Unported Licence
Polymer bead size revealed via neural network analysis of single-entity electrochemical data†
Gabriel
Gemadzie
,
Baosen
Zhang
and
Aliaksei
Boika
 *
*
Department of Chemistry, The University of Akron, Akron, OH 44325, USA. E-mail: aboika@uakron.edu
First published on 8th July 2024
Abstract
Single-entity electrochemistry methods for detecting polymer microbeads offer a promising approach to analyzing microplastics. However, conventional methods for determining microparticle size face challenges due to non-uniform current distribution across the surface of a sensing disk microelectrode. In this study, we demonstrate the utility of neural network (NN) analysis for extracting the size information from single-entity electrochemical data (current steps). We developed fully connected regression NN models capable of predicting microparticle radii based on experimental parameters and current–time data. Once trained, the models provide near-real-time predictions with good accuracy for microparticles of the same size, as well as the average size of two different-sized microparticles in solution. Potential future applications include analyzing various bioparticles, such as viruses and bacteria of different sizes and shapes.
Introduction
Blocking of flux of redox species as a means for detection of individual analytes at ultralow concentrations has been exploited in the field of single entity electrochemistry (SEE).1–4 A wide range of entities, particularly synthetic polymer materials like polystyrene microbeads,3–5 graphene microplatelets,6 carbon nanotubes,7 and also natural biological targets like bacteria,8 DNA, proteins and viruses9 are just a few examples of analytes detected with the electrochemical blocking collision technique. SEE allows for one-at-a-time detection and evaluation of single entities of these targets of interest. Besides blocking, other detection techniques may be used in the analysis of similar entities in solution, and the choice of technique depends on the characteristics of such particles. For example, bacteria, proteins, or polymer-based microbeads may either be detected via electrochemical blocking collision or by labeling the target with an electrochemically active material.10The above examples of blocking SEE measurements also illustrate the challenges with this approach, primarily the inability to extract the exact size of the analyte due to the “edge effect”. This is so since the magnitude of blocking current steps varies with the landing position of particles on the electrode surface (steps are much larger if particles land at the edge of the disk electrode vs. its center).4,11 While the use of a hemispherical electrode geometry can effectively eliminate this problem,5 the preparation and use of such electrodes presents another obstacle to overcome, particularly since one is limited to using mercury as the electrode material. At the same time, a theoretical approach based on the concept of average current step magnitude offers a potential solution to the mentioned challenges, yet it is relatively time-consuming.12 Here, we propose a novel approach for analysis of blocking collision data, which is based on the use of deep learning, specifically neural network (NN) models. This approach can provide information about the analyte shortly after the experiment is completed. Currently, our focus is on the size of the analyte, i.e., polymer beads. However, this approach is general and could be extended to other potential analytes, including bacteria and viruses of various shapes.
Experimental
Materials and instrumentation
The microspheres used in the blocking experiments were commercially available aqueous suspensions of carboxylated polystyrene (0.99 μm and 2.19 μm mean diameter), all purchased from Bangs Laboratories, Inc. (catalogue numbers PC04N and PC05001N, respectively). The spheres, as supplied, were diluted to required concentrations and used without any chemical pre-treatment. The redox species used in the electrochemical cell was ferrocenemethanol (FcCH2OH) purchased from Sigma-Aldrich (St Louis, MO) and the supporting electrolyte was potassium nitrate also purchased from Sigma-Aldrich. All solutions were prepared with Nanopure water from a Milli-Q Integral 5 purification system (Millipore, Bedford, MA) and sonicated for at least twenty-five minutes using a VWR Symphony bath sonicator (VWR International Radnor, PA). After sonication, the solution was filtered using a 3 mL latex free sterile syringe with a 0.02 μm pore size Whatman sterile inorganic membrane filter purchased from Whatman Inc. (Florham Park, NJ). A Pt disk microelectrode was fabricated by sealing a 10 μm diameter Pt wire purchased from Alfa Aesar (Ward Hill, MA) in a borosilicate capillary purchased from World Precision Instruments (Sarasota, FL). A connection was made using a copper wire with solder and heat. The electrode was polished using 1200 Grit MicroCutTM discs from Buehler (Lake Bluff, IL) and the desired mirror-like polishing was achieved using a solution of 0.3 mm alumina micropolish powder purchased from CH Instruments Inc. (Austin, TX).Electrochemical data were collected using a CHI760E potentiostat purchased from CH Instruments, Inc. (Austin, TX).
Experimental procedure
The experimental setup consisted of a three-electrode electrochemical cell with a 10 μm diameter Pt disk working electrode, a Pt wire (0.3 mm diameter) auxiliary electrode and a KCl(2 M)Ag|AgCl reference electrode. Chronoamperometry was performed with the working electrode potential set at +0.5 V vs. Ag|AgCl. The working electrode was cleaned with Nanopure water and observed under the microscope to ensure no particles were adsorbed on the surface before introduced into the electrochemical cell. Prior to filling the cell with the redox solution, it was filtered as mentioned above to ensure any collisions observed were due to the polystyrene microspheres introduced and not from any undesirable particles. The polystyrene microspheres stock supplied was diluted with Nanopure water to achieve the desired concentration when injected into the electrochemical cell. Firstly, chronoamperograms were recorded for 200 s and 100 s for cases 1 and 2 respectively (Fig. S1 and S2 in the ESI†) and no blocking collision current steps were observed for all the experiments before the introduction of the microspheres. The diluted microspheres were then injected into the electrochemical cell via a pipette. The cell content was shaken for approximately 15 s and made to sit for approximately 60 s to ensure uniform distribution of spheres in the cell. Two different microsphere size solutions of the same concentration were prepared. Individual separate experiments were performed with each sample before finally combining two specific samples (PC04N and PC05001N) in the same cell. Different chronoamperograms were recorded for different times (to obtain sufficient number of reproducible collisions), rinsing, and cleaning the working electrode with Nanopure water after each run. From these chronoamperograms (Fig. S3–S5†), blocking collision steps with their relative times were obtained and analyzed (Tables S1 and S2†); the procedure for extracting the blocking currents is described in the ESI as well (Fig. S6–S9†).Theory
Neural network model
The architecture of a neural network (NN) utilized in this work is known as a “sequential fully connected model” (Fig. 1).13 | ||
| Fig. 1 Architecture of a fully connected NN model. Input feature vector x (n × 1 dimension) is followed by an (m × 1) matrix of hidden neurons, and the output (k × 1) vector y. w represent weights, b – biases, and f – activation function (all hidden layers except the last one, which could be a linear activation function for a regression model, or softmax for a classification model). | ||
It is comprised of layers, including an input layer, hidden layer(s), and an output layer, each consisting of individual “cells” or “neurons”. A neuron is the fundamental unit of the network, responsible for performing operations on data, such as input, output, and various mathematical operations. Additionally, each neuron in this network is fully connected, meaning it interacts with each neuron in the subsequent layer through mathematical operations. The input layer is made up of “feature” neurons, which input the data, or features, to the network for processing. These data are then subjected to mathematical operations in the neurons of the hidden layer(s) (one or multiple). The output layer neurons output the results of these calculations, which form the prediction of the model. Detailed explanations of neural network operation can be found in various textbooks and are outside the scope of this publication.13,14
Results and discussion
Training of NN models
The development of a neural network model begins with a training phase. In the context of supervised learning, this stage involves comparing the model's predictions to known data (labels) and adjusting the weights and biases of the neurons in the hidden layers to minimize discrepancies between the predicted outputs and the labels. The expertise of an individual is required to provide the neural network with the training data and correct labels, to ensure proper weights and biases are learned. Once the training process is completed, the network can be utilized to analyse new data and make predictions.Prior to training, the number of feature neurons (input), hidden and output neurons are selected, and the labelled training data are either obtained experimentally or created theoretically (synthetic dataset). These steps are described first, followed by the evaluation of the NN performance and the actual predictions.
Feature selection and output layer
Previous findings from our laboratory revealed that the average current step magnitude in blocking collisions is consistent with the size of the analyte particle, as long as the average is calculated from the values in the initial part of a collision i–t curve (thereby eliminating the possibility of a multilayer formation).12 Furthermore, as shown before (Fig. 3 in the same paper),12 the largest values of the current steps on a distribution histogram are indicative of particle collisions at the edge of the detector electrode. Therefore, for the features of the NN architecture, we selected (1) the maximum current step magnitude in a set of 20 collisions, (2) the minimum and (3) the average current step magnitude, as well as (4) the diffusion coefficient of the redox mediator, (5) its bulk concentration, and (6) the radius of the working electrode. As a result, the number of input neurons is 6 (n = 6 in Fig. 1). The number of output neurons is one (k = 1), as we decided to develop a regression NN model that would output the radius of analyte particles based on the input of the aforementioned feature data.Data preparation and training/validation/test set
A significant number of data points are typically required for training a neural network, measured in tens of thousands. For instance, the training set for the task of recognizing a handwritten number using a NN utilizes ca. 60![[thin space (1/6-em)]](https://www.rsc.org/images/entities/char_2009.gif) 000 images.15 The collection of such a large number of training data points can be a time-consuming and challenging task if done manually via experiments. However, a workaround could be achieved if one uses a synthetic training dataset, i.e., the one created by an expert, via an automated process, and representative of the real-world data. In this work, we generated a synthetic training set using a Python script (included in the ESI†) based on our previously published work, which showed an agreement between the theoretical and experimental data to within 8%.12 In the future, we expect that including more experimental data into the training dataset would improve the developed here models in terms of their accuracy.
000 images.15 The collection of such a large number of training data points can be a time-consuming and challenging task if done manually via experiments. However, a workaround could be achieved if one uses a synthetic training dataset, i.e., the one created by an expert, via an automated process, and representative of the real-world data. In this work, we generated a synthetic training set using a Python script (included in the ESI†) based on our previously published work, which showed an agreement between the theoretical and experimental data to within 8%.12 In the future, we expect that including more experimental data into the training dataset would improve the developed here models in terms of their accuracy.
The script generates a predetermined number (20) of blocking collision current steps, calculates their maximum and minimum values, as well as the average of the current steps, and packages these data together with the diffusion coefficient, redox mediator concentration, and the radius of the electrode into a training dataset. Each row of this dataset matrix contains values for the six features described above, as well as a label (particle radius). In total, the training dataset consisted of 74250 rows of data (10% of it were used later as a validation set) obtained for three distinct diffusion coefficient values (ranging between 0.5 and 2 × 10⁻⁹ m2 s−1), three values of the bulk concentration of the mediator (ranging between 1 and 10 mM), eleven different analyte particle radii (ranging between 25 nm and 0.5 micron), and three different electrode radii (ranging between 1 and 5 micron). For each unique combination of these features, we obtained 250 different sets of collision current steps (resulting in the total of 74250 rows of the data). We believe this to be a sufficient number of data points to capture the random nature of collisions that our NN model needs to evaluate.
In generating the training set, we assumed that the particle landing positions are normally distributed with respect to the electrode's edge. This assumption is based on the fact that, due to the edge effect, the flux of the redox mediator and, therefore, the local electric field, are much higher at the edge of the disk electrode, resulting in a bigger likelihood of particles colliding at the edge than at any other location on the electrode surface. This assumption also aligns with the results of our previous experiments that show greater accumulation of particles near the edge of the electrode, as well as the works of others in the field.4,11
The training input data needs to be normalized to avoid either very high or very low values, which could negatively impact the learning process. In this work, we normalized the diffusion coefficient values by 10−9 m2 s−1, electrode radius by 10−6 m, and the current step values (maximum, minimum, and average) by the value of the steady-state current at the disk electrode multiplied by 103. The concentration of the redox mediator was not normalized but expressed in mM units. The labels (particle radii) were normalized by 10−6 m.
Before training the NN model, we generated an additional dataset (14850 rows) for testing. Thus, the data split was 75–8.3–16.7% into the training, validation, and test datasets. This ensured that the model performance was evaluated on those data points (test set) that were not used for training the model.
NN training and initial performance
The initial NN architecture included 1 hidden layer with 30 neurons in it. As the activation function for the hidden-layer neurons, we selected the ‘relu’ function, and we chose the learning rate to be 0.003 (in many neural network training processes, initial learning rates are often set between 0.001 and 0.01). We utilized 100 epochs for optimization (i.e., training, or finding optimized weights and biases), and chose the stochastic gradient descent (SGD) optimizer for that.13 To evaluate the NN performance, the chosen loss function was the mean squared error. We also used a validation set to evaluate the NN performance and compare it to the performance on the training set. This is typically done to check for overfitting of the model to the training data; the results are shown in Fig. S10.† The decrease in the mean squared error with each epoch and the good agreement between performances on the training and validation data sets indicate a good performance of the chosen NN architecture, while the loss on a test dataset was 5.56 × 10⁻⁴. The complete code for the NN models is provided in the ESI.†Optimizing hidden layer structure
As the next step, we decided to improve the neural network architecture through the search for the optimized number of hidden layers and the number of neurons in each of them, as well as the learning rate. We employed the RandomizedSearchCV method from the ‘sklearn’ package that performs randomized search over the chosen hyperparameters.13 Based on it (see the code in the ESI†), we identified the following as the best neural network architecture: 3 hidden layers with 91 neurons in each, and the learning rate 0.01. As a result, the accuracy of the model's predictions improved (the loss on the test dataset decreased to 1.5 × 10⁻⁴). In addition, we have investigated a similar NN architecture, which consisted of 5 hidden layers, 60 neurons each, and the learning rate 0.005; we ran the training for 200 epochs though, vs. 100 in model I (Table 1). The results showed a good agreement between the models (the loss on the test dataset was 1.2 × 10⁻⁴ for the NN model II) and demonstrated effective learning by the NNs as expressed by the accuracy of predictions, or inference (discussed next). The comparison between the training and validation losses during training of NN model II is shown in Fig. 2. | ||
| Fig. 2 Comparison of training and validation losses for a NN model II consisting of 60 neurons in each of 5 hidden layers. The training was done for 200 epochs and the learning rate was 0.005 (Table 1). | ||
| Case study (no. of collisions) | Neural net and train parameters I | Prediction | % Error | Neural net and train parameters II | Prediction | % Error |
|---|---|---|---|---|---|---|
| Case 1: 0.495 μm particle (20) | 3 hidden layers, 91 neuron each, learning rate 0.01, 100 epochs | 0.376 μm | −24% | 5 hidden layers, 60 neurons each, learning rate 0.005, 200 epochs | 0.394 μm | −20% |
| Case 2: 0.495 μm particle (18) | 0.565 μm | 14% | 0.505 μm | 2.0% | ||
| Case 3: mixture of 0.495 μm + 1.095 μm particles, 1:1 ratio, 0.795 μm average (20) |
0.741 μm | −6.8% | 0.709 μm | −11% |
NN predictions on experimental data
To demonstrate the performance of the developed neural network models, we compared the model predictions to the experimental results in blind studies. One of us (GG) recorded the blocking collision i–t curves in experiments with different size analyte particles and provided the other (AB) with the blocking current step data (Table S1 in the ESI†) while withholding the information of the particle size used in each of the experimental data sets. The predictions of the neural network models I and II and the actual particle sizes were compared, and a good agreement between the two was observed (Table 1, cases 1 and 2). These findings confirm the accuracy of the developed neural network models and speak to their potential utility as an analytical tool.NN model for two particle sizes
Encouraged by the predictions of models on data for a single size of analyte particles (cases 1 and 2 in Table 1), we also investigated the possibility of predicting the size of two types of particles with different radii. Therefore, our initial thinking was to simply add an additional output for particle radius 2, and then train the model on the collision data for two particle sizes. However, we found out that, in this case, both outputs always showed the same values, which turned out to be the average of the radii of the two particle types (we used the same number of data points from each particle size datasets for the training, see procedure for data generation in the ESI†). Therefore, we decided to go ahead with the NN model with one output that we now call the average particle radius.We generated a new dataset where the average, minimum and maximum current data in each of the rows were obtained from ten values for particle 1 and ten values for particle 2. This dataset was split with about the same ratios (81.4–1.9–16.7%) and the NN models with otherwise the same architecture as in cases 1 and 2 were trained. The performance on the training and validation datasets is shown in Fig. S11,† and the loss on the test dataset was 3.8 × 10⁻⁴ for NN model II. For comparison to the real-world scenario, we collected the blocking collision i–t data in aqueous solutions containing the same concentration of particles of two different sizes, analyzed obtained data and prepared the prediction dataset (Table S2†). Our trained model then showed a prediction that was very close to the expected value, with the error −11% for NN model II (case 3 in Table 1).
Comparison of inference performance of NN models I and II (Table 1) could suggest that, once the total number of neurons in hidden layers is kept about the same (273 in model I and 300 in model II), there is little difference between the models’ behaviour even if the learning rate and the number of epochs are varied moderately. However, to further investigate the accuracy of the models, we have undertaken additional experiments and calculated mean prediction errors. These findings are discussed next.
Comparison of accuracy of NN models
To carefully determine the accuracy of predictions of models I and II, we collected additional experimental data and performed inference on it. These results are presented in Table S3 in the ESI.† Five independent blocking collision experiments were conducted, and the results were assembled in three sets of data to achieve about 20 collisions in each set (note that NN models were trained on batches of 20 collisions). An additional script was developed for inference tasks (see ESI†). Its code ensures that the same data scaling parameters are applied by the scaler to the data before inference. Thus, one can determine the accuracy of predictions by each of the models and calculate mean prediction errors. For NN model I, the mean prediction error was found to be −26.6%, and for model II, the error was −18.7%. These findings agree with the loss metrics of models’ performance on the test dataset discussed above, further suggesting that NN model II offers more accurate predictions compared to model I.Effect of distribution of particle landing positions
The big question remains regarding the sign of the error in predictions compared to the actual sizes of the particles. The data in Table S3,† as well as Table 1, show that the predictions are typically lower than the actual size of particles, i.e., the models seem to underestimate particle size. The discrepancy could be due to the effect of randomness in particle landing positions on the maximum, minimum and, therefore, average values of the observed blocking current steps (case 2 in Table 1). However, a more plausible explanation could be that our initial assumption of a Gaussian (normal) distribution of the particle landing positions with respect to the electrode disk edge could be at fault. Here, we briefly tested a possibility that the landing positions’ distribution could be skewed, either towards the centre of the disk, or away from it (towards the glass). Fig. 3 shows probability density functions (pdf), together with the sample histograms of the landing locations of particles, that were evaluated (pdfs and histograms of distributions skewed towards the disk not shown for clarity). In generating these we utilized a skew-normal random variable (skewnorm) from scipy.stats library, and the code is provided in the ESI.† The figure demonstrates how the skewness parameter ‘a’ affects the pdf shape and position of the particle landing distributions. As skewness increases, the peak of the distribution shifts and the pdf becomes more asymmetric.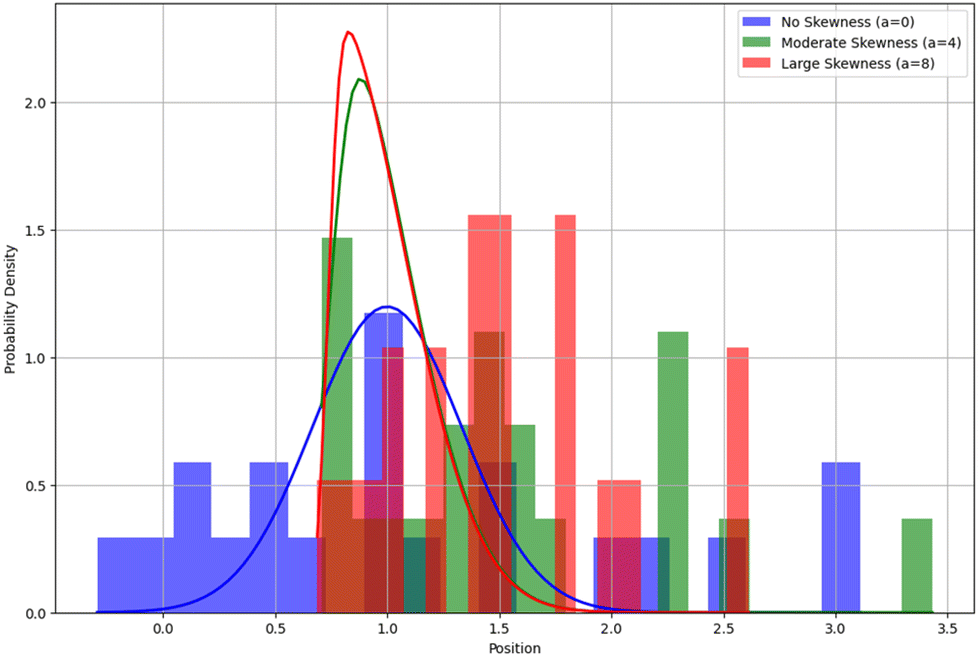 | ||
| Fig. 3 Effect of skewness parameter ‘a’ on histograms and pdfs of particle landing distributions. More positive value of ‘a’ results in more skewness towards the glass (position >1). Histogram and pdf for negative ‘a’ (skewness towards the disk, position <1) omitted for clarity. Histogram and pdf for a = 0 represent a Gaussian (normal) distribution of particle landing positions. | ||
We generated additional datasets for which we varied the skewness factor ‘a’ from negative (−4, suggesting preferential bead landing towards the electrode) to positive (4 and 8, suggesting preferential bead landing towards the glass), and retrained our models on the new datasets. We found that the prediction error either did not change substantially (NN model I) or became even more negative (NN model II) as the skewness factor decreased from a = 0 (normal distribution) to a = −4 (Table S4†). However, prediction error became less negative when a = 4 and then further negative when a = 8 for both models. These findings suggest that the nature of the distribution of particle landing positions has an important effect on the accuracy of the proposed here models. Therefore, future experimental efforts are required to determine the exact nature of such distribution.
Conclusions
Presented here work demonstrates the first attempt to utilize the framework of deep learning, and in particular the NN sequential models, to evaluate the electrochemical data in SEE blocking collision experiments. The utility of the proposed approach lies in its ability to extract the particle size information without the need for changing the electrode geometry (disk vs. hemisphere). Once the model is trained, the prediction takes less than a second; in fact, it takes longer to collect the experimental data than to analyse it. One can also envision that the presented here approach could be further integrated into the framework utilized in automatic data collection in electrochemical experiments (self-driving labs).Good accuracy of the developed models (with NN model II mean prediction error less than that for model I) speaks to their sufficient generalization capabilities within the settings most frequently encountered in blocking collision experiments. However, one needs to be aware of the limitations stemming from the conditions of the model training, i.e., geometry of an electrode (disk) and a particle (sphere). In addition, the models were trained from sets of data of 20 collisions, i.e., if determination of the maximum, minimum and average current step height is performed from either too few or too many collisions, the discrepancy between the predicted and true sizes is expected to be much larger. Moreover, the assumption of the distribution of particle landing positions has an important effect that needs to be evaluated experimentally. Also, for mixtures of particles of different sizes, the models are expected to predict the average size of particles, yet these results are preliminary and would require further validation. Overall, further addition of experimental blocking SEE data to the training dataset is expected to improve the accuracy of the trained models. Therefore, we are open to collaboration with the wider electrochemical community to work together on this goal. We also believe that in the future this methodology could be extended to analytes of different shapes, i.e., bacteria such as E. coli, and viral particles.
Author contributions
GG performed all experiments. BZ developed the code for blocking current step height extraction from i–t data. AB developed all the code for dataset generation and training of NN models. All authors tested the code. All authors contributed to writing of the manuscript.Data availability
ESI† is available including the details of experiments, comparison of training and validation losses for NN models, as well as the Python code of developed models. All the code and the datasets are available also on GitHub at the Boika Lab repositories (https://github.com/Boika-Lab/Blocking-collisions-NN-models and https://github.com/Boika-Lab/read-step-heights).Conflicts of interest
There are no conflicts to declare.Acknowledgements
The authors acknowledge continued support from the University of Akron and affiliated organizations such as Faculty Research Council (FRC), University of Akron Research Foundation (UARF), as well as NSF I-corps program.References
- L. A. Baker, J. Am. Chem. Soc., 2018, 140, 15549–15559 CrossRef CAS PubMed.
- Z. Deng and C. Renault, Curr. Opin. Electrochem., 2021, 25, 100619 CrossRef CAS.
- B. M. Quinn, P. G. van't Hof and S. G. Lemay, J. Am. Chem. Soc., 2004, 126, 8360–8361 CrossRef CAS PubMed.
- A. Boika, S. N. Thorgaard and A. J. Bard, J. Phys. Chem. B, 2013, 117, 4371–4380 CrossRef CAS.
- Z. Deng, R. Elattar, F. Maroun and C. Renault, Anal. Chem., 2018, 90, 12923–12929 CrossRef CAS PubMed.
- A. D. Pendergast, C. Renault and J. E. Dick, Anal. Chem., 2021, 93, 2898–2906 CrossRef CAS.
- A. Kaliyaraj Selva Kumar and R. G. Compton, J. Phys. Chem. Lett., 2022, 13, 5557–5562 CrossRef CAS.
- J. Y. Lee, B.-K. Kim, M. Kang and J. H. Park, Sci. Rep., 2016, 6, 30022 CrossRef CAS.
- J. E. Dick, C. Renault and A. J. Bard, J. Am. Chem. Soc., 2015, 137, 8376–8379 CrossRef CAS.
- E. Laborda, A. Molina, C. Batchelor-McAuley and R. G. Compton, ChemElectroChem, 2018, 5, 410–417 CrossRef CAS.
- S. E. Fosdick, M. J. Anderson, E. G. Nettleton and R. M. Crooks, J. Am. Chem. Soc., 2013, 135, 5994–5997 CrossRef CAS PubMed.
- J. Bonezzi and A. Boika, Electrochim. Acta, 2017, 236, 252–259 CrossRef CAS.
- A. Géron, Hands-on machine learning with Scikit-Learn, Keras, and TensorFlow, O'Reilly Media, Inc., 2022 Search PubMed.
- T. Rashid, Make Your Own Neural Network, CreateSpace Independent Publishing Platform, 2016 Search PubMed.
- Y. Lecun, L. Bottou, Y. Bengio and P. Haffner, Proc. IEEE, 1998, 86, 2278–2324 CrossRef.
Footnote |
| † Electronic supplementary information (ESI) available: Experiments, comparison of training and validation losses for NN models, as well as the Python code of developed models. All the code, trained models and the datasets are available also on GitHub at the Boika Lab repositories (https://github.com/Boika-Lab/Blocking-collisions-NN-models and https://github.com/Boika-Lab/read-step-heights). See DOI: https://doi.org/10.1039/d4an00670d |
| This journal is © The Royal Society of Chemistry 2024 |