
 Open Access Article
 This Open Access Article is licensed under a
 Creative Commons Attribution 3.0 Unported Licence
Label-free visualization of unfolding and crosslinking mediated protein aggregation in nonenzymatically glycated proteins†
Darshan Chikkanayakanahalli
Mukunda
a,
Shaik
Basha
a,
Meagan Gail
D'Souza
a,
Subhash
Chandra
a,
K.
Ameera
a,
Weena
Stanley
b,
Nirmal
Mazumder
 a and
Krishna Kishore
Mahato
*a
a and
Krishna Kishore
Mahato
*a
aDepartment of Biophysics, Manipal School of Life Sciences, Manipal Academy of Higher Education, Manipal 576104, Karnataka, India. E-mail: kkmahato@gmail.com; mahato.kk@manipal.edu
bDepartment of Medicine, Kasturba Medical College, Manipal Academy of Higher Education, Manipal 576104, Karnataka, India
First published on 4th July 2024
Abstract
Nonenzymatic glycation (NEG) unfolds and crosslinks proteins, resulting in aggregation. Label-free evaluation of such structural changes, without disturbing molecular integrity, would be beneficial for understanding the fundamental mechanisms of protein aggregation. The current study demonstrates the assessment of NEG-induced protein aggregation by combining autofluorescence (AF) spectroscopy and imaging. The methylglyoxal (MG) induced protein unfolding and the formation of cross-linking advanced glycation end-products (AGEs) leading to aggregation were evaluated using deep-UV-induced-autofluorescence (dUV-AF) spectroscopy in proteins with distinct structural characteristics. Since the AGEs formed on proteins are fluorescent, the study demonstrated the possibility of autofluorescence imaging of NEG-induced protein aggregates. Autofluorescence spectroscopy can potentially reveal molecular alterations such as protein unfolding and cross-linking. In contrast, AGE-based autofluorescence imaging offers a means to visually explore the structural arrangement of aggregates, regardless of whether they are amyloid or non-amyloid in nature.
1. Introduction
Nonenzymatic glycation (NEG) can cause the unfolding and formation of intra or inter-molecular crosslinks in proteins, which can accelerate growth and the formation of protein aggregates.1,2 NEG-mediated protein aggregates are reported in diabetic patients’ islets of Langerhans and the brains of Alzheimer's disease patients.3 Additionally, the aggregates resulting from NEG are responsible for the development of neurodegenerative diseases (NDDs), such as Parkinson's disease (PD), amyotrophic lateral sclerosis (ALS), and multiple sclerosis.4 Furthermore, the formation of NEG-mediated amyloid-like lens crystallin aggregates causes the development and progression of cataracts and diabetic retinopathy.5NEG is a spontaneous process in which reducing sugars such as glucose and fructose and their reactive degradation products, such as methylglyoxal (MG), attach to the free amine groups of proteins.6 Arginine (Arg) and Lysine (Lys) are the two amino acid residues most prone to this reaction. The NEG of the proteins leads to the formation of advanced glycation end products (AGEs) in proteins2,7 that are significantly elevated in hyperglycemia.8 AGEs are categorized into four classes: (a) crosslinking non-fluorescent AGEs such as methylglyoxal-lysine dimer (MOLD); (b) non-crosslinking non-fluorescent AGEs (imidazolone and carboxymethyl-lysine); (c) non-crosslinking fluorescent AGEs (argpyramidine); and (d) crosslinking fluorescent AGEs (vesperlysine, pentosidine, and crossline). If AGEs can be detected, they will be an accurate biomarker for protein aggregation.1 Multiple techniques can detect AGEs, such as fluorescence coupled HPLC, mass spectrometry (MS), and immunotechniques (western blotting and ELISA).9,10 However, all these techniques have their merits and demerits. For example, HPLC and MS can detect and quantify only the AGEs but not the associated structural modifications in proteins. Also, the sample preparation and the data analysis in HPLC and MS are tedious tasks. In addition, the intricate and expensive instrumentation restricts their routine use for AGE detection. In the case of immunotechniques, only the non-specific detection of AGEs is possible using expensive antibodies with no differentiation between crosslinking and non-crosslinking AGEs.9,11 Furthermore, several studies report the detection of different fluorescent AGEs formed on proteins using multiple AGE specific excitation wavelengths in the near-UV (320, 340, and 370 nm) and blue (420 and 460 nm) regions of the electromagnetic spectrum.12,13 However, the excitation will not yield any associated structural information on NEG-modified proteins except for the detection of AGEs, similar to the other techniques discussed above.
When it comes to the fluorescence imaging of NEG-induced protein aggregates, every other study uses thioflavin-T (ThT) as the extrinsic fluorophore for visualizing the protein aggregates under a fluorescence microscope.7,14–17 Yet, it fails to bind the non-amyloid aggregates (amorphous aggregates).18 Also, one should note that fluorescent AGEs, such as crossline and Arg-derived AGEs, show blue light excitation similar to ThT. More interestingly, the emission spectra of AGEs such as vesperlysine and crossline overlap with the emission of ThT (λemission = ∼480 nm).13,15,16 Therefore, using ThT for AGE crosslinked proteins7,15,16,19 leads to a false positive result. Besides, ANS is also a widely used extrinsic fluorophore that can be used to image protein aggregates.18 Although ANS can bind to the hydrophobic clusters of partially unfolded proteins, it fails in proteins where the hydrophobic domains are buried, especially after aggregation owing to intermolecular protein–protein interaction.2,14
In contrast, dUV-AF is a simple, label-free technique with single excitation wavelength (285 nm). It can reveal the protein unfolding and detect AGEs with clear differentiation between crosslinking and non-crosslinking AGEs.20 In the case of NEG-modified proteins, the Tyrosine (Tyr) and Tryptophan (Trp) autofluorescence induced by deep-UV excitation can act as the primary energy source for exciting the fluorescent AGEs formed on the same protein, producing multiple AGE-specific fluorescent peaks.2,12 At the same time, imaging protein aggregates based on the intrinsic fluorescence of AGEs can overcome the drawbacks of other extrinsic fluorophores (ThT, ANS, DCFH, etc.) in the case of NEG. Finally, this technique can be expanded to investigate the mechanism of NEG-induced protein aggregation in lens-crystallin, α-synuclein, A-42, etc., involved in the aggregation-related pathogenesis.
2. Experimental section
2.1 Reagents
Human serum albumin (A9511-500 MG), Bovine haemoglobin (A2153-10G), Bovine serum albumin (A2153; ≥96%), and Lysozyme from chicken egg white (L6876-5G) were procured from Sigma-Aldrich (St Louis, MO, USA). RibonucleaseA (02101076-CF) was procured from MP Biomedicals (Santa Ana, United States). The aqueous solution of MG (RM2915) and the prestained protein ladder (MBT092-100LN) were purchased from Himedia (Mumbai, India).2. 2. Nonenzymatic glycation of HSA and Hb
Two sets of HSA, Hb, and Lysozyme (50 μM) dissolved in phosphate buffer (50 mM; pH −7.4) were separately incubated with increasing concentrations of methylglyoxal (0.05–20 mM) at 37 °C in the dark.21 One set of each protein was incubated for three days, and the other was incubated for 10 days (to generate protein aggregates). Native proteins were also incubated under the same conditions. All reaction mixtures were sterile-filtered before incubation.2.3. Deep-UV-induced-Autofluorescence (dUV-AF) spectral recording
An in-house developed dUV-AF device is shown in ESI Fig. S1.† A 285 nm low power (≈0.48 mW after collimation) light emitting diode (LED; M285L4, Thorlabs, USA) with a bandpass filter (Semrock, USA, FF01-280/20-25) was used to excite the glycated proteins. A high-resolution charge-coupled device (CCD) spectrometer (QEPro, Ocean Optics, Inc., USA) was used to record the autofluorescence spectra of glycated proteins.22 On the emission side, a 300 nm long-pass filter (FF01-300/LP, Semrock, USA) was used to block the excitation light from the LED, allowing only the autofluorescence spectra of glycated proteins. The glycated protein samples (incubated for three days) were loaded into an in-house designed quartz multi-well plate (with 36 quartz wells), and the dUV-AF spectra were then recorded at room temperature (25 °C).2.4. Spectral processing
The spectra were processed and analysed using Spectragryph v1.2.16.1 (Germany) software.23 Each spectrum's region of interest (ROI) was selected, ranging from 300 to 600 nm. Next, unity-based normalization was applied to the spectra without baseline correction. The fluorescence peaks were identified with the help of the software.2.5. Autofluorescence (AF) imaging of aggregates
Based on the fluorescence emission of AGEs formed on proteins, the aggregates were visualized using an inverted fluorescence microscope (CKX53, Olympus) with 10× and 20× magnification, where the samples were excited using UV light. Since the fluorescence emission of AGEs spans across the spectral range from near UV (∼360 nm) to red (>600 nm), the AGE crosslinked aggregates can be visualized with blue, green, and red emission filters.2.6. AGE-specific fluorescence spectroscopy
The fluorescent peaks specific to crosslinking AGEs produced by 285 nm excitation were cross-verified by exciting the nonenzymatically glycated protein samples with AGE-specific excitation wavelengths24 (Table 1) using a Varioskan Flash multimode spectral reader (ThermoFisher Scientific, USA).| Sl. No. | AGEs | Excitation maxima (λex) | Emission maxima (λem) |
|---|---|---|---|
| 1 | Pentosidine | ∼320 nm | 380–390 nm |
| 4 | Vesperlysine A/B | ∼370 nm | ∼440 nm |
| 5 | Crossline | ∼420 nm | ∼480 nm |
2.7. Polyacrylamide gel electrophoresis (PAGE)
Sodium dodecyl sulfate (SDS)–polyacrylamide gel electrophoresis (PAGE) was performed26 for glycated lysozyme. Reducing sample buffer containing SDS, Glycerol, β-mercaptoethanol, 0.125 mM Tris–HCl buffer (pH -6.8), and Bromophenol blue was added to lysozyme samples (incubated with varied concentrations of methylglyoxal for 3 days) and loaded onto individual lanes of the 10% polyacrylamide gel. Molecular weight standards (245–11 kDa) were used to monitor the electrophoretic mobility of methylglyoxal-modified proteins (incubated for three days). After electrophoresis, the gel was stained with 0.25% Coomassie Brilliant Blue R-250.2.8. Scanning electron microscopy (SEM)
SEM imaging was performed using a JEOL-IT300LV (JEOL, Ltd, Tokyo, Japan) at room temperature (25 °C). The aggregates were attached to carbon tape on an aluminium stub and subjected to gold sputtering followed by imaging.272.9. Fourier transform infrared (FTIR) spectroscopy analysis
Lyophilized samples of both HSA and Hb were measured using single reflection diamond ATR (attenuated total reflectance) of an FT/IR-4X FTIR spectrometer (JASCO, Ltd, Tokyo, Japan) equipped with an MCT (mercury cadmium and telluride) detector. The background spectrum was subtracted to get a spectrum with a significant signal-to-noise ratio. The FTIR spectra of lyophilized protein were recorded over a spectral region from 600 to 4000 cm−1.3. Results and discussion
The normalized dUV-AF spectra of nonenzymatically glycated HSA and Hb are shown in Fig. 1a–r. Native HSA and Hb both show peaks at ∼320 nm and ∼340 nm, respectively, which represent Trp and Tyr (Fig. 1a). Hb has a higher Trp to Tyr (Trp/Tyr; 6/10) ratio than HSA (Trp/Tyr; 1/18). Therefore, the maximum Fluorescence Resonance Energy Transfer (FRET) from Tyr to Trp residues22,28 makes the Tyr-specific peak weakly visible in the dUV-AF spectra of Hb compared to HSA.28 Also, irrespective of the donor (Tyr) and acceptor (Trp) numbers, the proteins produce either resolved or unresolved dUV-AF spectra,29 which can be attributed to the different discrete states (or classes) and spatial arrangement of Trp residues in proteins that determine their spectral shapes and emission maxima.30 However, the more resolved peaks of Tyr and Trp in HSA help in assessing the unfolding through the Tyr/Trp intensity ratio31 (Fig. 2), i.e., the relative intensity ratio of Tyr/Trp for native HSA was 0.971 ± 0.0025, which increased to 3.786 ± 0.060 with 20 mM methylglyoxal treatment (Fig. 2). In the case of unfolded HSA, the Tyr energy is preserved, and its fluorescence peak becomes more pronounced in unfolded proteins because the increasing average distance between Tyr and Trp residues lowers the resonance energy transfer.32 The unfolding of HSA was also confirmed by measuring the photometric absorbance at 280 nm (ESI Fig. S2a†), where the absorbance at ∼280 nm was found to regularly increase with an increasing concentration of methylglyoxal due to the solvent exposure of Tyr residues upon protein unfolding.13,32 Curiously, we glycated BSA, a protein structurally akin to HSA. The native form showed unresolved dUV-AF spectra (ESI Fig. S3†). Yet, with the rising concentration of methylglyoxal, a shoulder peak at ∼320 nm emerged, indicative of Tyr (ESI Fig. S3†), implying the resonance energy transfer from Tyr to Trp was affected due to protein unfolding followed by increasing inter-residue distance. Furthermore, to probe the relative increase in Tyr intensity due to methylglyoxal-induced protein unfolding, we chose RibonucleaseA (RNaseA), a small protein (∼13.5 kDa) containing only Tyr residues (6 in number).33 Fig. S4 of the ESI† represents the dUV-AF spectra of methylglyoxal-treated RNaseA. At 0.05 mM methylglyoxal treatment, the intensity at ∼315 nm (corresponding to Tyr) showed a ∼1.30-fold increase compared to the native RNaseA despite the resonance energy transfer from Tyr to AGEs formed on RNaseA. The intensity at ∼315 nm steadily decreased as the methylglyoxal concentration was raised. This was attributed to the enhanced formation of AGEs and the amplified resonance energy transfer from Tyr to AGEs. However, the intensity at ∼315 nm was greater than that of the native RNaseA with 0.1 and 0.2 mM methylglyoxal treatment. The photometric absorbance spectra of the native and methylglyoxal-modified RNaseA are shown in Fig. S2b of the ESI.† | ||
| Fig. 1 (a–r) The dUV-AF spectra of nonenzymatically glycated HSA and Hb. The emission peak positions for HSA and Hb are separately marked by blue and pink vertical dotted lines respectively, and their common emission peaks are marked with orange continous lines. | ||
 | ||
| Fig. 2 The increasing Tyr/Trp intensity ratio in HSA with increasing concentration of methylglyoxal. | ||
In addition, the emission maximum (λmax) of Hb at 0.1 mM methylglyoxal treatment exhibited a 14 nm red-shift (340 → 354 nm) (Fig. 1c). The unfolding of Hb exposing the hydrophobic domains and the Trp residues buried in the hydrophobic patches to the solvent can be the reason for this red-shift.34,35 At 0.4 mM methylglyoxal treatment, the λmax of Hb showed blue shift and returned to its native emission maxima (∼340 nm) (Fig. 1e) and remained the same until the 20 mM methylglyoxal treatment. The hydrophobic amino acids, particularly Trp, can be buried/shielded inside the protein after it self-assembles into the β-sheet structure.14 The shielding of Trp residues could lead to either only a decrease in their fluorescence intensity, as seen in the case of HSA and Hb (Fig 1a–r),36,37 or a blue-shift in their emission maxima36,38,39 as seen in Hb with the 0.4 mM methylglyoxal treatment. The NEG has been demonstrated to induce significant structural changes in proteins that compromise stability and cause unfolding and aggregation.40–43 Most importantly, the disulfide bridges in proteins treated with methylglyoxal are susceptible to fragmentation, leading to protein unfolding.44 The disulfide bond-cleaved unfolded protein chains can form compact, short-range-ordered β-sheets, followed by aggregation to form nanoscale β-sheet-rich amphiphilic oligomers without breaking any amide bonds in the protein backbone.45–47 Han et al., 2020 demonstrated that these nanoscale oligomers could generate submicrometric spherical products through hydrophobic interactions.48 Many of these amphiphilic oligomers formed in the bulk protein solution (>1 mg ml−1; 1.625 mg ml−1 in the current study) could aggregate to form protein films.45,46 In 2012, Peng Yang et al. also reported that the protein unfolding through cleavage of disulfide bonds could undergo amyloid-like aggregation at physiological pH for generating protein films.49
Interestingly, autofluorescence imaging of methylglyoxal-modified HSA and Hb (incubated for 10 days) showed the formation of protein films. Native HSA (Fig. 3a) did not exhibit the predisposition of aggregates because the majority of its sequence (>70%) is organized in α-helix structure, with subsequent tightening via intramolecular hydrogen bonds. The native Hb showed fluorescent granule-like aggregates (Fig. 3b), which could be attributed to converting pre-existing Amadori products into crosslinking AGEs (pentosidine, vesperlysine, or crossline) at 37 °C incubation. Similar dispersed granule-like aggregates in HSA were observed with the 0.4 mM methylglyoxal treatment (Fig. 3c). With the 0.6 mM methylglyoxal treatment, an appropriate aggregate of HSA could be observed (Fig. 3d). With a further increase in the methylglyoxal concentrations, HSA demonstrated the formation of protein films (Fig. 4 and 5). In contrast, the protein films were observed with the 0.4 mM methylglyoxal treatment in the case of Hb (Fig. 6). The protein films were further visualized and confirmed using SEM (Fig. 7), where stacks of protein films were clearly seen.
 | ||
| Fig. 3 The AGEs based autofluorescence imaging of proteins (HSA and Hb) treated with various concentrations of methylglyoxal. | ||
 | ||
| Fig. 4 The AGEs based autofluorescence imaging of methylglyoxal-induced HSA aggregates (magnification: 10x). | ||
 | ||
| Fig. 5 The bright field (BF) and AGEs based autofluorescence images of HSA aggregates showing protein films (marked with pink box) with dark mesh-like aggregates deposited (marked with red box) over them. (a) 10x magnification; (b) 20x magnification; (c) 10x magnification. | ||
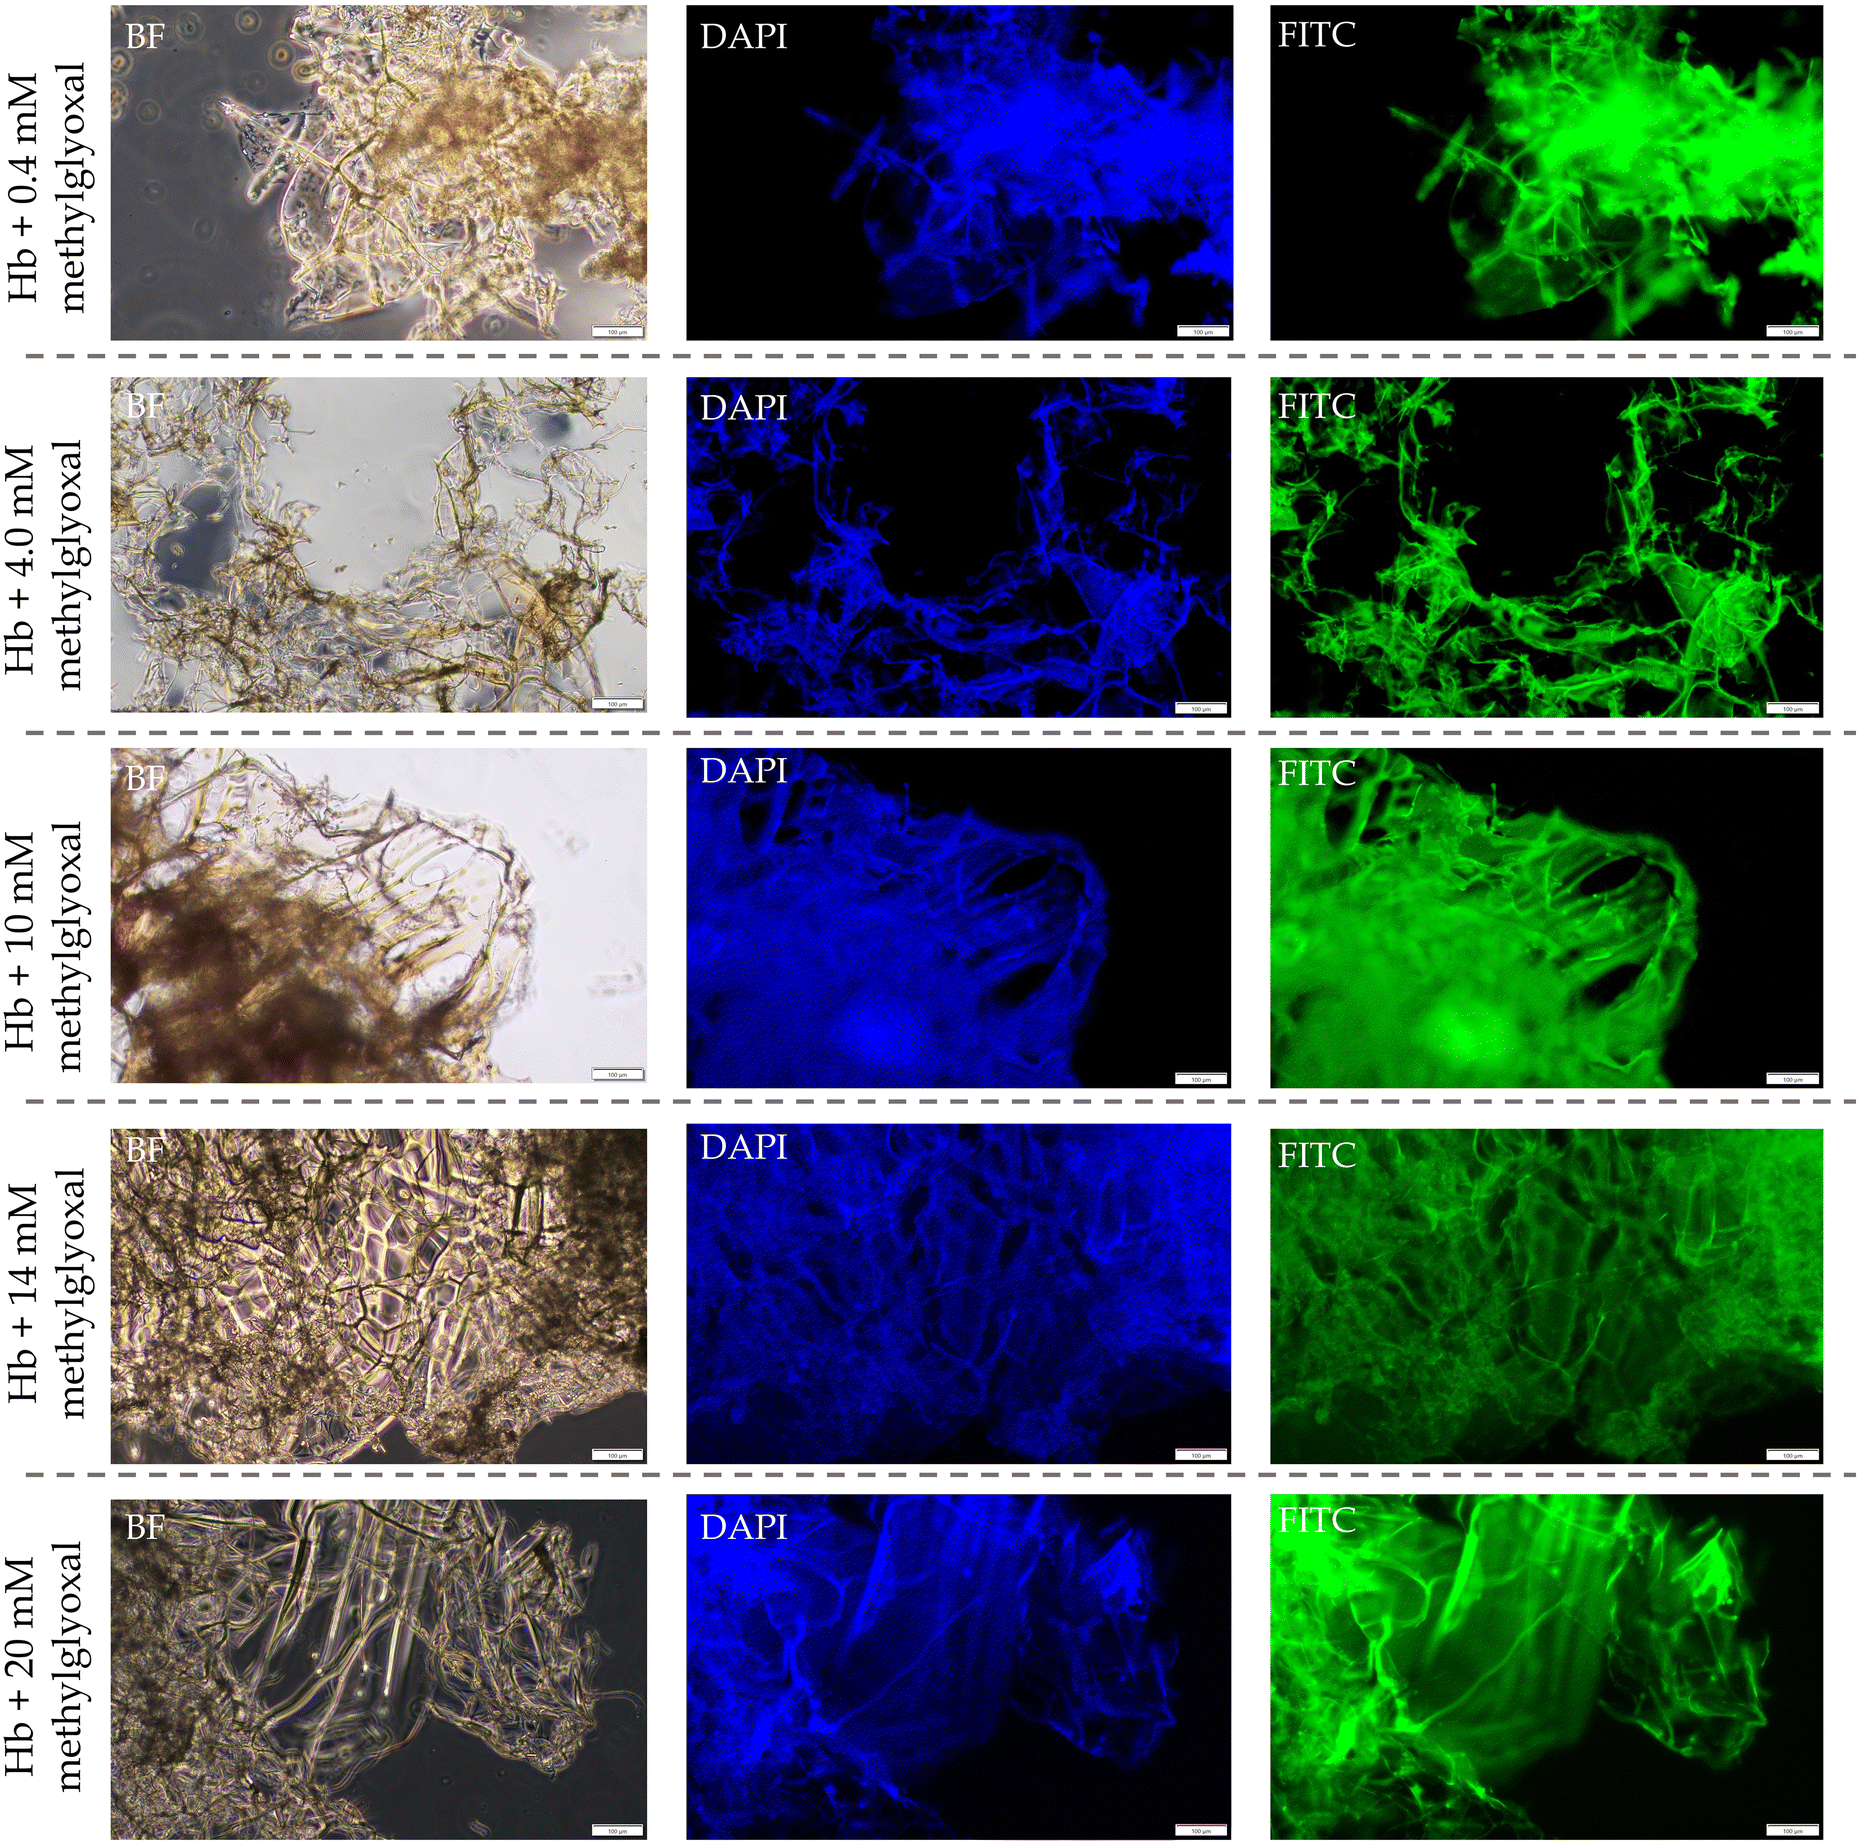 | ||
| Fig. 6 The bright field (BF) and AGEs based autofluorescence images of Hb aggregates showing protein films with aggregates deposited over them. | ||
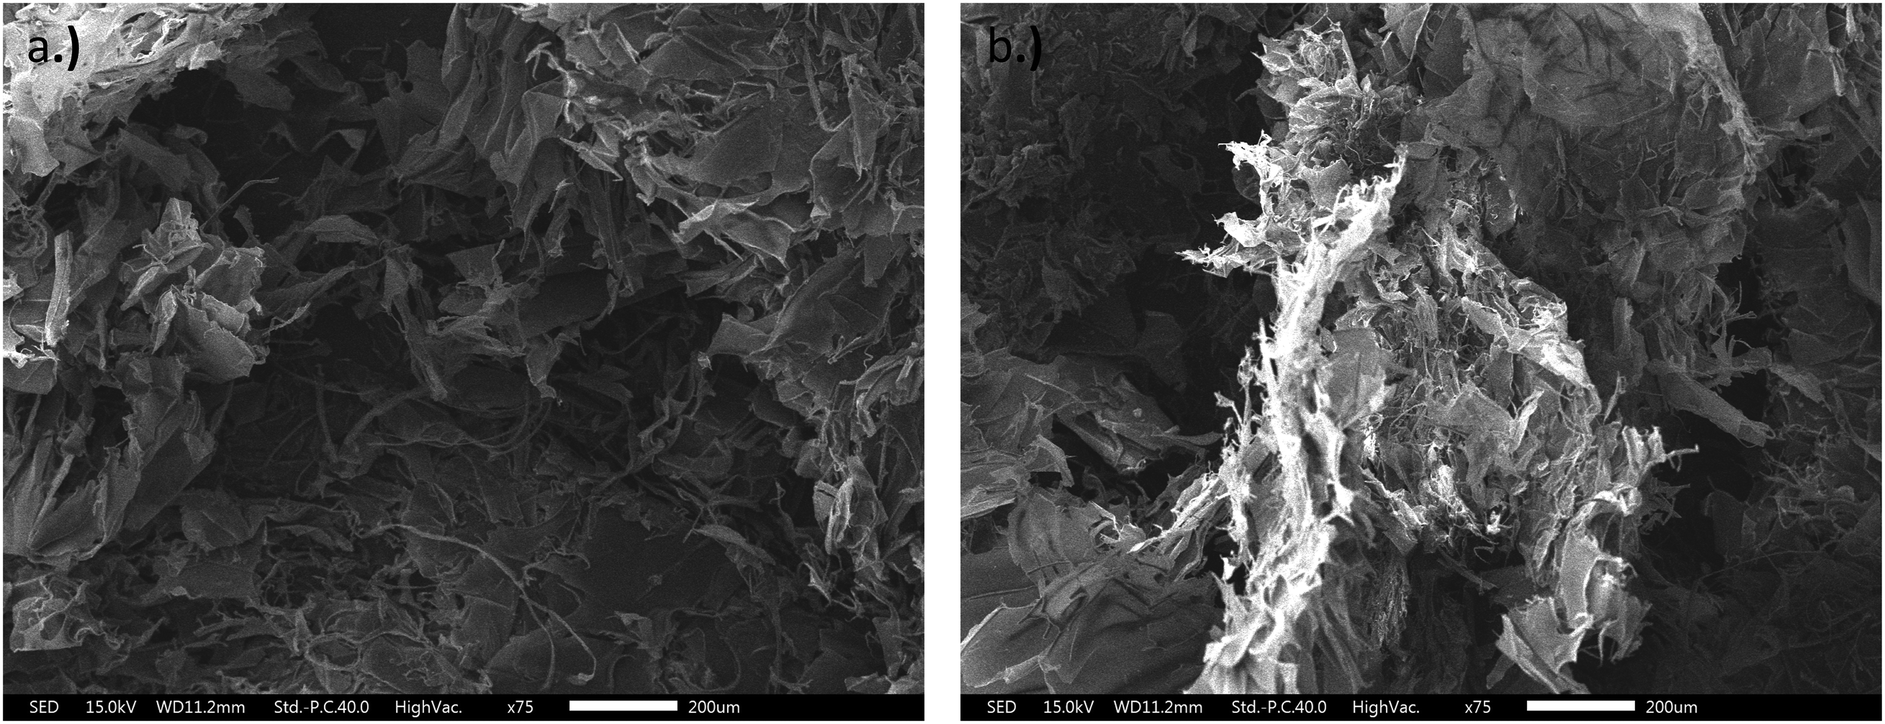 | ||
| Fig. 7 The SEM images of (a) HSA +10 mM methylglyoxal and (b) Hb +10 mM methylglyoxal showing the protein films. | ||
In addition, the chemical crosslinking of proteins through covalent bonds can lead to insoluble aggregates.50–52 AGEs crosslink by covalently connecting the intra- or inter-primary amines of Lys and Arg residues of proteins.53,54 Many types of AGEs, specifically pentosidine and vesperlysine are reported to accumulate at a higher rate in the lens-crystallin of senile cataractous lenses.54–56 The cross-linking of collagen fibrils in the cornea can provide mechanical strength to collagen and protection against keratoconus (corneal thinning disease) in diabetic patients.53 Several studies report the detection of fluorescent AGEs using multiple excitation wavelengths, as listed in Table 1. However, detecting fluorescent AGEs and the conformational changes of proteins using a single excitation wavelength (285 nm) would give rise to additional molecular insights into NEG-induced protein aggregation. The Tyr/Trp autofluorescence induced by deep-UV can act as the primary energy source for exciting the fluorescent AGEs (through resonance energy transfer) that are formed on the same protein, producing multiple AGE-specific fluorescent peaks, which is also one of the reasons for decreasing the autofluorescence intensity of Trp and Tyr in nonenzymatically glycated proteins. Unlike native HSA, AGE specific peaks were observed in native Hb itself at ∼380 nm (pentosidine; Arg → Lys crosslink), ∼440 nm (vesperlysine A/B; Lys → Lys crosslink), and ∼480 nm (crossline; Lys → Lys crosslink), as shown in Fig. 1a. Compared to HSA (half-life: 21 days),10 Hb is more susceptible to NEG by blood glucose and its metabolic intermediates in vivo because of its longer half-life (120 days),57,58 which causes the formation of Amadori products in vivo. Hb with Amadori products is best known as HbA1c.57 In the current study, during the incubation of Hb, at 37 °C for three days, these pre-existing Amadori products transformed into AGEs. Furthermore, with the 0.6 mM methylglyoxal treatment, Hb showed a distinct peak at ∼520 nm due to the formation of non-crosslinking Arg-derived AGEs (Arg-AGEs)59 (Fig. 1f). In the case of HSA, a distinct shoulder peak at ∼380 nm (pentosidine) was observed with the 0.6 mM methylglyoxal treatment. The peaks ∼440 nm and ∼480 nm became more prominent in HSA at 0.8 mM methylglyoxal. The ∼380 nm peak in HSA and Hb shifted to ∼400 nm (Fig. 1k and q) due to argpyrimidine (non-crosslinking AGE) formation. Di-tyrosine, a hallmark of oxidative stress produced upon Tyr radical cross-linking, can also be ascribed to the emission peak at ∼400 nm.60–62 Di-tyrosine formation and the oxidative damage to proteins caused by methylglyoxal have been well demonstrated in earlier studies.62–64 Di-tyrosine formation may be crucial in α-synuclein crosslinking and toxicity in Parkinson's disease.61,65 In addition, a new peak observed at ∼420 nm in the case of HSA (Fig. 1m) may be because of the altered polarity in the microenvironment of vesperlysine A,66 which was not seen in the case of Hb. It was also observed that the peaks between 380 and 400 nm grew fainter with increasing methylglyoxal concentrations in both HSA and Hb (Fig. 1l–r). This can be attributed to the increased resonance energy transfer from pentosidine/argpyramidine to vesperlysine/crossline/Arg-AGEs, as the excitation spectrum of the latter overlaps with the emission spectrum of the former.7
In addition, the lysozyme protein (derived from egg white; PDB: 1DPX) containing 6 Trp and 3 Tyr residues and a relatively low α-helix content33 was also glycated with methylglyoxal to evaluate the NEG-induced unfolding and the formation of crosslinking AGEs. Compared to HSA and Hb, the lysozymes possess the smallest number of NEG reaction sites (11 Arg residues and 6 lysine residues). However, AGE-specific emission peaks (∼380, ∼400, ∼440, ∼480, and ∼520) were clearly seen in the dUV-AF spectra of lysozyme (ESI Fig. S5†). With increasing concentrations of methylglyoxal, lysozyme unfolding was seen in the photometric absorbance spectra (ESI Fig. S2c†), where the absorbance at ∼280 nm constantly increased with rising methylglyoxal concentration. However, neither a shift in the emission maxima (as seen in Hb) nor a distinct Tyr peak (as seen in HSA) was seen to confirm the protein unfolding by dUV-AF. Similar findings have been reported in the literature, wherein the lysozyme did not exhibit a shift in its emission maxima when exposed to varying doses of sodium dodecyl sulfate (SDS) and urea despite its unfolding,33,67 making it insensitive to autofluorescence-based33 assessment of unfolding, unlike other proteins such as HSA, Hb, BSA, and RNaseA.
Furthermore, the formation of protein crosslinks was verified by performing SDS-PAGE (ESI Fig. S6†)64 of methylglyoxal-modified lysozyme. There was no sign of species other than monomeric lysozyme (∼15 kDa) in the first lane (native lysozyme) of the polyacrylamide gel. The electrophoretic profile of methylglyoxal-modified lysozyme showed a band corresponding to the 30 kDa marker, implying protein cross-linking and protein dimer formation. Interestingly, 0.1 mM methylglyoxal treatment was sufficient to generate a protein dimer. With increasing concentrations of methylglyoxal, the intensity of the dimer band became more prominent (ESI Fig. S6†). Less lysozyme is expected to move as a monomer on the gel as more oligomers are cross-linked. We observed, however, that regardless of the methylglyoxal dosage, the visible intensity of the monomer band did not appear to alter much. Since oligomers make up a minor portion of the sample in solution, the monomer band became saturated when the wells were somewhat overloaded (35 μg) so that the less populated dimer protein band was seen.64
Methylglyoxal can cleave the disulfide bridges to unfold the proteins, which leads to the formation of amyloid aggregates (protein films). In the same reaction mixture, methylglyoxal can form AGEs on proteins and induce protein aggregation through covalent cross-linking. The intra-protein crosslinks can prevent the unfolding of proteins and make the protein further compact and rigid, whereas the inter-protein crosslinks can link these unfolded proteins to form mesh-like aggregates, as seen in the autofluorescence microscopy images (Fig. 5 and 6). The protein aggregates’ bright field (BF) images showed mesh-like dark deposits on the protein films (Fig. 5 and 6). More evidently, the autofluorescence images of the same aggregates demonstrated a higher fluorescence intensity from those deposits than in the films (Fig. 5 and 6), confirming the presence of more crosslinking AGEs in such aggregates. Furthermore, the hydrophobic interactions may play a major role in polymerizing the β-sheet-rich amphiphilic oligomers (formed through protein unfolding) in the case of heat, acid, and organic solvent-induced formation of protein films.45 However, the fluorescence emission from the region of protein films (Fig. 5 and 6) suggests that, in the case of NEG-induced aggregation, the crosslinking AGEs may also play a role in the polymerization of the amphiphilic oligomers to form protein films.
Furthermore, the formation of fluorescent crosslinking AGEs was confirmed by recording the steady state fluorescence spectra of different AGEs by exciting the glycated protein samples with AGE-specific excitation (Table 1). Pentosidine was excited explicitly at 320 nm (ESI Fig. S8a and d†). Glycated HSA and Hb showed a peak specific to pentosidine (crosslinking AGEs) at ∼385 nm. Interestingly, the native proteins showed a low intensity peak at ∼385 nm, corresponding to pentosidine. This could be due to the conversion of the pre-existing Amadori products formed on proteins into AGEs upon incubation at 37 °C. With an increasing concentration of methylglyoxal, peaks corresponding to vesperlysine A/B (∼440 nm) and crossline (∼480 nm) were also observed with an excitation at 320 nm (ESI Fig. S8a and d†). Interestingly, the intensity at ∼440 nm and ∼485 nm started increasing with decreasing intensity at ∼385 nm, possibly due to energy transfer from pentosidine to vesperlysine A/B and crossline.25,59 At 370 nm excitation, vesperlysine A/B is specifically excited to produce the fluorescence peak at ∼440 nm. However, due to the energy transfer from vesperlysine to crossline, the peak at ∼480 nm also appeared in the spectra (ESI Fig. S8b and e†). At 370 nm excitation, the fluorescence intensity of glycated Hb at ∼440 steadily increased until the concentration of 16 mM of methylglyoxal (ESI Fig. S8b†); afterward, the fluorescence intensity began to decline, which may be due to the energy transfer to other AGEs, such as crossline and Arg-AGEs. The intensity at 440 nm increased for the glycated HSA up to 10 mM of methylglyoxal, after which the intensity did not alter much. With an increasing concentration of methylglyoxal, the shoulder peak at ∼480 nm (crossline) started becoming prominent, which suggests an energy transfer from vesperlysine to crossline. Furthermore, the fluorescence intensity at 480 nm (crossline fluorescence; λex: 420 nm) steadily increased with increasing concentrations of methylglyoxal without any intensity drop (ESI Fig. S8c and f†), which may be due to the absence of AGEs, which get excited at the emitted wavelength of crossline fluorescence.
Furthermore, the FTIR analyses showed the secondary structure change in the methylglyoxal-modified proteins. Amide I and amide II are characteristic bands in proteins and polypeptides’ infrared (IR) spectra. These are formed by the amide bonds that connect the amino acids. The absorption associated with the amide I band causes C![[double bond, length as m-dash]](https://www.rsc.org/images/entities/char_e001.gif) O stretching vibrations,68 whereas the amide II band absorption is predominantly caused by bending vibrations of the N–H bond.69,70 Since intra-molecular hydrogen bonding involves both the CO and the N–H bonds, the positions of the amide I and amide II bands are sensitive to protein unfolding and aggregation.69–72 Due to changes in the protein structure, the hydrogen bond network weakens gradually, and the buried groups become exposed to the solvent, causing supramolecular aggregation.73 The FTIR spectra of the nonenzymatically glycated HSA and Hb are shown in Fig. 8 and 9, respectively. Compared to the native HSA and Hb, the emergence of peaks at 1100 cm−1 and 1730 cm−1 indicates the formation of AGEs in methylglyoxal-treated HSA (Fig. 8) and Hb (Fig. 9). The peak at 1100 cm−1 corresponds to ring vibrations due to the heterocyclic structure of AGEs.74 In contrast, the peak at 1730 cm−1 corresponds to the aldehyde group of carbonyl molecules (methylglyoxal).75 The FTIR spectra of glycated HSA showed a significant change in the peak shape of the amide-I band. Also, both amide-I and amide-II bands shifted towards the longer wavenumber region, as shown in Fig. 8, demonstrating a structural change in proteins. Similarly, compared to the native Hb, the glycated Hb showed an evident variation in the amide-I and amide-II bands with their shifting towards the long wavenumber region (Fig. 9), indicating the change in the protein structure.
O stretching vibrations,68 whereas the amide II band absorption is predominantly caused by bending vibrations of the N–H bond.69,70 Since intra-molecular hydrogen bonding involves both the CO and the N–H bonds, the positions of the amide I and amide II bands are sensitive to protein unfolding and aggregation.69–72 Due to changes in the protein structure, the hydrogen bond network weakens gradually, and the buried groups become exposed to the solvent, causing supramolecular aggregation.73 The FTIR spectra of the nonenzymatically glycated HSA and Hb are shown in Fig. 8 and 9, respectively. Compared to the native HSA and Hb, the emergence of peaks at 1100 cm−1 and 1730 cm−1 indicates the formation of AGEs in methylglyoxal-treated HSA (Fig. 8) and Hb (Fig. 9). The peak at 1100 cm−1 corresponds to ring vibrations due to the heterocyclic structure of AGEs.74 In contrast, the peak at 1730 cm−1 corresponds to the aldehyde group of carbonyl molecules (methylglyoxal).75 The FTIR spectra of glycated HSA showed a significant change in the peak shape of the amide-I band. Also, both amide-I and amide-II bands shifted towards the longer wavenumber region, as shown in Fig. 8, demonstrating a structural change in proteins. Similarly, compared to the native Hb, the glycated Hb showed an evident variation in the amide-I and amide-II bands with their shifting towards the long wavenumber region (Fig. 9), indicating the change in the protein structure.
 | ||
| Fig. 8 The FTIR spectra of (a) native HSA; (b) HSA +0.2 mM MG; (c) HSA +0.6 mM MG; (d) HSA +1 mM MG; (e) HSA +2 mM MG; (f) HSA +6 mM MG; (g) HSA +10 mM MG; (h) HSA +14mM MG; and (i) HSA +18 mM MG. | ||
 | ||
| Fig. 9 The FTIR spectra of (a) native Hb; (b) Hb +0.2 mM MG; (c) Hb +0.6 mM MG; (d) Hb +1 mM MG; (e) Hb +2 mM MG; (f) Hb +6 mM MG; (g) Hb +10 mM MG; (h) Hb +14mM MG; and (i) Hb +18 mM MG. | ||
3. Conclusion
Detecting and characterizing the conformational changes in proteins have been proved to be indispensable diagnostic tools for various types of conformational disorder. Assessment of the structural changes in nonenzymatically glycated proteins has been used to probe hyperglycemia-associated comorbidities and other types of protein aggregation disorder. Extrinsic fluorophores are often the preferred procedure for assessing protein unfolding and aggregation, employing fluorescence spectroscopy and imaging in nonenzymatically glycated proteins. However, sample preparation is a cumbersome, expensive, and time-consuming process in this case. Also, the extrinsic fluorophores can inevitably and inadvertently alter a protein molecule's structure, making sample recovery and reuse nearly impossible. In contrast, the label-free approach demonstrated in the current study offers minimal sample preparation, and apart from practical and economic benefits, it offers unique opportunities to identify and characterize proteins in their native state. In the current study, we used an in-house developed dUV-AF spectroscopic system with LED excitation to assess spectral changes (due to unfolding and AGE formation) and a commercial fluorescence microscope with a mercury vapor lamp to visualize the aggregates. An integrated system with a single deep-UV-LED excitation source might facilitate the label-free assessment of protein structural changes and imaging of protein aggregation. Because of the exceptional power stability of LEDs, the results may be significantly reproducible. Also, on the other side, the CCD-spectrograph is essential for label-free protein assessment because it minimizes the exposure of proteins to UV-C light and lessens the possibility of photoinduced formation of di-tyrosine.Author contributions
Krishna Kishore Mahato: conceptualization, data curation, funding acquisition, and study supervision; Darshan Chikkanayakanahalli Mukunda: conceptualization, methodology, data curation, writing – original draft, and writing – review & editing; Subhash Chandra: instrumentation; Shaik Basha, Meagan Gail D'Souza & Ameera K: review & editing, Nirmal Mazumder & Weena Stanley: writing – review & editing.Data availability
Data will be made available on request.Conflicts of interest
There are no conflicts of interest to declare.Acknowledgements
The authors would like to thank the Manipal Academy of Higher Education (MAHE), Manipal, India. DBT-BUILDER, Department of Biotechnology, Government of India (BT/INF/22/SP43065/2021) for infrastructure and facilities. D. C. M. would like to thank the Indian Council of Medical Research (ICMR), Government of India, for support through the Senior Research Fellowships (Sanctions No. 5/3/8/14/ITR-F/2020). S. B. would like to thank the Innovation in Science Pursuit for Inspired Research (INSPIRE) Fellowship, Department of Science and Technology, Government of India (IF:220005, EMR-2016-007700). K. K. M. would like to thank the Indian Council of Medical Research (ICMR), Government of India, for financial support (Ref. 17x(3)/Adhoc/33/2022-ITR).References
- F. Taghavi, M. Habibi-Rezaei, M. Amani, A. A. Saboury and A. A. Moosavi-Movahedi, Int. J. Biol. Macromol., 2017, 100, 67–74 CrossRef CAS PubMed.
- A. Iram, T. Alam, J. M. Khan, T. A. Khan, R. H. Khan and A. Naeem, PLoS One, 2013, 8, e72075 CrossRef CAS PubMed.
- S. Banerjee, S. Maity and A. S. Chakraborti, Spectrochim. Acta, Part A, 2016, 155, 1–10 CrossRef CAS PubMed.
- M. Chrysanthou, I. Miro Estruch, I. M. C. M. Rietjens, H. J. Wichers and T. Hoppenbrouwers, Nutrients, 2022, 14, 363 CrossRef CAS PubMed.
- S. Awasthi and N. T. Saraswathi, Int. J. Biol. Macromol., 2016, 83, 410–415 CrossRef CAS PubMed.
- F. Alsamad, B. Brunel, V. Vuiblet, P. Gillery, S. Jaisson and O. Piot, Spectrochim. Acta, Part A, 2021, 251, 119382 CrossRef CAS PubMed.
- A. Naftaly, R. Izgilov, E. Omari and D. Benayahu, ACS Biomater. Sci. Eng., 2021, 7, 3179–3189 CrossRef CAS PubMed.
- C. Iannuzzi, M. Borriello, G. Irace, M. Cammarota, A. Di Maro and I. Sirangelo, Sci. Rep., 2017, 7, 15086 CrossRef PubMed.
- J. M. Ashraf, S. Ahmad, I. Choi, N. Ahmad, M. Farhan, G. Tatyana and U. Shahab, IUBMB Life, 2015, 67, 897–913 CrossRef CAS PubMed.
- J. Anguizola, R. Matsuda, O. S. Barnaby, K. S. Hoy, C. Wa, E. DeBolt, M. Koke and D. S. Hage, Clin. Chim. Acta, 2013, 425, 64–76 CrossRef CAS PubMed.
- A. Perrone, A. Giovino, J. Benny and F. Martinelli, Oxid. Med. Cell. Longevity, 2020, 2020, 1–18 CrossRef PubMed.
- A. Ioannou and C. Varotsis, RSC Adv., 2019, 9, 37614–37619 RSC.
- A. Ahmed, A. Shamsi, M. S. Khan, F. M. Husain and B. Bano, Int. J. Biol. Macromol., 2018, 113, 269–276 CrossRef CAS PubMed.
- Z. Toprakcioglu, P. Challa, C. Xu and T. P. J. Knowles, ACS Nano, 2019, 13, 13940–13948 CrossRef CAS PubMed.
- Y. Deng, X. Wang, C. Zhang, P. Xie and L. Huang, J. Bioresour. Bioprod., 2023, 8, 187–197 CrossRef CAS.
- L. He, Y. Liu, J. Xu, J. Li, G. Cheng, J. Cai, J. Dang, M. Yu, W. Wang, W. Duan and K. Liu, Molecules, 2022, 27, 6995 CrossRef CAS PubMed.
- R. Singla, S. M. S. Abidi, A. I. Dar and A. Acharya, ACS Omega, 2019, 4, 14805–14819 CrossRef CAS PubMed.
- M. Ishtikhar, T. I. Chandel, A. Ahmad, M. S. Ali, H. A. Al-lohadan, A. M. Atta and R. H. Khan, PLoS One, 2015, 10, e0139027 CrossRef PubMed.
- S. Awasthi and N. T. Saraswathi, Int. J. Biol. Macromol., 2016, 87, 1–6 CrossRef CAS PubMed.
- K. Yanagisawa, Z. Makita, K. Shiroshita, T. Ueda, T. Fusegawa, S. Kuwajima, M. Takeuchi and T. Koike, Metabolism, 1998, 47, 1348–1353 CrossRef CAS PubMed.
- A. Ahmed, A. Shamsi, M. S. Khan, F. M. Husain and B. Bano, Int. J. Biol. Macromol., 2018, 113, 269–276 CrossRef CAS PubMed.
- D. Chikkanayakanahalli Mukunda, J. Rodrigues, S. Chandra, N. Mazumder, A. Vitkin and K. Kishore Mahato, Talanta, 2024, 267, 125167 CrossRef CAS PubMed.
- C. R. Raghushaker, J. Rodrigues, S. G. Nayak, S. Ray, A. S. Urala, K. Satyamoorthy and K. K. Mahato, Anal. Chem., 2021, 93, 16520–16527 CrossRef CAS PubMed.
- A. Schmitt, J. Schmitt, G. Münch and J. Gasic-Milencovic, Anal. Biochem., 2005, 338, 201–215 CrossRef CAS PubMed.
- D. C. Mukunda, V. K. Joshi, S. Chandra, M. Siddaramaiah, J. Rodrigues, S. Gadag, U. Y. Nayak, N. Mazumder, K. Satyamoorthy and K. K. Mahato, Int. J. Biol. Macromol., 2022, 213, 279–296 CrossRef CAS PubMed.
- M. Siddaramaiah, B. S. Rao, M. B. Joshi, A. Datta, S. Sandya, V. Vishnumurthy, S. Chandra, S. G. Nayak, K. Satyamoorthy and K. K. Mahato, J. Biophotonics, 2018, e201700393 CrossRef PubMed.
- I. Govindaraju, G.-Y. Zhuo, I. Chakraborty, S. K. Melanthota, S. S. Mal, B. Sarmah, V. J. Baruah, K. K. Mahato and N. Mazumder, Food Hydrocolloids, 2022, 122, 107093 CrossRef CAS.
- A. Ghisaidoobe and S. Chung, Int. J. Mol. Sci., 2014, 15, 22518–22538 CrossRef CAS PubMed.
- D. Chikkanayakanahalli Mukunda, J. Rodrigues, S. Chandra, N. Mazumder, A. Vitkin and K. Kishore Mahato, Talanta, 2024, 267, 125167 CrossRef CAS PubMed.
- Y. K. Reshetnyak, Y. Koshevnik and E. A. Burstein, Biophys. J., 2001, 81, 1735–1758 CrossRef CAS PubMed.
- K. B. Davis, Z. Zhang, E. A. Karpova and J. Zhang, Anal. Biochem., 2018, 557, 142–150 CrossRef CAS PubMed.
- K. B. Davis, Z. Zhang, E. A. Karpova and J. Zhang, Anal. Biochem., 2018, 557, 142–150 CrossRef CAS PubMed.
- M. Siddaramaiah, K. Satyamoorthy, B. S. S. Rao, S. Roy, S. Chandra and K. K. Mahato, Spectrochim. Acta, Part A, 2017, 174, 44–53 CrossRef CAS PubMed.
- S. Banerjee and A. S. Chakraborti, Int. J. Biol. Macromol., 2017, 95, 1159–1168 CrossRef CAS PubMed.
- A. Zawada, A. Machowiak, A. M. Rychter, A. E. Ratajczak, A. Szymczak-Tomczak, A. Dobrowolska and I. Krela-Kaźmierczak, Nutrients, 2022, 14, 3982 CrossRef CAS PubMed.
- S. Manjunath, B. S. Satish Rao, K. Satyamoorthy and K. K. Mahato, Spectrochim. Acta, Part A, 2015, 149, 607–614 CrossRef CAS PubMed.
- N. Gull, P. Sen, R. H. Khan and Kabir-ud-Din, J. Biochem., 2008, 145, 67–77 CrossRef PubMed.
- M. C. Stumpe and H. Grubmüller, Biophys. J., 2009, 96, 3744–3752 CrossRef CAS PubMed.
- Q. Xu and T. A. Keiderling, Protein Sci., 2004, 13, 2949–2959 CrossRef CAS PubMed.
- Y. Wei, L. Chen, J. Chen, L. Ge and R. Q. He, BMC Cell Biol., 2009, 10, 10 CrossRef PubMed.
- M. S. Khan, S. Dwivedi, M. Priyadarshini, S. Tabrez, M. A. Siddiqui, H. Jagirdar, A. M. Al-Senaidy, A. A. Al-Khedhairy and J. Musarrat, Eur. Biophys. J., 2013, 42, 811–818 CrossRef CAS PubMed.
- A. Das, P. Basak, A. Pramanik, R. Majumder, A. Ghosh, S. Hazra, M. Guria, M. Bhattacharyya and S. P. Banik, Heliyon, 2020, 6, e05053 CrossRef CAS PubMed.
- A. Tarannum, Z. Arif, K. Alam and Moinuddin, J. Mol. Struct., 2020, 1210, 127991 CrossRef CAS.
- S. Perween, M. Abidi, A. Faiz Faizy and Moinuddin, Int. J. Biol. Macromol., 2022, 202, 199–214 CrossRef CAS PubMed.
- Y. Liu, F. Tao, S. Miao and P. Yang, Acc. Chem. Res., 2021, 54, 3016–3027 CrossRef CAS PubMed.
- C. Li, L. Xu, Y. Y. Zuo and P. Yang, Biomater. Sci., 2018, 6, 836–841 RSC.
- S. Nirwal, V. Bharathi and B. K. Patel, Biophys. Chem., 2021, 278, 106678 CrossRef CAS PubMed.
- Q. Han, F. Tao, Y. Xu, H. Su, F. Yang, V. Körstgens, P. Müller-Buschbaum and P. Yang, Angew. Chem., Int. Ed., 2020, 59, 20192–20200 CrossRef CAS PubMed.
- P. Yang, Macromol. Biosci., 2012, 12, 1053–1059 CrossRef CAS PubMed.
- L. Ortigosa-Pascual, T. Leiding, S. Linse and T. Pálmadóttir, ACS Chem. Neurosci., 2023, 14, 3192–3205 CrossRef CAS PubMed.
- M. Lebendiker and T. Danieli, FEBS Lett., 2014, 588, 236–246 CrossRef CAS PubMed.
- H. J. McKerchar, S. Clerens, R. C. J. Dobson, J. M. Dyer, E. Maes and J. A. Gerrard, Trends Food Sci. Technol., 2019, 86, 217–229 CrossRef CAS.
- T. B. McKay, S. Priyadarsini and D. Karamichos, Cells, 2019, 8, 1239 CrossRef CAS PubMed.
- S. K. Nandi, R. B. Nahomi, J. Rankenberg, M. A. Glomb and R. H. Nagaraj, J. Biol. Chem., 2020, 295, 5701–5716 CrossRef CAS PubMed.
- K. M. Biemel, D. A. Friedl and M. O. Lederer, J. Biol. Chem., 2002, 277, 24907–24915 CrossRef CAS PubMed.
- T. J. Lyons, G. Silvestri, J. A. Dunn, D. G. Dyer and J. W. Baynes, Diabetes, 1991, 40, 1010–1015 CrossRef CAS PubMed.
- S. I. Sherwani, H. A. Khan, A. Ekhzaimy, A. Masood and M. K. Sakharkar, Biomarker Insights, 2016, 11, BMI.S38440 CrossRef PubMed.
- C. Weykamp, Ann. Lab. Med., 2013, 33, 393–400 CrossRef CAS PubMed.
- A. Schmitt, J. Schmitt, G. Münch and J. Gasic-Milencovic, Anal. Biochem., 2005, 338, 201–215 CrossRef CAS PubMed.
- M. Correia, M. T. Neves-Petersen, P. B. Jeppesen, S. Gregersen and S. B. Petersen, PLoS One, 2012, 7, e50733 CrossRef CAS PubMed.
- A. Fricano, F. Librizzi, E. Rao, C. Alfano and V. Vetri, Biochim. Biophys. Acta, Proteins Proteomics, 2019, 1867, 140258 CrossRef CAS PubMed.
- N. Ahmed, S. Battah, N. Karachalias, R. Babaei-Jadidi, M. Horányi, K. Baróti, S. Hollan and P. J. Thornalley, Biochim. Biophys. Acta, Mol. Basis Dis., 2003, 1639, 121–132 CrossRef CAS PubMed.
- I. Sadowska-Bartosz, S. Galiniak and G. Bartosz, Molecules, 2014, 19, 4880–4896 CrossRef CAS PubMed.
- L. Ortigosa-Pascual, T. Leiding, S. Linse and T. Pálmadóttir, ACS Chem. Neurosci., 2023, 14, 3192–3205 CrossRef CAS PubMed.
- K. Radomska and M. Wolszczak, Int. J. Mol. Sci., 2022, 23, 8090 CrossRef CAS PubMed.
- A. Bettiga, F. Fiorio, F. Di Marco, F. Trevisani, A. Romani, E. Porrini, A. Salonia, F. Montorsi and R. Vago, Nutrients, 2019, 11, 1748 CrossRef CAS PubMed.
- S. Manjunath, B. S. Satish Rao, K. Satyamoorthy and K. K. Mahato, Spectrochim. Acta, Part A, 2015, 149, 607–614 CrossRef CAS PubMed.
- M. Chakraborty, I. Mitra, K. Sarkar, M. Bardhan, S. Paul, S. Basu, A. Goswami, A. Saha, B. Show and T. Ganguly, Spectrochim. Acta, Part A, 2019, 215, 313–326 CrossRef CAS PubMed.
- D. M. Byler and H. Susi, Biopolymers, 1986, 25, 469–487 CrossRef CAS PubMed.
- Y. Jiang, C. Li, X. Nguyen, S. Muzammil, E. Towers, J. Gabrielson and L. Narhi, J. Pharm. Sci., 2011, 100, 4631–4641 CrossRef CAS PubMed.
- S. Yang, Q. Zhang, H. Yang, H. Shi, A. Dong, L. Wang and S. Yu, Int. J. Biol. Macromol., 2022, 206, 175–187 CrossRef CAS PubMed.
- J. Kong and S. Yu, Acta Biochim. Biophys. Sin., 2007, 39, 549–559 CrossRef CAS PubMed.
- D. Usoltsev, V. Sitnikova, A. Kajava and M. Uspenskaya, Biomolecules, 2019, 9, 359 CrossRef CAS PubMed.
- A. Parihar, J. Vongsvivut and S. Bhattacharya, ACS Omega, 2019, 4, 8747–8757 CrossRef CAS PubMed.
- A. Raghav, J. Ahmad and K. Alam, PLoS One, 2017, 12, e0176970 CrossRef PubMed.
Footnote |
| † Electronic supplementary information (ESI) available: Fig. S1 to S8. See DOI: https://doi.org/10.1039/d4an00358f |
| This journal is © The Royal Society of Chemistry 2024 |