
 Open Access Article
 This Open Access Article is licensed under a
 Creative Commons Attribution 3.0 Unported Licence
Potential and performance of anisotropic 19F NMR for the enantiomeric analysis of fluorinated chiral active pharmaceutical ingredients†
Boris
Gouilleux
 *a,
François-Marie
Moussallieh
a and
Philippe
Lesot
*ab
*a,
François-Marie
Moussallieh
a and
Philippe
Lesot
*ab
aUniversité Paris-Saclay, UFR d'Orsay, RMN en Milieu Orienté, ICMMO, UMR CNRS 8182, Bât. HM1, 17-19, Avenue des Sciences, 91400, Orsay, France
bCentre National de la Recherche Scientifique (CNRS), 3, Rue Michel Ange, F-75016 Paris, France. E-mail: boris.gouilleux@universite-paris-saclay.fr; philippe.lesot@universite-paris-saclay.fr
First published on 17th April 2024
Abstract
Controlling the enantiomeric purity of chiral drugs is of paramount importance in pharmaceutical chemistry. Isotropic 1H NMR spectroscopy involving chiral agents is a widely used method for discriminating enantiomers and quantifying their relative proportions. However, the relatively weak spectral separation of enantiomers (1H Δδiso(R, S)) in frequency units at low and moderate magnetic fields, as well as the lack of versatility of a majority of those agents with respect to different chemical functions, may limit the general use of this approach. In this article, we investigate the analytical potential of 19F NMR in anisotropic chiral media for the enantiomeric analysis of fluorinated active pharmaceutical ingredients (API) via two residual anisotropic NMR interactions: the chemical shift anisotropy (19F-RCSA) and dipolar coupling ((19F–19F)-RDC). Lyotropic chiral liquid crystals (CLC) based on poly-γ-benzyl-L-glutamate (PBLG) show an interesting versatility and adaptability to enantiodiscrimination as illustrated for two chiral drugs, Flurbiprofen® (FLU) and Efavirenz® (EFA), which have very different chemical functions. The approach has been tested on a routine 300 MHz NMR spectrometer equipped with a standard probe (5 mm BBFO probe) in a high-throughput context (i.e., ≈10 s of NMR experiments) while the performance for enantiomeric excess (ee) measurement is evaluated in terms of trueness and precision. The limits of detection (LOD) determined were 0.17 and 0.16 μmol ml−1 for FLU and EFA, respectively, allow working in dilute conditions even with such a short experimental duration. The enantiodiscrimination capabilities are also discussed with respect to experimental features such as CLC composition and temperature.
Introduction
Molecular chirality plays a central role in pharmaceutical chemistry as more than 50% of the drugs currently sold on the market include at least one stereogenic center.1 While one of the enantiomers of a chiral active pharmaceutical ingredient (API) leads to the expected/desired activity on the biological target (eutomer), the other one may induce different effects, ranging from no activity to opposite or even toxic side-effects (distomer).1–3 As a result, an increasing number of new chiral drugs are being marketed as pure enantiomeric compounds, while some drugs initially used as a racemate are being replaced by the identified eutomer (chiral switch) to improve therapeutic activity/efficacy.4 This leads to a continued need for fast, efficient and versatile analytical tools to determine the enantiomeric purity of a bioactive substance at various stages, from drug synthesis steps to the control of the final commercial medicines.Several approaches have been developed for enantiomeric discrimination and the determination of enantiomeric excess (ee), so far, such as chiroptical tools (VCD, ROA, …), gas or liquid chiral chromatography (GC, HPLC), electrophoresis, mass spectrometry and NMR spectroscopy.5 Although chromatographic tools are widely used for this purpose, NMR spectroscopy can also be successfully used for the enantiomeric analysis of chiral API.6–13 These NMR methods rely on the interaction between the analyte to be studied and a chiral auxiliary (CA) to form: (i) either stable diastereoisomers by covalent bonding or (ii) diastereomeric adducts via intermolecular interaction.14–16 In isotropic solutions, these CAs can be either chiral derivatizing agents (CDAs) as Mosher's acid,17 chiral metallic complexes,18,19 chiral lanthanide shift reagents,20,21 or chiral solvating agents (CSAs) such as cyclodextrin-based agents.22 The conversion of enantiomers to diastereomeric entities leads to spectral discriminations through variations of isotropic chemical shift (Δδiso(R, S)). Basically, weak spectral enantio-separations (in frequency units) generally measured on routine 1H NMR (<9.4 T) can be increased by recording spectra on very high-field NMR instruments (if accessible). Other approaches using 19F NMR on fluorinated solutes23 or even fluorinated CSA/CDA as recently reported,24–27 can provide elegant tools. However, the need of designing a tailored CSA/CDA (not always commercially available) for a specific chemical group remains the main challenge and may limit the general use of these approaches.
The concept of enantiospecific non-covalent interactions between the R/S-isomers and a chiral (enantiopure) selector in isotropic solvents can be extended to anisotropic media, such as chiral weakly aligning systems (e.g., helical polymer-based lyotropic liquid crystals). In this case, enantiomers exhibit a difference of orientational order in average, these molecular orientations being generally expressed by the Saupe tensor Sαβ.28 From NMR point of view, the spectral enantiomeric discriminations are observed through a difference of residual anisotropic NMR interactions, such as residual chemical shift anisotropy (RCSA), residual dipolar coupling (RDC) or residual quadrupolar coupling (RQC), whose amplitudes depend on the orientational order of the analyte.29–34
Compared to NMR methods in isotropic solvents supported by CAs, NMR in chiral weakly aligning media offers at least three analytical advantages that can expand the role of NMR spectroscopy in chiral analysis of chiral drugs. The first and the most interesting one is the diversity and the magnitude of these anisotropic observables (RDC, RQC, RCSA) associated with any magnetically active nucleus (whether abundant or not), and that generally allows for effective spectral enantiodiscriminations. In addition, the magnitude of RQCs and RDCs (unlike a chemical shift difference) is independent of the magnetic field strength (B0), making easier to transfer methods to spectrometers operating at lower fields. The second one results from the shape recognition mechanisms that play a central role in enantiodiscrimination mechanisms in CLCs.35 As a result, no specific chemical functions or group on the analyte (unlike CSAs/CDAs) is required, so that all CLCs are potentially able to differentiate enantiomers whatever the chemical characteristics of the chiral analyte. The third advantage is based on the absence of possible differences in affinity between the analyte and the chiral agent which can lead to significant discrepancies between the real value and the measured value of the ee%.24,27De facto, no correction coefficient must be introduced to determine the ee% from the measurement of peak surfaces for each enantiomer. The last but not the least advantage is that several chiral polymers (as polypeptides) are commercially available, and no preliminary synthetical step is required to explore their potential.
Although these properties have benefited organic chemistry for the analysis of small molecules, NMR in CLCs has been little explored for the study of pharmaceutical compounds, so far. The main reason for this lack of interest is the inherent complexity of anisotropy 1H 1D NMR spectra of medium-sized molecules due to the numerous long-range (1H–1H)-RDCs that broaden spectral patterns. Other exploitable heteronuclear experiments (e.g., 13C and 2H) are possible but may suffer from insufficient sensitivity to deal with samples of 5–20 mg of API at high enantiomeric excess in a high-throughput framework with routine NMR equipment (e.g., 300–400 MHz spectrometers and conventional probes). In this context, 19F–{1H} NMR appears to be a promising alternative since in the case of monofluorinated or trifluoromethylated chiral compounds (F-R* or CF3-R*) encountered in pharmacopeia,36 a dramatic simplification in spectral analysis is expected, with a suitable/reasonable sensitivity (≈86% of 1H NMR) and a significant chemical shift dispersion of 19F resonances. This advantage has recently been exploited for the chiral analysis in isotropic solvents involving either fluorinated analytes (or even a mixture of chiral analytes),7,23 or newly developed chiral agents including a fluorine tag.24–26
From anisotropic NMR point of view, 19F nuclei are rather sensitive nuclear spies to observe molecular orientational order differences induced by weakly chiral oriented media. These differences can be observed through two residual anisotropic interactions for R and S isomers: the 19F-RCSA, also noted, 19F σaniso(R, S), and the (19F–19F)-RDC, noted |DFF(R, S)|. Based on 19F-RCSA, the spectral enantiomeric discrimination is measured through a difference of frequency (in Hz or ppm) between each enantiomer:
| |Δνaniso(R, S)| = |νaniso(R) − νaniso(S)| | (1) |
 | (2) |
Expressed in a molecular frame (a, b, c axes), the terms σiso and σaniso can be derived from the shielding tensor as:

 | (3) |
In the above equations ν and σ are related to the 19F nuclei while γF is the fluorine gyromagnetic ratio.
Based on (19F–19F)-RDC, the spectral discrimination between enantiomers is measured as:
| |ΔDFF(R, S)| = |DFF(R) − DFF(S)| | (4) |
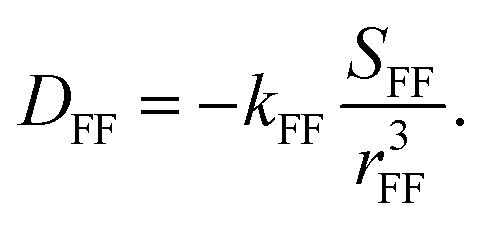 | (5) |
The order parameter SFF of the internuclear vector rFF between the coupled 19F nuclei can be derived as:
 | (6) |
Previous analysis of around twenty small fluorinated chiral compounds (monofluorinated or including a –CF3 moiety) using poly-γ-benzyl-L-glutamate (PBLG) as a chiral mesophase has shown that variations in the 19F anisotropic chemical shift and 19F–19F total homonuclear coupling lie in a range from 0.01 to 0.350 ppm and from 1.4 to 118 Hz, respectively.37–39 Based on this valuable enantiodiscrimination ability, we investigate for the first time the analytical potential of this approach to determine enantiomeric excesses (ee) for fluorinated chiral pharmaceutical ingredients using a routine 300 MHz (7.05 T) spectrometer equipped with a conventional 5 mm NMR probe, a commonly encountered setup in both academic and industrial laboratories. The key role of the mesophase composition and temperature on the enantiomeric resolution is investigated and presented in detail. The analytical performance of the herein method is then evaluated in terms of precision (here short-term repeatability), trueness (i.e., deviation from the expected ee% values) and limits of detection. Two different APIs are targeted in this study: (i) Flurbiprofen® (FLU), a chiral non-steroidal anti-inflammatory drug where the (S)-form possesses most of the beneficial anti-inflammatory activity,40 and (ii) Efavirenz® (EFA), a chiral drug whose (S)-isomer is a non-nucleoside inhibitor of human immunodeficiency virus (HIV) reverse transcriptase (see Scheme 1).41 These two bioactive chiral molecules involve various chemical functions: FLU is a biphenyl propionic carboxylic acid while EFA is mainly characterized by a carbamate function into a benzoxazine ring, as well as a difference of fluorine moiety: a single fluorine in FLUversus a trifluoromethyl group (–CF3) in EFA. In addition, the fluorinated group used for the enantiomeric discrimination is directly bound to the stereogenic center in EFA whereas the latter is located further away in the case of FLU. Interestingly, while EFA undergoes restricted degrees of freedom, FLU is a more flexible molecule which can experience conformational changes upon interaction with PBLG side chains.42 This may lead to different chiral recognition mechanisms between these two APIs with respect to the CLC. From an analytical point of view, all these chemical characteristic differences make FLU and EFA very well-suited analytes to test the versatility of PBLG mesophase when applied to the analysis of pharmaceutical compounds.
 | ||
| Scheme 1 Molecular structures of (a) Flurbiprofen® (FLU) and (b) Efavrienz® (EFA) and (c) PBLG polymer, along with the molecular weights (MW). The star indicates the position of the stereogenic center in each structure. | ||
Experimental
Chemicals and preparation of oriented samples
(R)-Flurbiprofen was purchased at Acros Organics with a purity of 97%. rac-Flurbiprofen was purchased at Sigma-Aldrich (Merck) with a purity of 98%. (S)-Efavirenz was purchased at TCI with a purity of 98%. rac-Efavirenz was purchased at Toronto Research Chemical (TRC) with a purity of 97%. The PBLG polymer (Lot SLBZ3570 with a degree of polymerization DP = 849) was purchased at Aldrich (Merck). All compounds were used with any further purification.The oriented samples were prepared directly in the NMR tube by mixing the chiral analyte (<30 mg), the PBLG (nearby 100 mg) and the organic co-solvent (CHCl3). The amount of chloroform (about 600 mg) was here adjusted so that the total weight% of PBLG (i.e., mass of PBLG/total mass) was maintained at around 14%, and the sample length reached 4 cm. The exact sample compositions are given in Table SI-1 in ESI.† The 5 mm NMR tube was then fire-sealed to avoid CHCl3 evaporation over time and several low-speed centrifugation cycles of the sample (e.g., 500 rpm during 20 s) were carried out to remove matter gradients. The tube was inverted between each centrifugation.
NMR equipment and experiments
19F NMR experiments were performed on a 7.05 T (ν0(19F) = 282.4 MHz) Bruker NEO spectrometer equipped with a 5 mm BBFO probe or on a 9.4 T (ν0(19F) = 376.5 MHz) Bruker AV1 spectrometer equipped with a 5 mm QXO probe. As this probe is not tunable for the 19F emission–reception, resulting in a significant sensitivity penalty, the analytical performance for the ee% determination was evaluated at 7.1 T with the BBFO probe.19F–{1H} NMR spectra were recorded with a 90° radiofrequency pulse of 15 μs at 282.4 MHz and of 111 μs at 376.4 MHz, and the classical WALTZ-16 sequence was used as 1H composite pulse decoupling. Free induction decay (FID) was sampled during 0.85 s and 0.55 s for FLU and EFA samples, respectively. The inter-scan delay was adjusted to reach a repetition time TR ∼ 1.25 × T1 (19F) for optimal signal-to-noise-ratio (SNR) per time unit. Given the short experimental duration (e.g., 10 s), 19F–{1H} spectra are not impacted by the natural B0 field drift, and hence all experiments were carried out in the absence of deuterium lock. Shimming procedure was performed manually or using an automatic shimming procedure on the 1H signal of chloroform to optimize the signal line-shape. The achievement of this last step highly depends on the spatial uniformity of the liquid-crystalline phase.43 The recorded FIDs are then processed on Mnova 14.2 (Mestrelab, Spain) including zero-filling (128k datapoints), filtering window, Fourier Transform, manual phasing and a polynomial (order 5) baseline correction. Specific experimental parameters and processing details are directly indicated in each figure caption.Measurement of the enantiomeric excess and line-fitting procedure
The enantiomeric excess (ee) is experimentally determined as: | (7) |
Results and discussion
19F {1H} NMR spectra of FLU and EFA in weakly chiral oriented media
In any oriented media, monofluorinated compounds as FLU give rise only to a singlet centred on 19F δaniso on the 1H-decoupled 19F NMR spectrum, while the trifluoromethyl group (–CF3) of EFA leads to a triplet (1![[thin space (1/6-em)]](https://www.rsc.org/images/entities/char_2009.gif) :2:1) centred on 19F δaniso. The splitting between lines is equal to TFF = 3DFF, due to the geminal 19F–19F residual dipolar coupling, noted (19F–19F)-RDC or DFF, between the three homotopic 19F nuclei (see Fig. 1b). The herein notation TFF corresponds to the 19F homonuclear total spin–spin coupling constant including only a dipolar contribution here. Note that in case of two diastereotopic (anisochronous) fluorine nuclei, the splitting observed for each doublet is equal to TFF = JFF + 2DFF. In case of coupled fluorine nuclei in polyfluorinated molecules, enantiomers can be thus discriminated by a difference of 19F δaniso(R, S), a variation of residual dipolar coupling: ΔTFF(R, S) or a combination of both.
:2:1) centred on 19F δaniso. The splitting between lines is equal to TFF = 3DFF, due to the geminal 19F–19F residual dipolar coupling, noted (19F–19F)-RDC or DFF, between the three homotopic 19F nuclei (see Fig. 1b). The herein notation TFF corresponds to the 19F homonuclear total spin–spin coupling constant including only a dipolar contribution here. Note that in case of two diastereotopic (anisochronous) fluorine nuclei, the splitting observed for each doublet is equal to TFF = JFF + 2DFF. In case of coupled fluorine nuclei in polyfluorinated molecules, enantiomers can be thus discriminated by a difference of 19F δaniso(R, S), a variation of residual dipolar coupling: ΔTFF(R, S) or a combination of both.
 | ||
| Fig. 1 Schematic description of 19F spectral patterns expected to be observed by 19F NMR in isotropic (a) and anisotropic media (b): (left) case of an isolated fluorine nucleus; (middle) case of three homotopic nuclei as met in a trifluoromethyl group; (right) case of two diastereotopic fluorine nuclei. Note the difference to spin–spin total coupling, TFF, between homotopic (middle) and diastereotopic atom (right). Here is considered a deshielded effect of 19F resonances (of various magnitudes) due to 19F-RCSA. In case of a chiral solute dissolved in chiral oriented systems, a doubling of resonances (in the simplest case) is expected to be observed. The vertical scale is common to both isotropic and anisotropic media in the three cases (left, middle and right). | ||
The former situation is observed on a racemic sample of FLU (see Fig. 2a) where the signals of enantiomers are separated by a difference of chemical shift anisotropy: 19F |Δδaniso(R, S)| = 0.051 ppm, while the (R)- and (S)-isomers of a racemic sample of EFA are discriminated by variations of 19F-RCSA: 19F |Δδaniso(R, S)| = 0.085 ppm and (19F–19F)-RDC: |ΔTFF(R, S)| = 12.1 Hz as shown in Fig. 2b. The linewidth is of the order of 2–3 Hz at half-maximum in these spectra, which underlines the satisfactory resolution obtained in such lyotropic CLCs. Note the weak lines marked by black stars in Fig. 2a do not arise from fluorinated impurities, but rather to satellite lines owing to short and long-range (13C–19F)-RDCs. Assignment of these signals to the multiple 13C-isotopomers is detailed in ESI-III.†
 | ||
| Fig. 2 282.4 MHz 19F–{1H} NMR spectra on 20 mg of racemic FLU (a) and EFA (b) dissolved in a PBLG/CHCl3 based lyotropic liquid crystal. The assignment of the stereodescriptors R and S relies on further experiments performed on scalemic samples. The black stars at the bottom of NMR lines correspond to 13C–19F satellite lines (see details in ESI-III†). | ||
Study of parameters affecting the spectral enantiomeric discrimination
The potential role of the analyte concentration on the resulting values of 19F-RCSA and (19F–19F)-RDC has been little investigated so far, since it is generally considered as a guest molecule with minor impacts on the orienting properties of the mesophase. To explore this effect, anisotropic 19F–{1H} NMR experiments are carried out on a series of samples with a growing amount of (S)-EFA from 5.8 mg (0.046 mol L−1) to 30.3 mg (0.24 mol L−1), while the mass percentage of PBLG is kept constant nearby 14% (see Table SI-1†). The spectra of Fig. 3 show a large increase of both 19F-RSCA and (19F–19F)-RDC as the concentration in (S)-EFA decreases. Besides, the offset from the 19F δiso value varies from 0.080 to 0.560 ppm (i.e., +600%), while |TFF| increases from 13.9 to 131.7 Hz (i.e., +847%). Such a large variation in RDC quantities is not calculated for the co-solvent CHCl3, whose the associated total coupling |TCH| only varies from 309 to 315 Hz (i.e., 1.9% variation) for samples from 0.16 to 0.045 mol L−1 in EFA, which rules out a destabilization of the mesophase with the increasing amount of solute. In addition, analysis of 1H self-diffusion experiments (1H DOSY NMR)44,45 under isotropic conditions has also precluded any possibility of concentration-dependent self-aggregation leading to a conformational change in EFA. Details are given in ESI-VII.†
 | ||
| Fig. 3 (a) Series of 19F–{1H} NMR spectra recorded at 376.5 MHz with various amounts of (S)-EFA while the PBLG total weight% remains fixed at around 14%. The vertical dashed line indicates the 19F chemical shift of the –CF3 group in isotropic condition (i.e., in CDCl3). (b) Variation of |TFF| as a function of the concentration in EFA. | ||
Two arguments can be put forward to explain the variation in (19F–19F)-RDC in methyl group by simply considering the order parameter associated with the C–CF3 vector:
 | (8) |
(i) A change of SC–CF3 induced by a reorientation of the C–CF3 axis of the solute with a subsequent modification of the angle  between the C–CF3 vector and the magnetic field B0. This can lead to a significant increase of RDC, especially if
  is initially closed to the magic angle (i.e., 54.7°), (ii) a modification of the ensemble average 〈…〉 as a function of the solute concentration. This ensemble average can be seen, in a first approximation, as a fast exchanging system where:
 | (9) |
 interacting with the chiral polymer and pf the fraction of free solute (pb + pf = 1) in the co-solvent with a negligible orientational order
 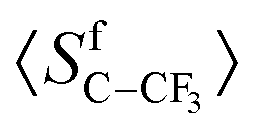 . Whenever the polymer interacting sites are saturated, an increase in solute concentration would lead to a smaller fraction pb of solutes in the vicinity of the polymer chains and therefore to lower values of anisotropic observables. A combination of both effects could thus explain the observed variation in (19F–19F)-RDC while their relative contributions cannot be determined at this level.
In a second step, it is interesting to investigate the impact of the solute concentration when the two enantiomers are present in the chiral liquid crystal. At first, 19F–{1H} NMR experiments are performed on a series of racemic samples prepared with various amounts of FLU, from 4.8 to 30.0 mg, corresponding to a 0.025–0.153 mol L−1 concentration range for each enantiomer. Table 1 shows clearly the effect of solute concentration on the enantiomeric discrimination with an increase of 19F |Δδaniso(R, S)| from 0.040 to 0.072 ppm for the highest and lowest concentration, respectively. In this case, diluted samples lead to a better spectral separation, which is an interesting analytical feature as the sensitivity of 19F NMR enables experiments at relatively low concentrations. Furthermore, 19F–{1H} spectra are recorded on three different scalemic samples (ee(R) = 9.6, 58.2 and 88.7%) prepared with a fixed total amount of FLU (i.e., 30 mg). As seen in Table 1, the variation of 19F-RCSA progressively increases as a function of the enantiomeric excess: 19F |Δδaniso(R, S)| = 0.054 ppm for ee(R) = 9.6% and 0.082 ppm for ee(R) = 89.5%. This effect of the enantiomeric excess on the resulting 19F–{1H} spectra is also visible for EFA as pointed out in Fig. SI-3† where in one hand 19F |Δδaniso(R, S)| = 0.095 ppm and |ΔTFF(R, S)| = 7.8 Hz for ee(S) = 71.5%, while 19F |Δδaniso(R, S)| = 0.109 ppm and |ΔTFF(R, S)| = 4.8 Hz for ee(S) = 90.5% in another hand.
| m(FLU)a (mg) | ee(R) (%) | 19F |Δδaniso(R, S)| (ppm) |
|---|---|---|
| a Total mass of FLU: m(R-FLU) + m(S-FLU). b All experiments were carried out with 14% (wt) of PBLG and at 297 K. | ||
| 30.0 | 0.0 | 0.0403 |
| 20.2 | 0.0 | 0.0507 |
| 14.8 | 0.0 | 0.0549 |
| 10.2 | 0.0 | 0.0706 |
| 4.8 | 0.0 | 0.0720 |
| 30.0 | 0.0 | 0.0403 |
| 29.9 | 9.6 | 0.0543 |
| 30.8 | 58.2 | 0.0670 |
| 30.4 | 88.7 | 0.0820 |
 | ||
| Fig. 4 Effect of the temperature on the enantiomeric discrimination by variation of 19F-RCSA evaluated on a 30 mg racemic sample of FLU dissolved in PBLG/CHCl3. | ||
 | ||
| Fig. 5 (a and b) Effect of the temperature on 19F-RCSA and (19F–19F)-RDC evaluated on a 20 mg racemic sample of EFA dissolved in PBLG/CHCl3, respectively. These anisotropic observables experience a linear variation with similar slopes between the two enantiomers resulting in no variation of 19F |Δδaniso(R, S)| and |ΔTFF(R, S)| in this range of temperatures. | ||
A more intriguing effect is observed in the case of scalemic samples of EFA (e.g. ee(S) = 90.5%) where 19F-RCSA and (19F–19F)-RDC evolve differently from one enantiomer to another with respect to the temperature. While |TFF(S)| (major enantiomer) increases linearly with this parameter, as observed in the racemic sample, the evolution of |TFF(R)| is more complex with a drop close to zero Hz at 310 K before increasing again at higher temperatures (see Fig. 6). Fundamentally, this non-linear variation suggests a modification of the average orientation of the (R)-isomer within the liquid-crystalline phase, leading to a change in enantiomeric discrimination. In addition to this enantiospecific variation of (19F–19F)-RDC, the 19F δaniso(S) and 19F δaniso(R) evolve linearly with the temperature, but at different rates resulting in 19F |Δδaniso(R, S)| = 0.116 ppm at 300 K versus 0.099 ppm at 320 K.
 | ||
| Fig. 6 Effect of the temperature monitored on a 30 mg scalemic sample of EFA (ee(S) = 90.5%) dissolved in PBLG/CHCl3. In contrast to the racemic series, different evolutions of 19F-RCSA and (19F–19F)-RDC are observed from one enantiomer to another leading to variations of signal patterns. The variation of both anisotropic parameters is given in Table SI-3.† | ||
Overall, these results highlight the significant impact of solute concentration, enantiomeric ratio and temperature on the enantiomeric resolution of these 19F NMR experiments in lyotropic chiral liquid crystals.
Measurements of enantiomeric excesses and analytical performance on APIs
The determination of enantiopurity of APIs by NMR is a major analytical challenge based on the ee% measurement that is by essence a quantitative measurement. Understanding and mastering all the potential experimental biases deserve therefore a real attention. For instance, it is well known that the repetition time (TR) between successive scans should be long enough to prevent a partial saturation between the targeted analytes. When anisotropic 19F–{1H} NMR is concerned, it is usually addressed by fixing this duration at five times the longer Taniso1(19F) measured at the expense of the experimental duration and/or signal-to-noise ratio (SNR).Another possible bias may occur when 1H-decoupling in the heteronuclear experience is applied and leads to a differential nuclear Overhauser effect (nOe) between analytes. To limit this effect, it is recommended to apply the 1H decoupling only during the 19F signal detection period (“inverse gated” experiment). However, these two usual requirements may be alleviated in the case of relative quantification of enantiomers. Indeed, relaxation properties are similar between the two enantiomers and no significant differences of relaxation times have been so far reported in lyotropic liquid crystals, at the best of our knowledge. Taniso1(19F) have been determined for the R and S-isomers of both FLU (Taniso1(19F) = 1.2 s) and EFA (Taniso1(19F) = 0.5 s) by the inversion–recuperation method and no differences (greater than the fitting error) have ever been observed between enantiomers. This allows to work with a smaller repetition time (TR ≈ 1.25 × Taniso1(19F)) which provides the optimal SNR per time unit without a systematic quantitative bias. Interestingly, this condition therefore improves the method's detection limit for a given experimental duration.
19F–{1H} NMR experiments (NS = 8, i.e. Texp ≈ 10 s) were carried out on both racemic and scalemic series to evaluate the accuracy of enantiomeric excess measurements in different spectral situations. The experimental ee% are derived as in eqn (7) and the signal integration is performed by a line-fitting procedure (see Fig. 7) as described in the Experimental section. The deviation from the expected values of the measurements (i.e., the trueness) is assessed on racemic samples since the expected ee = 0% does not suffer from potential weighting uncertainties during the sample preparation. The precision (here defined as short term repeatability) is evaluated by the standard deviation (SD%) computed on series of at least seven successive NMR experiments. Scalemic samples are also considered to evaluate the performance of the method on more challenging cases, such as ee ≈ 90%, where large differences of signal area between lines imperfectly resolved are detrimental for an accurate ee% determination.
 | ||
| Fig. 7 Examples of 282.4 MHz 19F–{1H} spectra (NS = 8) of scalemic samples of FLU (a) and EFA (b) in PBLG/CHCl3 at 300 K after line-fitting procedure. Both samples contain a total content of 30 mg of analyte. The reconstructed spectrum (pink line) is well superposed to the experimental one (brown line) leading to an almost flat residue curve (red line). The individual signal components (blue lines) can be extracted for computing the experimental value of ee%. | ||
In the case of FLU (see Table 2), the trueness evaluated on the racemic sample is lower than 1% (0.8%), which validates the absence of significant biases from partial saturation (TR ≈ 1.25 × T1(19F)) whenever a trueness of 1% is targeted. The SNR achieved under these experimental conditions (Texp ≈ 10 s) is of the order of 103 and remains higher than 300 even for the minor enantiomer at ee = 88.7%. The resulting precision (i.e., SD%) is better than 0.5% for all the FLU samples (see Table 2). It could also be noted that precision is not affected by the ee% to be measured, which suggests that the uncertainty mainly relies on the line-fitting procedure, rather than a lack of SNR for the minor enantiomer. For scalemic samples, the trueness remains lower than 1% until ee(R) = 58.2%, but increasing significantly at ee(R) = 88.7% where a deviation of −4.2% is observed. This deviation can arise from an imperfect Lorentzian lineshape of experimental signals causing weak line-fitting errors, which become detrimental for the trueness at very high ee%, whenever enantiomeric signals are not perfectly baseline-separated. In the case of EFA (see Table 3), the trueness evaluated on the racemic sample is better than 0.5%, which demonstrates again the absence of biases of the proposed method. This good performance is also extended in the case of scalemic samples since the measured values of ee% lie in the acceptable interval with deviation lower than 0.5% from the expected values. Table 3 also gives the SNR values associated with the (R)- and (S)-isomers for a racemic and two scalemic samples of EFA. Such fast 19F NMR experiments enable a minimal SNR value of about 200 for the minor R-isomer in a sample with ee(S) = 90.5%. This leads to standard deviations lower than 0.5%, even at the highest enantiomeric excess (i.e., ee(S) = 90.5%) highlighting the high precision of this fast 19F NMR method.
| ee Theo.(R)b (%) | ee Exp.(R)c (%) | Deviationd (%) | SDe (%) | SNR (S) | SNR (R) |
|---|---|---|---|---|---|
| a The total mass of API is nearby 30 mg in all samples. Measurements are achieved by 19F–{1H} NMR experiment of ≈10 s (NS = 8) at 7.05 T (ν0 = 282.4 MHz). b Values given with 95% confidence intervals due to weighing uncertainties for scalemic samples. c Mean value of seven successive experiments. d Computed as eeExp − eeTheo. e Standard deviation computed on seven successive experiments. | |||||
| 0.0 | 0.8 | 0.8 | 0.32 | 1854 | 1839 |
| 9.6 ± 0.7 | 9.5 | −0.1 | 0.40 | 1691 | 2130 |
| 58.2 ± 0.8 | 57.3 | −0.9 | 0.22 | 891 | 3019 |
| 88.7 ± 1.1 | 84.5 | −4.2 | 0.23 | 337 | 3465 |
| ee Theo.(S)b (%) | ee Exp.(S)c (%) | Deviationd (%) | SDe (%) | SNR (S) | SNR (R) |
|---|---|---|---|---|---|
| The footnotes (a–e) are identical to footnotes of Table 2. | |||||
| 0.0 | −0.4 | −0.4 | 0.37 | 1762 | 1743 |
| 71.5 ± 0.9 | 71.7 | 0.2 | 0.50 | 2816 | 517 |
| 90.5 ± 1.1 | 90.9 | 0.4 | 0.35 | 3686 | 191 |
 | (10) |
 | ||
| Fig. 8 Estimated LOD according to the magnetic field B0 of the spectrometer with fixed experimental durations Texp (a) and as a function of Texp for given B0 values (b). The LOD curves are extrapolated viaeqn (10) from the experimental LOD of EFA (black cross). | ||
Conclusion
Proposing new, effective and reliable tools for the analysis of active pharmaceutical ingredients is one of today's challenges for the research academic laboratories and pharmaceutical industrial ones, with major societal implications for human health. In this work, we have assessed, for the first time, the analytical potential of 19F NMR in lyotropic PBLG-based CLCs to determine enantiomeric excesses on two (patented) chiral drugs (mono- and polyfluororinated) in pharmacopeia, Efavirenz and Flurbiprofen, using a routine NMR equipment.Results in terms of spectral enantiodiscriminations are very promising with potential applications in pharmaceutical analytical laboratories. First, the determination of the ee% is obtained with a precision better than 0.5% and a trueness better than 1% (at the exception of one sample) in a high-throughput context (experimental durations ≤ 10 s) and routine NMR setup operating at moderate magnetic fields (e.g., 7.05 T, conventional NMR probe) with a limit of detection of 42 μg mL−1 (i.e., 0.17 μmol mL−1) for FLU, and 50 μg mL−1 (i.e., 0.16 μmol mL−1) for EFA, in such experimental conditions. Second, the use of anisotropic NMR interactions such as the 19F–19F residual dipolar couplings of methyl groups, whose amplitude is not related to the magnetic field strength, eases the method transfer at lower magnetic fields. This aspect could make enantiomeric analysis with benchtop NMR spectrometers possible in the near future.
This first study on API has also explored the significant role of the liquid crystal composition, especially the chiral analyte concentration on the resulting 19F-RCSA and (19F–19F)-RDC values, and showing higher values of 19F anisotropic observables on diluted samples as well as variations of the enantiomeric discrimination according to the ee%. The analysis of the effect of temperature indicates a slight improvement of the spectral discrimination of enantiomers of FLU at 297 K compared to higher temperatures whereas this parameter should be adjusted to avoid detrimental peak-overlaps in the case of EFA. The whole understanding of the complex interplay between mesophase composition and sample temperature on the average orientation of analyte and discrimination mechanisms, and thus on the measured residual anisotropic observables, is still an on-going challenge under investigation.
Author contributions
All authors contributed equally to this work. The manuscript was written through contributions of all authors. All authors have given approval to the final version of the manuscript.Conflicts of interest
The authors declare no conflict of interest.Acknowledgements
The authors thank Paris-Saclay University and CNRS for their recurrent funding as well as the Ile-de-France region for the SESAME “CRYOMORPHOSE 2022” grant to upgrade NMR equipment of ICMMO's scientific plateform. This work was supported in part by the French National Research Agency: ANR INENDRA project, grant ANR-23-CE29-0005-01, from November 2023. They also acknowledge Valentin Henriet and Benoit Kuate-Wafo who participated to this projet during their internship. Finally, we would like to thank the referees for their comments and suggestions.References
- B. S. Sekhon, J. Mod. Med. Chem., 2013, 1, 10–36 CAS.
- E. Sanganyado, Z. Lu, Q. Fu, D. Schlenk and J. Gan, Water Res., 2017, 124, 527–542 CrossRef CAS PubMed.
- W. H. Brooks, W. C. Guida and K. G. Daniel, Curr. Top. Med. Chem., 2011, 11, 760–770 CrossRef CAS PubMed.
- A. Calcaterra and I. D'Acquarica, J. Pharm. Biomed. Anal., 2018, 147, 323–340 CrossRef CAS PubMed.
- E. L. Izake, J. Pharm. Sci., 2007, 96, 1659–1676 CrossRef CAS PubMed.
- M. Thunhorst and U. Holzgrabe, Magn. Reson. Chem., 1998, 36, 211–216 CrossRef CAS.
- M. Shamsipur, L. S. Dastjerdi, S. Haghgoo, D. Armspach, D. Matt and H. Y. Aboul-Enein, Anal. Chim. Acta, 2007, 601, 130–138 CrossRef CAS PubMed.
- M. Pérez-Trujillo and A. Virgili, Tetrahedron: Asymmetry, 2006, 17, 2842–2846 CrossRef.
- P. Borowiecki, Tetrahedron: Asymmetry, 2015, 26, 16–23 CrossRef CAS.
- J. Redondo, A. Capdevila and S. Ciudad, Chirality, 2013, 25, 780–786 CrossRef CAS PubMed.
- T. Wang, Q. Liu, M. Wang, J. Zhou, M. Yang, G. Chen, F. Tang, E. Hatzakis and L. Zhang, Anal. Chem., 2020, 92, 3636–3642 CrossRef CAS PubMed.
- V. K. Vashistha and R. Bhushan, Tetrahedron: Asymmetry, 2015, 26, 304–311 CrossRef CAS.
- R. N. Rao and K. Santhakumar, New J. Chem., 2016, 40, 8408–8417 RSC.
- T. J. Wenzel, in Stereoselective Synthesis of Drugs and Natural Products, ed. V. Andrushko and N. Andrushko, John Wiley & Sons, Inc., Hoboken, NJ, USA, 2013, pp. 1–24 Search PubMed.
- T. J. Wenzel and J. D. Wilcox, Chirality, 2003, 15, 256–270 CrossRef CAS PubMed.
- D. Parker, Chem. Rev., 1991, 91, 1441–1457 CrossRef CAS.
- T. R. Hoye, C. S. Jeffrey and F. Shao, Nat. Protoc., 2007, 2, 2451–2458 CrossRef CAS PubMed.
- S. Jang and H. Kim, Org. Lett., 2020, 22, 4185–4189 CrossRef CAS PubMed.
- L.-P. Li and B.-H. Ye, Inorg. Chem., 2017, 56, 10717–10723 CrossRef CAS PubMed.
- M. D. McCreary, D. W. Lewis, D. L. Wernick and G. M. Whitesides, J. Am. Chem. Soc., 1974, 96, 1038–1054 CrossRef CAS.
- L. Zhang, A. F. Martins, P. Zhao, M. Tieu, D. Esteban-Gómez, G. T. McCandless, C. Platas-Iglesias and A. D. Sherry, J. Am. Chem. Soc., 2017, 139, 17431–17437 CrossRef CAS PubMed.
- H. Dodziuk, W. Koźmiński and A. Ejchart, Chirality, 2004, 16, 90–105 CrossRef CAS PubMed.
- S. Jang and H. Kim, Org. Lett., 2020, 22, 7804–7808 CrossRef CAS PubMed.
- B. Huang, L. Xu, N. Wang, J. Ying, Y. Zhao and S. Huang, Anal. Chem., 2022, 94, 1867–1873 CrossRef CAS PubMed.
- L. Xu, Q. Wang, Y. Liu, S. Fu, Y. Zhao, S. Huang and B. Huang, Analyst, 2023, 148, 4548–4556 RSC.
- B. Huang, L. Xu, J. Ying, Y. Zhao and S. Huang, Anal. Chim. Acta, 2022, 1230, 340402 CrossRef CAS PubMed.
- G. Gu, C. Zhao, W. Zhang, J. Weng, Z. Xu, J. Wu, Y. Xie, X. He and Y. Zhao, Anal. Chem., 2024, 96, 730–736 CrossRef CAS PubMed.
- A. Saupe and G. Englert, Phys. Rev. Lett., 1963, 11, 462–464 CrossRef CAS.
- P. Lesot, C. Aroulanda, P. Berdagué, A. Meddour, D. Merlet, J. Farjon, N. Giraud and O. Lafon, Prog. Nucl. Magn. Reson. Spectrosc., 2020, 116, 85–154 CrossRef CAS PubMed.
- C. Aroulanda and P. Lesot, Chirality, 2022, 34, 182–244 CrossRef CAS PubMed.
- B. Luy, J. Indian Inst. Sci., 2010, 90, 119–132 CAS.
- P. Tzvetkova, B. Luy and S. Simova, Topics in chemistry and material science, 2011, vol. 5, pp. 70–77 Search PubMed.
- P. Lesot, P. Berdagué, A. Meddour, A. Kreiter, M. Noll and M. Reggelin, ChemPlusChem, 2019, 84, 144–153 CrossRef CAS PubMed.
- G. W. Li, X.-J. Wang, S.-H. Shi, L.-T. Liu, J.-Q. Li, H. Sun, Z.-Q. Wu and X. Lei, Anal. Chem., 2023, 95, 18850–18858 CrossRef CAS PubMed.
- P. Berdagué, J.-E. Herbert-Pucheta, V. Jha, A. Panossian, F. R. Leroux and P. Lesot, New J. Chem., 2015, 39, 9504–9517 RSC.
- M. Inoue, Y. Sumii and N. Shibata, ACS Omega, 2020, 5, 10633–10640 CrossRef CAS PubMed.
- M. Jakubcova, A. Meddour, J.-M. Péchiné, A. Baklouti and J. Courtieu, J. Fluor. Chem., 1997, 86, 149–153 CrossRef CAS.
- V. Madiot, P. Lesot, D. Grée, J. Courtieu and R. Grée, Chem. Commun., 2000, 169–170 RSC.
- A. R. Phillips and G. J. Sharman, Chem. Commun., 2004, 1330–1331 RSC.
- N. M. Davies, Clin. Pharmacokinet., 1995, 28, 100–114 CrossRef CAS PubMed.
- V. Namasivayam, M. Vanangamudi, V. G. Kramer, S. Kurup, P. Zhan, X. Liu, J. Kongsted and S. N. Byrareddy, J. Med. Chem., 2019, 62, 4851–4883 CrossRef CAS PubMed.
- M. E. D. Pietro, C. Aroulanda, G. Celebre, D. Merlet and G. D. Luca, New J. Chem., 2015, 39, 9086–9097 RSC.
- P. Trigo-Mouriño, C. Merle, M. R. M. Koos, B. Luy and R. R. Gil, Chem. – Eur. J., 2013, 19, 7013–7019 CrossRef PubMed.
- R. Ferrazza, B. Rossi and G. Guella, J. Phys. Chem. B, 2014, 118, 7147–7155 CrossRef CAS PubMed.
- A. Pérez, D. de Saá, A. Ballesteros, J. L. Serrano, T. Sierra and P. Romero, Chem. – Eur. J., 2013, 19, 10271–10279 CrossRef PubMed.
Footnote |
| † Electronic supplementary information (ESI) available: (i) NMR sample composition, ee(%) and uncertainty; (ii) assignment of 13C–19F satellites on 19F–{1H} spectra of FLU in PBLG/CHCl3; (iii) further 19F–{1H} spectra of EFA at different ee% or temperature; (v) limits of detection (LOD). See DOI: https://doi.org/10.1039/d4an00237g |
| This journal is © The Royal Society of Chemistry 2024 |