 Open Access Article
Creative Commons Attribution 3.0 Unported Licence
Biochemical changes in lipid and protein metabolism caused by mannose-Raman spectroscopy studies
Monika
Kopeć
 *,
Karolina
Beton-Mysur
 and
Halina
Abramczyk

Lodz University of Technology, Institute of Applied Radiation Chemistry, Laboratory of Laser Molecular Spectroscopy, Wroblewskiego 15, 93-590 Lodz, Poland. E-mail: monika.kopec@p.lodz.pl; Tel: +48426313188
First published on 8th April 2024
Abstract
Biochemical analysis of human normal bronchial cells (BEpiC) and human cancer lung cells (A549) has been performed by using Raman spectroscopy and Raman imaging. Our approach provides a biochemical compositional mapping of the main cell components: nucleus, mitochondria, lipid droplets, endoplasmic reticulum, cytoplasm and cell membrane. We proved that Raman spectroscopy and Raman imaging can distinguish successfully BEpiC and A549 cells. In this study, we have focused on the role of mannose in cancer development. It has been shown that changes in the concentration of mannose can regulate some metabolic processes in cells. Presented results suggest lipids and proteins can be considered as Raman biomarkers during lung cancer progression. Analysis obtained for bands 1444 cm−1, and 2854 cm−1 characteristic for lipids and derivatives proved that the addition of mannose reduced levels of these compounds. Results obtained for protein compounds based on bands 858 cm−1, 1004 cm−1 and 1584 cm−1 proved that the addition of mannose increases the values of protein in BEpiC cells and blocks protein glycolisation in A549 cells. Noticing Raman spectral changes in BEpiC and A549 cells supplemented with mannose can help to understand the mechanism of sugar metabolism during cancer development and could play in the future an important role in clinical treatment.
Introduction
Both the morbidity and deaths caused by cancer are major challenges for modern medicine in the world.1–3 According to the statistics in recent years, a significant increase in the morbidity and deaths of lung cancer has been observed.4,5 Reports published by the World Health Organization (WHO) announce that lung cancer in the year 2020 was the second most common type of diagnosed cancer (2.21 million cases) and the most common cause of cancer death (1.80 million deaths) worldwide.6 Morbidity in lung cancer is associated with several factors.7–10 One of the most important risk factors leading to lung cancer is smoking.11–13 Literature reports indicate that smoking significantly increases the odds of lung cancer.14,15 Other important risk factors that incident for lung cancer are: age, sex, genetic factors, air pollution and an unhealthy diet.16–20The type of treatment for lung cancer is dependent on above all: types of cancer, the cancer size, the age and the health of the patient. The most common clinical treatment for lung cancer is surgery. Other used techniques for lung cancer treatment are chemotherapy, radical radiotherapy targeted therapy or a combination of these treatments.21–25
Mannose is a simple hexose sugar. Mannose naturally occurs in the human body and plays an important role in biological processes. First of all, mannose takes part in the immunoregulation process but the major function of this sugar is the glycosylation of proteins.26–30 Mannose can be found especially in fruits and vegetables.31
During the last few years, the role of mannose in human health has been described in numerous papers.32,33 According to recent reports the protective role of mannose is noticed especially in: cancer,34 diabetes,35 autoimmune diseases36,37 and urinary tract infections.38,39 P. S. Gonzales et al. conducted research in animals on the role of monosaccharide mannose in a few types of cancer.40 Y. Wang et al. have studied the effect of mannose on lung cells.41 They found that mannose has anticancer activity in cells through changes in metabolism pathways.42 The effect on mannose in lung cancer cells has been studied also by J. Sha et al. Their results show that mannose inhibits the proliferation and growth of cancer cells.42 The antitumoural properties of mannose in lung cancer have been reported in recent years by numerous investigators: Q. Luo et al.,43 J. H. Lee et al.,44 Y. J. Oh et al.45 and by X.-L. Xu et al.46 Simultaneously, literature reports show not only the antitumor properties of mannose in lung cancer. Several studies described also the protective role of mannose on breast cancer cell migration47,48 prostate cancer49 and pancreatic cancer.50 The role of mannose has been also studied in urinary tract infections.51–54 F. Scaglione et al. described the mechanisms through which sugars act to highlight the regulatory aspects relevant to resolving the administrative category of healthcare products placed on the market.55
It is known that mannose forms an essential building block of protein glycosylation in cells. In our previous manuscript, we studied glycosylation metabolism in breast and brain human tissues.56 Now we extended our analysis of human cells supplemented with mannose. The aim of this article is twofold. First, we provide a new simple and quick methodology to control the metabolism of sugars in human bronchial and lung cancer. Second, we focus on the biochemical changes of BEpiC and A549 human cells caused by incubation with mannose.
Materials and methods
Chemical compounds
D-(+)-Mannose M6020-100G was purchased from Merck Life Science Sp. z o.o.Phosphate Buffered Saline (PBS, Gibco, 10010023, pH 7.4 at 25 °C, 0.01 M)
Cell culturing
A549 cell line (CCL-185™) was purchased from ATCC: the Global Bioresource Center and cultured using ATCC-formulated Kaighn's Modification of Ham's F-12 Medium, contains L-glutamine and sodium bicarbonate. To make the complete growth medium, Fetal Bovine Serum (FBS) was added to a final concentration of 10%.Human Bronchial Epithelial Cells (BEpiC) was purchased from Innoprot. The BEpiC cells were isolated from human healthy bronchi and cultured using dedicated Bronchial Epithelial Cell Medium with 2% serum content.
The biological safety of the A549 and BEpiC cell lines has been classified by the American Biosafety Association (ABSA) as level 1 (BSL-1).
Cultivation conditions
The cell lines (A549, BEpiC) used in the experiments in this study were grown in flat-bottom culture flasks made of polystyrene with a cell growth surface of 75 cm2. Culture flasks for BEpiC cell line additionally were coated with collagen I. Culture flasks with cells were stored in an incubator providing environmental conditions at 37 °C, 5% CO2, 95% air. The culture medium was renewed from 2 to 3 times a week.Cell treatment with mannose
Cells used for research were seeded onto CaF2 windows (25 × 1 mm) at a low density of 104 cells per cm2. After 24 h incubation on the CaF2, the standard growth medium was removed, and mannose solution diluted in the medium in concentrations 50 μM, 5 mM and 100 mM was added for 24 h. After this time, the cells were rinsed with PBS and then cells were fixed by Formaldehyde (4% buffered formalin) for 10 min and washed once more with PBS. The Raman confocal measurements were made immediately after the fixation of the samples. All the mannose solutions used for the supplementation procedure in the investigation were prepared by diluting the compound in the pure culture medium. For the preparation of mannose solutions, powdered reagents were used, from which samples were prepared to finally obtain a solution with concentrations of 50 μM, 5 mM and 100 mM.Raman imaging
Raman imaging and Raman spectra were performed using a confocal Raman microscope WITec alpha 300 RSA+ (Ulm, Germany) equipped with 532 nm excitation wavelength (laser diode (SHG of the Nd:YAG laser)), UHTS (Ultra High Throughput Spectrometer) spectrometer and a CCD Camera (Andor Newton DU970N-UVB-353) operating in standard mode with 1600 × 200 pixels at −60 °C with full vertical binning. For single cells measurement 40× Nikon water dipping objective (NA = 1.0) was used. The power of the laser used for measurements was 10 mW. The Raman images for A549 and BEpiC cells were recorded with an integration time 0.3 s in the high-frequency region and 0.5 s in the fingerprint region. Acquisition and preprocessing of the data (cosmic rays removing, smoothing and removing background) were performed with WITec Project Plus software. To prepare a Raman imaging cluster, the Cluster Analysis (CA) method was used. A detailed description of Cluster Analysis is presented in our previous papers.57–59 Briefly CA is a method of exploratory data analysis in which observations are divided into different groups (names clusters) that have some common characteristics—vibrational features in our case. The partition of n observations (x) into k (k ≤ n) clusters S should be done to minimize the variance (Var) based on the formula:where μi is the mean of experimental points. In our analysis, the number of clusters was 7. Each cluster is characterized by specific average Raman spectra, which reveal the inhomogeneous distribution of the sample.
Statistical analysis
All Raman spectra presented in the manuscript were normalized in Origin by using a model divided by norm.60–62The normalization, model: divided by norm (divide the spectrum by the dataset norm) was performed by using Origin software according to the formula:
where: vn is the nthV values.
Statistically significant differences (labeled as *) between analyzed cell groups were prepared in Origin by using the ANOVA analysis (test-Tukey, at significance level-0.05).
Results and discussion
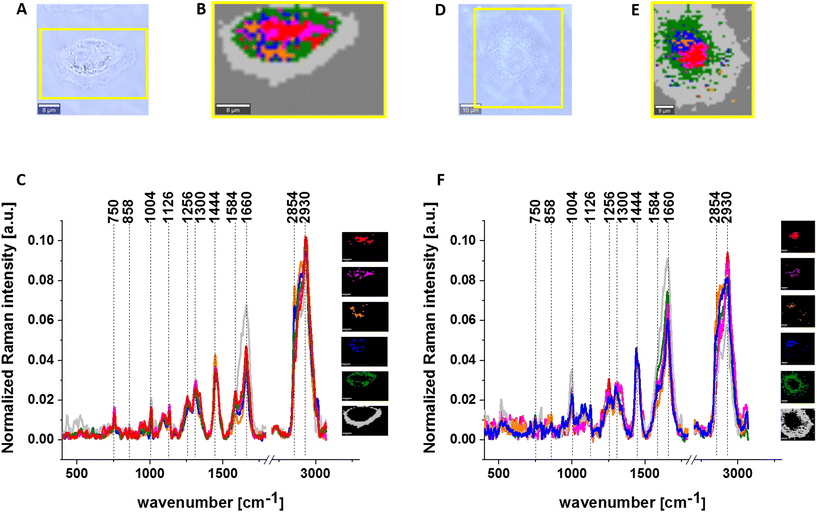
First, we investigated the biochemical composition of control human normal bronchial cells (BEpiC) and human cancerous lung cells (A549) by using Raman spectroscopy and Raman imaging. Using the Cluster Analysis method (CA) to analyze cells we have identified the main biochemical components. The red cluster characterizes nucleus, the magenta cluster characterizes mitochondrium, the blue cluster characterizes lipid droplets, the orange cluster characterizes endoplasmic reticulum, the green cluster characterizes cytoplasm and the gray cluster characterizes cells membrane.Fig. 1 shows the comparison between the white-light image, Raman map and normalized Raman spectra of a human normal bronchial cell (BEpiC) and white-light image, Raman map and normalized Raman spectra of a human cancer lung cell (A549).
One can see from Fig. 1 that the spectra are dominated by peaks at 750 cm−1, 858 cm−1, 1004 cm−1, 1126 cm−1, 1260 cm−1, 1309 cm−1, 1444 cm−1, 1584 cm−1, 1656 cm−1, 1660 cm−1, 2854 cm−1 2928 cm−1 and 2930 cm−1. These bands represent the major classes of essential compounds which are present in living organisms: glycans (858 cm−1), phenylalanine (1004 cm−1), cytochromes (750 cm−1, 1126 cm−1, 1584 cm−1), lipids (1309 cm−1, 2854 cm−1), cholesterol (1444 cm−1), proteins (1260 cm−1, 1660 cm−1, 2936 cm−1).56,58,63–66 To better visualize the biochemical differences between human normal bronchial and cancerous lung cells for every organelle the difference spectra have been prepared.
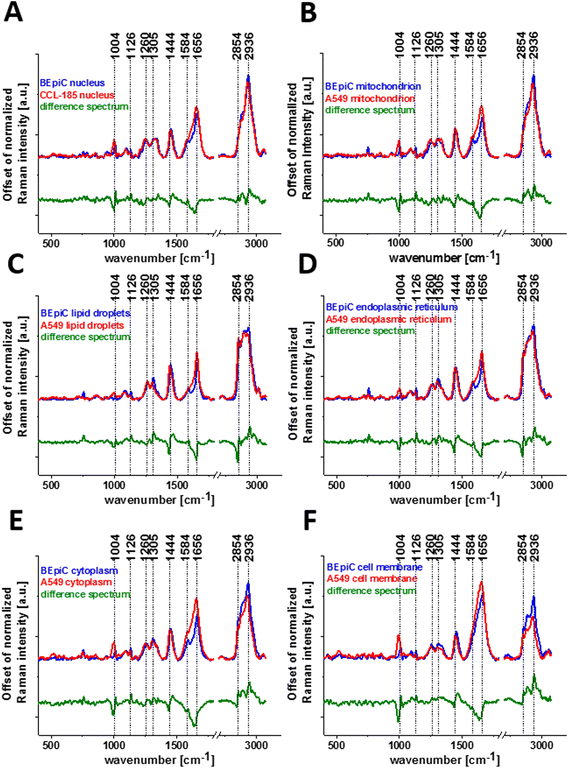
Fig. 2 presents the average normalized Raman spectra for A549 (red line) and BEpiC cells (blue line) and the normalized difference Raman spectra (BEpiC-A549) (green line) for nucleus (panel A), mitochondrium (panel B), lipid droplets (panel C), endoplasmic reticulum (panel D), cytoplasm (panel E) and cell membrane (panel F).
Detailed inspection of the Raman spectra, presented in Fig. 2, for human normal bronchial cells and human cancer lung cells shows several differences, which will be used in our studies. In the view of results presented in Fig. 2, it is visible that the main differences between A549 and BEpiC cell lines are visible in bands at 750 cm−1, 858 cm−1, 1004 cm−1, 1444 cm−1, 1660 cm−1, 2854 cm−1 and 2936 cm−1.
First, let us analyze the peaks with a negative correlation. One can see from Fig. 2 that the negative correlation on the difference spectra is observed for peaks characteristic for phenylalanine, glycans and amid I. The band characteristic for phenylalanine (1004 cm−1) is negative on the difference spectrum for every organelle, which confirms the higher contribution of proteins for human cancerous lung cell line A549. Another band with a negative correlation in difference spectra is at 858 cm−1 characteristic for glycans. This effect can be explained that glycans are involved in fundamental molecular and cell biology processes occurring in cancer and are a biomarker that regulates the development and progression of cancer.67 The same tendency is observed for the band at 1660 cm−1 characteristic for amid I. The higher protein status of cancerous cells has been shown in the literature for many organs including breast, brain and lung.68,69
Now let us focus to the analyze the band with a positive correlation in the difference spectra. One can see from Fig. 2 that the positive correlation on the difference spectra is observed for peaks characteristic for cytochrome c and b, cholesterol and lipids. The first band with a positive correlation is for peaks at 750 cm−1 characteristic for cytochrome c and b. This effect is particularly strong in mitochondria, lipid droplets, endoplasmic reticulum and cytoplasm. Another band with a positive correlation is observed for the peaks at 1444 cm−1 characteristic for cholesterol. This correlation is well visible for every organelle. The same correlation is visible for bands at 2854 cm−1 characteristic for lipids. It has been proved by numerous groups that lipids can be considered as a biomarker in cancer diagnosis.70–74
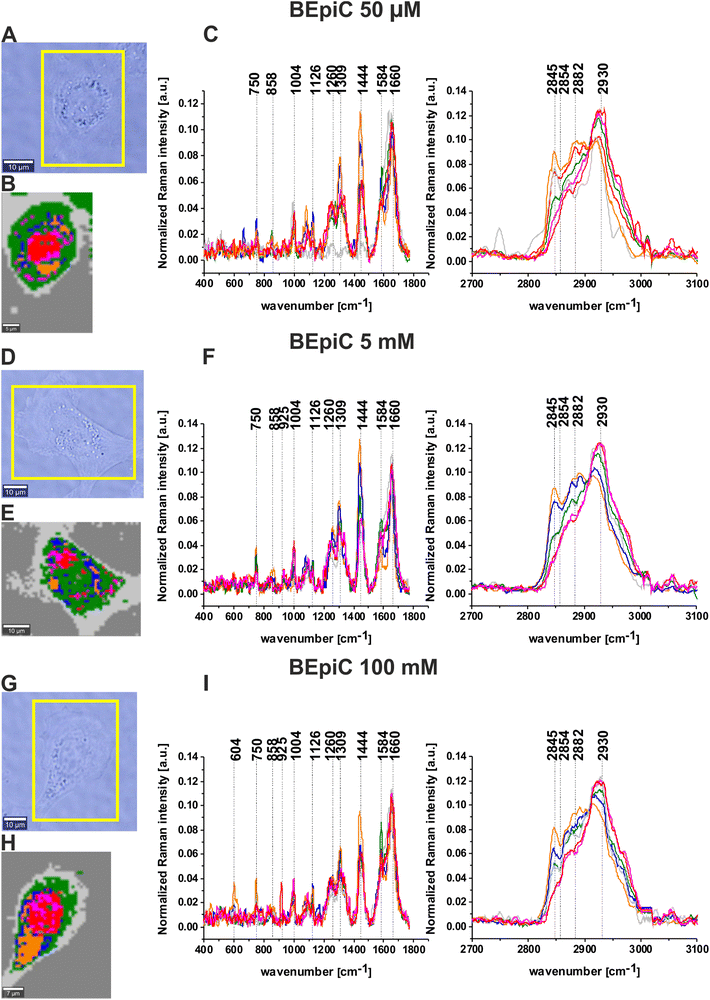
During our analysis, we decided to check the influence of mannose on normal human bronchial cells (BEpiC) and cancer human lung cells (A549). Fig. 3 presents white-light images, Raman images and normalized Raman spectra for BEpiC cells supplemented with 50 μM mannose (panels A, B, C), 5 mM mannose (panels D, E, F) and 100 mM mannose (panels G, H, I).
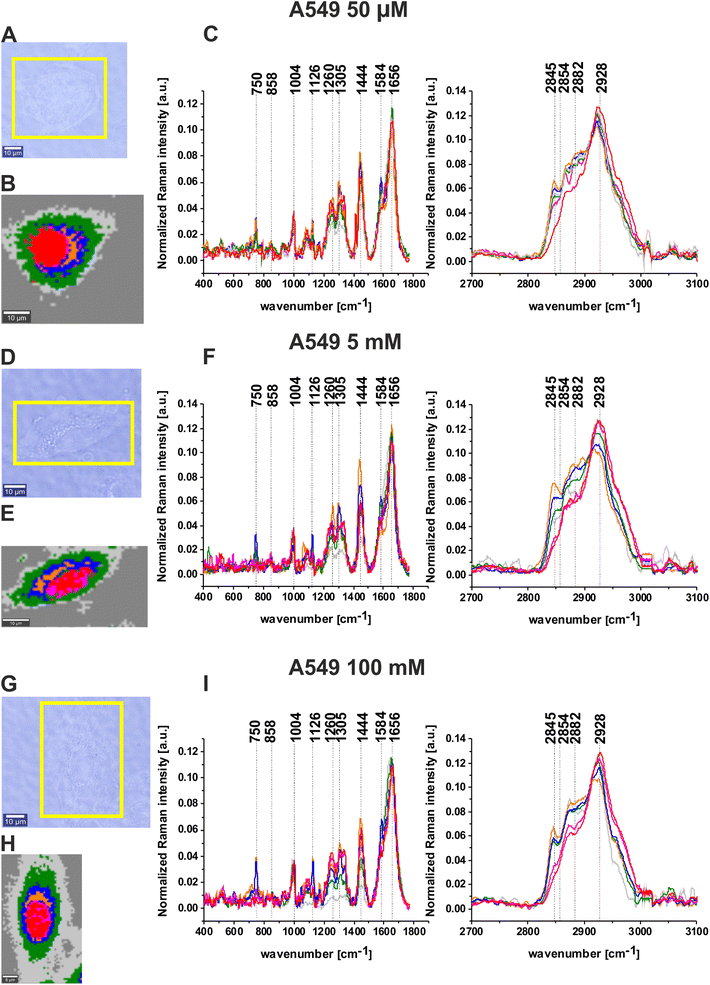
The same analysis was performed for human cancer lung cells (A549) after supplementation with mannose. Fig. 4 presents white-light images, Raman images and normalized Raman spectra for A549 cells supplemented with 50 μM mannose (panels A, B, C), 5 mM mannose (panels D, E, F) and 100 mM mannose (panels G, H, I).
One can see from Fig. 3 and 4 that there are almost perfect matches between microscopy images and created Raman maps. Cluster analysis method allows to visualization of not only the main cell organelles: nucleus, mitochondria, lipid droplets, endoplasmic reticulum, cytoplasm cell membrane but also to obtain biochemical information. Comparing results obtained for supplemented cells in the fingerprint region the peaks are the most intense for lipid droplets and endoplasmic reticulum structures. Analyzing the high-frequency region one can see that the peak at 2845 cm−1 characteristic for lipids is more intense for BEpiC cells than for A549 cells. Moreover, this peak is the most intense for lipid droplets and endoplasmic reticulum (blue and orange line). Another peaks at 2930 cm−1 in BEpiC cells and 2928 cm−1 in A549 cells are the most intense for nucleus (red line) and mitochondria (magenta line).
The main role of cells for energy generation is connected with glucose. The role of other sugars, in cellular metabolism, especially mannose is not widely described in the literature. The metabolic pathway of mannose is presented in Fig. 5. In a few words, mannose enters into cells by glucose transporters (GLUT). After transport within the cell hexose in the first step is phosphorylated to mannose-6-phosphate by hexokinase. Then mannose-6-phosphate can be converted to fructose-6-phosphate and then to the glycolysis process or can be converted to mannose-1-phosphate. In the next step, mannose-1-phosphate is condensed by GDP-mannose pyrophosphorylase to GDP-mannose and onto glycoproteins.75
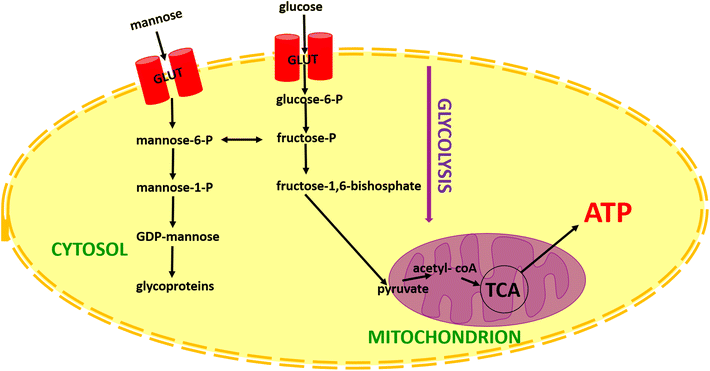 | ||
| Fig. 5 Schematic comparison of glucose and mannose metabolism. Explanation of the abbreviations from the scheme: TCA: tricarboxylic acid cycle (Krebs cycle); ATP: Adenosine triphosphate. | ||
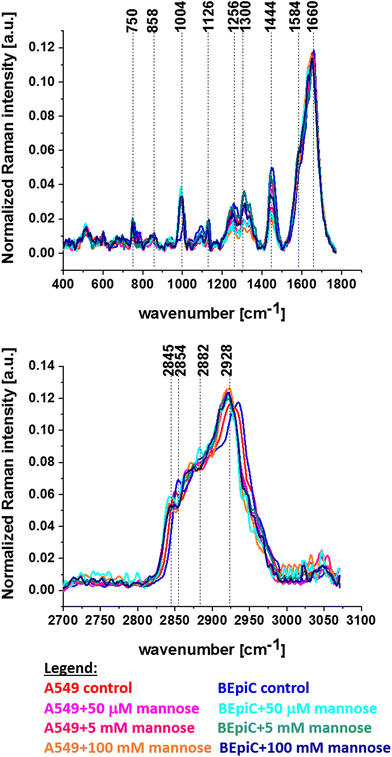
In this manuscript, we will try to illustrate how mannose affects cell metabolism. To control the effect of different concentrations of mannose on A549 and BEpiC cell lines the average normalized Raman spectra have been prepared and compared. Fig. 6 presents the average normalized Raman spectra for control A549, control BEpiC cells and A549 and BEpiC supplemented with 50 μM, 5 mM and 100 mM mannose.
From the results presented in Fig. 3, 4 and 6, one can see that the most relevant differences between human normal bronchial cells and human cancer lung cells are associated with bands characteristic of two macromolecular compound groups: lipids and proteins. Firstly we focus on a detailed analysis of bands characteristic for lipids and their derivatives.
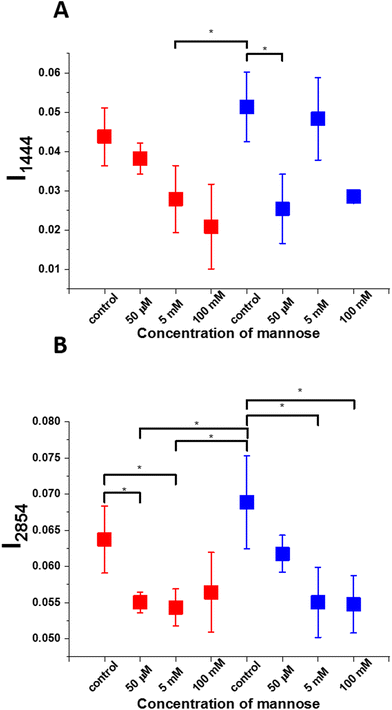
To better understand the biochemical changes that occur in the metabolism of A549 and BEpiC cells after supplementation with mannose in various concentrations (50 μM, 5 mM and 100 mM) we decided to check the normalized Raman intensity bands characteristic for cholesterol (1444 cm−1) and lipids (2854 cm−1). Fig. 7 presents the intensity and standard deviation for bands 1444 cm−1 (panel A), 2854 cm−1 (panel B). The illustrated results are based on Raman average normalized spectra for each type of cell obtained during Raman imaging. Asterix * means that the differences are statistically significant, p values ≤ 0.05.
Based on the data presented in Fig. 6 one can see that the intensity of the peak at 2854 cm−1 is the highest for control BEpiC cells. Such a result is not surprising because the amount of lipids in healthy cells is broadly reported.76–78 The same tendency is observed for peaks at 1444 cm−1. The comparison between control healthy bronchial and control cancer human lung cells and healthy bronchial and cancer human lung cells after incubation with mannose shows that adding sugars effectively decreases the cell's lipids level. Increased intensity in 5 mM concentration can be explained by the fact that it oscillates near the optimal one for the cell and enables diffusion by cell membranes. 50 μM concentration is lower than the necessary physiological one. The highest concentration represents hypertonic conditions during which transport by membranes is interrupted and the cell can succumb to shrinkage and its proliferation may be inhibited or, in critical conditions, even stopped. The intensity of bands at 1444 cm−1 and 2854 cm−1 are higher for control cells in comparison to cells incubated with mannose. (Fig. 7 panels A, B).
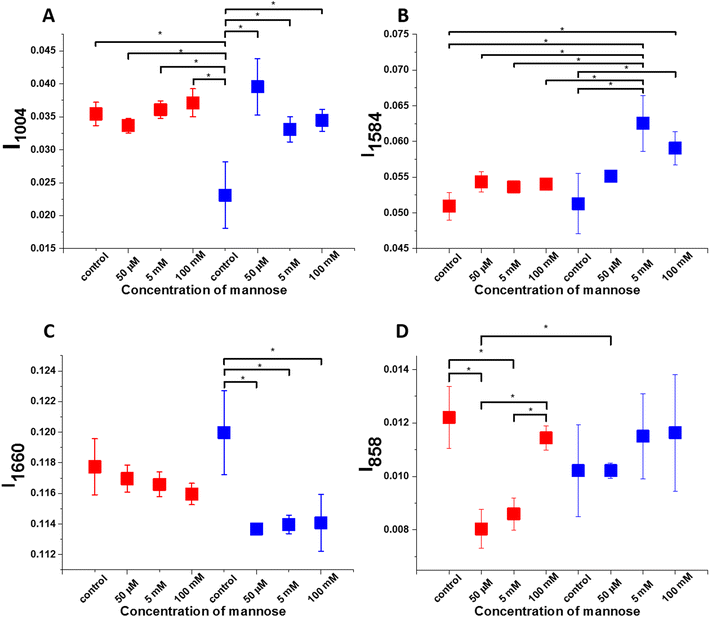
After noticing differences observed for lipids in human normal bronchial cells and human cancer lung cells upon supplementation with mannose we decided to check changes in protein compounds. Fig. 8 presents the intensity and standard deviation for bands 1004 cm−1 (panel A), 1584 cm−1 (panel B), 1660 cm−1 (panel C) and 858 cm−1 (panel D). The illustrated results are based on Raman average spectra for each type of cell obtained during Raman imaging. Asterix * means that the differences are statistically significant, p values ≤ 0.05.
Based on data presented in Fig. 8 one can see significant differences in protein composition between control human normal bronchial and control cancer lung cells and human normal bronchial and cancer lung cells after incubation with mannose. One can notice that the intensity of the Raman band at 1004 cm−1 characteristic for phenylalanine has the lowest value for control BEpiC cells. The intensity of the band at 1004 cm−1 in control cancer cells is practically the same after the supplementation with mannose. (Fig. 8 panel A). Now let us focus on the analysis of the band at 1584 cm−1 characteristic for cytochrome c. One can see that supplementation with mannose changed the amount of cytochrome c. This observation is expected. After the addition of sugar, the intensity of the band at 1584 cm−1 both for A549 and BEpiC cells is higher in comparison to control cells. (Fig. 8 panel B). The role of cytochrome c in cancer development is described in the literature.58,59,79–81 In our previous manuscript we reported that the Raman signal at 1584 cm−1 at normal physiological conditions is dominated by cytochrome c.58,79,82 We showed that upon cancer development in tissue (in contrast to in vitro cells) the Raman signal at 1584 cm−1 of cytochrome c increases spectacularly. The intensity for the band at 1660 cm−1 is the highest for control BEpiC cells. After supplementation with mannose, the intensity is lower. It is known that mannose forms an essential building block of protein glycosylation in cells. In the case of the A549 cell line, the intensity of the band at 1660 cm−1 has not changed after supplementation with mannose. Now let us focus on analyzing band characteristics for glycans. One can see from Fig. 8 panel D that after the addition of sugar, the intensity of the band at 858 cm−1 in A549 cells is lower in comparison to cells before supplementation. (Fig. 8 panel D). Moreover the Raman signal at 858 cm−1 increases with mannose concentration. Simultaneously, in human normal bronchial cells (BEpiC) we don't observe spectacular differences in the intensity of the band at 858 cm−1 after the supplementation with sugar. Changes in glycan structure depending on the cell line are expected. In our previous manuscript, we have analyzed glycoforms in the breast and brain tissues. We reported two glycoforms in the normal breast tissue and the malignant brain tissue in contrast to the breast cancer tissue where only one glycoform has been identified.56
One can see from Fig. 6–8 that selected bands characteristic of lipids and protein derivatives are useful for discriminating between human normal bronchial (BEpiC) and human cancer (A549) lung cells and metabolism changes after supplementation with mannose.
Conclusions
Changes in cell metabolism are one of the most critical attributes that are connected which cancer development. First, we have examined the biochemical composition of control normal bronchial cells BEpiC and cancer A549 lung cells by using Raman spectroscopy and Raman imaging. Recorded Raman images allow for visualization of the main cellular organelles: nucleus, mitochondria, lipid droplets, endoplasmic reticulum, cytoplasm and cell membrane.In the second part of the paper, we have identified biochemical changes in single normal and cancer cells caused by different doses of mannose. We have examined the effect of treatment with mannose in human normal bronchial BEpiC and cancer A549 lung cells by using Raman spectroscopy and Raman imaging. We proved that lipids and proteins are two main groups of chemical compounds whose content can not only differentiate between healthy and cancer cells but also allow us to check metabolic changes in cells after supplementation with mannose. Among lipids groups Raman bands at 1444 cm−1 and 2854 cm−1 can be used as biomarkers to track biochemical changes in cells after supplementation with mannose in normal and pathological conditions. We have demonstrated that based on bands 1004 cm−1, 1584 cm−1, 1660 cm−1 and 858 cm−1 characteristic for protein and their derivatives Raman spectroscopy allows us to observe the changes associated with cancer development and upon supplementation with mannose. We have noticed that the amount of cytochrome c (at 1584 cm−1) is higher in normal cells after supplementation with mannose. We showed that the amount of glycans (at 858 cm−1) is higher in cancer cells when compared with the cancer cells after supplementation with mannose. Incubation in vitro with mannose increases the amount of glycans with mannose concentration. Raman studies confirm that mannose is a sugar that can be used in the treatment of cancer.
Finally, we have proved that Raman spectroscopy and Raman imaging are effective methods for monitoring and controlling the biochemical composition of cells involved in cancer development by analyzing unique spectral signatures of vibrations. Nonetheless, despite our promising findings, there are several limitations of our analysis and avenues of further work that should be explored to establish Raman spectroscopy and Raman imaging as a tool to understand the mechanism of sugar metabolism during cancer development. Future studies should be expanded using additional standard analytical techniques to assess changes in the content of various components (lipids, proteins) to confirm the potential of the application of Raman signatures as biomarkers of biochemical changes in cells caused by mannose and confirm the reliability of the chemical analyses carried out based on the analysis of such complex Raman spectra.
Author contributions
Conceptualization: M. K.; funding acquisition: M. K.; H. A. investigation: M. K., K. B. M.; methodology: M. K., K. B. M., writing – original draft: M. K.; manuscript editing: M. K.; manuscript reviewing: M. K., H. A. All authors reviewed and provide feedback on the manuscripts. All authors have read and agreed to the published version of the manuscript.Conflicts of interest
The authors declare no conflict of interest.Acknowledgements
This work was supported by the “FU2N-Fund for the Improvement of the Skills of Young Scientists” supporting the scientific excellence of the Lodz University of Technology-grant no. W3/2P/2022 and by the National Science Centre of Poland (Narodowe Centrum Nauki, UMO-2021/43/B/ST4/01547).References
- J. Zugazagoitia, C. Guedes, S. Ponce, I. Ferrer, S. Molina-Pinelo and L. Paz-Ares, Current Challenges in Cancer Treatment, Clin Ther., 2016, 38(7), 1551–1566, DOI:10.1016/j.clinthera.2016.03.026.
- M. Ferrari, Cancer nanotechnology: Opportunities and challenges, Nat. Rev. Cancer, 2005, 5(3), 161–171, DOI:10.1038/nrc1566.
- R. Baskar, K. A. Lee, R. Yeo and K. W. Yeoh, Cancer and radiation therapy: Current advances and future directions, Int. J. Med. Sci., 2012, 9(3), 193–199, DOI:10.7150/ijms.3635.
- X. Chen, S. Mo and B. Yi, The spatiotemporal dynamics of lung cancer: 30-year trends of epidemiology across 204 countries and territories, BMC Public Health, 2022, 22(1), 1–13, DOI:10.1186/s12889-022-13281-y.
- K. C. Thandra, A. Barsouk, K. Saginala, J. S. Aluru and A. Barsouk, Epidemiology of lung cancer, Contemp. Oncol., 2021, 25(1), 45–52, DOI:10.5114/wo.2021.103829.
- https://www.who.int/news-room/fact-sheets/detail/cancer .
- N. Li, Z. Cheng, Y. Woo, J. Ha and A. Kim, Analysis of lung cancer morbidity and mortality based on particle swarm optimization, J. Phys.: Conf. Ser., 2020, 1629, 1–6, DOI:10.1088/1742-6596/1629/1/012043.
- C. S. Dela Cruz, L. T. Tanoue and R. A. Matthay, Lung cancer: epidemiology, etiology, and prevention, Clin. Chest. Med., 2011, 32(4), 605–644, DOI:10.1016/j.ccm.2011.09.001.
- C. Leduc, D. Antoni, A. Charloux, P. E. Falcoz and E. Quoix, Comorbidities in the management of patients with lung cancer, Eur. Respir. J., 2017, 49(3), 1–12, DOI:10.1183/13993003.01721-2016.
- M. B. Schabath and M. L. Cote, Cancer Progress and Priorities: Lung Cancer, Cancer Epidemiol., Biomarkers Prev., 2019, 28(10), 1563–1579, DOI:10.1158/1055-9965.EPI-19-0221.
- T. Walser, X. Cui and J. Yanagawa, et al. Smoking and lung cancer: the role of inflammation, Proc. Am. Thorac. Soc., 2008, 5(8), 811–815, DOI:10.1513/pats.200809-100TH.
- L. M. O'Keeffe, G. Taylor, R. R. Huxley, P. Mitchell, M. Woodward and S. A. E. Peters, Smoking as a risk factor for lung cancer in women and men: a systematic review and meta-analysis, BMJ Open, 2018, 8(10), e021611, DOI:10.1136/bmjopen-2018-021611.
- P. Zhang, P. L. Chen and Z. H. Li, et al. Association of smoking and polygenic risk with the incidence of lung cancer: a prospective cohort study, Br. J. Cancer, 2022, 126(11), 1637–1646, DOI:10.1038/s41416-022-01736-3.
- J. V. Aredo, S. J. Luo and R. M. Gardner, et al. Tobacco Smoking and Risk of Second Primary Lung Cancer, J. Thorac. Oncol., 2021, 16(6), 968–979, DOI:10.1016/j.jtho.2021.02.024.
- N. T. Tanner, N. A. Thomas and R. Ward, et al. Association of Cigarette Type with Lung Cancer Incidence and Mortality: Secondary Analysis of the National Lung Screening Trial, JAMA Intern. Med., 2019, 179(12), 1710–1712, DOI:10.1001/jamainternmed.2019.3487.
- M. L. Coté, M. Liu and S. Bonassi, et al. Increased risk of lung cancer in individuals with a family history of the disease: A pooled analysis from the International Lung Cancer Consortium, Eur. J. Cancer, 2012, 48(13), 1957–1968, DOI:10.1016/j.ejca.2012.01.038.
- A. J. Alberg, M. V. Brock, J. G. Ford, J. M. Samet and S. D. Spivack, Epidemiology of lung cancer: Diagnosis and management of lung cancer, 3rd ed: American College of Chest Physicians evidence-based clinical practice guidelines, Chest, 2013, 143(5 Suppl), e1S–e29S, DOI:10.1378/chest.12-2345.
- J. Shen, H. Zhou and J. Liu, et al. A modifiable risk factors atlas of lung cancer: A Mendelian randomization study, Cancer Med., 2021, 10(13), 4587–4603, DOI:10.1002/cam4.4015.
- N. P. Mbeje, T. Ginindza and N. Jafta, Epidemiological Study of Risk Factors for Lung Cancer in KwaZulu-Natal, South Africa, Int. J. Environ. Res. Public Health, 2022, 19(11), 1–13, DOI:10.3390/ijerph19116752.
- A. Matakidou, T. Eisen and R. S. Houlston, Systematic review of the relationship between family history and lung cancer risk, Br. J. Cancer, 2005, 93(7), 825–833, DOI:10.1038/sj.bjc.6602769.
- B. I. Hiddinga, J. Raskin, A. Janssens, P. Pauwels and J. P. Van Meerbeeck, Recent developments in the treatment of small cell lung cancer, Eur. Respir. Rev., 2021, 30(161), 1–14, DOI:10.1183/16000617.0079-2021.
- S. C. Spiro and G. A. Silvestri, One hundred years of lung cancer, Am. J. Respir. Crit. Care Med., 2005, 172(5), 523–529, DOI:10.1164/rccm.200504-531OE.
- R. M. Vidaver, M. B. Shershneva, S. J. Hetzel, T. R. Holden and T. C. Campbell, Typical Time to Treatment of Patients With Lung Cancer in a Multisite, US-Based Study, J. Oncol. Pract., 2016, 12(6), e643–e653, DOI:10.1200/JOP.2015.009605.
- W.J. Petty and L. Paz-Ares, Emerging Strategies for the Treatment of Small Cell Lung Cancer: A Review, JAMA Oncol., 2022 DOI:10.1001/jamaoncol.2022.5631 , Published online.
- L. M. Wintner, J. M. Giesinger and A. Zabernigg, et al. Quality of life during chemotherapy in lung cancer patients: Results across different treatment lines, Br. J. Cancer, 2013, 109(9), 2301–2308, DOI:10.1038/bjc.2013.585.
- I. Loke, D. Kolarich, N. H. Packer and M. Thaysen-Andersen, Emerging roles of protein mannosylation in inflammation and infection, Mol. Aspects Med., 2016, 51, 31–55, DOI:10.1016/j.mam.2016.04.004.
- M. O. Sheikh, S. M. Halmo and L. Wells, Recent advancements in understanding mammalian O-mannosylation, Glycobiology, 2017, 27(9), 806–819, DOI:10.1093/glycob/cwx062.
- M. B. Vester-Christensen, A. Halim and H. J. Joshi, et al. Mining the O-mannose glycoproteome reveals cadherins as major O-mannosylated glycoproteins, Proc. Natl. Acad. Sci. U. S. A., 2013, 110(52), 21018–21023, DOI:10.1073/pnas.1313446110.
- T. V. Denisenko, I. N. Budkevich and B. Zhivotovsky, Cell death-based treatment of lung adenocarcinoma article, Cell Death Dis., 2018, 9(2), 1–14, DOI:10.1038/s41419-017-0063-y.
- G. S. Jones and D. R. Baldwin, Recent advances in the management of lung cancer, Clin. Med., 2018, 18(Suppl 2), s41–s46, DOI:10.7861/clinmedicine.18-2-s41.
- X. Hu, Y. Shi, P. Zhang, M. Miao, T. Zhang and B. Jiang, d-Mannose: Properties, Production, and Applications: An Overview, Compr. Rev. Food Sci. Food Saf., 2016, 15(4), 773–785, DOI:10.1111/1541-4337.12211.
- M. Dhanalakshmi, D. Sruthi, K. R. Jinuraj, K. Das, S. Dave, N. M. Andal and J. Das, Mannose: a potential saccharide candidate in disease management, Med. Chem. Res., 2023, 32(3), 391–408, DOI:10.1007/s00044-023-03015-z.
- Z. Wei, L. Huang, L. Cui and X. Zhu, Mannose: Good player and assister in pharmacotherapy, Biomed. Pharmacother., 2020, 129, 110420, DOI:10.1016/j.biopha.2020.110420.
- E. D. Vedove, G. Costabile and O. M. Merkel, Mannose and Mannose-6-Phosphate Receptor–Targeted Drug Delivery Systems and Their Application in Cancer Therapy, Adv. Healthcare Mater., 2018, 7(14), 1–19, DOI:10.1002/adhm.201701398.
- Y.-B. Shi and D. Yin, A good sugar, d-mannose, suppresses autoimmune diabetes, Cell Biosci., 2017, 7, 48, DOI:10.1186/s13578-017-0175-1.
- A. Tsutsumi, R. Takahashi and T. Sumida, Mannose binding lectin: Genetics and autoimmune disease, Autoimmun. Rev., 2005, 4(6), 364–372, DOI:10.1016/j.autrev.2005.02.004.
- V. Pradhan, P. Surve and K. Ghosh, Mannose binding lectin (MBL) in autoimmunity and its role in systemic lupus Erythematosus (SLE), J. Assoc. Physicians India, 2010, 58(11), 688–690 Search PubMed.
- T. E. Cooper, C. Teng, M. Howell, A. Teixeira-Pinto, A. Jaure and G. Wong, D-mannose for preventing and treating urinary tract infections, Cochrane Database Syst. Rev., 2022, 2022(8) DOI:10.1002/14651858.CD013608.pub2.
- R. Ala-Jaakkola, A. Laitila, A. C. Ouwehand and L. Lehtoranta, Role of D-mannose in urinary tract infections – a narrative review, Nutr. J., 2022, 21(1), 1–16, DOI:10.1186/s12937-022-00769-x.
- P. S. Gonzalez, J. O'Prey and S. Cardaci, et al. Mannose impairs tumour growth and enhances chemotherapy, Nature, 2018, 563(7733), 719–723, DOI:10.1038/s41586-018-0729-3.
- Y. Wang, S. Xie and B. He, Mannose shows antitumour properties against lung cancer via inhibiting proliferation, promoting cisplatin.mediated apoptosis and reducing metastasis, Mol. Med. Rep., 2020, 22(4), 2957–2965, DOI:10.3892/mmr.2020.11354.
- J. Sha, D. Cao and R. Cui, et al. Mannose impairs lung adenocarcinoma growth and enhances the sensitivity of A549 cells to carboplatin, Cancer Manage. Res., 2020, 12, 11077–11083, DOI:10.2147/CMAR.S278673.
- Q. Luo, B. Li and G. Li, Mannose Suppresses the Proliferation and Metastasis of Lung Cancer by Targeting the ERK/GSK-3β/β-Catenin/SNAIL Axis, OncoTargets Ther., 2020, 13, 2771–2781, DOI:10.2147/OTT.S241816.
- J. H. Lee, S. B. Lee, H. Kim, J. M. Shin, M. Yoon, H. S. An and J. W. Han, Anticancer Activity of Mannose-Specific Lectin, BPL2, from Marine Green Alga Bryopsis plumosa, Mar. Drugs, 2022, 20, 12, DOI:10.3390/md20120776.
- Y. J. Oh, M. W. Dent and A. R. Freels, et al. Antitumor activity of a lectibody targeting cancer-associated high-mannose glycans, Mol. Ther., 2022, 30(4), 1523–1535, DOI:10.1016/j.ymthe.2022.01.030.
- X.-L. Xu, P. Zhang and Y.-H. Shen, et al. Mannose prevents acute lung injury through mannose receptor pathway and contributes to regulate PPARγ and TGF-β1 level, Int. J. Clin. Exp. Pathol., 2015, 8(6), 6214–6224 Search PubMed.
- K. Ščupáková, O. T. Adelaja and B. Balluff, et al. Clinical importance of high-mannose, fucosylated, and complex N-glycans in breast cancer metastasis, JCI Insight., 2021, 6(24) DOI:10.1172/jci.insight.146945.
- T. Bernig, B. J. Boersma and T. M. Howe, et al. The mannose-binding lectin (MBL2) haplotype and breast cancer: An association study in African-American and Caucasian women, Carcinogenesis, 2007, 28(4), 828–836, DOI:10.1093/carcin/bgl198.
- Y.-L. Deng, R. Liu and Z.-D. Cai, et al. Mannose inhibits the growth of prostate cancer through a mitochondrial mechanism, Asian J. Androl., 2022, 24(5), 540–548, DOI:10.4103/aja2021104.
- H. Zhang, S. A. Patel, E. Kandil, C. M. Mueller, Y.-Y. Lin and M. E. Zenilman, Pancreatic elastase is proven to be a mannose-binding protein–implications for the systemic response to pancreatitis, Surgery, 2003, 133(6), 678–688, DOI:10.1067/msy.2003.175.
- F. Wagenlehner, H. Lorenz, O. Ewald and P. Gerke, Why d-Mannose May Be as Efficient as Antibiotics in the Treatment of Acute Uncomplicated Lower Urinary Tract Infections-Preliminary Considerations and Conclusions from a Non-Interventional Study, Antibiotics, 2022, 11(3) DOI:10.3390/antibiotics11030314.
- F. Parazzini, E. Ricci, F. Fedele, F. Chiaffarino, G. Esposito and S. Cipriani, Systematic review of the effect of D-mannose with or without other drugs in the treatment of symptoms of urinary tract infections/cystitis (Review), Biomed. Rep., 2022, 17(2) DOI:10.3892/br.2022.1552.
- C. De Nunzio, R. Bartoletti, A. Tubaro, A. Simonato and V. Ficarra, Role of D-Mannose in the Prevention of Recurrent Uncomplicated Cystitis: State of the Art and Future Perspectives, Antibiotics, 2021, 10(4) DOI:10.3390/antibiotics10040373.
- A. Pani, L. Valeria, S. Dugnani, M. Senatore and F. Scaglione, Pharmacodynamics of D-mannose in the prevention of recurrent urinary infections, J. Chemother., 2022, 34(7), 459–464, DOI:10.1080/1120009X.2022.2061184.
- F. Scaglione, U. M. Musazzi and P. Minghetti, Considerations on D-mannose Mechanism of Action and Consequent Classification of Marketed Healthcare Products, Front. Pharmacol., 2021, 12, 1–7, DOI:10.3389/fphar.2021.636377.
- M. Kopec, A. Imiela and H. Abramczyk, Monitoring glycosylation metabolism in brain and breast cancer by Raman imaging, Sci. Rep., 2019, 1–13, DOI:10.1038/s41598-018-36622-7.
- K. Beton and B. Brożek-Płuska, Biochemistry and Nanomechanical Properties of Human Colon Cells upon Simvastatin, Lovastatin, and Mevastatin Supplementations: Raman Imaging and AFM Studies, J. Phys. Chem. B, 2022, 126(37), 7088–7103, DOI:10.1021/acs.jpcb.2c03724.
- H. Abramczyk, B. Brozek-Pluska, M. Kopec, J. Surmacki, M. Błaszczyk and M. Radek, Redox imbalance and biochemical changes in cancer by probing redox-sensitive mitochondrial cytochromes in label-free visible resonance raman imaging, Cancers, 2021, 13(5) DOI:10.1101/2020.12.03.409359.
- H. Abramczyk, B. Brozek-Pluska and M. Kopec, Double face of cytochrome c in cancers by Raman imaging, Sci. Rep., 2022, 1–11, DOI:10.1038/s41598-022-04803-0.
- M. Kopeć, K. Beton and K. A. H. Jarczewska, Hyperglycemia and cancer in human lung carcinoma by means of Raman spectroscopy and imaging, Sci. Rep., 2022, 12(2022), 18561, DOI:10.1038/s41598-022-21483-y , Published online.
- M. Kopec and K. Beton-Mysur, The role of glucose and fructose on lipid droplet metabolism in human normal bronchial and cancer lung cells by Raman spectroscopy, Chem. Phys. Lipids, 2024, 259, 105375, DOI:10.1016/j.chemphyslip.2023.105375.
- M. Kopec, A. Borek-Dorosz, K. Jarczewska, M. Baranska and H. Abramczyk, The role of cardiolipin and cytochrome c in mitochondrial metabolism of cancer cells determined by Raman imaging : in vitro study on the brain glioblastoma U-87 MG cell line, Analyst, 2024 10.1039/d4an00015c.
- H. Abramczyk, A. Imiela, B. Brozek-Pluska and M. Kopec, Advances in Raman imaging combined with AFM and fluorescence microscopy are beneficial for oncology and cancer research, Nanomedicine, 2019, 14(14), 1873–1888, DOI:10.2217/nnm-2018-0335.
- H. Abramczyk, B. Brozek-Pluska and M. Kopec, Polarized Raman microscopy imaging: Capabilities and challenges for cancer research, J. Mol. Liq., 2018, 259, 102–111, DOI:10.1016/j.molliq.2018.03.016.
- Z. Movasaghi, S. Rehman and I. U. Rehman, Raman spectroscopy of biological tissues, Appl. Spectrosc. Rev., 2007, 42(5), 493–541, DOI:10.1080/05704920701551530.
- J. Surmacki, B. Brozek-Pluska, R. Kordek and H. Abramczyk, The lipid-reactive oxygen species phenotype of breast cancer. Raman spectroscopy and mapping, PCA and PLSDA for invasive ductal carcinoma and invasive lobular carcinoma. Molecular tumorigenic mechanisms beyond Warburg effect, Analyst, 2015, 140(7), 2121–2133, 10.1039/c4an01876a.
- S. S. Pinho and C. A. Reis, Glycosylation in cancer: mechanisms and clinical implications : Nature Reviews Cancer : Nature Publishing Group, Nat. Rev. Cancer, 2015, 15, 540–555, DOI:10.1038/nrc3982.ABSTRACT.
- S. Cui, S. Zhang and S. Yue, Raman Spectroscopy and Imaging for Cancer Diagnosis, J. Healthc. Eng., 2018, 2018, 8619342, DOI:10.1155/2018/8619342.
- K. W. Short, S. Carpenter, J. P. Freyer and J. R. Mourant, Raman spectroscopy detects biochemical changes due to proliferation in mammalian cell cultures, Biophys. J., 2005, 88(6), 4274–4288, DOI:10.1529/biophysj.103.038604.
- H. Abramczyk, A. Imiela and A. Śliwińska, Novel strategies of Raman imaging for exploring cancer lipid reprogramming, J. Mol. Liq., 2019, 274, 52–59, DOI:10.1016/j.molliq.2018.10.082.
- M. Kopec, K. Beton-Mysur and H. Abramczyk, Raman imaging and chemometric methods in human normal bronchial and cancer lung cells: Raman biomarkers of lipid reprogramming, Chem. Phys. Lipids, 2023, 257, 105339, DOI:10.1016/j.chemphyslip.2023.105339.
- S. Elumalai, S. Managó and A. C. De Luca, Raman Microscopy: Progress in Research on Cancer Cell Sensing, Sensors, 2020, 20(19) DOI:10.3390/s20195525.
- C. Nieva, M. Marro, N. Santana-Codina, S. Rao, D. Petrov and A. Sierra, The lipid phenotype of breast cancer cells characterized by Raman microspectroscopy: towards a stratification of malignancy, PLoS One, 2012, 7(10), e46456, DOI:10.1371/journal.pone.0046456.
- M. Köhler, S. Machill, R. Salzer and C. Krafft, Characterization of lipid extracts from brain tissue and tumors using Raman spectroscopy and mass spectrometry, Anal. Bioanal. Chem., 2009, 393(5), 1513–1520, DOI:10.1007/s00216-008-2592-9.
- M. Ichikawa, D. A. Scott, M. E. Losfeld and H. H. Freeze, The metabolic origins of mannose in glycoproteins, J. Biol. Chem., 2014, 289(10), 6751–6761, DOI:10.1074/jbc.M113.544064.
- H. Abramczyk and B. Brozek-Pluska, New look inside human breast ducts with Raman imaging. Raman candidates as diagnostic markers for breast cancer prognosis: Mammaglobin, palmitic acid and sphingomyelin, Anal. Chim. Acta, 2016, 909, 91–100, DOI:10.1016/j.aca.2015.12.038.
- B. Brozek-Pluska, M. Kopec, J. Surmacki and H. Abramczyk, Raman microspectroscopy of noncancerous and cancerous human breast tissues. Identification and phase transitions of linoleic and oleic acids by Raman low-temperature studies, Analyst, 2015, 140(7), 2134–2143, 10.1039/c4an01877j.
- C. J. Frank, R. L. McCreery, D. C. B. Redd and T. S. Gansler, Characterization of Human Breast Biopsy Specimens with Near-IR Raman Spectroscopy, Anal. Chem., 1994, 66(3), 319–326, DOI:10.1021/ac00075a002.
- H. Abramczyk, J. M. Surmacki, B. Brozek-Pluska and M. Kopec, Revision of Commonly Accepted Warburg Mechanism of Cancer Development : Redox-Sensitive Mitochondrial Cytochromes in Breast and Brain Cancers by Raman Imaging, Cancers, 2021, 13(11), 1–23, DOI:10.3390/cancers13112599.
- Z. Liu, X. Zhao, L. Zhang and B. Pei, Cytochrome C inhibits tumor growth and predicts favorable prognosis in clear cell renal cell carcinoma, Oncol. Lett., 2019, 18(6), 6026–6032, DOI:10.3892/ol.2019.10989.
- R. Rana, R. S. Huirem and R. Kant, et al. Cytochrome C as a potential clinical marker for diagnosis and treatment of glioma, Front. Oncol., 2022, 12, 1–12, DOI:10.3389/fonc.2022.960787.
- H. Abramczyk, J. M. Surmacki and B. Brozek-Pluska, Redox state changes of mitochondrial cytochromes in brain and breast cancers by Raman spectroscopy and imaging, J. Mol. Struct., 2022, 1252, 132134, DOI:10.1016/j.molstruc.2021.132134.
| This journal is © The Royal Society of Chemistry 2024 |


