 Open Access Article
A one-step process for multi-gradient wettability modification on a polymer surface†
Xinxin
Li‡
 ,
Xinyu
Mao‡
,
Xudong
Li
,
Xinyu
Mao‡
,
Xudong
Li
 ,
Chong
Liu
 * and
Jingmin
Li
*
Department of Mechanical Engineering, Dalian University of Technology, Dalian, Liaoning, China. E-mail: chongl@dlut.edu.cn; jingminl@dlut.edu.cn
First published on 29th February 2024
Abstract
The surface modification technique is applied in microfluidic devices to modify wettability and achieve different flow velocities. Currently available methods for poly(dimethylsiloxane) (PDMS) surfaces may reliably induce wettability changes, but only one area can be altered at a time. This work introduces the controlled gradient oxygen plasma modification (CGPM) technique, which layers several resin masks with varying porosities on top of the PDMS surface. Selective wettability of the PDMS surface can be achieved by varying the oxygen plasma density above the modified material's surface by manipulation of the porosity value. Through the implementation of the COMSOL plasma module, the impact of the mask's porosity, through-hole size, distribution, and distance from the PDMS surface on wettability was studied. The suggested CGPM approach was characterized by contact angle measurements. During the 25-second CGPM procedure, the PDMS surface's contact angle continually changed from 8.77° to 76.98°. An integrated microfluidic device was created and manufactured to identify D-dimers to illustrate this method. In comparison with standard oxygen plasma treatment, the D-dimer assay was finished in 10 minutes and had a dynamic range of 1–1000 ng mL−1, with a peak fluorescence signal augmentation of 78.3% and an average fluorescence intensity enhancement of 31.1%.
1. Introduction
Polymers are becoming a prime choice in micro-manufacturing due to their low cost and ease of manufacture. Polydimethylsiloxane (PDMS) materials, typically flexible elastomers with good biocompatibility, chemical stability, and weather resistance,1,2 have attracted much attention in the last few decades and have found a wide range of applications in many fields, especially in the biological field.3–6 Passive microfluidics devices (PMD) will further expand the horizon of PDMS-based medical and biological research devices. PMD, in which the fluid is driven by capillary forces and the flow rate is determined by the structure and spatial wettability of the PDMS surface, has the advantage of low dead volume and low power consumption.7 However, the potential application of PDMS in passive microfluidic devices is limited by its low surface energy, which makes it hydrophobic.8,9The microchannel surfaces of PMD should be hydrophilic to create automatic and reliable filling. Several surface modification methods have been developed to provide more suitable surface properties for PDMS. Wet chemical treatment is a widely used method, where the surface is coated or grafted by filling the channels with liquid chemicals. For example, the surfactant SilwetL-77 is coated onto the PDMS surface to make the surface hydrophilic;10 HEMA is grafted onto the PDMS surface to introduce polar functional groups to make it hydrophilic.11 The other method is dry treatments, such as oxygen plasma treatment,12 UV/O treatment,13etc. In addition, physical techniques14 have been proposed to improve surface hydrophilicity, such as changing the surface roughness by laser ablation15 to achieve a change in surface wettability. Although these treatments can modify surface wettability, all these hydrophilic treatments are carried out on the entire polymer surface or a part of the surface, preventing wettability at specific locations on the surface. They have other problems, such as long processing times, microchannel contamination, or complex and easily failing steps. At the same time, in integrated one-step detection PMD, the reaction time16 is undoubtedly an essential factor in the detection performance. Different flow rates are often required in different areas, such as a slow rate for incubation, a medium rate for reaction, and a fast rate for washing.17 To adjust the flow rate, the primary approach is to use various microstructures, such as stop valves18 with abrupt changes in microchannel cross-section and trigger valves19 that combine multiple microchannels at a joint (e.g., a T-shaped joint). A sponge20 has been reported that creates a core suction in the microchannel to promote the fluid flow. However, the above structures are very complex and require tedious micro-manufacturing processes.
Oxygen plasma is one of the most conventional and simple processes for making PDMS surfaces that is hydrophilic, fast, and cost-effective. It does not involve tedious process steps and toxic chemical treatment. However, in previous studies, the entire polymer surface was treated with oxygen plasma, and no wettability gradient was formed.21 Alternatively, a single wettability gradient can be produced on the surface by producing an oxygen plasma in a small area22 to create a wettability pattern, masking a portion of the surface for deposition,23 or creating a mask with an epoxy resin adhesive.24 This is the first time that controlled gradient oxygen plasma treatment has been used to achieve a simple, reliable, and scalable one-step selective wettability modification of PDMS microfluidic devices.
A controlled gradient oxygen plasma modification (CGPM) method was developed and demonstrated for the selective wettability modification of PDMS surfaces in this study. This method covered a series of resin masks with varying porosity first on top of the PDMS surface and then subjected to oxygen plasma modification. By controlling the mask's porosity, the oxygen plasma density on the PDMS surface can be adjusted to achieve selective wettability modification without complicated and tedious treatment. The effect of the chamber height between the mask and the PDMS surface, the through-hole distribution, the through-hole size and the porosity of the mask on plasma density was analysed using the plasma module in COMSOL. The relationship between the plasma density and surface wettability was verified, and it was determined that the surface wettability can be precisely controlled by controlling the porosity of the mask and the plasma treatment parameters, and therefore the method produces reliable selective wettability. The surface morphology was analysed to gain further insight into the CGPM method, and the surface was characterized using attenuated total reflection Fourier transform infrared spectroscopy (ATR-FTIR). To verify the feasibility of the CGPM method, an integrated one-step detection microfluidic device driven entirely by capillary forces was developed to detect D-dimers, which is considered one of the gold standard biomarkers for the diagnosis of venous thromboembolism and pulmonary thromboembolism.
2. Theoretical basis
Plasma bombardment of a polymer surface creates hydrophilic groups that alter its wettability,25 and here the plasma is generated using a radio frequency field as shown in Fig. 1(a). Under the RF electric field between the cathode and the anode, the initial small number of free electrons in space was accelerated to gain energy to collide with the gas atoms, resulting in the ionization of the gas atoms. With the ionization of many gas molecules, the gas changed from its initial insulating state to a conductive state, with an electric current passing through and an electric field forming between the cathode and the anode. However, the free electrons in space continued to collide and compound with the gas ions, returning them to gas atoms. Eventually, the ionization and compounding reached equilibrium, forming a plasma in space.26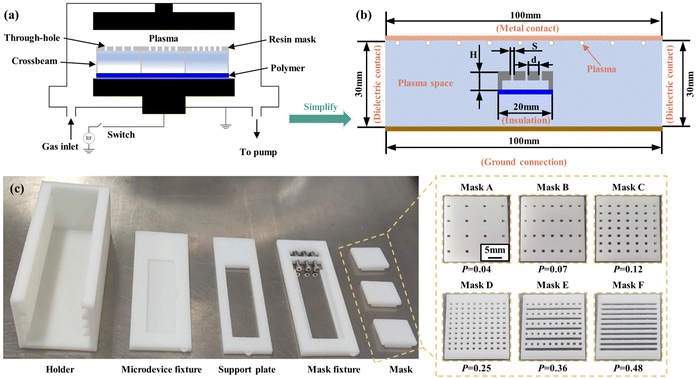 | ||
| Fig. 1 Schematic diagram of the CGPM method and its device. (a) Illustration of the CGPM method. (b) Flat plate electrode plasma simulation model. (c) 3D printing of the CGPM device. | ||
To simplify the study of the physical discharge process, this simulation used the continuity equation, the energy conservation equation, and the Poisson equation, combined with the Gravenstein distribution, to solve for each physical parameter.
Continuity equations
 | (1) |
 | (2) |
Eqn (1) is the electron continuity equation, and eqn (2) is the ion continuity equation, where μene∇∅ and De∇ne are the electron flux and ion flux, respectively. The right-hand sides of the two equations, Se and Si, represent the production or disappearance of electronics and the ith ion during the reaction due to mutual collisions between particles.
Electron energy conservation equation
 | (3) |
In eqn (3)qe is the electron heat flux density, E is the electric field vector, and the third term represents the change in heat energy density of electronics due to various collisions, where the reaction rate coefficient kj can be expressed as:
 | (4) |
Poisson equation
 | (5) |
In eqn (5), q, nk and Qk denote the unit charge, the number density of the kth heavy particle, and its charge, respectively.
3. Materials and methods
3.1 Numerical approach
Numerical simulations were used to validate the CGPM device in order to explore its potential for room-controlled plasma density control. The capacitively connected plasma system includes the plasma etching equipment (K1050X, Quorum, UK), and COMSOL software was used to manage the discharge process at low atmospheric pressure in the system. A pair of two-dimensional parallel electrodes in the geometrical model are grounded on one side and linked to the drive power supply on the other. Gas enters the cavity wall from the drive electrode and exits through the bottom on the opposite side. The RF power was set to 100 W, the discharge gas pressure was set to 1 Torr, the plasma was maintained by a periodic electrical excitation of 13.56 MHz, and all wall temperatures were assumed to be 300 K. The parameters of electron impact reactions and heavy species reactions in the plasma simulation model were set as shown in Tables S1 and S2.† The study examined the impact of insulated confined chambers with chamber height (H), through-hole distribution (d), and through-hole size (S) on the plasma density, as shown in Fig. 1(b). Mesh evaluation was performed to ensure that the results were not mesh-dependent (Table S3†).3.2 Design and fabrication of the CGPM device
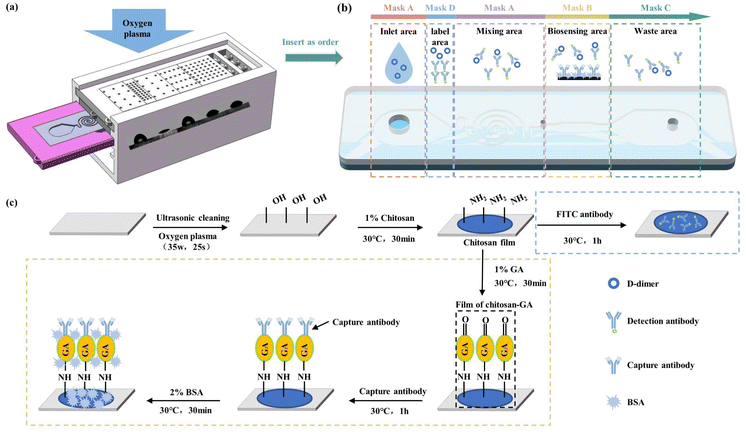
To control the oxygen plasma density above the polymer, a series of resin masks with different porosities were set up, and the CGPM device was manufactured. An insertion slot was designed in the mask fixture, so resin masks with different porosities can be inserted. Different wettability properties can be produced on the same surface depending on the arrangement of the masks. The holder was designed with several adjustment slots to adjust the distance between the polymer surface and the resin mask from 2 mm to 6 mm, and correspondingly designed with support plates from 2 mm to 6 mm in height, thus creating chambers of different heights on the polymer surface. Fig. 1(c) shows the various parts and the equipment structure of the CGPM device, which consists of five main parts: the mask, the mask mount, the support plate, the microdevice mount and the bracket. The resin mask was provided with different arrangements of through-holes, and the porosity was set to 0.04, 0.07, 0.12, 0.25, 0.36 and 0.48. For a better illustration of the various porosities of masks, these masks are referred to as masks A, B, C, D, E, and F, as shown in Fig. 1(c). It is important to note that the size and position of the mask can be easily changed using this device, thus enabling flexible selectivity features for different application requirements. | (6) |
In eqn (6)P is the porosity of the mask, Sh is the total area of holes, and St is the total area of the mask surface.
3.3 Apparatus
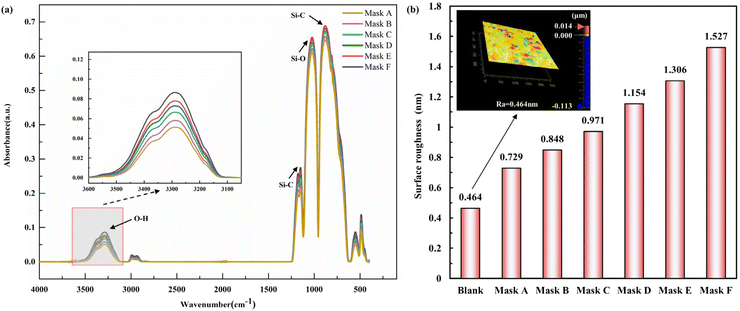
Rectangles measuring 60 mm × 20 mm and made from 2 mm thick PDMS sheets (Dow Corning, USA) were cut, and the resin masks were inserted into the the slots of the mask fixture in the proper order to verify the CGPM performance. Once inside a solid-state RF plasma barrel reactor for CGPM, the device was then used (Fig. S1†). A droplet shape analyzer (DAS100, KRUSS Co., Germany) was used to determine the contact angle of the PDMS surface following the alteration. A 45 W treated 25 s polymer was used to gain further insight into the CGPM technique, the surface morphology was examined, and attenuated total reflection Fourier transform infrared spectroscopy (ATR-FTIR) was used to characterize the surface. A Vertex 70 FTIR and a platinum ATR accessory with a single reflection diamond crystal (Bruker, Germany) at a 45° incidence angle were used to perform the ATR-FTIR measurements. At a resolution of 0.4 cm−1, 16 images were collected to record the spectra ranging from 3600 to 400 cm−1. A white light interferometer (New view 5022, ZYGO, USA) with 0.1 nm resolution in the vertical direction was used to study the surface morphology.3.4 An integrated microfluidic device for D-dimer detection
The modification process of capture Ab is shown in Fig. 2(c). Firstly, the substrate and cover layer were washed with deionized water for 30 min ultrasonically to wash away surface impurities. Secondly, the substrate was treated using the CGPM method with a power of 35 W for 25 s, mask B for the biosensing area only, and mask without through-holes for the rest of the area. Thirdly, 2 μL of 1%(w/v) chitosan solution was injected into the channel via a pipette gun at 30 °C and held for 30 min. Fourthly, 2 μL of 1%(v/v) glutaraldehyde solution was injected into the channel via the pipette gun at 30 °C and held for 30 min. Fifthly, 1.5 μL of 60 μg mL−1 of capture Ab solution was added via pipette to the center of the detection zone and incubated for one hour at 30 °C. Finally, the biosensing area of the substrate was immersed in a 2% (w/v) BSA solution for 30 min at 30 °C to reduce specific adsorption. Throughout the procedure, the chip was washed thoroughly with phosphate-buffered saline (PBS, pH 7.4) after each step except for the first three steps.
After the modification of the biosensing area, the labelling area was modified, as shown in Fig. 2(c) Firstly, the substrate was treated using the CGPM method with a power of 35 W for 25 s, and masks A, D, A, and C were applied to the inlet area, the labelling area, the mixing area, and the waste area. Secondly, 3 μL of 1% (w/v) chitosan solution was added to the labelling area via the pipette gun and left to dry naturally. Finally, 2 μL (w/v) of 0.4 mg mL−1 of detection Ab was added to the labelling area via the pipette gun and incubated for one hour.
After antibody modification of the biosensing area and the labelling area, the cover sheet was processed using the CGPM method, and then the cover sheet and substrates were bonded together. The tested samples of D-dimer biomarkers were prepared in PBS buffer, and concentrations of 1, 10, 100, 500, and 1000 ng mL−1 were generated for analysis.
4. Results and discussion
4.1 Effect of the chamber height, through-hole size and through-hole distribution
Fig. 3(a) shows the simulation clouds for each chamber with chamber heights of 1 mm, 2 mm, 3 mm, 4 mm and 5 mm, which illustrates that a small chamber distance results in a much lower plasma density in the middle region than at the two ends. Fig. 3(b) shows the range of the plasma density at the bottom of the chamber with different chamber heights. It can be seen that as the height of the chamber increased, the plasma range within the chamber increased and then decreased, with the best uniformity at 4 mm. Therefore, the chamber height was set to 4 mm for subsequent experiments.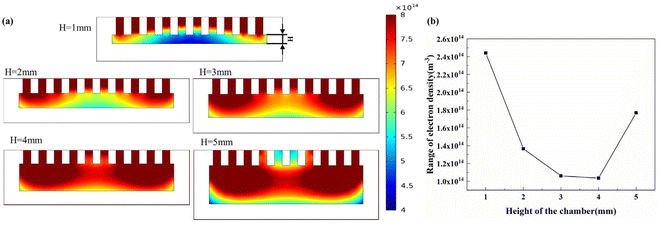 | ||
| Fig. 3 Effect of chamber height on plasma density within the chamber. (a) Simulation clouds for each chamber. (b) The range of plasma electron density at 0.5 mm from the bottom of the chamber. | ||
Fig. 4(a) shows the simulation clouds for each chamber with through-hole sizes of 0.2 mm, 0.5 mm, 1 mm, 2 mm, 3 mm, and 4 mm. It can be seen that with the increase of the through-hole size, the plasma density within the chamber increased, and the distance between the intermediate relatively smooth distributions slightly decreased. There is a noticeable decrease in the density of plasma entering the cavity when the through-hole size reaches 1 mm. Plasma finds it difficult to enter the chamber when using through-hole sizes of 0.2 and 0.5 mm due to the small size, and their impact on surface modification is minimal. Furthermore, as the mask is made via 3D printing, the study begins at 1 mm, taking into account the 0.5 mm accuracy of 3D printing. With the increase of the through-hole size, the plasma density difference at the bottom of the chamber increases (Fig. 4(b)), indicating that more and more plasma enters the chamber, but concentrates in the middle of the chamber, which will cause uneven plasma density in the chamber. In order to improve the uniformity of the surface modification, a through-hole size of 1 mm was chosen.
 | ||
| Fig. 4 Effect of through-hole size on plasma density within the chamber. (a) Simulation clouds for each chamber. (b) The range of plasma electron density at 0.5 mm from the bottom of the chamber. | ||
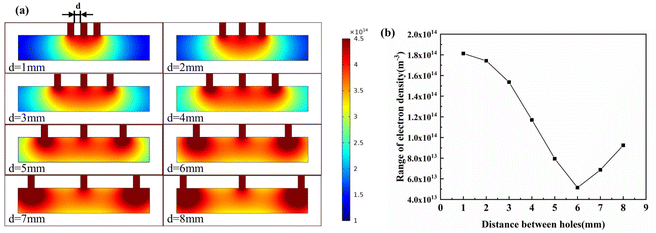
Fig. 5(a) shows the simulation clouds for each chamber with porosities of 1 mm, 2 mm, 3 mm, 4 mm, 5 mm, 6 mm, 7 mm, 8 mm and 9 mm. Fig. 5(b) shows the range of the plasma density at the bottom of the chamber with different through-hole distribution. It can be seen that with the increase of the hole spacing, the plasma range within the chamber decreased first and then increased, the minimum range was at 6 mm, and the hole spacing was 4 mm with uniform distribution, and it can be found that the uniformity increased when the holes on both sides were close to the edge. However, as the number of holes was variable when the porosity increased, bringing the holes on both sides closer to the edge will make the design more difficult. For simplicity of design, a uniform distribution between the holes was chosen, and the range was similar to the optimum distribution.
4.2 Structural and physical characterization
4.3 Performance of the CGPM technique on the PDMS surface
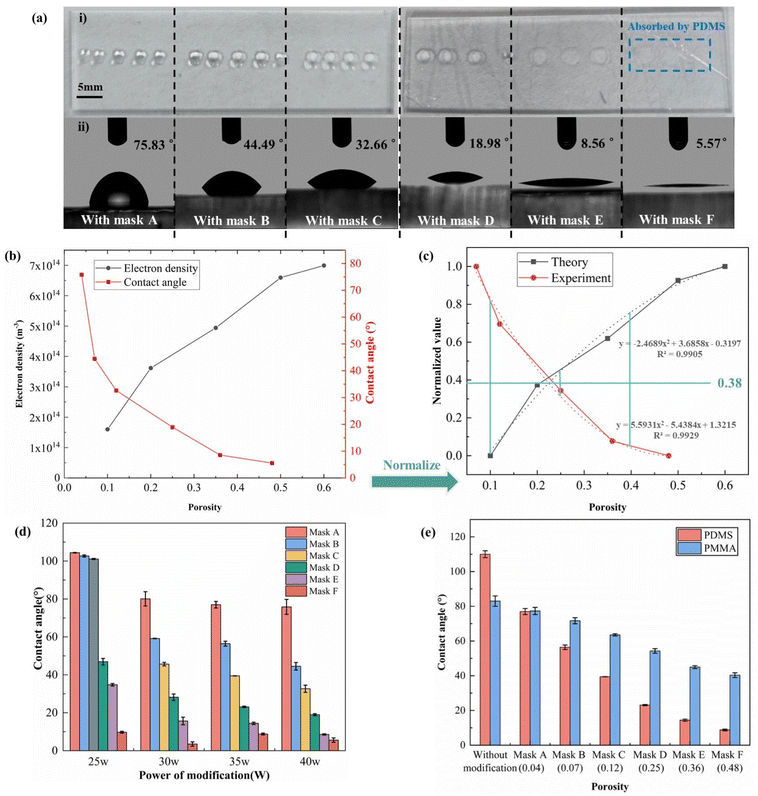
The wettability of the modified PDMS surface was characterized by water contact angle (WCA) measurements, and each measurement was repeated three times on three different PDMS sheets. Fig. 7(a) shows a representative image of the WCA measurement results with a modification power of 30 W and a time of 25 s. This shows that as the porosity of the mask increases, the contact angle then decreases, indicating the enhanced action of plasma on the PDMS surface. Combined with the results of the simulation analysis for different porosity chamber densities, this corresponds to an increase in the density of oxygen plasma reaching the polymer surface. The correspondence of pore density with WCA and plasma density is demonstrated in Fig. 7(b), and in terms of the overall trend, the plasma density increases with increasing porosity, and conversely the WCA decreases. This trend changes fast when the porosity is less than 0.2 and decreases when the porosity is greater than 0.2. The two groups of data are normalized in order to facilitate comparison because the two groups of data differ in dimensions and orders of magnitude, and the results of the simulation analysis are represented as theoretical data, and the results of WCA are represented as experimental data, thus obtaining Fig. 7(c). The normalized points were fitted separately to obtain the theoretical fit curve (y = −2.4689x2 + 3.6858x − 0.3197) and the experimental fit curve (y = 5.5931x2 − 5.4384x + 1.3215), respectively, to take the y value corresponding to the x value as equal to 0.1, 0.25 and 0.4, and calculate the mean squared error (MSE) of these values to the intersection of this theoretical and experimental fitted curves with the line parallel to the x-axis, where the straight line (y = 0.38) is located. The MSE is 0.037, indicating that the two curves are in good agreement.4.4 Wettability of the modified surface
The link between WCA and modified power is depicted in Fig. 7(d). As modification power increased, the WCA was reduced. In the region below a porosity of 0.25, the WCA was 46.92 ± 1.69° when the modification power was 25 W. The WCA in this location dropped to 8.56 ± 0.35° as the modification power increased to 40 W. When the power of modification surpassed 40 W, the WCA became too tiny, nearly 0°, and challenging to quantify. As a result, 40 W was chosen as the maximum modification power. Additionally, the sensitivity of the WCA to the modification power first increased and subsequently decreased when the mask porosity decreased from 0.48 to 0.04. When the modification power was increased from 25 W to 40 W with a mask porosity of 0.04, the WCA was 75°–80° with the exception of 25 W. This could be as a result of the chamber's low plasma density brought on by the low porosity, which reduced the effectiveness of the alteration and rendered the modified material insensitive to oxygen plasma. When the modified power was increased from 25 W to 40 W, the WCA is reduced by half, the WCA was reduced from 46.92° ± 1.69° to 8.56° ± 0.35° at the mask porosity of 0.25. In contrast, when the modification power was increased from 25 W to 40 W for a mask porosity of 0.48, the contact angle was less than 10°. This could be because of the chamber's great porosity, which creates a high oxygen plasma density. The modification effect was too strong, making the modified material insensitive to oxygen plasma.Fig. 7(f) shows WCA measurement results for the modified PMMA surface and the modified PMMA surface at CGPM (35 W, 25 s). Similar to PDMS, six wettability gradients were generated on the PMMA surface. The unmodified PMMA contact angle was 83° ± 3°. After modification by CGPM, the WCA changed continuously from 40.34° ± 1.36° to 77.32° ± 2.05°. The results show that the CGPM method can be applied not only to thermosetting materials such as PDMS, but also to thermoplastic materials such as PMMA. Compared to PDMS, the PMMA surface contact angle has a smaller range of variation, but can also satisfy the hydrophilic requirements for surface wetting of microfluidic chips.
4.5 Application of the detection of D-dimers
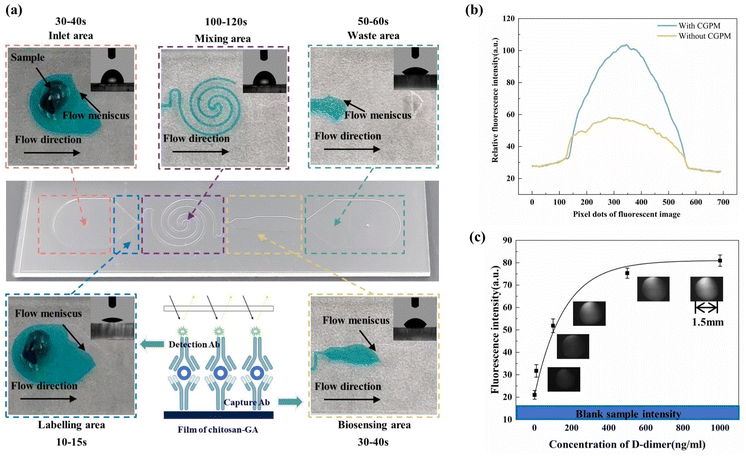
Typical ELISA assays are multi-step analyses, requiring manual user intervention at each step in the process, which is unfriendly to untrained personnel and leads to inaccurate results and extended analysis time. Microfluidic devices are miniaturized and integrated, simplifying multi-step analysis into single-step analysis. Due to its large surface area-to-volume ratio, the reaction time can be greatly reduced. However, most microfluidic devices currently still require pre-treatment of reagents31 or, they need an external energy source32 for actuation. Here, we have developed a one-step, integrated, capillary-driven microfluidic device to detect D-dimers.Fig. 8(a) shows the sample flow behaviour in this device. The user injected 40 μL of the tested sample into the device. Next, it took 30–40 s to fill the inlet area, then the solution flowed into the labelling area and washed off the detection Ab within 10–15 s. Subsequently, the sample solution flowed through the mixing area, which took about 2 min. In this area, the antigen in the sample and detection Ab bound together and formed an antigen–FITC Ab conjugate. The antigen–FITC Ab adduct was bound to the capture Ab in the biosensing zone, creating a FITC Ab–antigen–capture Ab sandwich structure. The excess sample acted as a wash solution, rinsing off the unbound reagents and taking 50–60 s to fill the waste area, for a total analysis time of approximately 5 min. During the assay, the flow rate was undoubtedly an essential factor in the assay's outcome. For example, the flow rate in the inlet area should be slow to avoid bubbles; the flow rate in the labelling area should be fast enough to flush out the detection Ab; the flow rate in the mixing area should be slow so that the antigen and detection Ab have sufficient time to mix and bind, and the flow rate in the waste zone should be faster than in the biosensing area so that unbound reagents can be flushed out quickly. It can be seen that the different chronological steps were integrated into a single device, requiring only a single introduction of the tested sample, thus reducing manual intervention by the user, and that the zones in this device had a simple structure with flow rate differences generated by the CGPM method. The WCA values of the modified surface with a oxygen plasma treatment power of 35 W for 25 s were 76.98° (inlet and mixing areas), 23.09° (labelling area), 56.43° (biosensing area), and 39.45° (waste area), according to the calculation (as the flow rates in these areas were 0.73 μL s−1, 2.96 μL s−1, 1.78 μL s−1 and 2.49 μL s−1, respectively).
Fig. 8(b) compares the fluorescence results using the CGPM method and the normal plasma modification when the D-dimer concentration was kept at 100 ng mL−1. It can be seen that the peak fluorescence signal in the biosensing area was enhanced by 78.3%, and the average fluorescence intensity was enhanced by 31.1% by using the CGPM method compared to the conventional oxygen plasma modification. The reasons for this may be as follows. When the device was treated with the conventional oxygen plasma modification for 25 s, the WCA of the modified surface was less than 10°. In this case, the sample flowed too fast in the labelling and mixing regions, leaving a large amount of the detection Ab at the front of the fluid, and the Archimedes helix structure did not allow complete binding and mixing of the detection Ab and the target antigen. In addition, the flow rate in the biosensing region was too fast, thus not allowing sufficient time for the antigen to bind to the capture Ab in the region, resulting in a weakened fluorescence signal.
Five independent replicate assay experiments were performed using different concentrations of D-dimer solutions to obtain their mean fluorescence intensity values, as shown in Fig. 8(c). A PBS solution without D-dimer was used as the control sample. The samples were reproducible at different concentrations of d-dimer (n = 5), and all of the relative errors were less than 10% (ESI Table S4†). The lowest concentration of D-dimer detected using the device was 1 ng mL−1, which was significantly higher than the fluorescence intensity of the control sample. In clinical practice, the clinical threshold for differentiating between normal and pathological levels of D-dimer was 500 ng mL−1, and D-dimer concentrations in different patients were generally in the range of 100–1000 ng mL−1. The microfluidic device's detection range in this work was 1–1000 ng mL−1 in 10 minutes, which was within the clinically acceptable concentration range for D-dimer detection, indicating its potential application in the field of biomarker detection.
5. Conclusions
We demonstrate a simple, reliable, controlled gradient oxygen plasma modification (CGPM) method for PDMS surfaces. This method applied resin masks with different porosities to conventional oxygen plasma modification. Varying amounts of oxygen-containing functional groups and nanoscale mounds and pits with different morphologies were produced on the PDMS surface, resulting in selective wettability of the PDMS surface. WCA measurements showed that the contact angle of the PDMS surface varied continuously from 8.77° to 76.98° through a 25 s CGPM process. Compared with conventional chemical modification methods, the CGPM method does not require cumbersome process steps and toxic chemical treatments. Compared with conventional dry mask-based treatments such as oxygen plasma modification and UV/O modification, the CGPM method can freely adjust the wettability of different regions of the PDMS surface, producing multiple wettability gradients on the PDMS surface. To test the modification effect of the CGPM method, a one-step detection microfluidic device was designed to obtain antibody-modified regions with different flow rates based on the principle of sandwich immunofluorescence. Only 40 μL of the sample was injected into the device, and the one-step detection microfluidic device spontaneously carried out the assay process. The method was successfully applied to detecting D-dimers in the dynamic range of 1–1000 ng mL−1 with a peak fluorescence signal enhancement of 78.3% and an average fluorescence intensity enhancement of 31.1% compared to conventional oxygen plasma treatment. This method has potential for scenarios requiring different wettabilities, which indicates a broad application prospect in microfluidic chip flow rate difference control within channels, W/O/W emulsion generation on a single chip, etc.Author contributions
Conceptualization: Xinxin Li; methodology: Xinxin Li and Xinyu Mao; and software: Xinyu Mao; writing – original draft: Xinyu Mao and Xudong Li; writing – review & editing, Xin-Xin Li; validation: Xinyu Mao; formal analysis: Xinxin Li and Xinyu Mao; investigation: Xinyu Mao and Xudong Li; resources: Chong Liu; data curation: Xinxin Li; visualization: Xinxin Li; supervision: Jingmin Li and Chong Liu; project administration: Xinxin Li; funding acquisition: Jingmin Li and Chong Liu. All authors have read and agreed to the published version of the manuscript.Conflicts of interest
The authors declare no conflict of interest.Acknowledgements
This work was supported by the National Key R&D Program of China (2020YFB2009002).References
- S. Bakshi, K. Pandey, S. Bose, Gunjan, D. Paul and R. Nayak, Permanent superhydrophilic surface modification in microporous polydimethylsiloxane sponge for multi-functional applications, J. Colloid Interface Sci., 2019, 552, 34–42 CrossRef CAS PubMed.
- N. Y. Adly, H. Hassani, A. Q. Tran, M. Balski, A. Yakushenko, A. Offenhäusser, D. Mayer and B. Wolfrum, Observation of chemically protected polydimethylsiloxane: towards crack-free PDMS, Soft Matter, 2017, 13, 6297–6303 RSC.
- P. Chen, C. Chen, H. Su, M. Zhou and B. F. Liu, Integrated and finger-actuated microfluidic chip for point-of-care testing of multiple pathogens, Talanta, 2020, 224, 121844 CrossRef PubMed.
- A. Baranwal, A. Kumar, A. Priyadharshini, G. S. Oggu and P. Chandra, Chitosan: An undisputed bio-fabrication material for tissue engineering and bio-sensing applications, Int. J. Biol. Macromol., 2018, 110, 110–123 CrossRef CAS PubMed.
- J. M. Chen, P. C. Huang and M. G. Lin, Analysis and experiment of capillary valves for microfluidics on a rotating disk, Microfluid. Nanofluid., 2008, 4 Search PubMed.
- D. Bodas and C. Khan-Malek, Formation of more stable hydrophilic surfaces of PDMS by plasma and chemical treatments, Microelectron. Eng., 2006, 83, 1277–1279 CrossRef CAS.
- C.-H. Choi, H. Lee and D. A. Weitz, Rapid patterning of PDMS microfluidic device wettability using syringe-vacuum-induced segmented flow in nonplanar geometry, ACS Appl. Mater. Interfaces, 2018, 3170–3174 CrossRef CAS PubMed.
- N. Gao, J. Chang, Z. Zhu and H. You, Multistory stairs-based, fast and point-of-care testing for disease biomarker using one-step capillary microfluidic fluoroimmunoassay chip via continuous on-chip labelling, BioChip J., 2021, 1–8 Search PubMed.
- K. Hosokawa, Biomarker analysis on a power-free microfluidic chip driven by degassed poly(dimethylsiloxane), Anal. Sci., 2020, 399–403 Search PubMed.
- S. Hu, X. Ren, M. Bachman, C. E. Sims, G. P. Li and N. L. Allbritton, Surface-directed, graft polymerization within microfluidic channels, Anal. Chem., 2004, 76, 1865–1870 CrossRef CAS PubMed.
- T. Jiang, J. Koch, C. Unger, E. Fadeeva, A. Koroleva, Q. Zhao and B. N. Chichkov, Ultrashort picosecond laser processing of micro-molds for fabricating plastic parts with superhydrophobic surfaces, Appl. Phys. A, 2012, 108, 863–869 CrossRef CAS.
- K. Mulenga, Z. Wei, X. Xue-Ke, O. Olayinka and J. Yong, Hydrophilic surface modification of polydimetylsiloxane-co-2-hydroxyethylmethacrylate (PDMS-HEMA) by Silwet L-77 (heptamethylsiloxane) surface treatment, Polym. Adv. Technol., 2018, 29, 2601–2611 CrossRef.
- S. C. Kim, D. J. Sukovicha and A. R. Abate, Patterning microfluidic device wettability with spatially-controlled plasma oxidation, Lab Chip, 2015, 3163–3169 RSC.
- R. Gulfam and Y. Chen, Recent growth of wettability gradient surfaces: A review, Research, 2022, 2022, 9873075 CrossRef CAS PubMed.
- B. J. Larson, S. Gillmor, J. Braun, L. E. Cruz-Barba and M. G. Lagally, Long-term reduction in poly(dimethylsiloxane) surface hydrophobicity via cold-plasma treatments, Langmuir, 2013, 29, 12990–12996 CrossRef CAS PubMed.
- S. Li, X. Gong, C. S. Mc Nally, M. Zeng, T. Gaule, C. Anduix-Canto, A. N. Kulak, L. A. Bawazer, M. J. McPherson and F. C. Meldrum, Rapid preparation of highly reliable PDMS double emulsion microfluidic devices, RSC Adv., 2016, 6, 25927–25933 RSC.
- C. Liang, Y. Liu, C. Liu, X. Li, L. Chen, C. Duan and J. Li, One-step selective-wettability modification of PMMA microfluidic devices by using controllable gradient UV irradiation (CGUI), Sens. Actuators, B, 2018, 273, 1508–1518 CrossRef CAS.
- J. Liu, T. Pan, A. T. Woolley and M. L. Lee, Surface-modified poly(methyl methacrylate) capillary electrophoresis microchips for protein and peptide analysis, Anal. Chem., 2004, 76, 6948 CrossRef CAS PubMed.
- J. Liu, Y. Yao and X. Li, Fabrication of advanced polydimethylsiloxane-based functional materials: Bulk modifications and surface functionalizations – ScienceDirect, Chem. Eng. J., 2021, 408, 127262 CrossRef CAS.
- S. Lutz, E. Lopez-Calle, P. Espindola, C. Boehm, T. Brueckner, J. Spinke, M. Marcinowski, T. Keller, A. Tgetgel, N. Herbert, T. Fischer and E. Beiersdorf, A fully integrated microfluidic platform for highly sensitive analysis of immunochemical parameters, Analyst, 2017, 142, 4206–4214 RSC.
- K. Ma, J. Rivera, G. J. Hirasaki and S. L. Biswal, Wettability control and patterning of PDMS using UV-ozone and water immersion, J. Colloid Interface Sci., 2011, 363, 371–378 CrossRef CAS PubMed.
- R. Safavieh and D. Juncker, Capillarics: Pre-programmed, self-powered microfluidic circuits built from capillary elements, Lab Chip, 2013, 13, 4180–4189 RSC.
- S. Ruivo, A. M. Azevedo and D. M. F. Prazeres, Colorimetric detection of D-dimer in a paper-based immunodetection device, Anal. Biochem., 2017, 538, 5–12 CrossRef CAS PubMed.
- F. P. B. A. Stauffer, Polyelectrolytes layer-by-layer surface modification of PDMS microchips for the production of simple O/W and double W/O/W emulsions: From global to localized treatment, Chem. Eng. Process., 2019, 146, 107685 CrossRef CAS.
- L. Ru and C. Jie-rong, Studies on wettability of medical poly(vinyl chloride) by remote argon plasma, Appl. Surf. Sci., 2006, 252, 5076–5082 CrossRef CAS.
- B. Yin, C. Qian, X. Wan, A. S. M. M. Sohan and X. Lin, Tape integrated self-designed microfluidic chip for point-of-care immunoassays simultaneous detection of disease biomarkers with tunable detection range, Biosens. Bioelectron., 2022, 212, 114429 CrossRef CAS PubMed.
- B. Yin, X. Wan, C. Qian, A. S. M. M. Sohan, S. Wang and T. Zhou, Point-of-care testing for multiple cardiac markers based on a snail-shaped microfluidic chip, Front. Chem., 2021, 9, 741058 CrossRef CAS PubMed.
- M. Zimmermann, A. H. Schmid, B. Aph and D. A. Emmanuel, Capillary pumps for autonomous capillary systems, Lab Chip, 2006, 119–125 Search PubMed.
- Z. Wu, L. Sun, H. Chen and Y. Zhao, Bioinspired surfaces derived from acoustic waves for on-demand droplet manipulations, Research, 2023, 6, 0263 CrossRef.
- N. Zhang, C. Huang, J. Li, L. Kang, H. Zheng, Y. He, Z. wang, X. Zhou and J. Zhang, Control and Patterning of Various Hydrophobic Surfaces: In-situ Modification Realized by Flexible Atmospheric Plasma Stamp Technique, J. Bionic Eng., 2020, 17, 436–447 CrossRef.
- J. Zhou, D. A. Khodakov, A. V. Ellis and N. H. Voelcker, Surface modification for PDMS-based microfluidic devices, Electrophoresis, 2012, 33(1), 89–104 CrossRef CAS PubMed.
- M. Zimmermann, P. Hunziker and E. Delamarche, Valves for autonomous capillary systems, Microfluid. Nanofluid., 2008, 5, 395–402 CrossRef.
Footnotes |
| † Electronic supplementary information (ESI) available. See DOI: https://doi.org/10.1039/d3an02185h |
| ‡ These authors contributed equally to this work. |
| This journal is © The Royal Society of Chemistry 2024 |

