
 Open Access Article
 This Open Access Article is licensed under a Creative Commons Attribution-Non Commercial 3.0 Unported Licence
Effects of single and multiple nucleotide mutations on loop-mediated isothermal amplification†
Taylor J.
Moehling
 *,
Erica R.
Browne
and
Robert J.
Meagher
*
*,
Erica R.
Browne
and
Robert J.
Meagher
*
Department of Biotechnology and Bioengineering, Sandia National Laboratories, 7011 East Ave, Livermore, CA, USA 94550. E-mail: tjmoehl@sandia.gov; rmeaghe@sandia.gov
First published on 21st February 2024
Abstract
Testing is pivotal for early identification of disease and subsequent infection control. Pathogens’ nucleic acid sequence can change due to naturally-occurring genetic drift or intentional modification. Because of the reliance on molecular assays for human, animal, and plant disease diagnosis, we must understand how nucleotide mutations affect test accuracy. Primers designed against original lineages of a pathogen may be less efficient at detecting variants with genetic changes in priming regions. Here, we made single- and multi-point mutations in priming regions of a model SARS-CoV-2 template that was used as input for a loop-mediated isothermal amplification (LAMP) assay. We found that many of the modifications impacted assay sensitivity, amplification speed, or both. Further research exploring mutations at every position in each of the eight priming regions should be conducted to evaluate trends and determine generalizability.
Introduction
Molecular assays, such as polymerase chain reaction (PCR), are the gold standard for infectious disease diagnosis. PCR has been pivotal in controlling the spread of SARS-CoV-2 throughout the COVID-19 pandemic. However, like all viruses, SARS-CoV-2 is subject to genetic drift, which raises the possibility that primers designed against older lineages of the virus may be less efficient at detecting emerging variants with nucleotide changes in the priming regions. There are tools such as ROSALIND Diagnostic Monitoring System and NEB's Primer Monitor that track pathogen variation and primer performance over time; however, these platforms rely on time-lagged sequencing databases and identify at-risk primers based on basic primer-target mismatches rather than empirical data.1,2SARS-CoV-2 is a good model system to study the effects of nucleotide mutations on primer-based detection because we saw firsthand how the emergence and rapid spread of new variants during the pandemic reduced the ability of molecular assays to consistently identify SARS-CoV-2, especially at low viral loads. We witnessed an S gene failure in the TaqPath1 COVID-19 multiplex reverse transcription (RT)-qPCR test and a dramatic reduction in sensitivity for the N gene target in the CDC 2019-Novel Coronavirus RT-PCR Diagnostic Panel.3,4 The consequential outcomes of false negative COVID-19 test results inspired researchers to systematically investigate this matter further. A paper published in September 2020 explored how single nucleotide polymorphisms affect test sensitivity. C-to-U substitutions in the SARS-CoV-2 genome were associated with false negative RT-PCR results.5 Another study, in which researchers sequenced patient test samples, found that SARS-CoV-2 mutations in the N gene led to reduced sensitivity of RT-PCR.6 Most of the literature demonstrates that even single-point modifications in the priming region can negatively affect the ability of RT-PCR to accurately identify SARS-CoV-2.7–10
Loop-mediated isothermal amplification (LAMP) is an emerging alternative to PCR for diagnostic applications. LAMP has the potential to be faster and operationally simpler than PCR: results can be obtained in <1 hour and LAMP requires less sample preparation and less sophisticated instrumentation. LAMP utilizes six primers that bind eight unique regions in the target gene, potentially making it more susceptible to nucleotide mutations than PCR. The priming regions cover about 160 bases and has long been claimed to lead to very high specificity.11 Altogether, this implies that LAMP could lose sensitivity in the face of genetic drift within the priming regions. However, little research has been conducted to explore the effect of sequence variation on LAMP performance. Similarly to PCR, we might expect the 3′ end of individual LAMP primers to be more significant than the center or 5′ segments;12 however, the 5′ end of LAMP inner primers is also anticipated to be important.11 We could also predict that changes in the loop primers are less likely to affect sensitivity, since the loop primers are intended to accelerate the reaction but are not necessary for amplification.13
Tamanaha et al. made single-point substitutions at every position in each of the six LAMP primers targeting SARS-CoV-2 and found most single-base changes did not affect amplification speed or assay sensitivity when compared to unmodified primers.14 Modifying primer sequences is experimentally expedient but could unintentionally introduce changes in assay efficiency due to differences in primer–primer interactions. In this study, we tested samples with single- and multi-point mutations introduced into a double-stranded (ds)DNA template modeling a region of the SARS-CoV-2 genome and analyzed the effect of the modifications on LAMP amplification.
Materials and methods
We designed primers that target the RNA-dependent RNA polymerase (RdRP) region of SARS-CoV-2 using LAMP Designer v1.13 Premier Biosoft software (sequences shown in Table S1†). Primers were analyzed for cross-reactivity via BLAST and for hairpins and self-dimerization using OligoAnalyzer (IDT, Coralville, IA). We used an end-point fluorescence detection mechanism called Quenching of Unincorporated Amplification Signal Reporters (QUASR).15 QUASR incorporates a dye-labelled primer and a quencher-tagged single-stranded probe into a standard LAMP reaction. After incubation, the reaction is cooled to room temperature, resulting in dark quenching of the unused fluorescent primers in negative samples or highly fluorescent amplicons in positive samples.For this study, we used synthetic dsDNA eBlocks (IDT) as template as an expedient method to generate defined sequence modifications, albeit in DNA rather than RNA. LAMP reactions were 10 μL total volume: 1X isothermal amplification buffer (NEB, Ipswich, MA), 1.4 mM deoxynucleotide mix (NEB), 8 mM magnesium sulfate (NEB), 2 μM Syto9 (Invitrogen, Carlsbad, CA), 0.32 U per μL of WarmStart Bst 2.0 (NEB), 0.2 μM of F3 and B3 primers (IDT), 1.6 μM of FIP and BIP (Cy5 label) primers (IDT), 0.8 μM of LF and LB primers (IDT), 2.4 μM of quencher (IDT), and 2 μL of template diluted to 100 copies per μL (200 copies per 10 μL reaction). Overall, we tested 69 unique samples with sequence variations that were intentionally designed to test the effects of mutations in specific priming regions. A dsDNA sequence based on the RdRP region of the WA1/2020 SARS-CoV-2 genome (GenBank: MN985325) was used as the positive control. We included 8 replicates per repeat, totalling 24–48 replicates for each sample. LAMP was run at 67.5 °C for 45 minutes using a CFX96 Real-Time PCR Detection System (Bio-Rad, Hercules, CA).
Both real-time data, using Syto9 intercalating dye, and QUASR end-point fluorescence results were used in this study. Real-time data was acquired from the CFX Maestro Software (Bio-Rad) and end-point fluorescence images were collected with a FluorChem R system (Protein Simple, Santa Clara, CA) using the MultiFluor Red setting with an exposure time of 50 ms. We used IDT's OligoAnalyzer to determine the change in melting temperature (Tm) and percent bound (primer to template) for all the single-point mutation samples tested in this study. To assess significance between the positive control and each sample, a two-sided Fisher's Exact Test was performed with a 95% confidence interval. We also grouped samples by the priming region in which the mutation(s) occurs (F1, F2, F3, B1, B2, B3, LF, LB) and compared each group to the positive control. Additionally, we used Fisher's Exact Test to conduct paired analysis: one- vs. two-point modification and 3′ vs. 5′ mutation position within the same priming region. We then evaluated a subset of samples with positivity rates, or percent of replicates that amplified, that were not statistically different from the positive control. We calculated the cycle threshold (Ct) mean, standard deviation, and variance for the replicates and performed an F-test to check whether the variance of each sample is equal (or not) to the variance of the positive control.
Results and discussion
Fig. 1 summarizes the samples used in this study. To ensure the reproducibility and validity of the results, most samples were tested by two researchers with different levels of experience with LAMP. 60 of the 69 unique samples had nucleotide mutations in one of the eight LAMP priming regions: F1 (11), F2 (21), F3 (7), LF (8), B1 (4), B2 (6), B3 (3), and LB (0). Six samples had sequence changes in two priming regions and three samples were modified between primer binding sites (BTWN) as controls that theoretically should not affect LAMP. The localized position of the mutation within each priming region ranged from the 5′ end to the 3′ end and is depicted in Fig. 1 with a pink line. The sample sequences include one (31), two (25), three (8), or four (3) substitutions, as well as deletions (2). The exact nucleotide substitution or deletion can be found in Table S2.† Note that these “mutations” were designed purely to probe the efficacy of LAMP, and do not represent replication-competent variants, or actual modifications observed in the RdRP region of SARS-CoV-2. Mutations were made in regions the authors hypothesized could produce interesting results.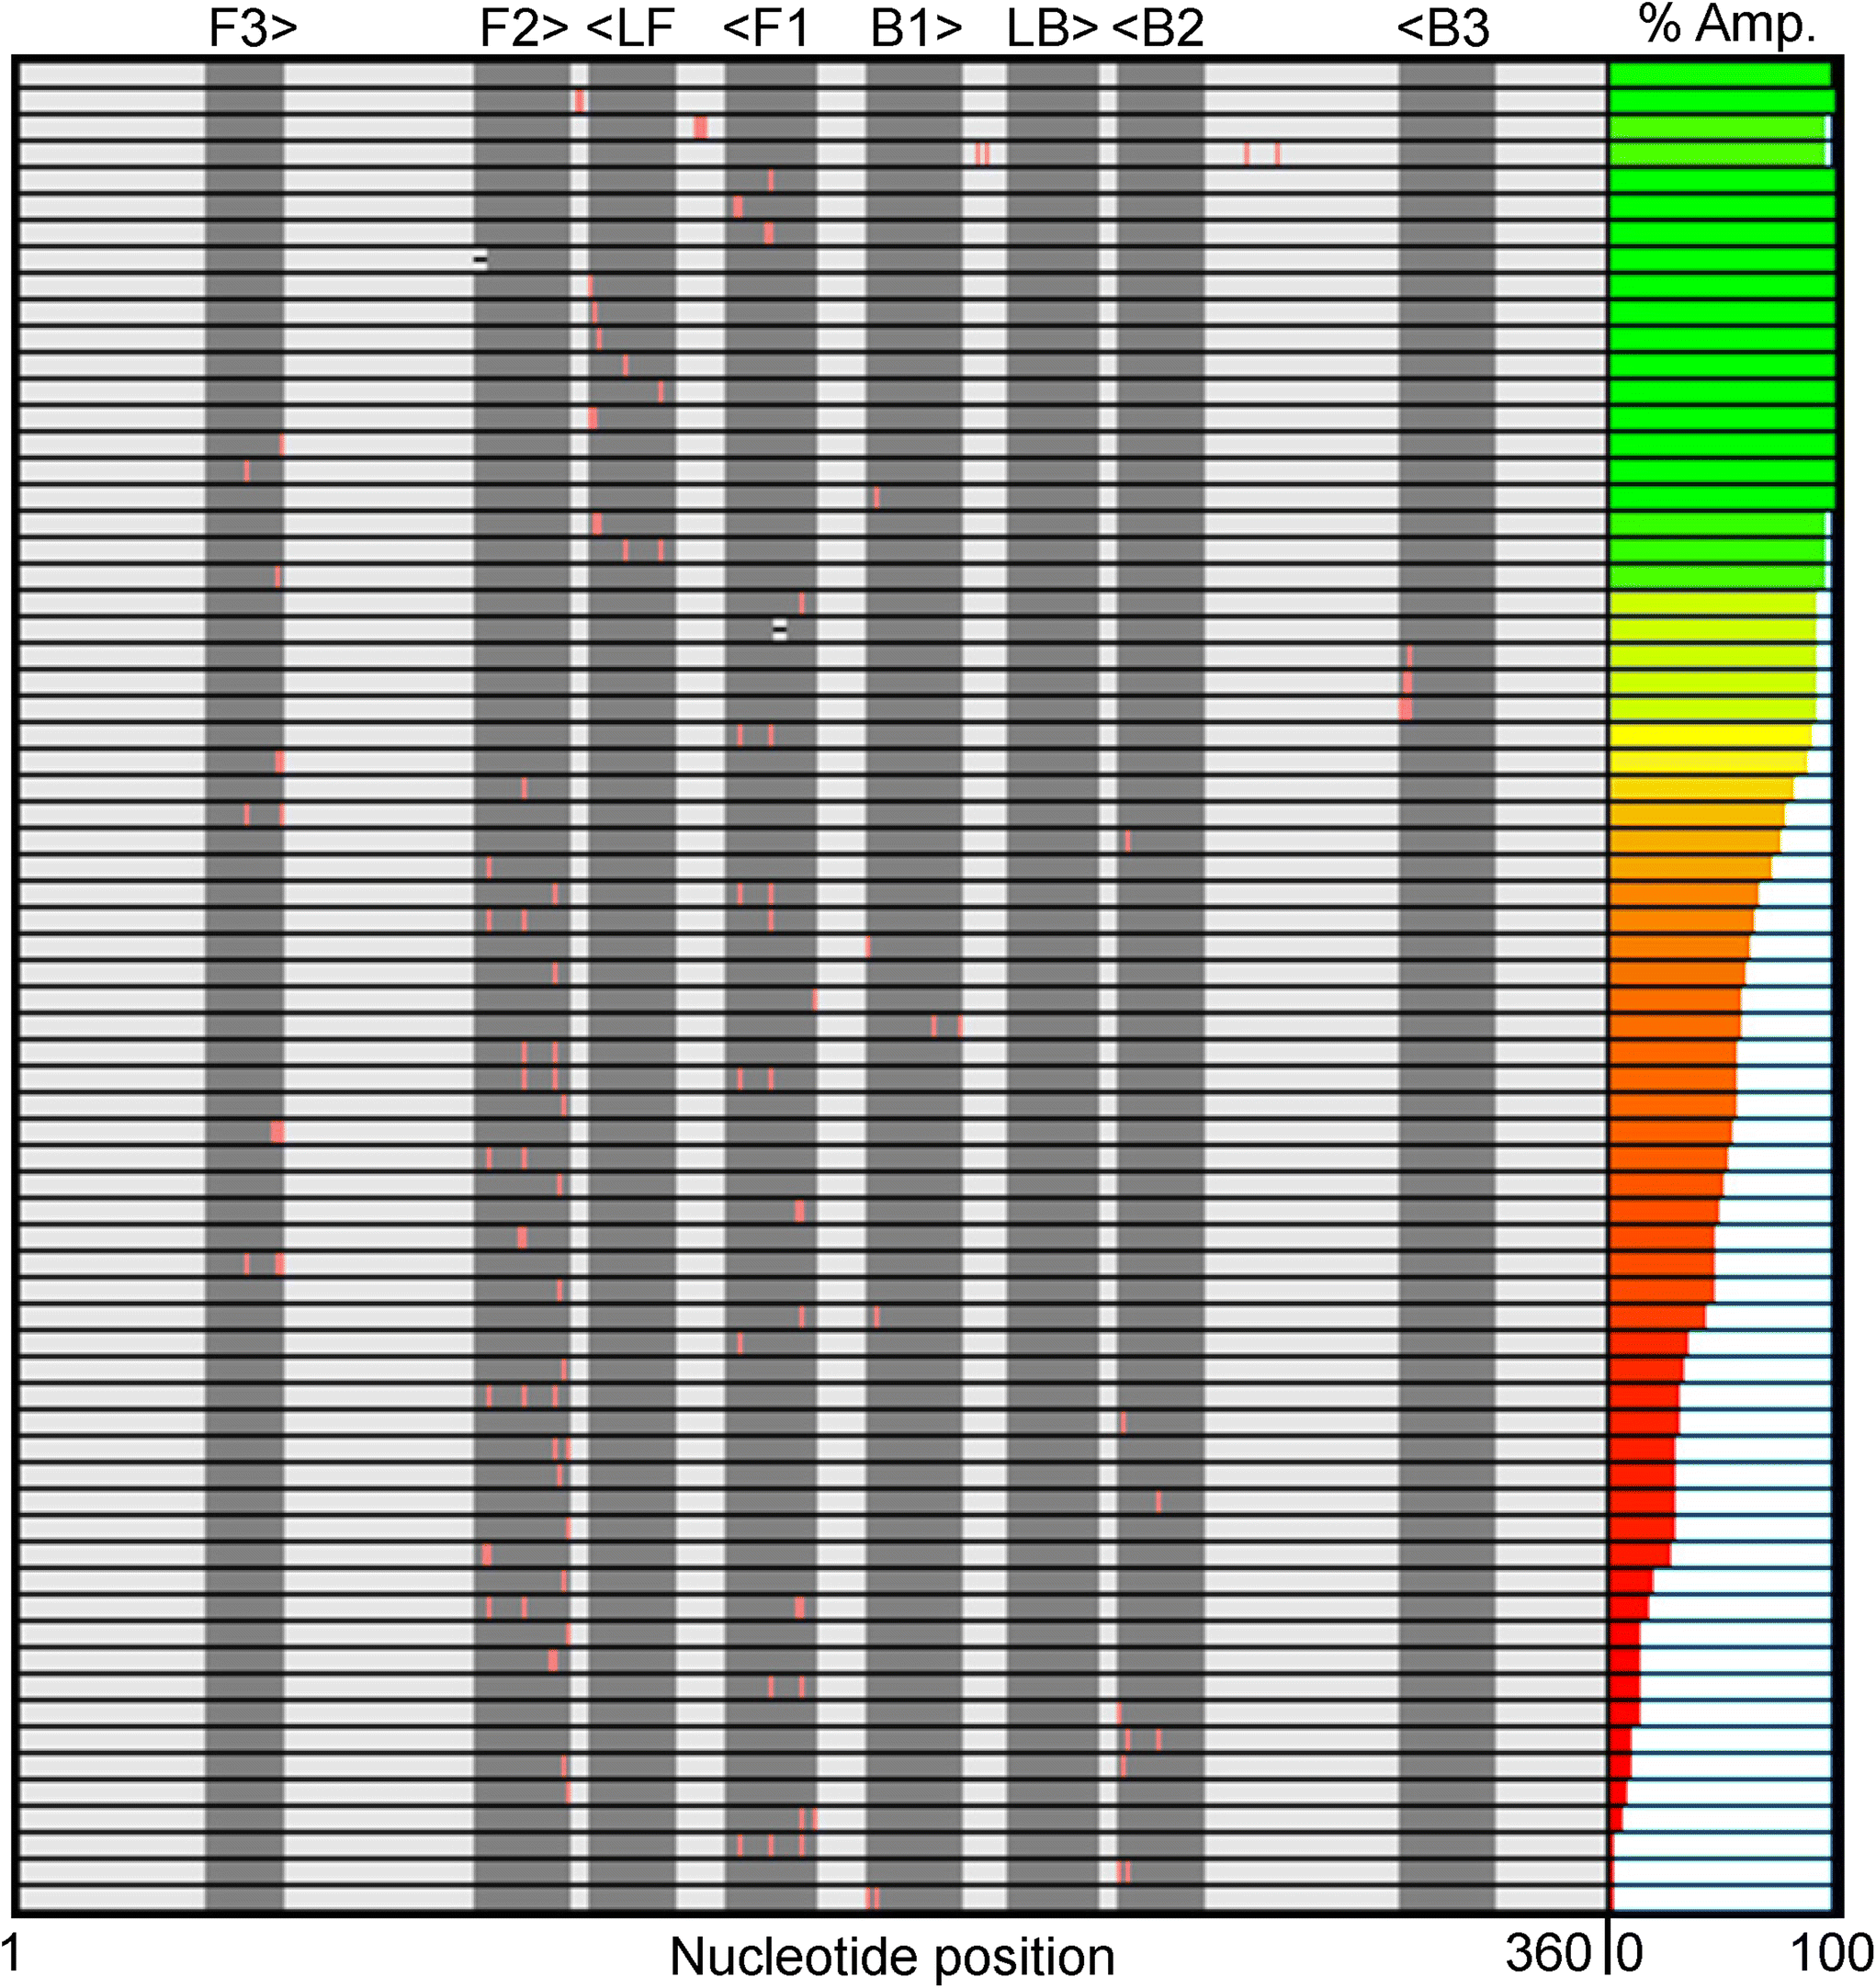 | ||
| Fig. 1 Summary of the priming region, localized position (3′, center, 5′), and number of mutations for each of the 69 samples. Each row is a different sample, with the positive control in the top row. Substitutions are depicted by a pink line and deletions by a black hyphen. The right-most column displays the percent of replicates that amplified (positivity rate) for each sample. | ||
The right-most column in Fig. 1 depicts the percent of total replicates that amplified for each sample (positivity rate), which was determined by end-point fluorescence results. The positivity rate for each sample is listed in Table S3.† The positive control, in the top row, amplified 98.8% of the time (324 of 328 replicates). The concentration of 200 copies of template per reaction was intentionally chosen so that the positive control would amplify ∼99% of the time, as opposed to a higher concentration that would amplify 100% of the time, which we hypothesized would mask the impact of some mutations. Unsurprisingly, samples with modifications outside the priming regions demonstrated very high probabilities of amplification (Fig. 1, rows 2–4).16 Across all samples tested, the percent of replicates that amplified ranged from 0–100%. Fig. 2A and B show representative results portraying high and low positivity rates, respectively.
 | ||
| Fig. 2 Representative end-point (A and B) and real-time (C and D) fluorescence results. Each repeat included 8 replicates. (A) Samples exhibiting excellent amplification (LF-s1-40, LF-s1-41, LF-s1-42, LF-s1-43, LF-s1-44, LF-s1-45, LF-s1-46). (B) Samples with very low positivity rates (F2-s1-39, B2-s1-55, B2-s1-56, B2-s1-57, B2-s1-58, B2-s2-59, B2-s2-60). (C) Real-time amplification curves demonstrating narrow inter-replicate spread. Samples pictured: positive control (black), LF-s1-40 (red), LF-s1-41 (orange), LF-s1-42 (yellow), LF-s1-43 (green), and LF-s1-44 (blue). (D) Real-time amplification curves of samples with larger inter-replicate variance. Samples graphed: positive control (black), B1-s1-62 (red), B3-s1-65 (yellow), B3-s2-66 (green), and B3-s3-67 (blue). | ||
Table S4† shows the calculated values for exact match Tm, percent bound for exact match, mismatch Tm, and percent bound for mismatch for all samples with a single mutation. We were only able to analyze samples with a single-point modification because, to the best of our knowledge, thermodynamic models for samples with multiple mismatches have not been established. We did not see any obvious correlation between mismatch Tm or percent bound for mismatch and sample positivity rate, which could indicate that there are other contributing parameters here.
Table 1 highlights initial statistical analysis in which we compared the percent amplified for each sample with that of the unmodified positive control. We found 24 samples with no statistical difference, indicating that the mutation did not affect amplification. On the contrary, 45 samples were statistically significantly different from the positive control, meaning that the modification hindered the ability of the primers to identify the target for subsequent amplification.
| Sample name | Test statistic | Sample name | Test statistic |
|---|---|---|---|
| F2-s1-1 | <0.0001 | F2-s1-35 | <0.0001 |
| F2-s1-2 | <0.0001 | F2-s1-36 | <0.0001 |
| F2-s1-3 | <0.0001 | F2-s1-37 | <0.0001 |
| F2-s1-4 | <0.0001 | F2-s1-38 | <0.0001 |
| F2-s2-5 | <0.0001 | F2-s1-39 | <0.0001 |
| F2-s2-6 | <0.0001 | LF-s1-40 | >0.9999 |
| F2-s2-7 | <0.0001 | LF-s1-41 | >0.9999 |
| F2-s2-8 | <0.0001 | LF-s1-42 | >0.9999 |
| F2-s2-9 | <0.0001 | LF-s1-43 | >0.9999 |
| F2-s2-10 | <0.0001 | LF-s1-44 | >0.9999 |
| F2-s3-11 | <0.0001 | LF-s2-45 | >0.9999 |
| F1-s1-12 | <0.0001 | LF-s2-46 | 0.3739 |
| F1-s1-13 | <0.0001 | LF-s2-47 | 0.3739 |
| F1-s1-14 | >0.9999 | F3-s1-48 | >0.9999 |
| F1-s1-15 | 0.0565 | F3-s1-49 | 0.2990 |
| F1-s2-16 | <0.0001 | F3-s1-50 | >0.9999 |
| F1-s2-17 | 0.0175 | F3-s2-51 | 0.0028 |
| F1-s2-18 | <0.0001 | F3-s2-52 | <0.0001 |
| F1-s2-19 | >0.9999 | F3-s3-53 | <0.0001 |
| F1-s2-20 | >0.9999 | F3-s3-54 | <0.0001 |
| F1-s2-21 | <0.0001 | B2-s1-55 | <0.0001 |
| F1-s3-22 | <0.0001 | B2-s1-56 | <0.0001 |
| F1-F2-s3-23 | <0.0001 | B2-s1-57 | <0.0001 |
| F1-F2-s3-24 | <0.0001 | B2-s1-58 | <0.0001 |
| F1-F2-s4-25 | <0.0001 | B2-s2-59 | <0.0001 |
| F1-F2-s4-26 | <0.0001 | B2-s2-60 | <0.0001 |
| BTWN-s2-27 | >0.9999 | B1-s1-61 | <0.0001 |
| BTWN-s3-28 | 0.2990 | B1-s1-62 | >0.9999 |
| BTWN-s4-29 | 0.2990 | B1-s2-63 | <0.0001 |
| F2-d3-30 | >0.9999 | B1-s2-64 | <0.0001 |
| F1-d3-31 | 0.0565 | B3-s1-65 | 0.0565 |
| F2-s1-32 | <0.0001 | B3-s2-66 | 0.0565 |
| F2-s1-33 | <0.0001 | B3-s3-67 | 0.2290 |
| F2-s1-34 | <0.0001 | F2-B2-s2-68 | <0.0001 |
| F1-B1-s2-69 | <0.0001 |
We noticed several interesting data points in Fig. 1 and Table 1. We tested three samples with substitutions very near or at the 3′ end of the B3 priming region (B3 is reverse-oriented) and found they all had positivity rates >91%. This was surprising to us because we hypothesized that the 3′ end is critical for target amplification. Alternatively, many modifications near the 3′ end of the F3 priming region seemed to be detrimental to amplification success, as evidenced by positivity rates as low as 46.9%. This could indicate that the F3 primer is more important than B3 for this specific primer set.
We then started grouping the 69 samples logically for further evaluation. First, we organized samples by the priming region in which the mutation was made. Table 2 summarizes the results from the grouped analysis. In short, all groups had positivity rates that were statistically significantly different from the positive control except for samples with mutations in the LF priming region. This is unsurprising because only the F3, B3, FIP (F1 + F2), and BIP (B1 + B2) primers are required for amplification. The loop primers (LF and LB) are designed to enhance the speed of the LAMP assay.13 There were individual samples within each of these significant groups for which specific mutations didn't alter amplification; however, when samples were categorized by priming region, the samples with poor amplification greatly outnumbered those with high positivity rates. We then combined samples with modifications in the forward or backward direction of the same priming region to see if a larger sample size affected the statistical outcome. We believe this classification is valid for a dsDNA template (although not necessarily for an RNA template) since the matched forward and backward primers have a similar mechanistic role during LAMP amplification.11 As seen in Table 2, the F1/B1, F2/B2, and F3/B3 combined groups have the same statistical outcome as when they were separate.
| Group | Test statistic | Significance |
|---|---|---|
| ns = no significance; ****significance: p-value ≤ 0.0001. | ||
| F1 | <0.0001 | **** |
| F2 | <0.0001 | **** |
| F3 | <0.0001 | **** |
| LF | 0.7001 | ns |
| B1 | <0.0001 | **** |
| B2 | <0.0001 | **** |
| F1/B1 | <0.0001 | **** |
| F2/B2 | <0.0001 | **** |
| F3/B3 | <0.0001 | **** |
Next, we wanted to determine if the number of mutations or localized position led to differences in amplification. The top two rows in Table 3 show the results when comparing one (s1) and two (s2) substitutions within the same priming region. The lack of significance between the paired groups suggests that the number of mutations isn't correlated with the number of replicates that amplified. For the next pairings, we combined samples with modifications in the forward or backward segments of the same priming region to ensure sufficient sample size for analysis. Results demonstrate no significant difference between samples with mutations localized at opposing ends of the same priming region (3′ vs. 5′). It is worth noting that samples used for the localized position comparison did not have mutations at the same exact position within the primer, but rather all modifications were within four nucleotides of the end, which allowed us to broadly group samples as having 3′ or 5′ mutations. The bottom two rows in Table 3 show an interesting trend. Again, we merged samples with modifications in the forward or backward segments of the same priming region to increase sample size for more robust statistical analysis of one vs. two substitutions. We noticed the p-values for these pairings with larger sample sizes (bottom two rows) were significantly lower than when we analyzed a smaller number of samples with mutations in the forward sequence alone (top two rows). Because the test statistic changed with sample size, we believe we need to test more samples with a wider variety of sequence modifications to begin to uncover true trends and make generalizable predictions.
| Group 1 | Group 2 | Test statistic | Significance |
|---|---|---|---|
| ns = no significance; *significance: p-value ≤ 0.05; **significance: p ≤ 0.01. | |||
| F1-s1 | F1-s2 | >0.9999 | ns |
| F2-s1 | F2-s2 | 0.1720 | ns |
| F1/B1-3′ | F1/B1-5′ | 0.3448 | ns |
| F2/B2-3′ | F2/B2-5′ | 0.2341 | ns |
| F1/B1-s1 | F1/B1-s2 | 0.0214 | * |
| F2/B2-s1 | F2/B2-s2 | 0.0039 | ** |
Of the 69 samples tested, 24 exhibited excellent amplification and their positivity rates were not significantly different from the positive control (Table 1). However, the positivity rate is simply a ratio of the end-point positives over the total replicates tested, which does not provide any information about assay speed or variance. Since we also collected real-time amplification data, we looked at the fluorescence curves and Ct values to further analyze this subset of samples. We noticed that the real-time curves of replicates for some samples were tightly clustered (Fig. 2C) like the positive control, while others had large gaps between replicates (Fig. 2D). To explore this phenomenon further, we ran multiple F-tests using the Ct variance and compared each of the 24 samples in this subset to the positive control. As seen in Table 4, the calculated F-value was larger than F-critical for majority of the samples, leading us to reject the null hypothesis that population variances are equal. This statistical analysis generally matches our qualitative observations of the inter-replicate spread of the real-time curves. Several samples with mutations between priming regions (BTWN) and with changes in the LF binding site had similar variances to the positive control which was unsurprising for reasons discussed above. Interestingly, one of the samples modified between priming regions and 6 of the LF-mutated samples exhibited variances that were significantly larger than that of the positive control. This could be a result of the inherent variability of the LAMP mechanism, even among replicates, and especially at template concentrations nearing the limit of detection.17,18 We would need a larger sample size to determine if these instances truly represent an unforeseeable trend and to increase our confidence in the results.
| Sample name | Ct variance | F-Value | F-Critical | Reject null? |
|---|---|---|---|---|
| Null hypothesis: both populations have equal variances (α = 0.05). | ||||
| Pos control | 0.740 | – | – | – |
| F1-s1-14 | 3.028 | 4.094 | 1.507 | Yes |
| F1-s1-15 | 4.368 | 5.906 | 1.522 | Yes |
| F1-s2-19 | 0.397 | 1.863 | 1.644 | Yes |
| F1-s2-20 | 14.364 | 19.421 | 1.507 | Yes |
| BTWN-s2-27 | 0.240 | 3.080 | 1.790 | Yes |
| BTWN-s3-28 | 0.436 | 1.698 | 1.815 | No |
| BTWN-s4-29 | 0.608 | 1.216 | 1.815 | No |
| F2-d3-30 | 3.920 | 5.301 | 1.581 | Yes |
| F1-d3-31 | 5.290 | 7.153 | 1.607 | Yes |
| LF-s1-40 | 1.588 | 2.147 | 1.507 | Yes |
| LF-s1-41 | 1.369 | 1.851 | 1.507 | Yes |
| LF-s1-42 | 0.810 | 1.095 | 1.507 | No |
| LF-s1-43 | 0.980 | 1.325 | 1.507 | No |
| LF-s1-44 | 0.360 | 2.054 | 1.644 | Yes |
| LF-s2-45 | 1.742 | 2.356 | 1.507 | Yes |
| LF-s2-46 | 5.108 | 6.906 | 1.514 | Yes |
| LF-s2-47 | 1.513 | 2.046 | 1.514 | Yes |
| F3-s1-48 | 1.210 | 1.636 | 1.581 | Yes |
| F3-s1-49 | 5.570 | 7.531 | 1.594 | Yes |
| F3-s1-50 | 19.184 | 25.939 | 1.581 | Yes |
| B1-s1-62 | 0.436 | 1.698 | 1.790 | No |
| B3-s1-65 | 17.808 | 24.078 | 1.607 | Yes |
| B3-s2-66 | 48.442 | 65.497 | 1.607 | Yes |
| B3-s3-67 | 8.410 | 11.371 | 1.594 | Yes |
In diagnostic scenarios, it is critical to understand the impact of genetic drift on both the sensitivity and speed of molecular assays. Traditionally, diagnostic test sensitivity is determined to be the concentration at which there is a 95% probability of successful amplification (LOD95) using a probit analysis or similar methodology. If mutations inhibit amplification at moderate or low concentrations, it certainly will affect assay performance metrics such as LOD95. Other nucleotide modifications may slow amplification, causing some replicates to be undetectable within the pre-determined reaction time. Altogether, this could lead to an increase in the false-negative rate (decreased clinical sensitivity), with a corresponding reduction in the effectiveness of outbreak control measures that depend on accurate diagnostics.
We used DNA templates even though our model organism is an RNA virus because it is straightforward and inexpensive to obtain synthetic gene-sized segments of dsDNA with a defined sequence at a known concentration. We incorporated a T7 transcription start site into the template so that in future work we can transcribe the modified sequence into RNA and perform RT-LAMP to determine if an assay targeting RNA has similar intolerances to point mutations as a LAMP assay using dsDNA. This process will require significant optimization to quantify and normalize the resulting RNA and ensure complete digestion of DNA prior to RT-LAMP.
In this work, we modified the target sequence itself, via substitutions or deletions, to imitate genetic drift. Further, we explored the effects of multi-point mutations (1–4) on LAMP assay sensitivity and speed. Both experimental design choices were a conscious effort to better represent SARS-CoV-2 mutations that have been documented throughout the pandemic. For example, both Alpha (B.1.1.7) and Omicron (B.1.1.529) variants have multi-point substitutions and deletions in addition to a handful of consecutive base modifications.19
Conclusions
Here, we made single- and multi-point mutations (up to four) in seven of the eight priming regions of a model SARS-CoV-2 template. We evaluated LAMP primer performance using both end-point and real-time fluorescence results to better understand how molecular assay sensitivity and speed change as a result of nucleotide modifications. Many samples exhibited poor amplification when analyzed at end point, indicating that the mutations completely hindered the primers’ ability to identify the target sequence, thereby negatively impacting assay sensitivity. Other samples generated many positive replicates, but upon further analysis of the real-time curves, the amplification speed was reduced. The handful of samples that were not statistically different from the positive control in terms of percent amplified and variance, had modifications in either the LF binding site or between priming regions. Although majority of these results align with our understanding of the LAMP mechanism, we believe many more samples need to be tested to comprehend some of the unexpected results and to uncover generalizable trends.This work here expands on the minimal research in the field of LAMP and nucleotide mutations. And the limited data that does exist was collected using samples that were designed and tested differently, making comparisons very difficult. The samples used in this study are a good representation of natural viral evolution because many templates had multiple mutations and the modifications were made directly in the genetic sequence. Understanding how genetic drift affects nucleic acid amplification assays will help scientists decide whether to proactively re-design primers when new variants emerge to avoid microorganisms that escape detection. Employing updated and precise assay primers will ultimately increase confidence in diagnostic test accuracy in the face of genetic drift and reduce the likelihood of false negative clinical diagnoses.
In the future, we could systematically make substitutions at every base position in which the six LAMP primers bind and produce additional sequences with multiple mutations, deletions, and insertions for analysis. Additional data would provide a more complete picture of how nucleotide modifications affect downstream detection mechanisms. Expanding data collection is especially important since we found that single-point mutations within the target region may inhibit primer binding more than previous work suggested.14 Further, we could explore mutations in other LAMP-targeted genome sequences to determine if these results are generalizable across different gene targets and a variety of pathogens. Continued research efforts could lead to the development of predictive modelling tools that would allow scientists to anticipate changes in molecular diagnostic test accuracy in the face of pathogen genetic drift.
Author contributions
RJM conceptualized project. TJM and RJM designed experiments. TJM and ERB performed experiments. TJM, ERB, and RJM analyzed data. TJM and ERB wrote the manuscript with contributions and edits from RJM.Conflicts of interest
There are no conflicts to declare.Acknowledgements
This work was supported by the Laboratory Directed Research and Development program at Sandia National Laboratories. This article has been authored by an employee of National Technology & Engineering Solutions of Sandia, LLC under Contract No. DE-NA0003525 with the U.S. Department of Energy (DOE). The employee owns all right, title, and interest in and to the article and is solely responsible for its contents. The United States Government retains and the publisher, by accepting the article for publication, acknowledges that the United States Government retains a non-exclusive, paid-up, irrevocable, world-wide license to publish or reproduce the published form of this article or allow others to do so, for United States Government purposes. The DOE will provide public access to these results of federally sponsored research in accordance with the DOE Public Access Plan https://www.energy.gov/downloads/doe-public-access-plan.This research was performed under an appointment to the Minority Serving Institutions Internship Program (MSIIP) administered by the Oak Ridge Institute for Science and Education (ORISE) for the National Nuclear Security Administration (NNSA) and U.S. NNSA Minority Serving Institutions Internship Program (MSIIP) Guidelines | 11 Department of Energy (DOE). ORISE is managed by Oak Ridge Associated Universities (ORAU). All opinions expressed in this paper are the author's and do not necessarily reflect the policies and views of NNSA, DOE, ORISE or ORAU.
References
- NEB, Primer Monitor Tool, https://primer-monitor.neb.com/.
- T. Wesselman, 2021, https://www.rosalind.bio/blog/rosalind-dxm-launch.
- C. B. F. Vogels, M. I. Breban, I. M. Ott, T. Alpert, M. E. Petrone, A. E. Watkins, C. C. Kalinich, R. Earnest, J. E. Rothman, J. Goes de Jesus, I. Morales Claro, G. Magalhães Ferreira, M. A. E. Crispim, Brazil-UK CADDE Genomic Network, L. Singh, H. Tegally, U. J. Anyaneji, A. Network for Genomic Surveillance in South, E. B. Hodcroft, C. E. Mason, G. Khullar, J. Metti, J. T. Dudley, M. J. MacKay, M. Nash, J. Wang, C. Liu, P. Hui, S. Murphy, C. Neal, E. Laszlo, M. L. Landry, A. Muyombwe, R. Downing, J. Razeq, T. de Oliveira, N. R. Faria, E. C. Sabino, R. A. Neher, J. R. Fauver and N. D. Grubaugh, PLoS Biol., 2021, 19, e3001236 CrossRef CAS PubMed.
- H. Wang, S. Jean, S. A. Wilson, J. M. Lucyshyn, S. McGrath, R. K. Wilson, V. Magrini and A. L. Leber, Diagn. Microbiol. Infect. Dis., 2022, 102, 115631 CrossRef CAS.
- M. Artesi, S. Bontems, P. Göbbels, M. Franckh, P. Maes, R. Boreux, C. Meex, P. Melin, M.-P. Hayette, V. Bours and K. Durkin, J. Clin. Microbiol., 2020, 58, e01598-20 CrossRef.
- M. Vanaerschot, S. A. Mann, J. T. Webber, J. Kamm, S. M. Bell, J. Bell, S. N. Hong, M. P. Nguyen, L. Y. Chan, K. D. Bhatt, M. Tan, A. M. Detweiler, A. Espinosa, W. Wu, J. Batson, D. Dynerman, D. A. Wadford, A. S. Puschnik, N. Neff, V. Ahyong, S. Miller, P. Ayscue, C. M. Tato, S. Paul, A. L. Kistler, J. L. DeRisi and E. D. Crawford, J. Clin. Microbiol., 2020, 59, e02369-20 CrossRef.
- S. Tahan, B. A. Parikh, L. Droit, M. A. Wallace, C.-A. D. Burnham and D. Wang, J. Clin. Microbiol., 2021, 59, e00075-21 CrossRef PubMed.
- F. Zimmermann, M. Urban, C. Krüger, M. Walter, R. Wölfel and K. Zwirglmaier, J. Virol. Methods, 2022, 299, 114352 CrossRef CAS PubMed.
- L. Amato, L. Jurisic, I. Puglia, V. Di Lollo, V. Curini, G. Torzi, A. Di Girolamo, I. Mangone, A. Mancinelli, N. Decaro, P. Calistri, F. Di Giallonardo, A. Lorusso and N. D'Alterio, Emerging Microbes Infect., 2021, 10, 1148–1155 CrossRef CAS PubMed.
- A. Jain, M. Rophina, S. Mahajan, B. B. Krishnan, M. Sharma, S. Mandal, T. Fernandez, S. Sultanji, B. Jolly, S. Mathew, S. Sivasubbu and V. Scaria, Int. J. Infect. Dis., 2021, 102, 460–462 CrossRef CAS PubMed.
- T. Notomi, H. Okayama, H. Masubuchi, T. Yonekawa, K. Watanabe, N. Amino and T. Hase, Nucleic Acids Res., 2000, 28, e63 CrossRef CAS PubMed.
- S. Kwok, D. E. Kellogg, N. McKinney, D. Spasic, L. Goda, C. Levenson and J. J. Sninsky, Nucleic Acids Res., 1990, 18, 999–1005 CrossRef CAS PubMed.
- K. Nagamine, T. Hase and T. Notomi, Mol. Cell. Probes, 2002, 16, 223–229 CrossRef CAS PubMed.
- E. Tamanaha, Y. Zhang and N. A. Tanner, PLoS One, 2022, 17, e0259610 CrossRef CAS PubMed.
- C. S. Ball, Y. K. Light, C.-Y. Koh, S. S. Wheeler, L. L. Coffey and R. J. Meagher, Anal. Chem., 2016, 88, 3562–3568 CrossRef CAS PubMed.
- L. T. Almeida, A. B. Gonçalves, A. P. M. Franco-Luiz, T. B. de Souza Silva, P. A. Alves and R. L. do Monte-Neto, Mem. Inst. Oswaldo Cruz, 2022, 117, e220050 CrossRef CAS PubMed.
- P. Hardinge and J. A. H. Murray, Sci. Rep., 2020, 10, 916 CrossRef CAS PubMed.
- O. A. Gandelman, V. L. Church, C. A. Moore, G. Kiddle, C. A. Carne, S. Parmar, H. Jalal, L. C. Tisi and J. A. H. Murray, PLoS One, 2010, 5, e14155 CrossRef CAS PubMed.
- Tracking SARS-CoV-2 variants, (accessed December 2022).
Footnote |
| † Electronic supplementary information (ESI) available. See DOI: https://doi.org/10.1039/d3an01927f |
| This journal is © The Royal Society of Chemistry 2024 |