A review of electrochemical impedance as a tool for examining cell biology and subcellular mechanisms: merits, limits, and future prospects
Seyedyousef
Arman
ab,
Richard D.
Tilley
 ac and
J. Justin
Gooding
 *ab
*ab
aSchool of Chemistry, The University of New South Wales, Sydney, New South Wales 2052, Australia. E-mail: justin.gooding@unsw.edu.au
bAustralia Centre for Nanomedicine, The University of New South Wales, Sydney, New South Wales 2052, Australia
cElectron Microscope Unit, Mark Wainwright Analytical Centre, The University of New South Wales, Sydney, New South Wales 2052, Australia
First published on 23rd November 2023
Abstract
Herein the development of cellular impedance biosensors, electrochemical impedance spectroscopy, and the general principles and terms associated with the cell–electrode interface is reviewed. This family of techniques provides quantitative and sensitive information into cell responses to stimuli in real-time with high temporal resolution. The applications of cell-based impedance biosensors as a readout in cell biology is illustrated with a diverse range of examples. The current state of the field, its limitations, the possible available solutions, and the potential benefits of developing biosensors are discussed.
1. Introduction
The biggest challenge to deciphering the language of biological cells arises from the complex nature of the cells and countless interactions in different cell lines.1 The development of screening methods capable of unveiling the myriad of questions arising from the interaction of biological cells with drugs has been an area of intensive research in biology, pharmacy, biochemistry, biophysics, and engineering.1–4 Most cell-based assays currently rely on identifying and visualization of cellular regulating molecules using fluorescent dyes or genetically encoded fluorescent indicators.5–8Even though these fluorescent techniques have had immense success, label-free technologies are emerging as a promising alternative in providing continuous, real-time insights into the physiological function of cells.9–15 The central concept that renders label-free biosensors attractive is the potential for a low cost and the continuous record of cells in response to their environment.16 As these non-invasive assays omit the labelling step and use native cells, question over the addition of detection reagents is not required.
There are a different label-free approaches to monitor cells such as resonant waveguide grating (RWG), surface plasmon resonance (SPR), acoustic biosensors, electrochemiluminescence and electrochemical impedance-based biosensors.17–24 Of these, electrochemical impedance methods are ideal for the continuous monitoring of cells, with high temporal resolution, as they respond to stimuli.
Electrochemical impedance spectroscopy (EIS) has been widely utilized in different areas of chemical science.25–28 Over the past few decades, there has been a growing interest among researchers in using EIS for investigations in cell biology.29–36 The interest in cell biology was stimulated by the 1984 report by Giaever and Keese on what they called electric cell–substrate impedance sensing (ECIS). The technique enables continuous, quantitative and qualitative evaluation of live cells in biological media.37 The central idea is that the cell membranes can be considered as insulating entities such that culturing and/or incubating cells on an electrode surface can function as a barrier that impedes the flow of electrical signals.38 By monitoring the time-dependent alterations in impedance, encompassing resistance and capacitance, the method is able to provide information on cellular processes occurring directly on the electrode surface. Researchers may determine and characterize the differences in cell states by comparing the impedance profiles recorded at various times or under different experimental circumstances. Impedance signals may serve as indicators for several biological phenomena, including cell attachment, spreading,38 the extent of cell adherence to the modified electrode surface39 micromotion,40 proliferation, migration,41 tumour metastasis,42 cell signalling,43 and barrier function of the cells.44 As cell barrier behaviour is linked to intracellular interactions inside the cell, impedance can be utilised for the purpose of analysing both intracellular and intercellular level. Accordingly, impedance cell biosensing has been successfully established to investigate chronic diseases including epithelial and endothelial barrier function,45,46 cancer,47 cytotoxicity,48 infectious diseases49 and the response of cells to drugs.50 This review sets out to explain the main concepts behind impedance, the pros and cons of cell-based impedance biosensor performance and future research opportunities in the application of impedance biosensors in a variety of biological contexts.
2. Principles and terms in electrochemical impedance spectroscopy
In electrical circuits, resistance and impedance are commonly understood as elements that impede the flow of electrical current. They could be evaluated as the ratio between the input voltage and the resulting current that passes through an electrical circuit. Despite the similarity in definition and computation between impedance and resistance values, their fundamental origins are different. The concept of resistance is based on the utilisation of a DC signal, whereas impedance is dependent upon applying an AC signal.51 The impedance could be derived by applying either voltage or current to the working electrode, and according to the transfer function: | (1) |
 | (2) |
The angular frequency (ω) could be written as a function of conventional frequency (f):
| ω = 2πf. | (3) |
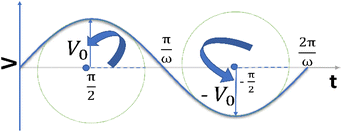
It is noteworthy that the excitation signal of an AC source typically exhibits a low magnitude, owing to the linear nature of the current–overpotential relationship at low overpotential levels. Consequently, applying a low-amplitude voltage at a frequency of ω leads to the generation of an alternating current with a similar frequency and a phase shift. Both current and voltage can be represented with separate vectors ( or
or  ) that rotate at the same frequency. According to the data presented in Fig. 2, it can be observed that the current and potential exhibit a phase difference, which results in the possibility of vector separation by a constant phase angle (φ) as the vectors undergo rotation.55 Therefore, the expression for the current vector of length I0 is as follows:
 | (4) |
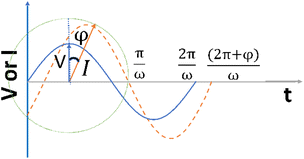 | ||
| Fig. 2 The alternating current exhibits a sinusoidal response to the applied voltage waveform at an angular frequency of ω in a linear system. | ||
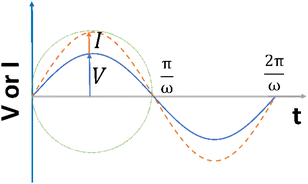
The principle of resistance, which adheres to Ohm's law and remains unaffected by frequency, is applicable to AC circuits when the vectors of current and voltage are in phase with each other (as depicted in Fig. 3). The current and voltage in vector notation for a pure resistance (R) subjected to a sinusoidal potential, in accordance with Ohm's law, can be expressed as follows, with a phase angle of zero:55,56
 | (5) |
 | (6) |
In addition, when a sinusoidal current is applied to a pure capacitance, the expressions for charge and current can be represented as Q = CV or  . The phasor notation representation of the current is as follows:
 | (7) |
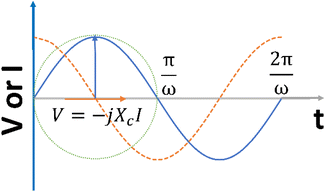
Fig. 4 shows that the phasor notation for the current and voltage has a phase angle shift of  , and the vectors are situated within the same plane. Given that the phase angles for a pure resistance and pure capacitance are 0 and π/2, respectively, it is reasonable to anticipate an intermediate phase for a combination of resistance and capacitance.55 Therefore, the phase shift (φ) in relation to the voltage waveform as well as the amplitude have an impact on the current–time function. The use of complex arguments has been suggested to facilitate mathematical procedures. In the field of complex analysis, it is common practise to designate the terms along the Y-axis that pertain to capacitance behaviour as the imaginary part. This is denoted by the imaginary unit, which is represented by the symbol
  . Conversely, the terms along the X-axis, which relate to resistance behaviour, are typically regarded as the real part.54 Accordingly, the potential in phasor notation could be expressed as follow:
 | (8) |
When examining the application of a sinusoidal potential to a series circuit consisting of resistance and capacitance, it can be observed that the overall potential is equivalent to the combined potential drop across both the resistor and the capacitor. The voltage can be determined by analysing the current through the impedance vector, which is represented by the equation (Z = R − iXc) as follow:55
 | (9) |
Various plots can be used to demonstrate the impedance outcomes. Table 1 summarises the pertinent parameters, definitions, and modes of illustration.57Table 1 presents a description of the magnitude of the impedance and the corresponding phase angle, both of which are dependent on the frequency. Impedance spectroscopy typically involves frequency sweeps ranging from several kHz to 10−1 or 10−3 Hz. It is feasible to restrict the frequency range to a limited number of frequencies or a singular frequency mode with the aim of acquiring specific information during a certain time. Under such circumstances, it is possible to measure the temporal variation of resistance or capacitance. The utilisation of alternating current signals exhibiting varying frequencies, as opposed to direct current waveforms, may yield more significant insights at each frequency interval, encompassing the double-layer capacitance of the electrochemical system being examined.57
| Result description | Related parameters | Definition | Illustration |
|---|---|---|---|
| Nyquist plot | Z(ω) = Zre − iZim | Impedance | Z Imaginary vs. Z Real |
| Bodé module | |Z| = (Zre)2 + (Zim)2 | Magnitude of impedance | |Z| vs. frequency |
| Bodé phase plot | tan![[thin space (1/6-em)]](https://www.rsc.org/images/entities/char_2009.gif) φ = Zim/Zre = Xc/R = 1/ωRc φ = Zim/Zre = Xc/R = 1/ωRc |
Phase angle | Φ vs. frequency |
3. The beginning of impedance analysis in cell biosensing
Giaever and Keese37 conducted a study aimed at comprehending the impacts of electromagnetic fields on cells, which led to the development of cellular impedance biosensors.58 For the first time, they applied a DC potential to mammalian cells by placing them between two electrodes. However, the ions emanating from the surface of the electrodes resulted in the death of the cells. The technique of impedance sensing for cellular analysis was developed by utilising a single-frequency AC signal instead of a DC signal with a relatively high frequency in an effort to impede the generation of ion products on the surface. Despite this, identical impedance responses were produced on a large working electrode regardless of whether cells were present or not. This observation suggested that the culture solution resistance was far greater compared to that of the layer of cells present on the electrode, and it dominated the overall results of the test. Since the resistance of the medium is in line with the solid–liquid interface impedance, the impedance response of the cells on the surface depends extremely on the dimension of the sensing (working) electrode.40,58 In general, the total impedance in biological sensing employing impedance is governed by the sensing electrode impedance, hence counter electrode impedance must be lower compared to the sensing electrode.51,52,57In the very first arrangement proposed by Giaever and Keese, the ratio of the area of the working electrode (WE) to the counter electrode (CE) was approximately 1![[thin space (1/6-em)]](https://www.rsc.org/images/entities/char_2009.gif) :
:![[thin space (1/6-em)]](https://www.rsc.org/images/entities/char_2009.gif) 1500.37 The initial setup for cell sensing in a Petri dish is illustrated in Fig. 5. This configuration comprises a large gold electrode (2 cm2) functioning as a counter and four tiny golden electrodes (3 × 10⁻⁴ cm2) serving as sensing electrodes. They used a lock-in amplifier to provide an AC signal of 100 mV between the small working electrodes and large counter electrode, and the constant current between the electrodes was reported to be about 1 μA.37,58,59
1500.37 The initial setup for cell sensing in a Petri dish is illustrated in Fig. 5. This configuration comprises a large gold electrode (2 cm2) functioning as a counter and four tiny golden electrodes (3 × 10⁻⁴ cm2) serving as sensing electrodes. They used a lock-in amplifier to provide an AC signal of 100 mV between the small working electrodes and large counter electrode, and the constant current between the electrodes was reported to be about 1 μA.37,58,59
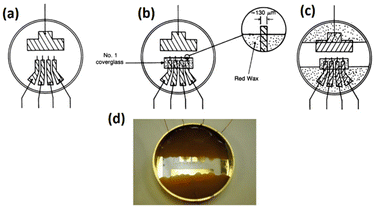 | ||
| Fig. 5 (a) The initial electrode setup for use as a biosensor in cellular analysis is shown. It illustrates the schematic of the gold pattern on the bottom of the Petri dish with a large gold rectangle as the counter electrode and four smaller microelectrodes as sensing electrodes. Copper wires are soldered to all electrodes. (b) This step involves enclosing the four microelectrodes using a glass coverslip while maintaining a precise distance of 100 μm between the edge of the coverslip and the four microelectrodes. (c) The image illustrates the application of molten red wax as an insulating material for the gold–copper contacts. (d) The provided image represents the initial electrode arrangement used for conducting electric cell–substrate impedance sensing. Images (a–c) are reproduced from ref. 37 PNAS. The figure (d) is reprinted from ref. 58 with permission from Springer; permission obtained through Copyright Clearance Center, Inc. | ||
The literature reveals that various electrode configurations have been developed to ensure that the impedance of the sensing electrode dominates that of the solution resistance.60–66 Due to the requirement of a significantly smaller sensing electrode in comparison to the counter electrode, the monitoring capacity of cells is restricted to a limited number at any given time.58,66 Parallel utilisation of multiple sensing electrodes has been a common practise in most configurations.58,60–66 An approach that could be employed involves the use of multiplexers that facilitate switching between different electrodes. As a result, the number of cells under analysis increases by a factor equal to the number of electrodes used.60,67
Important progress has also been made in the field of electrical impedance cell biosensing, with the development of interdigitated electrodes in 1996![[thin space (1/6-em)]](https://www.rsc.org/images/entities/char_2009.gif) 68 as a novel electrode arrangement for monitoring cell activity at the surface. Applied Biophysics (under the trade name ECIS), ACEA (under the trade name xCELLigence), and MDS Sciex (under the trade names Roche and Cell Key) have all commercialised various electrode configurations and formats (8, 16, 96, and 384 wells).69 All commercial devices utilised the identical approach of using small sensing electrodes combined with a large counter electrode or interdigitated electrode pattern. The sensitivity of a systems can vary depending on the electrode configuration used.70 The configuration of the electrode has the potential to mitigate the impact of solution resistance within the system. Reducing the sensing area is a commonly employed strategy to enhance the sensitivity of detecting alterations in microelectrodes covered by cells.66,70 However, it has been reported66 that the ultra-sensitivity of impedance biosensors may lead to the instability of electrical signals, which can result in issues with data replication.
68 as a novel electrode arrangement for monitoring cell activity at the surface. Applied Biophysics (under the trade name ECIS), ACEA (under the trade name xCELLigence), and MDS Sciex (under the trade names Roche and Cell Key) have all commercialised various electrode configurations and formats (8, 16, 96, and 384 wells).69 All commercial devices utilised the identical approach of using small sensing electrodes combined with a large counter electrode or interdigitated electrode pattern. The sensitivity of a systems can vary depending on the electrode configuration used.70 The configuration of the electrode has the potential to mitigate the impact of solution resistance within the system. Reducing the sensing area is a commonly employed strategy to enhance the sensitivity of detecting alterations in microelectrodes covered by cells.66,70 However, it has been reported66 that the ultra-sensitivity of impedance biosensors may lead to the instability of electrical signals, which can result in issues with data replication.
Stolwijk et al.,66 demonstrated the significance of electrode configuration by employing three different electrode configurations (8W1E, 8W10E, and 8W10E+) to examine the barrier function of HDMEC cells, as depicted in Fig. 6. According to Fig. 6a and b, it can be observed that the sensing area of 8W1E (5 × 10⁻⁵ cm2) is 10 times smaller than that of 8W10E. As a result, the number of cells that can be monitored using 8W1E is limited, ranging from 20 to 100 cells depending on the cell-line. Despite the fact that the resistance associated with the 8W1E setup exhibits a greater value than that of 8W10E (as depicted in Fig. 6d), the sensitivity (as illustrated in Fig. 6e) remains nearly identical. Increasing the number of cells under observation may be advantageous in reveal certain biological responses exhibited by the cells. Regarding this matter, it can be observed that 8W10E+ (as shown in Fig. 6c) has the capacity to accommodate a greater number of cells due to the presence of 40 circular sensing electrodes, each arranged on an interdigitated gold pattern. Based on the observations made in Fig. 6d and e, it is evident that despite the different configuration of 8W10E as compared to 8W10E+, both exhibit comparable electrical characteristics. The observed behaviour can be attributed to similar contributions from both the sensing and counter electrodes.
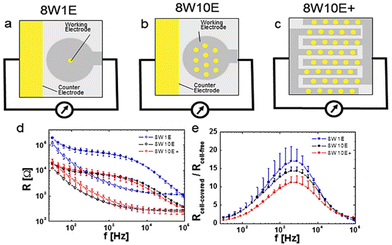 | ||
| Fig. 6 The impact of electrode configurations on the sensitivity of electrical cellular impedance biosensor analysis. (a–c) Schematic drawings of microelectrode patterns on the bottom of a single well belonging to commercial 8W1E plate, which includes 8 wells and 1 × 250 μm circular sensing electrode in diameter, versus a large counter electrode per well, 8W10E plate, including 8 wells and 10 × 250 μm circular sensing electrodes in diameter, versus a large counter electrode per well, 8W10E+ plate, including 8 wells and 20 × 250 μm circular sensing electrodes in diameter, versus 20 × 250 μm circular counter electrodes in diameter on an interdigitated pattern per well. (d) Resistance response of cells at different frequencies for 8W1E, 8W10E, and 8W10E+. (e) Analysis of the sensitivity of cell sensing for the three electrode configurations by measuring Rcell-covered/Rcell-free. The figure reprinted from ref. 66 with permission from Springer; permission obtained through Copyright Clearance Center, Inc. | ||
Gold has been a desirable electrode material for many years due to its many useful properties, including being biocompatible, noble, and highly conductive. However, the growing interest in cell imaging has been a significant motivator for transitioning towards the utilisation of transparent and conductive material electrodes.71–75 In recent years, there has been an increasing interest among researchers in the field regarding the utilisation of ITO. However, ITO exhibits lower conductivity compared to gold and will fail to provide the same level of sensitivity as gold, though it is feasible to tailor ITO to meet particular requirements for enhancing electrical cell sensing sensitivity.
The enhancement of the electrical properties of ITO can be achieved through the use of surface treatment. According to literature,76 the use of interdigitated ITO electrodes coated with IrOx can result in a reduction of interfacial impedance in comparison to the use of pure ITO. This is perhaps the only study so far that shows how to achieve a higher sensitivity with ITO to detect electrical behaviour of cells; in this case breast cancer cells (MCF-7).
4. Modelling and calculation
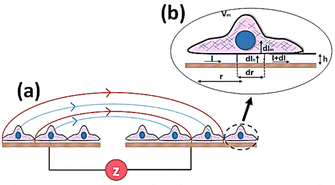
The principle of electrochemical impedance cell–substrate sensing relies on applying a relatively low AC potential between a sensing and counter electrode.77,78 This low voltage is non-invasive and has been extensively shown in scientific literature to be far below the level at which it might impact cellular processes or induce electrostimulation. It should be noted that in impedance analysis, any voltage that can generate a constant current of 1 μA is typically considered acceptable and safe for cell research. Fig. 7a demonstrates that the current path is extremely sensitive to the applied frequency.79 Giaever and Keese proposed the following differential equation by assuming cells to be circular cross section with a diameter of rc and current to be a constant value in the Z direction (vertical) that flows between cell–substrate interface (Fig. 7b), as well as some simple assumptions about potential:40,79 | (10) |
 | (11) |
 | (12) |
 | (13) |
 , the modified Bessel functions are expressed to expand the complex variable as follows:
 | (14) |
| Zm = −i/(2πf)(Cm/2) | (15) |
5. Application within the framework of the commercially available devices
5.1 Chemical stimulation of receptors
Complex signalling networks are employed by cells to determine and respond to their surrounding environmental changes.82 The processing of biological signals involves the identification of chemical stimuli through receptors on the cellular membrane.82 Upon activation, the receptor facilitates signal transduction to various cellular components by regulating specific proteins. It is important to consider that a single receptor has the potential to trigger numerous signalling pathways.83 Furthermore, the cell line and agonist play a role in how receptors regulate a signalling pathway.84 This highlights the challenge of fully comprehending the mechanisms underlying receptor activation in living organisms. Assays that rely on labelling as a means of detecting receptor activation are typically limited by their ability, as they solely monitor a single signalling pathway at any given time.85 Hence, the assessment of an unfamiliar ligand's binding to a receptor through conventional assays may necessitate a considerable degree of experimentation.86G protein activation has been widely recognised as a mechanism that can trigger diverse signalling pathways, leading to alterations in cellular polarity and cytoskeletal reorganisation.87,88 The latter produces alterations in the morphology of cell that could be identified through the use of a cellular impedance biosensor, suggesting the stimulation of either endogenous or exogenous G protein-coupled receptors (GPCRs).89–92 Electrical impedance assessments allow for continuous monitoring of multiple receptor activities on a single platform, such as those of tyrosine kinase receptors (TKRs), nuclear receptors and G protein-coupled receptors (GPCRs).89,90,93,94
The illustration depicted in Fig. 8a demonstrates the mechanism of signal transduction via Gq, Gi, and Gs signalling pathways in G protein-coupled receptors (GPCRs). Fig. 8b, c, and d depict the impedance profiles pertaining to the Gi, Gq, and Gs signalling pathways, respectively.95,96 Based on the evidence, we may conclude that activating Gi-coupled receptors raises cellular impedance, whereas activating Gq receptors results in a similar rise in impedance after a brief drop, and activating Gs receptors reduces cellular impedance. The capacity to identify and discriminate diverse signalling pathways within a single assay represents a significant advancement. In the past few years, the application of cellular impedance biosensor has become prevalent in tackling issues related to receptor pharmacology and the development of new therapeutic ligands.97–103
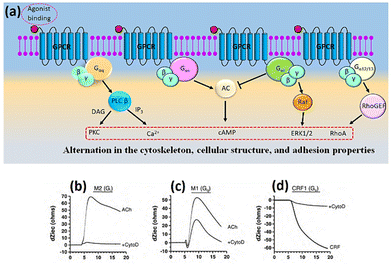 | ||
| Fig. 8 (a) Schematic representation of the main GPCR signalling pathway activated by the four heterotrimeric G proteins. (b–d) Different specific profiles measured by cellular impedance biosensor corresponded to Gi, Gq and Gs pathway. The displayed content in figure (b–d) reproduced with permission from ref. 84. Copyright 2010 Elsevier; permission obtained through Copyright Clearance Center, Inc. | ||
The combined use of electrical impedance and pharmacological inhibitors may shed light on cellular processes, from receptors to signalling molecules. By way of illustration, Meshki et al.104 used the electrical cellular biosensor to show that pre-treatment of HEK293 cells with the ROCK inhibitor (Y27632) eliminated the blebbing and morphological changes associated with neurokinin 1 receptor (NK1R) activation, leading to their interpretation shown in Fig. 9. These results were in contrast to earlier studies indicating that the activation of NK1R may result in the activation of the Gq pathway via mechanisms including increased intracellular calcium and PKC stimulation. This unexpected result established for the first time that the NK1R is activated through the Rho/ROCK/MLCK pathway. In another study, Davis et al.105 highlighted the simplicity and speed of impedance cellular assay to study a novel ROCK inhibitory effect.
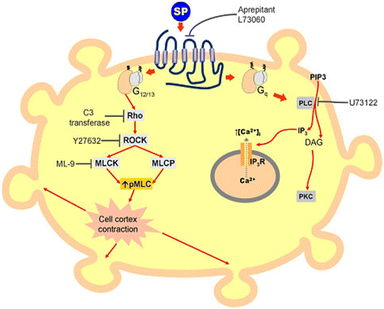 | ||
| Fig. 9 A schematic representation of signalling cascade corresponded to the activation of the NK1R receptor. This model shows that stimulation of NK1R receptor results in membrane blebbing. U73122 as a potent inhibitor of phospholipase C (PLC) blocked the Gq pathway and releasing intracellular calcium. Nevertheless, membrane blebbing occurred indicating the activation of MLCK/ROCK/Rho through G12/13 signalling pathway. The displayed content reproduced from ref. 104. Copyright 2009 Elsevier. | ||
Each kind of cell in an organism has its own unique set of signalling pathways to interact with other cells; these pathways are regulated by membrane receptors. A hallmark of GPCRs, and a key obstacle for the development of drugs, is the event of a single receptor activation triggering multiple signalling pathways. Stallaert et al.86 documented the existence of several signalling pathways in the impedance profile that are linked to the triggering of the 2-adrenergic receptor through isoproterenol (ISO). The deconvolution of impedance alterations enabled the identification of both Gi and Gs cascades, activation of ERK ½ and cAMP, and an elevation in intracellular calcium concentration.
According to the literature,84 the existence of multiple events generating opposing electrical signals may lead to a lack of alteration in impedance and, consequently, a potential misinterpretation of the data. An example is the activation of the CRF1 receptor, where both Gi and Gs signalling contribute equally but yield no detectable electrical signal as a result.95
A specific function of cell membrane receptors is the absorption of photons and the subsequent initiation of photosensory signalling within the cell. The activation of photoreceptors has been associated with mechanical stresses generated on the lipid bilayer of the cellular membrane.106 The possible benefits of using a cellular impedance biosensor include the detection of photosensory information. Fischer et al.,107 conducted a study wherein Neuro-2A and HEK293 cells were transfected with TMT-Opsins, and the resulting impedance were monitored upon illumination. The results indicate that over time, cellular index values rose, up to a duration of 4 minutes. Additionally, following the cessation of illumination, the impedance value returned to the baseline level after a brief period. The investigation also examined the differences in the kinetic responses of different types of photoreceptors.
In addition to the potential advantages associated with impedance for direct binding detection of membrane receptors to a wide variety of chemical and physical environmental factors, cellular impedance measurements may help in the understanding of transmembrane transporters. Transporters have a crucial function in both human health and disease,108 as they are in charge of keeping the pH level stable, maintaining osmotic balance, and participating in signal processing. In a recent investigation conducted by Vlachodimou et al.,109 whether or not solute carriers (SLCs) might activate G protein-coupled receptors (GPCRs) was investigated. The study revealed that the inhibition of adenosine transporters resulted in an elevation of extracellular adenosine concentration (as illustrated in Fig. 10), which subsequently caused alterations in adenosine receptor signalling. The activation of ligand gate channels, specifically transient receptor potential ankyrin 1 (TRPA1), has been associated with rapid intracellular calcium elevation that can persist for a duration of up to 25 minutes. The impedance profile of HEK293 cells expressing TRPA1 in response to a specific agonist exhibited a transient reduction in impedance values, followed by a subsequent return to the initial baseline level.94 An association has been established between alterations in impedance and a rise in intracellular calcium levels.
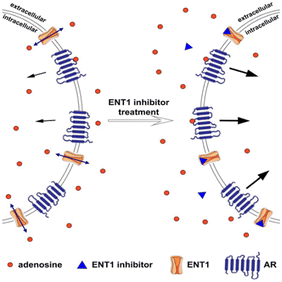 | ||
| Fig. 10 The equilibrative nucleoside transporter 1 (ENT1) balances the intracellular and extracellular concentration of adenosine. The presence of transporters outside the cell stimulates the adenosine receptor (AR) and downstream signalling cascade. Blocking ENT1 using inhibitor led to the increased extracellular concentration of adenosine and consequently, the rise of adenosine receptor activation. The displayed content reproduced from ref. 109. Copyright 2019 Springer Nature. | ||
5.2 Cell adhesion, immune cell interactions and endothelial barrier function
Comprehending the processes of cellular attachment and detachment could shed light on fundamental principles of the human biological system, biomedical science, drug therapy, tissue engineering, and, most importantly, the early detection of diseases.110–114 For example, the decreased adhesiveness of malignant cells to the extracellular scaffolding has been associated with the metastasis and invasiveness of cancerous tumours.115 Cellular impedance biosensors utilise the dynamic processes of cell adhesion, spreading, and micromotion to evaluate the electrical signal. These processes cause changes in the surrounding ionic environment on impedance microelectrodes. Perhaps this explains why initial studies of cell impedance focused on how cells adhered to and spread across the microelectrode surfaces.Bio-interfaces have a significant impact on the intricate and complex process of adhesion. Wegener et al.78 utilised a cell-based impedance biosensor to examine the effects of various extracellular matrix (ECM) proteins on MDCK cell attachment and spreading. The parameters derived from the analysis of impedance in relation to surface coverage indicate that the rate of cell spreading is significantly influenced by surface modification. The differential rates of cellular spreading can potentially be explained by distinct mechanisms of interaction between the cells and bio-interfaces. The study demonstrated that cell adhesion on a surface modified with laminin was a result of the interaction with glycolipids, whereas adhesion on a surface modified with fibronectin was attributed to the interaction with integrin receptors.
The implementation of cell-based impedance biosensors shows promise to differentiate between the specific and nonspecific adhesion of cells to bio-interfaces, as depicted in Fig. 11. The study conducted by Atienza et al.116 showed that NIH3T3 cells exhibited non-specific adhesion to a surface modified with poly-L-lysine, while they exhibited specific adhesion to a surface modified with fibronectin. The study utilised an antibody targeting integrin to determine that adhesion events were mediated by integrin receptors present on the cell membrane. Additionally, the research revealed that non-specific adhesion was facilitated by charge–charge interactions.
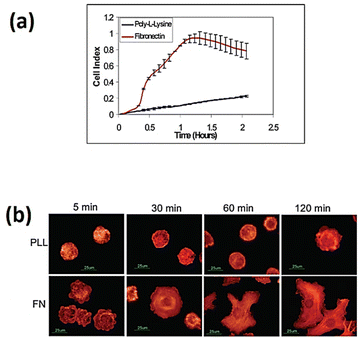 | ||
| Fig. 11 (a) Real-time impedance assessment of NIH3T3 cell adhesion and spreading was conducted using microelectrodes modified with poly-L-lysine and fibronectin. (b) Fluorescence images of NIH3T3 cells on glass slides modified with poly-L-lysine and fibronectin. The cells were subjected to staining using rhodamine-phalloidin. The displayed content reproduced from ref. 116. Copyright 2005 Elsevier; permission obtained through Copyright Clearance Center, Inc. | ||
Cellular and extracellular matrix (ECM) interactions are intricate. The diverse spatial configurations of bio-interfaces may impact cellular adhesion and associated intracellular signal transduction. Chockalingam et al.117 demonstrated the influence of interfacial architecture on the morphology of cells. A monolayer coating of organo phosphonate was utilised as a base layer, followed by the sequential construction of bio-interfaces through a stepwise fabrication process. Subsequently, the ratio of molecules that were attached to the self-assembled monolayers (SAMs) was regulated prior to the introduction of GRGDC, a cell-adhesive ligand, as the third step in the process of cell–molecule coupling. The study revealed that the time taken by cells to spread on a precisely defined surface is exquisitely sensitive to the adhesive ligand density on the surface. The impact of surface chemistry on signal processing within cells was revealed in a more recent study conducted by the same group.75 The utilisation of a cellular impedance biosensor and fluorescence microscopy in a single device demonstrated that the modification of RGD spacing on the surface has an impact on cytoskeletal reorganisation and intracellular calcium release in HeLa cells upon drug administration.
The concept that the extracellular matrix (ECM) is comprised of an intricate web of multiple proteins has been widely acknowledged.118 Hence, it can be inferred that different binding sites are involved in cellular adhesion to the extracellular matrix. The study performed by Luong and colleagues119 investigated the role of α2β1 integrin, a cellular receptor responsible for the binding of collagen and laminin. In this study, human rhabdomyosarcoma cells were employed to express two variants of the α2β1 integrin receptor: the native receptor (RDX2C2) and a mutant receptor lacking the α2 domain (RDX2CO). Subsequently, an assessment was conducted utilising an impedance biosensor to determine the level of adhesion on micro-electrodes coated with collagen, laminin, and fibronectin. The study demonstrated that cells that expressed the α2β1 integrin receptor (RDX2C2) exhibited a significant increase in adhesion to surfaces that were modified with collagen and laminin. In contrast, the cells that expressed a mutant α2β1 integrin receptor (RDX2CO) demonstrated only a slight rise in their adherence to these particular surfaces. Furthermore, it was observed that cells that expressed the α2β1 integrin receptor (RDX2C2) exhibited a slight elevation in their surface adhesion ability to the modified surface with fibronectin. Conversely, cells that expressed the mutant α2β1 integrin receptor (RDX2CO) did not demonstrate any adhesion to the fibronectin-modified surface.
The utilisation of cellular impedance biosensors has the potential to elucidate a more comprehensive understanding of cellular behaviour beyond the mere examination of cellular–ECM interactions. Sawhney et al.,120 investigated the motility and locomotion of HCT116 cells on surfaces modified with bovine serum albumin (BSA) and collagen type IV. A notable characteristic of the resistance profile over time for cells on a surface modified with collagen type IV was the significant fluctuation of resistance, which suggests the occurrence of micro-movements of cells on the electrode. In contrast, electrodes that had undergone surface modification with BSA did not exhibit any fluctuations, suggesting the absence of micro-movement. The absence of cell attachment was suggested by the apparent lack of motility on the BSA modified electrode, as it is commonly believed that cell motility and attachment to the surface are biologically linked.
The human immune system is a complex network that defends the body from disease by deploying specialised immune cells or proteins to the site of infection. As an example, the process of leukocyte circulation on endothelial cells has the potential to trigger the activation of leukocyte integrins, subsequently leading to their adherence to the endothelial cells. This facilitates the stimulation of actin cytoskeleton reorganisation in endothelial cells, which promotes the transmigration of leukocytes into the tissue.121 Cellular impedance biosensors are extremely sensitive at detecting alterations in intercellular junctions and cell–matrix adhesions, making them a suitable tool for monitoring the function and dysfunction of endothelial barriers. The cellular endothelial barrier function is a crucial component in facilitating adaptive immune responses through the process of mobilising immune cells to an injured area.
According to Wegener et al.122 research, the cAMP-dependent cellular signalling pathway regulates the defensive functions of choroid plexus epithelial cells, as demonstrated by impedance data. The data analysis revealed that choroid plexus epithelial cells showed an increased impedance when cAMP was boosted, which suggests a decline in the permeability of the epithelial barrier function. Similarly, Qiao et al.,123 conducted a study to explore the protective mechanism against endothelial barrier dysfunction. The study investigated the protective function of human microvascular endothelial cells (HMEC) and pre-treated HMEC (with cAMP-elevating drugs) to thrombin using a cellular impedance biosensor. The impedance findings indicate that the reduction in resistance linked to the barrier dysfunction was partially alleviated following the administration of cAMP-elevating medications to HMEC. Given that RhoA is involved in the modulation of HMEC barrier breakdown, it was assumed that the activation of RhoA could be suppressed by the signalling cascade involving cAMP-dependent protein kinase (PKA). Therefore, it is hypothesised that the PKA signalling pathway serves as a mechanism to mitigate dysfunction of the vascular endothelial barrier in reaction to diverse inflammatory mediators.
A further assessment of electrical resistance in human bronchial epithelial cells (HBEpCs) has revealed the molecular mechanisms and crosstalk between two different signalling pathways, as depicted in Fig. 12. He et al.,124 investigated the contribution of the crosstalk between lysophosphatidic acid receptor (LPA-Rs) and toll-like receptor (TLRs) to the defensive function of lung cells. The paper suggests activation of the LPA receptor resulted in an increase in transepithelial resistance, thereby indicating an improvement in barrier function. Applying impedance analysis provided evidence that the mechanism of action was through E-cadherin clustering at cell–cell interface. In contrast, the signalling pathway regarding TLRs induced epithelial barrier disruption. The translocation of E-cadherin from the plasma membrane to the cytoplasm, which was caused by the activation of TLRs, was found to be reversed by the activation of LPA, as depicted in Fig. 12.
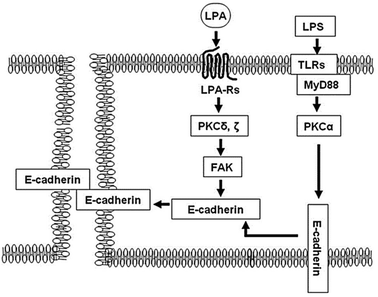 | ||
| Fig. 12 A schematic illustration of the mechanism that protects the epithelial barrier disruption induced by lipopolysaccharide (LPS) ligand. The LPS activates toll-like receptor 4 (TLRs) regulating mislocalisation of E-cadherin from cell membrane to cytoplasm. In contrast, the post-treatment of lysophosphatidic acid (LPA) receptor activates focal adhesion kinase (FAK), downstream of protein kinase C (PKC) δ and γ, that accumulate E (epithelial)-cadherin from the cytoplasm to cell–cell junction and recover the barrier disruption induced by LPS. The displayed content reproduced from ref. 124. Copyright 2009 Elsevier. | ||
The intricate arrangement of endothelial cells, which includes the blood–brain barrier (BBB), are in close proximity to one another and form tight junctions between cells in all blood vessels in the brain. The BBB operates as a selective barricade that limits the transit of potentially harmful substances from the bloodstream to the central nervous system, thereby safeguarding the brain. To date, the most reliable approach for analysing the permeability of the blood–brain barrier (BBB) involves the quantification of transepithelial electrical resistance (TER), which quantifies the restriction of the current flow through a monolayer of cells.125 A remarkable characteristic of the blood–brain barrier is its exceptional capability to resist electrical signals, which is attributed to the presence of tight junctions within the cellular monolayer.126 The impact of cocaine on HIV-1 invasion through the blood–brain barrier was explored by Fiala et al.,127 through the utilisation of cellular electrical impedance. It was shown that the impact of cocaine on brain microvascular endothelial cells (BMECs) was to cause a disruption of intracellular tight junctions and as a consequence invasion by HIV-1 was elevated.
Kataoka et al.,128 conducted a study to examine the interaction between arterial endothelial cells and monocytes using a cellular impedance biosensor and atomic force microscopy. It was found that the electrical resistance of HUVEC (endothelial cells found in human umbilical veins) exhibited an instant drop upon being exposed to THP-1, a human monocytic cell line. This behaviour linked to the reduced adhesiveness and increased deformability of endothelial cells. In a similar study, Ge et al.129 demonstrated the influence of lipopolysaccharide (LPS) on the adhesion of leukocytes (U937) to the cells derived from HUVECs. They showed that the pre-treatment of HUVECs with LPS caused a decline in adhesion between endothelial cells and substrate that was dependent upon the LPS dosage. Cellular communication may occur through the secretion of substances that bind to the receptor of a specific cell upon activation. Treeratanapiboon et al.130 conducted a study wherein they triggered human peripheral blood mononuclear cells (PBMC) using membrane-associated malarin antigen. This research investigated the effects of activated blood cells on the barrier function of porcine brain capillary endothelial cells (PBCEC) using a cellular impedance biosensor. The release of tumour necrosis factor-alpha from infected blood cells caused increased permeability of the blood–brain barrier due to damaged tight junctions.
Mast cells are a type of primary immune cell that exhibit rapid responsiveness to allergic stimuli by triggering their high-affinity immunoglobulin E (IgE) receptor, commonly referred to as FcεRI.131 The immune system generates immunoglobulin E (IgE) as the predominant antibody to safeguard the body against allergic reactions. The study conducted by Abassi et al.132 involved a comparison of the IgE-mediated signal in RBL-2H3 mast cells using a cellular impedance biosensor and β-hexosaminidase assay. They identified a correlation between the electrical signal obtained from impedance and the morphological dynamics, as well as the mediator released obtained from the β-hexosaminidase assay.
5.3 Cancer research investigation
Biosensors that use impedance measurements can differentiate between various human and animal cancer cells by analysing their bioelectrical characteristics, such as impedance and capacitance.133–136 This provides an immediate and simple means to gather information about cancer cell line characteristics and the efficacy of anti-cancer drugs.137 Impedance data for the normal NIH3T3 mouse fibroblast cell line and two transformed cell lines are shown in Fig. 13.138 The transformed cell lines were expressed with either a wild-type chemokine receptor (WT-CXCR2) or a receptor with a mutation that makes it always active (D143V_CXCR2). The GPCR family includes CXCR2, which typically stimulates cellular migration. When this receptor is mutated at position 143, internal signals are constantly triggered, causing normal cells to transform into malignant ones. Fig. 13 demonstrates that the resistances corresponding to WT-CXCR2 and D143V_CXCR2 increased at the same rate, suggesting cell proliferation. The WT-CXCR2 exhibited a plateau phase subsequent to 3000 minutes (50 hours), whereas the D143V_CXCR2 continued to grow throughout the entire duration of the experiment, spanning 5000 minutes, without any indication of deceleration. Due to the collapse of contact inhibition between the cells, there was unregulated cellular replication on top of one another, which led to the development of tumours and a constantly rising impedance profile.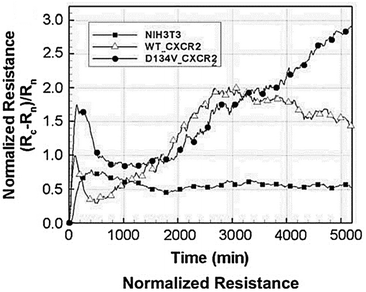 | ||
| Fig. 13 Impedance analysis as a method to examine the transition from normal to malignant cells. The normalized resistance of the electrode, with Rn and Rc representing the bare and cell-covered electrode resistances. Growth curves for untreated control cells (NIH3T3 mouse fibroblasts) and cells transfected with either native (WT) or permanently activated (D143V) chemokine receptors (CXCR2) are shown. The expression of the chemokine receptor in its native form (WT-CXCR2) resulted in a gradual rise in resistance within 3000 seconds, followed by a stabilisation at a plateau level. While, the resistance kept going up because of the transformed chemokine receptor (D143V_CXCR2). The displayed content has been replicated from ref. 138 with the authorisation of the publisher. | ||
The continuous monitoring of cellular adhesion and movement is critical in understanding cellular processes such as cellular mitosis, tumour spreading, and cell locomotion in cell biology.139 Cellular motility is a characteristic associated with the metastatic potential of malignant cells. Using the impedance technique, the motility of cells that are attached to a surface can be identified and tracked.40,140 Numerous endeavours have been undertaken to establish a correlation between the adhesion of tumour cells and the formation of metastases.141 This phenomenon can be exemplified in human epithelial cells, where the cytoskeletal protein EPLIN (epithelial protein lost in neoplasm) is found. EPLIN is an epithelial protein that is not present in tumours and is believed to have a pivotal function in the metastasis of cancer to other organs.142 While several theories have been proposed to elucidate the potential involvement of this protein in cellular migration through alterations in cell morphology and adhesion, its precise function is not fully understood. Jiang et al.143 utilised impedance as a tool to investigate how triple-negative breast cancer cells were impacted by EPLIN. The results indicated a reduction in cell growth, implying that the molecule may act as a tumour suppressor.
Providing information during therapeutic treatment enables impedance biosensor to provide us with valuable data regarding the cell apoptosis, and cancerous cell resistance in response to chemotherapy. Fig. 14 shows the growth behaviour of HT-29 colon cancer cells on impedance gold-microelectrode in response to aspirin. Treating the cell with different concentration of aspirin led to inhibition of cell proliferation. The microscopy also confirmed the apoptosis of cancer cells on the surface of microelectrode.144
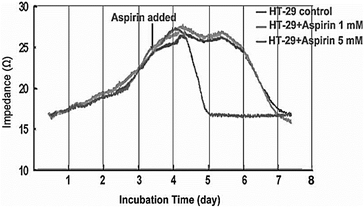 | ||
| Fig. 14 Impedance measurements to study the effect of Aspirin on HT-29 cells. The figure reprinted from ref. 144 by permission of Taylor & Francis Ltd; permission obtained through Copyright Clearance Center, Inc. | ||
Öz et al.145 employed cell-based impedance biosensors to analyse changes in the bioelectrical characteristics of NT2 cells after they were treated with nucleoside analogues such as 1β-arabinofuranosylcytosine and 29-deoxy-5-azacytidine. Unlike other approaches, such as phase contrast microscopy or gene expression profiling using PCR, they were successful in identifying early differentiation stages during the first day of therapy through recording alterations to impedance profiles. This implies that impedance sensing of the cells exhibits high sensitivity and resilience as a means of evaluating the impact of differentiation-inducing drugs on cellular systems. Consequently, they offer significant contributions to the understanding of drug mechanisms and cellular differentiation processes. The electrochemical impedance biosensor could be employed to characterize the inhibition properties of some chemicals to anti-cancer drugs. Fig. 15a shows the apoptosis induced by treating squamous cell carcinoma cancer cell line (CAL 27) with different concentration of cisplatin as anticancer drug. The inhibitory effect of nicotine on anti-cancer effect of cisplatin can be seen in Fig. 15b. The results show that any amount of nicotine reduces the effect of cisplatin on cancer cells, with the cisplatin rendered ineffective at a nicotine concentration of 1 μM or higher.146
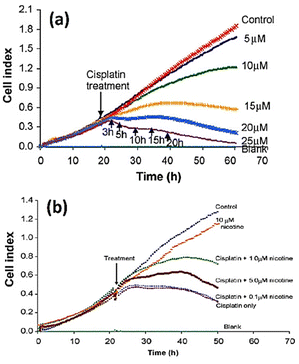 | ||
| Fig. 15 (a) The cell index plots of squamous cell carcinoma cancer cell line (CAL 27) treated with different concentration of cisplatin as anticancer drug. (b) The inhibitory effect of nicotine (different concentration) on the apoptotic effect of 20 μM cisplatin. The displayed content reproduced from ref. 146. Copyright 2010 Elsevier; permission obtained through Copyright Clearance Center, Inc. | ||
5.4 Microbiological investigation
The use of impedance-based cellular biosensors presents a rapid and convenient approach for tracking the kinetic response of biological cells to invading pathogens in the clinical microbiology laboratory.147 The invasion of a pathogen into a host cell may result in alterations to the cellular structure. Cytopathic effects caused by viral infections, for example, are characterised by cellular swelling, clumping, partial disintegration, and, in the most extreme cases, full cellular annihilation.148Fig. 16 depicts how impedance fluctuates over time, with cell attachment and spreading causing an increase in impedance and infections causing a drop in impedance.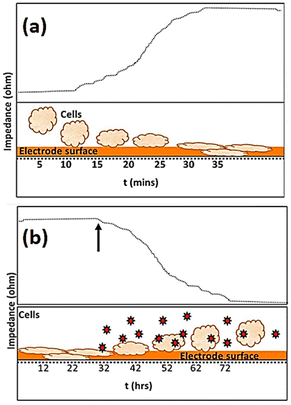 | ||
| Fig. 16 The visual representation shows the variations in impedance recording as time progresses. The impedance data presented in (a) shows that the impedance of the microelectrode, measured in ohms, undergoes a rise due to the attachment and spreading of cells. The exposure of infectious agents, as denoted by the arrow and markers in (b), leads to an apparent drop in impedance (ohm) due to the consequent toxic effect on cells. The displayed content reproduced from ref. 149. Copyright 2020 Elsevier; permission obtained through Copyright Clearance Center, Inc. | ||
In addition to being able to assess the deterioration of cell monolayers in relation to pathogen loading concentration, an added benefit of this approach is its potential to offer real-time insights into the virulence capabilities of various pathogen strains.149 The study conducted by Fang et al.150 employed mathematical modelling to analyse dynamic cellular changes obtained from electrical impedance. The findings suggest that the replication rate of West Nile Virus in Vero cells is approximately three times faster than that of St. Louis encephalitis virus. An additional example of this trend is apparent in the research conducted by Nahid et al.149 wherein they investigated the impact of four primary clinical bacterial strains on the kinetic apoptosis of lung epithelial cells (A549). The electrochemical findings indicate a restricted alteration in resistance upon Pseudomonas aeruginosa infection within a 12-hour timeframe. However, infections with Enterococcus, Staphylococcus aureus, and ESBL Escherichia coli all experienced a significant decline over the course of the first 5 hours, albeit with distinct patterns.
The utilisation of impedance analysis within microbiology laboratories for the assessment of cell/pathogen interaction has expanded beyond the determination of pathogen virulence capacity. McCoy et al.151 conducted a study utilising a cellular impedance biosensor to measure the response of MDCK cells to influenza A virus. A notable finding from the research conducted was that the administration of ammonium chloride, a widely recognised viral inhibitor, resulted in an alteration in the electrical findings, suggesting that the entry of the virus into the cells was impeded. Since then, cellular impedance biosensors have been extensively employed in research endeavours to probe prospective innovative antiviral drugs.152–157 The significance of the electrical cellular biosensor in assessing the effectiveness of neutralising antibodies during the 2009 Influenza A (H1N1) virus pandemic was demonstrated by Tian et al.158 More recently, Charretier et al.159 proposed the use of impedance-based cellular assays as a potential alternative to the conventional TCID50 assay for measuring viral infectious titers in vaccine development.
Cellular impedance biosensors can potentially elucidate the underlying mechanism of viral infections. Viruses employ receptor binding as a mechanism to access the cellular machinery of the host.160 For instance, the expression of the AXL receptor has been widely acknowledged to facilitate the entry of the ZIKV virus into cells.161 In order to enhance comprehension of the mechanisms underlying Zika virus invasion of human cells, Ismail A. A. et al.162 employed cellular impedance biosensor to scrutinise the impact of viral infection on brain microvascular endothelial cells. The study involved the use of mathematical modelling to examine impedance data. The parameters considered in the analysis included the barrier function of cell–cell interaction (Rb), the adhesion value of cell–surface interaction (α), and the possibility for pathogenic agents to affect the membrane capacitance of a cell. According to the ECIS results, the virus expedited the process of vascular leakage in the brain, thereby disrupting the permeability properties of microvascular endothelial cells in the brain.
6. Future prospects for cellular impedance biosensors
There are a number of emerging trends with cellular impedance biosensors that are extending the scope of this powerful, label free, method. Most notable of these is expanding the method to 3D cell cultures and the combination of electrochemical impedance spectroscopy with microscopic methods to created complementary hyphenated techniques. We will discuss these two future trends in more detail.6.1 Three-dimensional (3D) cellular impedance biosensor
Most frequently cells culture is performed on two dimensional, flat surfaces.163 Although cell cultures on flat surfaces have advanced our grasp of cell physiology because they are so easy to prepare in high throughput, these models have some limitations, including an inability to adequately replicate drug penetration into tissues and the complex structure of real tissue.164 The capability of an AC electrical signal to pass across a tissue (without interfering with or harming) makes the impedance method an attractive experimental technique for screening cells in three dimensions (3D).165Fig. 17 shows the underlying concept of cellular impedance in both two- and three-dimensional models of cell culture.165 In a 2D environment, adherent cells are seeded directly on the surface of electrodes. When analysing the morphological behaviour of adherent cells on microelectrodes in a 2D model, it is necessary to account for the flow of electrical signal through the resistance of bulk medium (Rs) and the dielectric barrier of cells (Fig. 17a). By reducing the influence of solution resistance, the electrical signal provides sensitive insights about the intercellular junctions and adherence of cells to the microelectrode. In contrast, in a 3D cell culture surroundings, cells attach to the structural support or to other cells rather than coming into full association with microelectrodes (Fig. 17c). When a 3D cell culture environment is placed between electrodes, the culture media and electrodes are in direct contact with one another. As a result, there is always a route for current flow between electrodes that escapes the cells (shunt current) which affects the sensitivity of measurements. By altering electrode designs, it is feasible to enhance the contact between cells and electrodes and so lower the shunt current.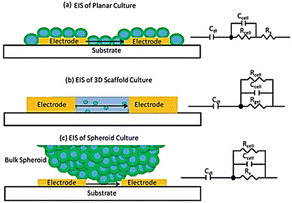 | ||
| Fig. 17 (a) Analysing the two-dimensional cell impedance on a flat surface. (b) Assessing the three-dimensional cell impedance when a scaffold-based environment is placed between electrodes. (c) Using the scaffold-free approach to analyse the impedance of cells in three dimensions. The figure reprinted from ref. 165 with permission from springer; permission obtained through Copyright Clearance Center, Inc. | ||
As an example, Pan et al.166 developed a three-dimensional cell-based impedance biosensor (known as 3D-ECMIS) as an ongoing monitoring platform for analysis of cell proliferation and drug efficacy testing. Two gold sensor plates were arranged vertically in each sensor channel of the 3D impedance biosensor chip, which included 8 individual culture wells on an optical base (Fig. 18). A Matrigel scaffold (Matrigel is an extracellular matrix mimic) was utilized to encapsulate the human hepatoma cells (HepG2) before they were cultured in the biosensor device chamber. The proposed 3D-ECMIS device was employed to conduct electrochemical tests demonstrating the proliferation of HepG2 cells in a Matrigel-coated 3D environment. The advantages of the 3D cell culture model in cancer research was highlighted by comparing the abilities of 3D and 2D cellular impedance biosensors for anti-cancer medication screening (ovarian, taxol, and cisplatin).
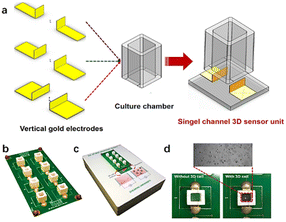 | ||
| Fig. 18 (a) An impedance biosensor design for three dimensions cell culturing. (b) Illustration of a three-dimensional impedance biosensor with eight channels. (c) Images of monitoring system. (d) Photographs taken of the platform both before and after it was seeded with live cells. The displayed content reproduced from ref. 166. Copyright 2019 Elsevier; permission obtained through Copyright Clearance Center, Inc. | ||
There is a growing amount of research that examines the real-time analysis of cells using impedance in a three-dimensional environment,167–178 however this technique is still limited due to significant challenges. Alexander and co-workers165 discussed the limitations in using the impedance approach to analyse 3D in vitro systems. Briefly, there are basically two types of 3D cell culture environments, those that use scaffolds and those that do not. The possibility of toxicity or scaffold degradation, which causes an impedance alteration, is a significant issue when monitoring cellular impedance in scaffold-based frameworks. In addition, the scaffold has the potential to disrupt the effectiveness of medicine throughout pharmacological therapy. Such biochemical interactions inside the system may play a part to the overall signal readout as a dominant factor, hence diminishing the detection threshold. According to Alexander et al.,165 numerous attempts have been made to monitor cell impedance responses in scaffold-based frameworks, but the resulting electrical output has been mostly disappointing up until now due to the poor sensitivity of measurement. The key benefit of the scaffold-free strategy is that the procedure eliminates the harmful processes caused by scaffold material and higher sensitive impedance results have been reported.
6.2 The combination of cellular impedance biosensor with other complementary techniques
In contrast to label-based assays, impedance signals are often dependent on the identification of changes in the extracellular ionic environment, rather than the molecular processes and activities that are taking place inside of the cells.89 Despite the many benefits of multitasking on a single platform, impedance signals, due to their holistic and comprehensive nature, are rarely able to identify particular molecular processes occurring inside the cells.179 Additionally, certain significant intracellular biomolecular processes have an indirect effect, or have no influence at all, on the total impedance reading.96 An example of this kind of concerns is the use of an electrical cell-based biosensor as a readout to describe G protein coupled receptor (GPCR) stimulation. The capability of cellular impedance biosensors to differentiate between the Gi, Gq, and Gs signalling pathways has been the subject of extensive research.89–91,180 Recent findings, however, have shown that the cell line has a significant effect on the electrical response to GPCR activation.179 GPCRs may regulate the actin cytoskeleton through a variety of proteins and second messengers. Therefore, combining label-free impedance cell-based assay as complementary information to other techniques, especially those that generate biologically relevant molecular insights, is a powerful approach to explain the sub-cellular processes incorporated in the impedance profile. In order to unravel the biological processes that produce the impedance signal, our lab has integrated high-resolution fluorescence microscopy with cell-based impedance screening on transparent-conductive ITO75 (Fig. 19). Evidence suggested that the reorganisation of cellular actin was apparently dependent on an increase in intracellular calcium. Additional research in our lab demonstrated, however, that the impedance approach employing ITO microelectrodes was only partially successful at gaining information on tiny changes in cell shape due to limited electrical sensitivity. Our findings181 showed that redesigning gold electrodes and inserting a viewing window into the gold design results in superior electrical sensitivity for cell impedance research when paired with fluorescence microscopy. Therefore, we reported a stepwise construction method in which the gold micropatterns might serve as a substrate for both microscopy and electrochemistry, allowing for a simultaneous dual-sensing readout. The contribution of this biosensor to the field is the direct visualisation of cell structures and processes on the surface as high-resolution images, where microscopy can determine the behaviour of the cells as single entities and electrochemistry provides ensemble data on nanoscale changes of the cells over the entire electrode.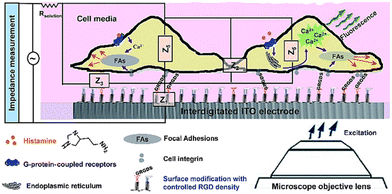 | ||
| Fig. 19 The simultaneous dual sensing platform was developed to gather more detailed data on how cells react to soluble stimuli when self-assembling adhesive ligands are present on interdigitated indium tin oxide (ITO) surfaces. The displayed content reproduced from ref. 75. Copyright 2017 Royal Society of Chemistry. | ||
The hyphenated approach may provide clarity on the impedance data. Take for instance, the transmission of light is dependent on the optical qualities shown by the material it travels through, but the electrical signal is very reliant on intercellular communication and cell adhesion to the surface of the electrode. The association between the area covered by cells and the resistance for a nonconfluent and confluent cell layer on the electrode using simultaneous cellular impedance and phase contrast microscopy analyses was shown by Choi et al.71 Upon examining the two profiles, it becomes apparent that while time-dependent impedance findings in both profiles indicate different stages of cell attachment on the surface, the impedance measurements are not indicative of the surface coverage. Accordingly, cells tightly adhering to a small fraction of the electrode surface lacking intracellular attachment could reveal the same profile as a confluent cell layer with loose attachment to the surface.
Hyphenated cell-based impedance assays have attracted growing attention in recent years as a complement to other relevant cell research methods. Such hybrid techniques have been used in the field, and some examples are impedance-quartz crystal microbalance (QCM),182 impedance-surface plasmon resonance spectroscopy (SPR),183 impedance-light-addressable potentiometric sensor (LAPS)184 and impedance flow cytometry.185 More precise data may be generated with the help of cell-based hybrid biosensors. Impedance and surface plasmon resonance (SPR) cell-based assays are two such approaches that, when used independently, show the advantages and disadvantages of each method for answering certain questions.
The optical SPR readout only identifies changes near to the substrate surface (200 nm). Tight junction which allows cells to communicate with other cells is an example of a morphological change that lies above the evanescent wave of SPR. The electrical impedance readout, however, gives information about the entirety of the cell body, encompassing interactions between cells and between cells and substrates. Therefore, surface plasmon resonance (SPR) integration on an impedance cell-based platform has the potential to enhance comprehension of morphological alternations occurring at the subcellular level. Using the developed dual biosensor, Michaelis et al.183 employed confluent MDCK II cells to investigate the impact of cytochalasin D (CD). To evaluate the cellular response to cytoskeletal rearrangement, 5 μM CD was introduced to MDCK cell monolayer while SPR and impedance experiments were conducted simultaneously. SPR and impedance time courses show that the decrease in impedance exhibits a more rapid rate of change in comparison to the decline in reflectivity (Fig. 20). The SPR readings predominantly disclose the cytoskeleton transformation near the lower cell body, but impedance measurements (at low frequencies) are indeed very sensitive to alternations in the junctions of cell–cell, which is beyond the detection limit of the SPR approach. This study showed the ECIS-SPR dual sensor better characterised how cytoskeleton active medicines affect various subcellular compartments and cellular functions.
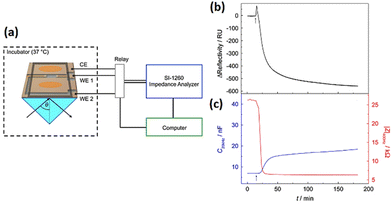 | ||
| Fig. 20 (a) Innovative arrangement for conducting simultaneous SPR and cell-based impedance analysis (b and c) The effect of 5 μM cytochalasin D on a confluent MDCKII cell layer was measured using both SPR and ECIS techniques at the same time. The displayed content reproduced from ref. 183. Copyright 2013 Elsevier; permission obtained through Copyright Clearance Center, Inc. | ||
Because microfluidic devices are increasingly being utilised in cell studies, the combination of microfluidics with impedance-based measurements of cells is becoming increasingly popular.185–189 Impedance implementation in microfluidic systems may be useful from a number of perspectives. Integrating impedance microelectrodes into microfluidic devices enables detailed analysis of single cells rather than cell populations opening the door to more fundamental biological research.189 Additionally, impedance flow cytometry does not need adherent cells. The fact that a majority of cell lines exhibit a lack of adherence to gold or glass electrodes presents a technical hurdle in classical cell–substrate impedance measurement. Controlling cell adhesion prior to doing the experiment using a traditional impedance technique is therefore crucial, and the fabrication of bio-interfaces or an artificial extracellular matrix may be necessary. These bio-interface materials, however, could not precisely resemble the extracellular matrix, which might change the shape and adhesion characteristics of cells.58
Ayliffe and colleagues190 were the pioneers in developing a microfluidic system that incorporated microelectrodes for the purpose of detecting cellular bioelectrical activity at the single level. Single cell electrical characteristics may serve as biological biomarkers to categorise different type of cells including blood cells, tumour and stem cells.191 Microfluidic impedance cytometry outcome is based on the biophysical aspects of cells like their size, shape and the dielectric properties of their membranes. Numerous studies have shown the capacity of impedance cytometry systems to distinguish cancer cells utilising various designs.192–197 One example is a microfluidic impedimetric device designed to identify leukaemia cells. It was demonstrated that normal red blood cells (RBCs) and cancerous ones could be effectively differentiated.198 The signal to noise ratio (SNR) was examined by altering the excitation voltage and ionic concentration in solution. The channel geometry was also optimised to enhance the sensitivity of the output signal. Human red blood cells (RBCs) and leukaemia cells (LCs) were separately suspended in a 2.5 S m−1 conducting buffer solution. By pumping suspensions to the channel at a pressure difference of 30 mbar and a release rate of five microliters per hour, a flow of 2000 cells per min was attained. When a voltage of 3 V was applied to the electrode and a 1.5 MHz electric pulse was generated, both cell types produced distinct signal waveforms with a focus on the single events (Fig. 21).
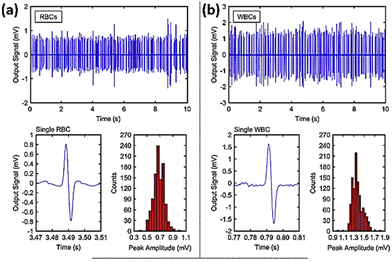 | ||
| Fig. 21 Histogram plots and peak amplitude for (a) red blood cells and (b) white blood cells based on the impedance flow cytometry signals for single particle events. The displayed content reproduced from ref. 198. Copyright 2020 Elsevier; permission obtained through Copyright Clearance Center, Inc. | ||
A single cell may be precisely contained at a specific location of microfluidic structural using innovative designs, opening novel possibilities for combinations with impedance microelectrodes. According to the published literature, there are two categories of impedance biosensors that use microfluidic technology.199 Microfluidic impedance cytometry may be used to analyse either dynamic or static cells (that have been trapped in a microcavity structure). As an example of a stationary cell examined through a spectrum of impedance utilising a microfluidic device, Cho et al.,200 combined flow channel for cells with cell trapping sites and opposing microelectrode arrays for impedance measurement. By exerting suction via the microchannel designed specifically for cell trapping, a single cell was pulled into the microfluidic cell capture site as it moved down the cell flow channel. Upon capturing an individual cell within the designated electrical analysis spot, the syringe pump was promptly turned off. Following this, impedance analysis was performed on the captured cells using a voltage of 500 mV, spanning a frequency spectrum of 40 Hz to 10 MHz. The study acquired impedance spectrum data from two different head and neck carcinoma (HNC) cell lines, characterised by varying degrees of metastatic potential, with one exhibiting limited metastatic potential and the other demonstrating strong metastatic potential. The findings of the impedance recording showed that the phase component of impedance may be utilised to discriminate between the metastatic condition of HNC cells at the level of single-cell.
In another study, Nguyen et al.201 developed an impedance-integrated microfluidic system utilising the Boyden chamber concept, which is comprised of three primary components: a microfluidic channel, cell capture spots, and an impedance microelectrode. The device enabled to rapidly and selectively identify migratory characteristics of single cancer cells. More recently, a microfluidic device was developed202 allowing simultaneous investigation of static and dynamic cells by combining electric impedance flow cytometry and EIS on the same platform (Fig. 22). The tool has been shown to be effective at both letting dynamic cells through for impedance flow cytometry assessments and capturing them for EIS readings. The entire impedance spectrum may be recorded by EIS, which provides a broad range of data about the unique properties of the cells. HepG2, HeLa and A549 cancer cell populations were separately assessed using the microfluidic device. Impedance flow cytometry readout revealed that the magnitude degree of impedance was very different between malignant cells. While the whole impedance spectrum of a single cell, which was recorded by EIS, was employed to obtain specific biophysical information about each cell type, including the dimension of the cells, specific cellular capacitance, and intracellular resistivity. This work showed that integrating EIS to impedance flow cytometry presents a novel method to expand knowledge regarding electrical characteristics of single cells.
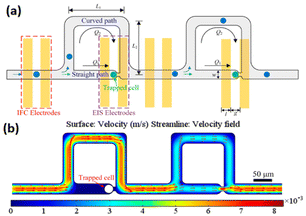 | ||
| Fig. 22 (a) The schematic representation of the microstructure combining electrical impedance spectroscopy and impedance flow cytometry shows the cell flowing or trapping. (b) The variability of flow velocity within the channels from an overhead perspective. Reproduced from ref. 202. Copyright 2019 American Chemical Society; permission obtained through Copyright Clearance Center, Inc. | ||
More than 50 years of research have focused on the correlation of cell deformability and chronic illnesses.203 Consequently, the deformability of cells may serve as a fundamental biomarker for diagnosing diseases.203 The biomechanical characteristics of a cell can be measured by deforming the cell. One effective way to induce mechanical stimuli is using constriction channels, which are only slightly smaller in diameter than the measured cell sizes.204 When cells are pushed into a constriction channel, they are compressed by the narrow walls. A number of characteristics related to cell deformability may be measured, including the time of transit and cell stiffness. A microfluidic device that integrates impedance analysis with a constriction channel was developed by Adamo and colleagues204 (Fig. 23). It was shown that larger cells had significantly slower travel times than smaller ones. To verify that cell stiffness affects transmit time, actin-disrupting agents (latrunculin A and cytochalasin B) were introduced to HeLa cells. The untreated cells (the population that was stiffer) took longer to pass through the constriction channel (narrowing in the form of a funnel) indicating that the medicine affected the actin filament. The core of this label-free integrated platform for data generation is the combination of mechanical and electrical attributes of the cells simultaneously. Peak widths exhibit travel time, which is impacted by mechanical properties of the cell, while impedance spikes reflect cellular electrical characteristics. Cell size affects these two biomarkers in different ways. Ghassemi et al.205 were the first researchers to employ this specific integrated approach as alternative strategy to instantaneously count circulating tumor cells in blood samples within a minute, overcoming the necessity for fluorescent tagging. The key concern with circulating tumor cells examination technologies is that there are only a few circulating tumor cells per millilitre of blood, while there are billions of other blood cells all around them. Normal blood cells often have a smaller size than circulating tumour cells, which results in distinct impedance profiles when cancer cells undergo transit related deformation while normal blood cells maintain their original shape.
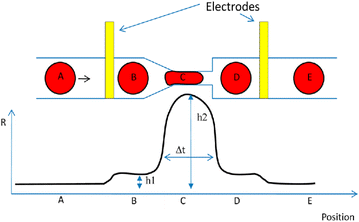 | ||
| Fig. 23 A microfluidics to examine the deformability of cells together with an associated impedance analysis. Reproduced from ref. 204. Copyright 2012 American Chemical Society; permission obtained through Copyright Clearance Center, Inc. | ||
7. Conclusion
Electrochemical impedance for monitoring cells has quickly gained popularity as a relevant screening process across different biological disciplines due to its flexibility and simplicity of use. The literature suggests that the traditional impedance approach has promising analytical applications for analysing adherent cells. In contrast to label-based assays, this non-invasive approach eliminates the necessity of labelling and offers superior temporal resolution, enabling real-time surveillance of native cell populations over timeframes of seconds to days.While traditional impedance cell-based assays offer advantages in terms of multitasking on a single platform, they face challenges when unravelling fundamental biological questions. Some of these challenges are common to all cell-based biosensors, such as the fact that real samples have a diverse cell population. Other challenges, not limited to singular biochemical events, are specific to the nature of the impedance signal. Although there are some gaps and limitations of established commercial impedance assays including ECIS, xCELLigence and Cell Key,58,71,75,96,183,205 impedance cell-based assays are likely to become more widespread over the coming years due to their ability to monitor native cell populations in real time.
To enhance measurement and help in the interpretation of complicated cellular processes during cell monitoring, a multifaceted strategy is used that integrates different approaches with impedance analysis. Hyphenated strategies, such as impedance-SPR, have been shown to be beneficial for identifying specific alterations in cell morphology at the subcellular level. Additionally, combining high-resolution fluorescence microscopy with cell-based impedance screening can provide invaluable insights into complex biological processes that influence cell dynamics.
Furthermore, to overcome challenges caused on by the convoluted nature of impedance signals, future endeavours may concentrate on improving the adaptability of technique to a particular biological process. Finding novel strategies to enhance the sensitivity and specificity of cellular impedance analysis will allow for more informative data.
Another future direction for development is investigating cell impedance measurement in three-dimensional (3D) cellular settings. Drug assessment and advancement might be improved by constructing 3D cellular impedance biosensors, notwithstanding the challenging nature of this endeavour.
Examining single cells owing to the diverse nature of actual cell samples, eliminating the adherent cells requirement and minimizing the duration for preparation and testing are all crucial steps towards improving the therapeutic relevance of impedance technique. Impedance-based microfluidic devices have the potential for clinical applications by simplifying the procedure and providing instantaneous screening of individual cells under minutes.
In conclusion, there is a great deal of room for growth and improvement in the area of impedance analysis of cells, which is itself quickly expanding. To further improve this approach and open up new avenues for understanding cell behaviour in a wide range of biological contexts, researchers can focus on areas such as integrating it with other complementary approaches, enhancing its specificity, examining 3D settings, and optimising its integration with microfluidics. With persistent efforts and creative ideas, impedance monitoring of cells is prepared to significantly advance biological study and health care applications.
Author contributions
Seyedyousef Arman: conceptualization, writing – original draft, writing – review & editing. J. Justin Gooding and Richard D. Tilley: supervision, conceptualization, funding acquisition, writing – original draft, writing – review & editing.Conflicts of interest
There are no conflicts to declare.Acknowledgements
The authors acknowledge the generous financial support from the National Health and Medical Research Council Project grant (GNT11662385) and an NHMRC Investigator grant (GNT1196648). S. A. also acknowledges the Australian Federal Government for funding under the Research Training Program.References
- R. Macarron, M. N. Banks, D. Bojanic, D. J. Burns, D. A. Cirovic, T. Garyantes, D. V. Green, R. P. Hertzberg, W. P. Janzen and J. W. Paslay, Nat. Rev. Drug Discovery, 2011, 10, 188–195 CrossRef PubMed.
- G. S. Sittampalam, S. D. Kahl and W. P. Janzen, Curr. Opin. Chem. Biol., 1997, 1, 384–391 CrossRef PubMed.
- F. Fan and K. V. Wood, Assay Drug Dev. Technol., 2007, 5, 127–136 CrossRef PubMed.
- D. J. Powell, R. P. Hertzberg and R. Macarrón, High Throughput Screening, Springer, 2016, pp. 1–32 Search PubMed.
- J. Zhang, R. E. Campbell, A. Y. Ting and R. Y. Tsien, Nat. Rev. Mol. Cell Biol., 2002, 3, 906–918 CrossRef CAS PubMed.
- G. Milligan, Drug Discovery Today, 2003, 8, 579–585 CrossRef CAS PubMed.
- K. A. Giuliano and D. L. Taylor, Trends Biotechnol., 1998, 16, 135–140 CrossRef CAS PubMed.
- A. Ibraheem and R. E. Campbell, Curr. Opin. Chem. Biol., 2010, 14, 30–36 CrossRef CAS PubMed.
- Y. Fang, Expert Opin. Drug Discovery, 2011, 6, 1285–1298 CrossRef CAS PubMed.
- R. Halai and M. A. Cooper, Expert Opin. Drug Discovery, 2012, 7, 123–131 CrossRef CAS PubMed.
- M. Rocheville, J. Martin, J. Jerman and E. Kostenis, Prog. Mol. Biol. Transl. Sci., 2013, 115, 123–142 CAS.
- J.-S. Maltais, J.-B. Denault, L. Gendron and M. Grandbois, Apoptosis, 2012, 17, 916–925 CrossRef PubMed.
- I. Kurucz, B. Peter, A. Prosz, I. Szekacs, R. Horvath and A. Erdei, Sens. Actuators, B, 2017, 240, 528–535 CrossRef CAS.
- P. Jin, Z. Ren, F. Ye and W. Ying, Anal. Biochem., 2014, 450, 27–29 CrossRef CAS PubMed.
- T. Söllradl, F. A. Banville, U. Fröhlich, M. Canva, P. G. Charette and M. Grandbois, Biosens. Bioelectron., 2018, 100, 429–436 CrossRef PubMed.
- J. S. Daniels and N. Pourmand, Electroanalysis, 2007, 19, 1239–1257 CrossRef CAS PubMed.
- R. Halai, D. E. Croker, J. Y. Suen, D. P. Fairlie and M. A. Cooper, Biosensors, 2012, 2, 273–290 CrossRef CAS PubMed.
- B. Liedberg, C. Nylander and I. Lundström, Biosens. Bioelectron., 1995, 10, i–ix CrossRef CAS PubMed.
- M. Hide, T. Tsutsui, H. Sato, T. Nishimura, K. Morimoto, S. Yamamoto and K. Yoshizato, Anal. Biochem., 2002, 302, 28–37 CrossRef CAS PubMed.
- V. Chabot, C. M. Cuerrier, E. Escher, V. Aimez, M. Grandbois and P. G. Charette, Biosens. Bioelectron., 2009, 24, 1667–1673 CrossRef CAS PubMed.
- N. Zaytseva, W. Miller, V. Goral, J. Hepburn and Y. Fang, Appl. Phys. Lett., 2011, 98, 163703 CrossRef.
- Y. Fang, A. M. Ferrie, N. H. Fontaine, J. Mauro and J. Balakrishnan, Biophys. J., 2006, 91, 1925–1940 CrossRef CAS PubMed.
- A. M. Ferrie, Q. Wu and Y. Fang, Appl. Phys. Lett., 2010, 97, 223704 CrossRef PubMed.
- Q. Yang, X. Huang, B. Gao, L. Gao, F. Yu and F. Wang, Analyst, 2023, 148, 9–25 RSC.
- B. Markhali, R. Naderi, M. Mahdavian, M. Sayebani and S. Arman, Corros. Sci., 2013, 75, 269–279 CrossRef CAS.
- U. Tröltzsch, O. Kanoun and H.-R. Tränkler, Electrochim. Acta, 2006, 51, 1664–1672 CrossRef.
- N. Wagner, W. Schnurnberger, B. Müller and M. Lang, Electrochim. Acta, 1998, 43, 3785–3793 CrossRef CAS.
- U. Rammelt, N. Hebestreit, A. Fikus and W. Plieth, Electrochim. Acta, 2001, 46, 2363–2371 CrossRef CAS.
- J. Bonifas, S. Scheitza, J. Clemens and B. Blömeke, J. Pharmacol. Exp. Ther., 2010, 334, 318–326 CrossRef CAS.
- A. Lelli, A. Gervais, C. Colin, C. Chéret, C. R. de Almodovar, P. Carmeliet, K. H. Krause, S. Boillée and M. Mallat, Glia, 2013, 61, 1542–1555 CrossRef PubMed.
- B. N. Sharma, M. Marschall, S. Henriksen and C. H. Rinaldo, Antimicrob. Agents Chemother., 2014, 58, 279–289 CrossRef PubMed.
- Q. Sun, X. Zhao, X. Liu, Y. Wang, J. Huang, B. Jiang, Q. Chen and J. Yu, Prostate, 2014, 74, 1613–1621 CrossRef CAS PubMed.
- H. Xie, L. Lee, P. Scicluna, E. Kavak, C. Larsson, R. Sandberg and W. O. Lui, Int. J. Cancer, 2015, 136, E230–E241 CAS.
- M. C. Corotchi, M. A. Popa and M. Simionescu, Rom. J. Morphol. Embryol., 2016, 57, 75–80 Search PubMed.
- M. Dikmen, J. Med. Food, 2017, 20, 376–384 CrossRef CAS PubMed.
- D. D. Bravo, T. Chernov-Rogan, J. Chen and J. Wang, J. Pharmacol. Toxicol. Methods, 2018, 89, 47–53 CrossRef CAS PubMed.
- I. Giaever and C. R. Keese, Proc. Natl. Acad. Sci. U. S. A., 1984, 81, 3761–3764 CrossRef CAS.
- J. H. Luong, M. Habibi-Rezaei, J. Meghrous, C. Xiao, K. B. Male and A. Kamen, Anal. Chem., 2001, 73, 1844–1848 CrossRef CAS PubMed.
- K. Benson, S. Cramer and H.-J. Galla, Fluids Barriers CNS, 2013, 10, 1–11 CrossRef.
- I. Giaever and C. R. Keese, Proc. Natl. Acad. Sci. U. S. A., 1991, 88, 7896–7900 CrossRef PubMed.
- C. M. Dowling, C. Herranz Ors and P. A. Kiely, Biosci. Rep., 2014, 34(4), e00126 CrossRef PubMed.
- K. Le Gal, M. X. Ibrahim, C. Wiel, V. I. Sayin, M. K. Akula, C. Karlsson, M. G. Dalin, L. M. Akyürek, P. Lindahl and J. Nilsson, Sci. Transl. Med., 2015, 7, 308re308 Search PubMed.
- Y. Huang, D. J. Burns, B. E. Rich, I. A. MacNeil, A. Dandapat, S. M. Soltani, S. Myhre, B. F. Sullivan, C. A. Lange and L. T. Furcht, BMC Cancer, 2017, 17, 1–18 CrossRef PubMed.
- C. Tiruppathi, A. B. Malik, P. J. Del Vecchio, C. R. Keese and I. Giaever, Proc. Natl. Acad. Sci. U. S. A., 1992, 89, 7919–7923 CrossRef PubMed.
- A. O. Rinaldi, H. Morita, P. Wawrzyniak, A. Dreher, S. Grant, P. Svedenhag and C. A. Akdis, Allergy, 2019, 74, 1934–1944 CrossRef PubMed.
- J. Wegener and J. Seebach, Cell Tissue Res., 2014, 355, 485–514 CrossRef PubMed.
- F. Ardito, M. R. Pellegrino, D. Perrone, G. Troiano, A. Cocco and L. L. Muzio, OncoTargets Ther., 2017, 10, 5405 CrossRef PubMed.
- M. Tarantola, D. Schneider, E. Sunnick, H. Adam, S. Pierrat, C. Rosman, V. Breus, C. Sonnichsen, T. Basché and J. Wegener, ACS Nano, 2009, 3, 213–222 CrossRef.
- H. Slanina, A. König, H. Claus, M. Frosch and A. Schubert-Unkmeir, J. Microbiol. Methods, 2011, 84, 101–108 CrossRef PubMed.
- A. Gölcü, H. Muslu, D. Kılıçaslan, M. Çeşme, Ö. Eren, F. Ataş and İ. Demirtaş, J. Mol. Struct., 2016, 1119, 96–109 CrossRef.
- P. Electrochemistry, C. Elements, C. Equivalent and C. Models, Appl. Note AC, 2010, 286, R491–R497 Search PubMed.
- B.-Y. Chang and S.-M. Park, Annu. Rev. Anal. Chem., 2010, 3, 207–229 CrossRef CAS PubMed.
- D. D. Macdonald, Electrochim. Acta, 1990, 35, 1509–1525 CrossRef CAS.
- A. Lasia, Modern aspects of electrochemistry, Springer, 2002, pp. 143–248 Search PubMed.
- A. J. Bard and L. R. Faulkner, Electrochem. Methods, 2001, 2, 580–632 Search PubMed.
- E. P. Randviir and C. E. Banks, Anal. Methods, 2013, 5, 1098–1115 RSC.
- F. Lisdat and D. Schäfer, Anal. Bioanal. Chem., 2008, 391, 1555–1567 CrossRef CAS PubMed.
- W. G. Jiang, Electric cell-substrate impedance sensing and cancer metastasis, Springer Science & Business Media, 2012 Search PubMed.
- I. Giaever and C. R. Keese, IEEE Trans. Biomed. Eng., 1986, 242–247 CAS.
- S. Arndt, J. Seebach, K. Psathaki, H.-J. Galla and J. Wegener, Biosens. Bioelectron., 2004, 19, 583–594 CrossRef CAS.
- Q. Liu, J. Yu, L. Xiao, J. C. O. Tang, Y. Zhang, P. Wang and M. Yang, Biosens. Bioelectron., 2009, 24, 1305–1310 CrossRef CAS PubMed.
- O. Pänke, W. Weigel, S. Schmidt, A. Steude and A. A. Robitzki, Biosens. Bioelectron., 2011, 26, 2376–2382 CrossRef PubMed.
- P. Wolf, A. Rothermel, A. G. Beck-Sickinger and A. A. Robitzki, Biosens. Bioelectron., 2008, 24, 253–259 CrossRef CAS PubMed.
- A. R. A. Rahman, C.-M. Lo and S. Bhansali, Sens. Actuators, B, 2006, 118, 115–120 CrossRef CAS.
- J. Wegener, M. Sieber and H.-J. Galla, J. Biochem. Biophys. Methods, 1996, 32, 151–170 CrossRef CAS PubMed.
- J. A. Stolwijk, K. Matrougui, C. W. Renken and M. Trebak, Pfluegers Arch., 2015, 467, 2193–2218 CrossRef CAS PubMed.
- J. Wegener, S. Zink, P. Rösen and H.-J. Galla, Pfluegers Arch., 1999, 437, 925–934 CrossRef CAS PubMed.
- R. Ehret, W. Baumann, M. Brischwein, A. Schwinde, K. Stegbauer and B. Wolf, Biosens. Bioelectron., 1997, 12, 29–41 CrossRef CAS PubMed.
- J. Hong, K. Kandasamy, M. Marimuthu, C. S. Choi and S. Kim, Analyst, 2011, 136, 237–245 RSC.
- M. Sperber, C. Hupf, M.-M. Lemberger, B. Goricnik, N. Hinterreiter, S. Lukic, M. Oberleitner, J. A. Stolwijk and J. Wegener, Measuring Biological Impacts of Nanomaterials, 2016, pp. 45–108 Search PubMed.
- C. K. Choi, A. E. English, K. D. Kihm and C. H. Margraves, J. Biomed. Opt., 2007, 12, 064028 CrossRef PubMed.
- C. K. Choi, C. H. Margraves, S. I. Jun, A. E. English, P. D. Rack and K. D. Kihm, Sensors, 2008, 8, 3257–3270 CrossRef CAS PubMed.
- C. K. Choi, A. E. English, S.-I. Jun, K. D. Kihm and P. D. Rack, Biosens. Bioelectron., 2007, 22, 2585–2590 CrossRef CAS PubMed.
- D. Pallarola, A. Bochen, V. Guglielmotti, T. A. Oswald, H. Kessler and J. P. Spatz, Anal. Chem., 2017, 89, 10054–10062 CrossRef CAS PubMed.
- M. Parviz, K. Gaus and J. J. Gooding, Chem. Sci., 2017, 8, 1831–1840 RSC.
- J. Martinez, A. Montalibet, E. McAdams, M. Faivre and R. Ferrigno, Proceedings, 2017, 1(4), 532 Search PubMed.
- M. L. Doornbos and L. H. Heitman, Methods in cell biology, Elsevier, 2019, vol. 149, pp. 179–194 Search PubMed.
- J. Wegener, C. R. Keese and I. Giaever, Exp. Cell Res., 2000, 259, 158–166 CrossRef CAS PubMed.
- C.-M. Lo, C. R. Keese and I. Giaever, Biophys. J., 1995, 69, 2800–2807 CrossRef CAS PubMed.
- N. DePaola, J. E. Phelps, L. Florez, C. R. Keese, F. L. Minnear, I. Giaever and P. Vincent, Ann. Biomed. Eng., 2001, 29, 648–656 CrossRef CAS PubMed.
- A. B. Moy, M. Winter, A. Kamath, K. Blackwell, G. Reyes, I. Giaever, C. Keese and D. Shasby, Am. J. Physiol.: Lung Cell. Mol. Physiol., 2000, 278, L888–L898 CrossRef CAS PubMed.
- T. D. Pollard, W. C. Earnshaw, J. Lippincott-Schwartz and G. Johnson, Cell biology E-book, Elsevier Health Sciences, 2016 Search PubMed.
- D. M. Perez and S. S. Karnik, Pharmacol. Rev., 2005, 57, 147–161 CrossRef CAS PubMed.
- C. W. Scott and M. F. Peters, Drug Discovery Today, 2010, 15, 704–716 CrossRef CAS PubMed.
- R. Zhang and X. Xie, Acta Pharmacol. Sin., 2012, 33, 372–384 CrossRef CAS PubMed.
- W. Stallaert, J. F. Dorn, E. Van Der Westhuizen, M. Audet and M. Bouvier, PLoS One, 2012, 7, e29420 CrossRef CAS PubMed.
- A. B. Jaffe and A. Hall, Annu. Rev. Cell Dev. Biol., 2005, 21, 247–269 CrossRef CAS PubMed.
- S. Etienne-Manneville and A. Hall, Nature, 2002, 420, 629–635 CrossRef CAS PubMed.
- N. Yu, J. M. Atienza, J. Bernard, S. Blanc, J. Zhu, X. Wang, X. Xu and Y. A. Abassi, Anal. Chem., 2006, 78, 35–43 CrossRef CAS PubMed.
- G. Leung, H. R. Tang, R. McGuinness, E. Verdonk, J. M. Michelotti and V. F. Liu, JALA, 2005, 10, 258–269 CAS.
- E. Verdonk, K. Johnson, R. McGuinness, G. Leung, Y.-W. Chen, H. R. Tang, J. M. Michelotti and V. F. Liu, Assay Drug Dev. Technol., 2006, 4, 609–619 CrossRef PubMed.
- M. F. Peters and C. W. Scott, J. Biomol. Screening, 2009, 14, 246–255 CrossRef PubMed.
- A. Vlachodimou, A. P. IJzerman and L. H. Heitman, Sci. Rep., 2019, 9, 1–10 CrossRef PubMed.
- K. Miyano, K. Ohbuchi, Y. Sudo, K. Minami, T. Yokoyama, M. Yamamoto, M. Uzu, M. Nonaka, S. Shiraishi and H. Murata, J. Pharmacol. Sci., 2020, 143, 320–324 CrossRef PubMed.
- M. F. Peters, F. Vaillancourt, M. Heroux, M. Valiquette and C. W. Scott, Assay Drug Dev. Technol., 2010, 8, 219–227 CrossRef PubMed.
- J. Doijen, T. Van Loy, B. Landuyt, W. Luyten, D. Schols and L. Schoofs, Biosens. Bioelectron., 2019, 137, 33–44 CrossRef CAS PubMed.
- X. Yang, M. A. Dilweg, D. Osemwengie, L. Burggraaff, D. van der Es, L. H. Heitman and A. P. IJzerman, Biochem. Pharmacol., 2020, 180, 114144 CrossRef CAS PubMed.
- E. W. Verweij, B. Al Araaj, W. R. Prabhata, R. Prihandoko, S. Nijmeijer, A. B. Tobin, R. Leurs and H. F. Vischer, ACS Pharmacol. Transl. Sci., 2020, 3, 321–333 CrossRef CAS PubMed.
- M. L. Doornbos, I. Van der Linden, L. Vereyken, G. Tresadern, A. P. IJzerman, H. Lavreysen and L. H. Heitman, Biochem. Pharmacol., 2018, 152, 201–210 CrossRef CAS PubMed.
- M. L. Doornbos, J. M. Cid, J. Haubrich, A. Nunes, J. W. van de Sande, S. C. Vermond, T. Mulder-Krieger, A. A. Trabanco, A. Ahnaou and W. H. Drinkenburg, J. Med. Chem., 2017, 60, 6704–6720 CrossRef CAS PubMed.
- J. Doijen, T. Van Loy, W. De Haes, B. Landuyt, W. Luyten, L. Schoofs and D. Schols, PLoS One, 2017, 12, e0185354 CrossRef PubMed.
- K. Webling, J. Runesson, A. Lang, I. Saar, B. Kofler and Ü. Langel, Neuropeptides, 2016, 60, 75–82 CrossRef CAS PubMed.
- D. Thirkettle-Watts, Biochem. Biophys. Rep., 2016, 6, 32–38 Search PubMed.
- J. Meshki, S. D. Douglas, J.-P. Lai, L. Schwartz, L. E. Kilpatrick and F. Tuluc, J. Biol. Chem., 2009, 284, 9280–9289 CrossRef CAS PubMed.
- R. L. Davis, M. Kahraman, T. J. Prins, Y. Beaver, T. G. Cook, J. Cramp, C. S. Cayanan, E. M. Gardiner, M. A. McLaughlin and A. F. Clark, Bioorg. Med. Chem. Lett., 2010, 20, 3361–3366 CrossRef CAS PubMed.
- R. C. Hardie and K. Franze, Science, 2012, 338, 260–263 CrossRef CAS.
- R. M. Fischer, B. M. Fontinha, S. Kirchmaier, J. Steger, S. Bloch, D. Inoue, S. Panda, S. Rumpel and K. Tessmar-Raible, PLos Biol., 2013, 11, e1001585 CrossRef CAS PubMed.
- J. T. Davis, O. Okunola and R. Quesada, Chem. Soc. Rev., 2010, 39, 3843–3862 RSC.
- A. Vlachodimou, A. P. IJzerman and L. H. Heitman, Sci. Rep., 2019, 9, 13802 CrossRef PubMed.
- C. C. Wang, Y. Hsu, F. Su, S. Lu and T.-M. Lee, J. Biomed. Mater. Res., Part A, 2009, 88, 370–383 CrossRef PubMed.
- K. A. Marx, T. Zhou, A. Montrone, D. McIntosh and S. J. Braunhut, Anal. Biochem., 2007, 361, 77–92 CrossRef CAS PubMed.
- H. Perinpanayagam, R. Zaharias, C. Stanford, R. Brand, J. Keller and G. Schneider, J. Orthop. Res., 2001, 19, 993–1000 CrossRef CAS PubMed.
- S. Hirohashi and Y. Kanai, Cancer Sci., 2003, 94, 575–581 CrossRef CAS PubMed.
- A. A. Khalili and M. R. Ahmad, Int. J. Mol. Sci., 2015, 16, 18149–18184 CrossRef CAS PubMed.
- T. Okegawa, R.-C. Pong, Y. Li and J.-T. Hsieh, Acta Biochim. Pol., 2004, 51, 445–457 CrossRef CAS PubMed.
- J. M. Atienza, J. Zhu, X. Wang, X. Xu and Y. Abassi, J. Biomol. Screening, 2005, 10, 795–805 CrossRef CAS PubMed.
- M. Chockalingam, A. Magenau, S. G. Parker, M. Parviz, S. Vivekchand, K. Gaus and J. J. Gooding, Langmuir, 2014, 30, 8509–8515 CrossRef CAS.
- K. A. Piez and A. Reddi, Extracellular matrix biochemistry, Elsevier, 1984 Search PubMed.
- J. H. Luong, C. Xiao, B. Lachance, Š. M. Leabu, X. Li, S. Uniyal and B. M. Chan, Anal. Chim. Acta, 2004, 501, 61–69 CrossRef CAS.
- R. S. Sawhney, G.-H. K. Zhou, L. E. Humphrey, P. Ghosh, J. I. Kreisberg and M. G. Brattain, J. Biol. Chem., 2002, 277, 75–86 CrossRef CAS PubMed.
- W. A. Muller, Lab. Invest., 2002, 82, 521–534 CrossRef CAS PubMed.
- J. Wegener, A. Hakvoort and H.-J. Galla, Brain Res., 2000, 853, 115–124 CrossRef CAS PubMed.
- J. Qiao, F. Huang and H. Lum, Am. J. Physiol.: Lung Cell. Mol. Physiol., 2003, 284, L972–L980 CrossRef CAS PubMed.
- D. He, Y. Su, P. V. Usatyuk, E. W. Spannhake, P. Kogut, J. Solway, V. Natarajan and Y. Zhao, J. Biol. Chem., 2009, 284, 24123–24132 CrossRef CAS PubMed.
- B. Srinivasan, A. R. Kolli, M. B. Esch, H. E. Abaci, M. L. Shuler and J. J. Hickman, J. Lab. Autom., 2015, 20, 107–126 CrossRef CAS PubMed.
- Y. Fang, Int. J. Electrochem., 2011, 2011, 460850 Search PubMed.
- M. Fiala, A. J. Eshleman, J. Cashman, J. Lin, A. S. Lossinsky, V. Suarez, W. Yang, J. Zhang, W. Popik and E. Singer, J. NeuroVirol., 2005, 11, 281–291 CrossRef CAS PubMed.
- N. Kataoka, K. Iwaki, K. Hashimoto, S. Mochizuki, Y. Ogasawara, M. Sato, K. Tsujioka and F. Kajiya, Proc. Natl. Acad. Sci. U. S. A., 2002, 99, 15638–15643 CrossRef CAS PubMed.
- Y. Ge, T. Deng and X. Zheng, Acta Biochim. Biophys. Sin., 2009, 41, 256–262 CrossRef PubMed.
- L. Treeratanapiboon, K. Psathaki, J. Wegener, S. Looareesuwan, H.-J. Galla and R. Udomsangpetch, Biochem. Biophys. Res. Commun., 2005, 335, 810–818 CrossRef PubMed.
- H. J. Gould, B. J. Sutton, A. J. Beavil, R. L. Beavil, N. McCloskey, H. A. Coker, D. Fear and L. Smurthwaite, Annu. Rev. Immunol., 2003, 21, 579–628 CrossRef PubMed.
- Y. A. Abassi, J. A. Jackson, J. Zhu, J. Oconnell, X. Wang and X. Xu, J. Immunol. Methods, 2004, 292, 195–205 CrossRef PubMed.
- T. Anh-Nguyen, B. Tiberius, U. Pliquett and G. A. Urban, Sens. Actuators, A, 2016, 241, 231–237 CrossRef.
- F. E. Giana, F. J. Bonetto and M. Bellotti, Meas. Sci. Technol., 2019, 31, 025702 CrossRef.
- F. E. Giana, F. J. Bonetto and M. I. Bellotti, Phys. Rev. E, 2018, 97, 032410 CrossRef CAS PubMed.
- S. I. Paiva, L. R. Borges, D. Halpern-Silveira, M. C. F. Assunção, A. J. Barros and M. C. Gonzalez, Support. Care Cancer, 2011, 19, 187–192 CrossRef PubMed.
- L. L. Crowell, J. S. Yakisich, B. Aufderheide and T. N. Adams, Micromachines, 2020, 11, 832 CrossRef PubMed.
- G. Park, C. K. Choi, A. E. English and T. E. Sparer, Cell Biol. Int., 2009, 33, 429–433 CrossRef CAS PubMed.
- K. Heileman, J. Daoud and M. Tabrizian, Biosens. Bioelectron., 2013, 49, 348–359 CrossRef CAS PubMed.
- M. Tarantola, A.-K. Marel, E. Sunnick, H. Adam, J. Wegener and A. Janshoff, Integr. Biol., 2010, 2, 139–150 CrossRef CAS PubMed.
- B. R. Lester and J. B. McCarthy, Cancer Metastasis Rev., 1992, 11, 31–44 CrossRef CAS PubMed.
- R. J. Collins, W. G. Jiang, R. Hargest, M. D. Mason and A. J. Sanders, Cancer Metastasis Rev., 2015, 34, 753–764 CrossRef CAS PubMed.
- W. G. Jiang, T. A. Martin, J. M. Lewis-Russell, A. Douglas-Jones, L. Ye and R. E. Mansel, Mol. Cancer, 2008, 7, 1–10 CrossRef PubMed.
- H. Yin, F. L. Wang, A. L. Wang, J. Cheng and Y. Zhou, Anal. Lett., 2007, 40, 85–94 CrossRef CAS.
- S. Öz, C. Maercker and A. Breiling, PLoS One, 2013, 8, e59895 CrossRef PubMed.
- L. R. Arias, C. A. Perry and L. Yang, Biosens. Bioelectron., 2010, 25, 2225–2231 CrossRef CAS PubMed.
- C. E. Campbell, M. M. Laane, E. Haugarvoll and I. Giaever, Biosens. Bioelectron., 2007, 23, 536–542 CrossRef CAS PubMed.
- T. Albrecht, M. Fons, I. Boldogh and A. S. Rabson, Medical Microbiology, 4th edn, 1996 Search PubMed.
- M. A. Nahid, C. E. Campbell, K. S. Fong, J. C. Barnhill and M. A. Washington, J. Microbiol. Methods, 2020, 169, 105833 CrossRef CAS PubMed.
- Y. Fang, P. Ye, X. Wang, X. Xu and W. Reisen, J. Virol. Methods, 2011, 173, 251–258 CrossRef CAS PubMed.
- M. H. McCoy and E. Wang, J. Virol. Methods, 2005, 130, 157–161 CrossRef CAS PubMed.
- C. J. Thieulent, E. S. Hue, C. I. Fortier, P. Dallemagne, S. Zientara, H. Munier-Lehmann, A. Hans, G. D. Fortier, P.-H. Pitel and P.-O. Vidalain, Virology, 2019, 526, 105–116 CrossRef CAS PubMed.
- M. R. Pennington and G. R. Van de Walle, mSphere, 2017, 2(2) DOI:10.1128/msphere.00039-17.
- J. Piret, N. Goyette and G. Boivin, J. Clin. Microbiol., 2016, 54, 2120–2127 CrossRef CAS PubMed.
- S. Marlina, M.-H. Shu, S. AbuBakar and K. Zandi, Parasites Vectors, 2015, 8, 1–10 CrossRef PubMed.
- Z. Teng, X. Kuang, J. Wang and X. Zhang, J. Virol. Methods, 2013, 193, 364–370 CrossRef CAS PubMed.
- P. T. Witkowski, L. Schuenadel, J. Wiethaus, D. R. Bourquain, A. Kurth and A. Nitsche, Biochem. Biophys. Res. Commun., 2010, 401, 37–41 CrossRef CAS PubMed.
- D. Tian, W. Zhang, J. He, Y. Liu, Z. Song, Z. Zhou, M. Zheng and Y. Hu, PLoS One, 2012, 7, e31965 CrossRef CAS PubMed.
- C. Charretier, A. Saulnier, L. Benair, C. Armanet, I. Bassard, S. Daulon, B. Bernigaud, E. R. de Sousa, C. Gonthier and E. Zorn, J. Virol. Methods, 2018, 252, 57–64 CrossRef CAS PubMed.
- P. Banerjee and A. K. Bhunia, Trends Biotechnol., 2009, 27, 179–188 CrossRef CAS PubMed.
- T. J. Nowakowski, A. A. Pollen, E. Di Lullo, C. Sandoval-Espinosa, M. Bershteyn and A. R. Kriegstein, Cell Stem Cell, 2016, 18, 591–596 CrossRef PubMed.
- A. Ismail, T. Mahboob, C. Samudi Raju and S. D. Sekaran, Trop. Biomed., 2019, 36, 888–897 Search PubMed.
- C. Jensen and Y. Teng, Front. Mol. Biosci., 2020, 7, 33 CrossRef PubMed.
- Q. Hassan, S. Ahmadi and K. Kerman, Micromachines, 2020, 11, 590 CrossRef PubMed.
- F. Alexander, S. Eggert and D. Price, Label-Free Monitoring of Cells In Vitro, 2019, pp. 111–134 Search PubMed.
- Y. Pan, N. Hu, X. Wei, L. Gong, B. Zhang, H. Wan and P. Wang, Biosens. Bioelectron., 2019, 130, 344–351 CrossRef PubMed.
- Y. Pan, D. Jiang, C. Gu, Y. Qiu, H. Wan and P. Wang, Microsyst. Nanoeng., 2020, 6, 23 CrossRef PubMed.
- S. H. Jeong, D. W. Lee, S. Kim, J. Kim and B. Ku, Biosens. Bioelectron., 2012, 35, 128–133 CrossRef PubMed.
- H. Wu, Y. Yang, P. O. Bagnaninchi and J. Jia, Analyst, 2018, 143, 4189–4198 RSC.
- S.-M. Lee, N. Han, R. Lee, I.-H. Choi, Y.-B. Park, J.-S. Shin and K.-H. Yoo, Biosens. Bioelectron., 2016, 77, 56–61 CrossRef PubMed.
- K. F. Lei, Z.-M. Wu and C.-H. Huang, Biosens. Bioelectron., 2015, 74, 878–885 CrossRef PubMed.
- D. Kloß, R. Kurz, H.-G. Jahnke, M. Fischer, A. Rothermel, U. Anderegg, J. C. Simon and A. A. Robitzki, Biosens. Bioelectron., 2008, 23, 1473–1480 CrossRef PubMed.
- S. Fleischer, H.-G. Jahnke, E. Fritsche, M. Girard and A. A. Robitzki, Biosens. Bioelectron., 2019, 126, 624–631 CrossRef CAS PubMed.
- M. Eichler, H.-G. Jahnke, D. Krinke, A. Müller, S. Schmidt, R. Azendorf and A. A. Robitzki, Biosens. Bioelectron., 2015, 67, 582–589 CrossRef CAS PubMed.
- S. E. De León, A. Pupovac and S. L. McArthur, Biotechnol. Bioeng., 2020, 117, 1230–1240 CrossRef PubMed.
- H. Thielecke, A. Mack and A. Robitzki, Fresenius’ J. Anal. Chem., 2001, 369, 23–29 CrossRef CAS PubMed.
- V. Curto, M. Ferro, F. Mariani, E. Scavetta and R. Owens, Lab Chip, 2018, 18, 933–943 RSC.
- H.-G. Jahnke, A. Mewes, F. D. Zitzmann, S. Schmidt, R. Azendorf and A. A. Robitzki, Sci. Rep., 2019, 9, 1–10 CrossRef CAS PubMed.
- J. A. Stolwijk and J. Wegener, Label-Free Monitoring of Cells In Vitro, 2019, pp. 1–75 Search PubMed.
- M. F. Peters and C. W. Scott, SLAS Discovery, 2009, 14, 246–255 CrossRef CAS PubMed.
- S. Arman, V. R. Gonçales, Y. Yang, R. D. Tilley, K. Gaus and J. J. Gooding, Electroanalysis, 2023, 35, e202300124 CrossRef CAS.
- M. Oberleitner and M. Oberleitner, Label-free and Multi-parametric Monitoring of Cell-based Assays with Substrate-embedded Sensors, 2018, pp. 151–293 Search PubMed.
- S. Michaelis, J. Wegener and R. Robelek, Biosens. Bioelectron., 2013, 49, 63–70 CrossRef CAS PubMed.
- C. Wu, J. Zhou, N. Hu, D. Ha, X. Miao and P. Wang, Sens. Actuators, A, 2013, 199, 136–142 CrossRef CAS.
- K. F. Lei, M.-H. Wu, C.-W. Hsu and Y.-D. Chen, Biosens. Bioelectron., 2014, 51, 16–21 CrossRef CAS PubMed.
- Y. Zhao, X. Zhao, D. Chen, Y. Luo, M. Jiang, C. Wei, R. Long, W. Yue, J. Wang and J. Chen, Biosens. Bioelectron., 2014, 57, 245–253 CrossRef CAS PubMed.
- W. Fan, X. Chen, Y. Ge, Y. Jin, Q. Jin and J. Zhao, Biosens. Bioelectron., 2019, 145, 111730 CrossRef CAS PubMed.
- J. Lum, R. Wang, K. Lassiter, B. Srinivasan, D. Abi-Ghanem, L. Berghman, B. Hargis, S. Tung, H. Lu and Y. Li, Biosens. Bioelectron., 2012, 38, 67–73 CrossRef CAS PubMed.
- S. Kim, H. Song, H. Ahn, T. Kim, J. Jung, S. K. Cho, D.-M. Shin, J.-r. Choi, Y.-H. Hwang and K. Kim, Biosensors, 2021, 11, 412 CrossRef CAS PubMed.
- H. E. Ayliffe, A. B. Frazier and R. Rabbitt, J. Microelectromech. Syst., 1999, 8, 50–57 CrossRef.
- J. Chen, C. Xue, Y. Zhao, D. Chen, M.-H. Wu and J. Wang, Int. J. Mol. Sci., 2015, 16, 9804–9830 CrossRef CAS PubMed.
- D. Spencer, V. Hollis and H. Morgan, Biomicrofluidics, 2014, 8, 064124 CrossRef PubMed.
- C. Dalmay, M. Cheray, A. Pothier, F. Lalloué, M. Jauberteau and P. Blondy, Sens. Actuators, A, 2010, 162, 189–197 CrossRef CAS.
- J.-L. Hong, K.-C. Lan and L.-S. Jang, Sens. Actuators, B, 2012, 173, 927–934 CrossRef CAS.
- N.-V. Nguyen and C.-P. Jen, Biosens. Bioelectron., 2018, 121, 10–18 CrossRef CAS PubMed.
- Z. Lin, S.-Y. Lin, P. Xie, C.-Y. Lin, G. M. Rather, J. R. Bertino and M. Javanmard, Sci. Rep., 2020, 10, 3015 CrossRef CAS PubMed.
- S. Zhu, X. Zhang, Z. Zhou, Y. Han, N. Xiang and Z. Ni, Talanta, 2021, 233, 122571 CrossRef CAS PubMed.
- I. Bilican, M. T. Guler, M. Serhatlioglu, T. Kirindi and C. Elbuken, Sens. Actuators, B, 2020, 307, 127531 CrossRef.
- Y.-S. Chen, C.-H. Huang, P.-C. Pai, J. Seo and K. F. Lei, Biosensors, 2023, 13, 83 CrossRef CAS PubMed.
- Y. Cho, H. S. Kim, A. B. Frazier, Z. G. Chen, D. M. Shin and A. Han, J. Microelectromech. Syst., 2009, 18, 808–817 Search PubMed.
- T. A. Nguyen, T.-I. Yin, D. Reyes and G. A. Urban, Anal. Chem., 2013, 85, 11068–11076 CrossRef CAS PubMed.
- Y. Feng, L. Huang, P. Zhao, F. Liang and W. Wang, Anal. Chem., 2019, 91, 15204–15212 CrossRef CAS PubMed.
- Y. Zheng, J. Nguyen, Y. Wei and Y. Sun, Lab Chip, 2013, 13, 2464–2483 RSC.
- A. Adamo, A. Sharei, L. Adamo, B. Lee, S. Mao and K. F. Jensen, Anal. Chem., 2012, 84(15), 6438–6443 CrossRef CAS PubMed.
- P. Ghassemi, X. Ren, B. M. Foster, B. A. Kerr and M. Agah, Biosens. Bioelectron., 2020, 150, 111868 CrossRef CAS PubMed.
| This journal is © The Royal Society of Chemistry 2024 |

