
 Open Access Article
 This Open Access Article is licensed under a Creative Commons Attribution-Non Commercial 3.0 Unported Licence
Tetracene cyclophanes showing controlled intramolecular singlet fission by through-space orientations†
Hayato
Sakai
 a,
Keigo
Nonaka
b,
Ryo
Hayasaka
a,
Shakkeeb
Thazhathethil
b,
Yoshimitsu
Sagara
*bc and
Taku
Hasobe
*a
a,
Keigo
Nonaka
b,
Ryo
Hayasaka
a,
Shakkeeb
Thazhathethil
b,
Yoshimitsu
Sagara
*bc and
Taku
Hasobe
*a
aDepartment of Chemistry, Faculty of Science and Technology, Keio University, Yokohama, Kanagawa 223-8522, Japan. E-mail: hasobe@chem.keio.ac.jp
bDepartment of Materials Science and Engineering, Tokyo Institute of Technology, Ookayama, Tokyo 152-8522, Japan. E-mail: sagara.y.aa@m.titech.ac.jp
cLiving Systems Materialogy (LiSM) Research Group, International Research Frontiers Initiative (IRFI), Tokyo Institute of Technology, 4259 Nagatsuda-cho, Midori-ku, Yokohama, Kanagawa 226-8503, Japan
First published on 13th March 2024
Abstract
Tetracene cyclophanes: a series of cyclic tetracene dimers bridged by two flexible ethylene glycol units demonstrated enhanced intramolecular singlet fission through through-space orientations by suppressing the H-type excited complex.
Singlet fission (SF) is a spin-allowed multi-exciton generation process, in which a singlet exciton (S1 + S0) is converted into two individual triplet excitons (T1 + T1) through a correlated triplet pair (TT) in two nearby chromophores (eqn (1)).1–4
| S1 + S0 → TT → T1 + T1 | (1) |
Cyclophanes are cyclic compounds composed of aromatic and aliphatic groups.21,22 The fascinating molecular structures have attracted much attention from the viewpoint of organic synthesis and supramolecular chemistry.23 The control of through-space interactions between neighboring chromophores by cyclic structures is also useful for the occurrence of ISF. However, no attention has been drawn to the above concept.
Based on the above concept, the purpose of this study is to clarify the linker-distance dependent-ISF properties, which are dominated by the through-space interaction, using cyclic dimers. In this study, we synthesized tetracene cyclophanes: cyclic tetracene (Tet) dimers with two flexible ethylene glycol chains (denoted as (Tet)2-CyOn: n shows the number of oxygen atoms in ethylene glycol chains) together with the reference Tet monomer (Tet-ref) (Fig. 1). The detailed ISF properties associated with the linker length-dependent dimeric orientation are discussed.
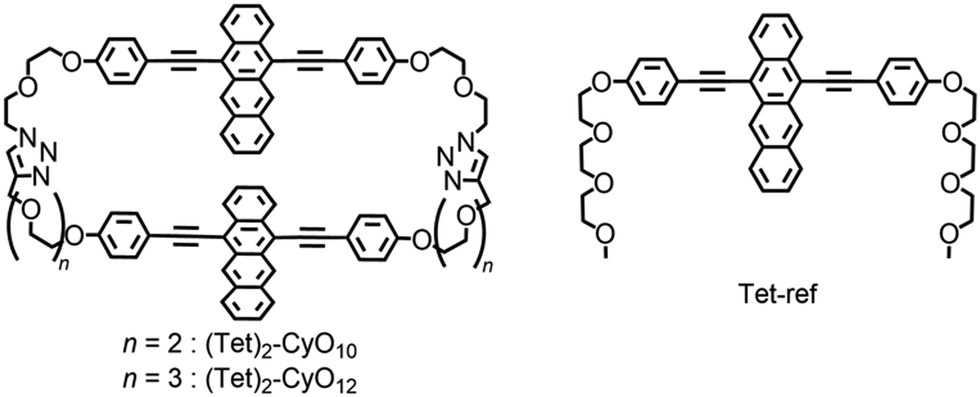 | ||
| Fig. 1 Chemical structures of tetracene (Tet) cyclophanes and a reference compound in this study. | ||
The synthetic procedures of (Tet)2-CyOn and Tet-ref are summarized in Schemes S1–S3 in the ESI.† The key step for the synthesis of (Tet)2-CyO10 is a Cu(I)-catalyzed Huisgen cycloaddition between Tet derivatives carrying two oligoethylene glycols terminated with alkynes or azide groups based on our reported method.24 (Tet)2-CyO12 was similarly synthesized. The detailed synthetic procedures and characterizations are shown in Fig. S1–S54 in the ESI.†
To examine the structural configuration between the two Tet units in (Tet)2-CyOn, 1H NMR was measured (Fig. S55 in ESI†) together with density functional theory (DFT) calculations at the ωB97XD/DGTZVP level (Fig. 2 and Fig. S56, S57 in ESI†). The proton signals derived from Tet and phenylacetylene substituents were seen in the spectral range of ca. 6.7–9.2 ppm. The up-field shifts of these proton peaks in (Tet)2-CyOn relative to Tet-ref were observed because of the effect of aromatic ring current from the other Tet unit. Moreover, the up-field shifted trend of (Tet)2-CyO10 is much larger than that of (Tet)2-CyO12, which demonstrated the larger electronic coupling interaction between the two Tet units in (Tet)2-CyO10. DFT calculations also supported the plausible orientation between the two Tet units in (Tet)2-CyOn. In contrast with the approximate constant mean-plane distance between the two Tet units (3.3 Å), the slipping distances, namely the center-to-center distance of (Tet)2-CyO12 (5.1 Å), significantly increased as compared to (Tet)2-CyO10 (1.5 Å). The rotational barrier energies between the two Tet units by DFT demonstrated the smaller conformational flexibility of (Tet)2-CyO10 due to the much larger energy barrier (Fig. S58 in ESI†).7 Consequently, (Tet)2-CyO10 shows large electronic coupling and small conformational flexibility, which is in sharp contrast with the small electronic coupling and large conformational flexibility observed in (Tet)2-CyO12.5
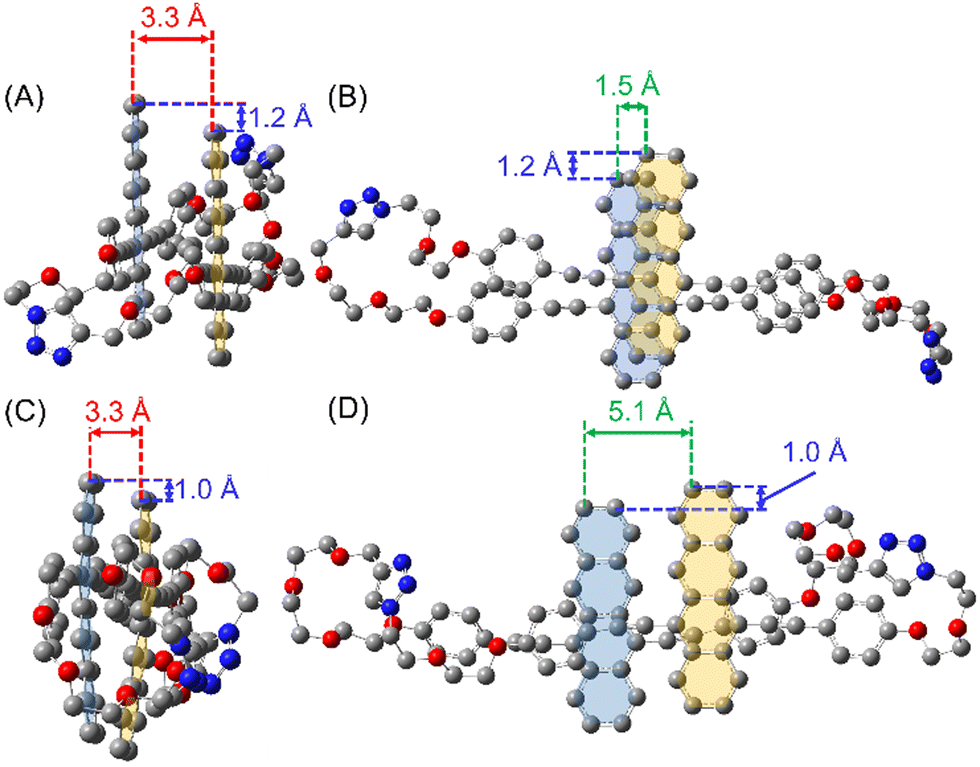 | ||
| Fig. 2 Optimized structures of (Tet)2-CyOn calculated by DFT at the ωB97XD/DGTZVP level. (A) Side- and (B) top-views of (Tet)2-CyO10 (cofacial orientation). (C) Side- and (D) top-views of (Tet)2-CyO12 (slipping orientation). The oxygen and nitrogen atoms are highlighted in red and blue, respectively. The hydrogen atoms are omitted for simplicity. | ||
To further examine the electronic structures, steady-state absorption and fluorescence spectra of (Tet)2-CyOn were measured in THF. In absorption measurements (Fig. 3A), (Tet)2-CyOn demonstrated broadened spectra in the range from the UV to visible region (up to ca. 620 nm) as compared to Tet-ref. Additionally, the relative ratio of 0-1 to 0-0 vibronic progressions of the lowest-energy absorption band (ε0-1/ε0-0) was evaluated because it is a typical evaluation method for the coupling strength in molecular dimers.25 Increased values of (Tet)2-CyO12 (0.91) and (Tet)2-CyO10 (0.97) were observed as compared to Tet-ref (0.77), whereas smaller interchromophore electronic coupling in (Tet)2-CyO12 relative to (Tet)2-CyO10 was observed. This agrees well with the above discussions in 1H NMR and DFT calculations.
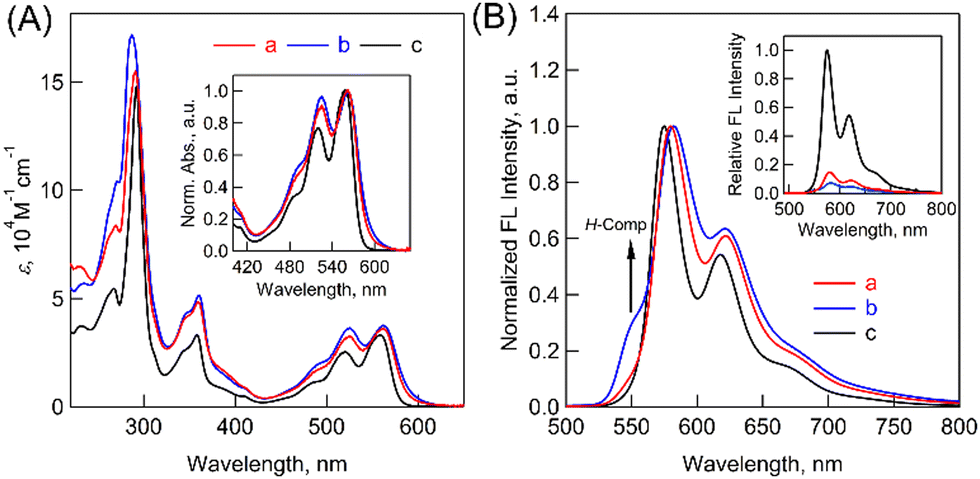 | ||
| Fig. 3 (A) Absorption spectra of (a) (Tet)2-CyO12 (red), (b) (Tet)2-CyO10 (blue) and (c) Tet-ref (black) in THF. The inset shows the normalized spectra for comparison. (B) Normalized fluorescence spectra of (a) (Tet)2-CyO12 (red), (b) (Tet)2-CyO10 (blue) and (c) Tet-ref (black) in THF (λex = 480 nm). The inset shows the comparison of the fluorescence intensities. | ||
Then, fluorescence measurements demonstrated strong fluorescence quenching of (Tet)2-CyOn relative to Tet-ref together with the broadened spectra because of the dimeric form, which indicates a possibility of ISF in (Tet)2-CyOn (Fig. 3B and Table S1 in ESI†). Furthermore, the fluorescence quenching trend of (Tet)2-CyO10 is larger than that of (Tet)2-CyO12 because of the larger electronic coupling of (Tet)2-CyO10 as stated above. Interestingly, an additional vibronic band was only observed in (Tet)2-CyO10 at ca. 550 nm in the shorter wavelength region (Fig. 3B and 4), rather than the excimer observed in the longer wavelength region. This is probably attributable to the H-type excited complex (H-Comp) between two Tet units. A similar emission trend was observed in 9,10-bis(phenylethynyl)anthracene cyclophanes by us.26,27 The excitation wavelength-dependent fluorescence spectra of (Tet)2-CyO10 also demonstrated relatively larger emission derived from H-Comp at shorter excitation wavelengths (Fig. S59 in ESI†). In contrast with two different fluorescence lifetime components of (Tet)2-CyO12, which correspond to ISF and reverse triplet–triplet annihilation (TTA), the third lifetime species should be attributable to the emission of H-Comp in (Tet)2-CyO10 (Fig. 4B and Table S2 in the ESI†).
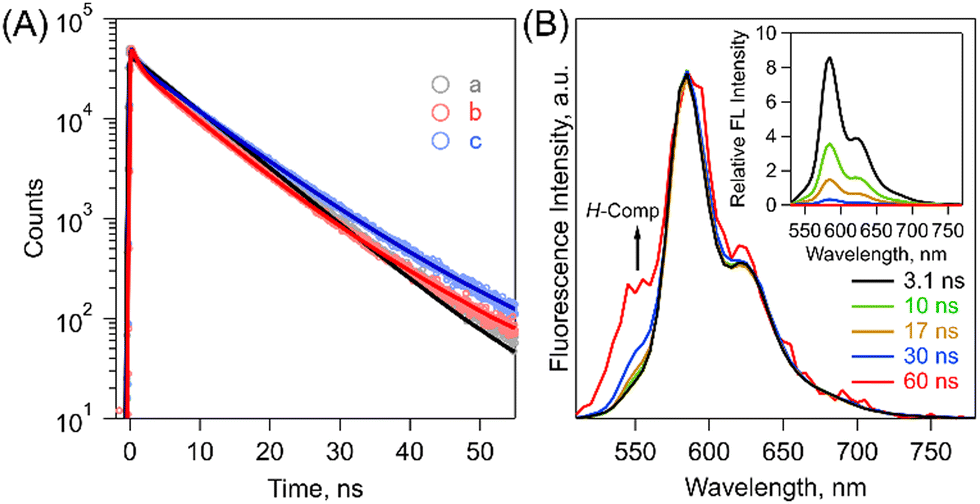 | ||
| Fig. 4 (A) Fluorescence decay profiles of (a) Tet-ref (gray), (b) (Tet)2-CyO10 (blue) and (c) (Tet)2-CyO12 (red) in THF (λex = 404 nm). The obtained lifetimes are summarized in Table S2 in the ESI.† (B) Normalized time-resolved emission spectra of (Tet)2-CyO10 in THF (λex = 404 nm). The inset shows the time-resolved emission spectra (λex = 404 nm). 3.1 ns (black), 10 ns (green), 17 ns (brown), 30 ns (blue) and 60 ns (red). | ||
To examine the dynamics of (Tet)2-CyOn, we have performed transient absorption measurements in THF. Before starting the detailed discussion, first, we assigned the singlet and triplet absorption spectra of the Tet unit (Fig. S60–S64 in ESI†). In the case of the singlet absorption, we employed Tet-ref and observed two different positive absorption bands (400–500 and 600–750 nm regions). In the triplet absorption, we employed triplet–triplet energy transfer from anthracene (a sensitizer) to (Tet)2-CyOn. The resulting individual triplet spectra were observed mainly in the range of ca. 400–500 nm. Note that the individual triplet absorption at wavelengths longer than 600 nm has quite small molar absorption coefficients, which is a major difference from the singlet absorption. Additionally, the molar absorption coefficients of these triplet spectra (εT) were determined to estimate individual triplet yields (ΦT) (Tables S3–S6 in ESI†).
Then, we measured the femtosecond transient absorption spectra (fs-TAS) of (Tet)2-CyOn in THF (Fig. S65, S66 in ESI†). Typically, Fig. S66 in the ESI† shows fs-TAS of (Tet)2-CyO12 and corresponding species-associated spectra (SAS) by target analysis (vide infra), respectively. After photoexcitation at 515 nm, initial singlet absorption bands of (Tet)2-CyO12 appeared immediately, and then solvent relaxation occurred in the time region up to ca. 10 ps. Then, the two distinct singlet absorption band intensities in the short and long wavelength regions decreased, resulting in the formation of a correlated triplet pair (TT) at around 1 ns. In contrast, the photophysical behavior of (Tet)2-CyO10 is roughly similar to that of (Tet)2-CyO12, whereas the above-mentioned deactivation process based on the H-Comp formation was included. Such spectral changes are in sharp contrast with Tet-ref.
To quantitatively and kinetically discuss the detailed photodynamics, we proposed a kinetic model for the occurrence of ISF and analyzed SAS (Fig. 5A and Scheme S4 in ESI†). The rate constant of the initial solvent relaxation process from the initial singlet excited state  to the solvent-relaxed singlet excited state (S1) is denoted as ksolv. Then, the ISF from S1 to TT (kISF) together with the deactivation from S1 to the ground state (k0), TTA (kTTA), and deactivation and emission processes by H-Comp (kComp and kLum) are included. In addition to the direct recombination (kREC) from TT to the ground state and deactivation process (kT) from the T1 + T1 to the ground state, the TT can generate the T1 + T1 by the dissociation (kDISS). SAS and corresponding time-dependent concentration profiles were obtained by target analysis.28 The changes of the spectral shapes should be emphasized when comparing the SAS of fs-TAS in (Tet)2-CyOn (Fig. S65, S66 in ESI†). In particular, the maximum wavelength at around 400–500 nm changes from 426 nm
  to 431 nm (S1) and 432 nm (TT). Then, the obtained rate constants and quantum yields of TT (ΦTT) and T1 + T1 (ΦT) were summarized (Table 1). The kISF of (Tet)2-CyO10 (1.5 × 10⁹ s−1) is larger than that of (Tet)2-CyO12 (1.1 × 10⁹ s−1) because of the lager electronic coupling of (Tet)2-CyO10. These kISF values are an order of magnitude greater than kTTA, k0 and kComp, resulting in efficient ISF (ΦTT: 65% for (Tet)2-CyO10 and ΦTT: 69% for (Tet)2-CyO12). Note the maximum ΦTT is 100%. The larger kinetic ratios of kISF relative to kTTA are consistent with the ΦTT values. The kComp of (Tet)2-CyO10 has a great effect on the decrease of the ΦT (vide infra).
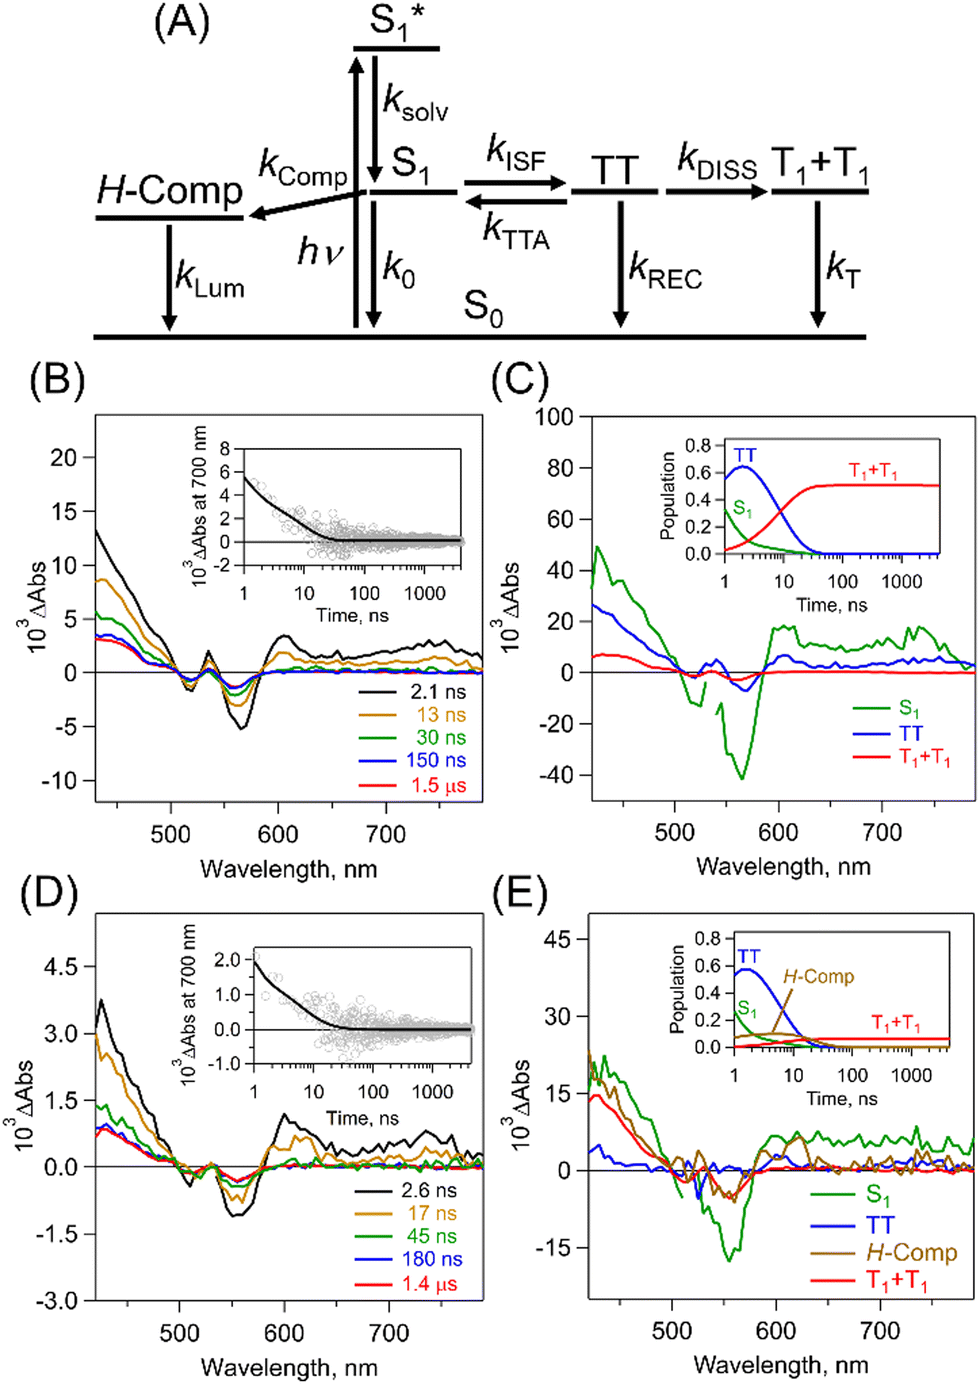 | ||
| Fig. 5 (A) A proposed kinetic model. (B) ps-TAS of (Tet)2-CyO12 in THF (λex: 532 nm). The inset figure shows the time profile at 700 nm. (C) SAS of (Tet)2-CyO12: S1 (black), TT (blue) and T1 + T1 (red). The inset shows the time-dependent population profiles. (D) ps-TAS of (Tet)2-CyO10 in THF (λex: 532 nm). The inset shows the time profile at 700 nm. (E) SAS of (Tet)2-CyO10: S1 (black), TT (blue), H-Comp (brown) and T1 + T1 (red). The inset shows the time-dependent population profiles. | ||
| k solv,a 1010 s−1 | k 0,b 108 s−1 | k Comp,a 108 s−1 | k Lum,c 107 s−1 | k ISF,a 109 s−1 | k TTA,a 108 s−1 | k REC,d 107 s−1 | k DISS,e 107 s−1 | k ISF/kTTA (kDISS/kREC) | k T, 103 s−1 (τT, ms) | Φ TT,h % | Φ T,i % | |
|---|---|---|---|---|---|---|---|---|---|---|---|---|
| a Estimated by target analysis of fs-TAS. b Calculated by k0 = (τS)−1, τS was estimated by fluorescence lifetime of Tet-ref (τS: 7.6 ns). c Calculated by kLum = (τLum)−1, τLum was estimated by fluorescence lifetime of (Tet)2-CyO10 (τLum: 15.2 ns). d Calculated by kREC = kTT − kDISS = (τTT)−1 − kDISS, τTT was estimated by target analysis of ps-TAS. e Calculated by kDISS = kTT × ΦT/(2ΦTT). f Calculated by kT = τT−1, τT was estimated by ns-TAS. g Calculated by kT = (τT)−1, τT was estimated by the sensitization experiment of Tet-ref. h Estimated by the population of TT considering kTTA (Fig. 4C and E and Fig. S65, S66 in ESI). i Estimated by ps-TAS. | ||||||||||||
| (Tet)2-CyO10 | 3.3 | 1.3 | 4.5 | 6.7 | 1.5 | 1.7 | 14 | 1.4 | 8.8 (0.10) | 5.4f (0.19f) | 65 | 14 ± 1.2 |
| (Tet)2-CyO12 | 8.8 | 1.3 | — | — | 1.1 | 1.1 | 6.1 | 5.7 | 10 (0.93) | 5.5f (0.19f) | 69 | 108 ± 2.5 |
| Tet-ref | 1.2 | 1.3 | — | — | — | — | — | — | 5.1g (0.20g) | — | 0.8 ± 0.3 | |
To further investigate the TT dissociation, picosecond transient absorption spectra (ps-TAS) of (Tet)2-CyOn were measured in THF with 532 nm excitation (Fig. 5B–E). The transient spectrum derived from TT (blue in Fig. 5B) initially appeared and the T1 + T1 were seen in both (Tet)2-CyO10 and (Tet)2-CyO12, which agrees well with the above-mentioned triplet spectra of (Tet)2-CyOn by sensitization (Fig. S64 in ESI†). The kDISS of (Tet)2-CyO12 (5.7 × 10⁷ s−1) is much larger than that of (Tet)2-CyO10 (1.4 × 10⁷ s−1), whereas the kREC of (Tet)2-CyO12 (6.1 × 10⁷ s−1) is smaller than that of (Tet)2-CyO10 (1.4 × 10⁸ s−1).
Therefore, the relative ratio between kREC and kDISS (kDISS/kREC) in (Tet)2-CyO12 (0.93) is significantly larger than (Tet)2-CyO10 (0.10), indicating the accelerated TT dissociation in (Tet)2-CyO12. This is also associated with the much larger ΦT in (Tet)2-CyO12 (108%) relative to (Tet)2-CyO10 (14%) (maximum ΦT: 200%). The significant increase in ΦT of (Tet)2-CyO12 should be related to the suppression of H-Comp formation caused by the larger conformational flexibility because of the longer ethylene glycol chains.5 The kT was calculated from the lifetime (τT: 0.19 ms) by nanosecond transient absorption spectra in THF (Fig. S67, S68 in ESI†), as shown in Table 1. Additionally, fs-/ps-TAS of (Tet)2-CyOn in toluene (less-polar solvent) demonstrated the decreased ΦTT and ΦT in toluene relative to those in THF (Fig. S69–S72 and Tables S7, S8 in ESI†). The polar ethylene glycol chains are likely to be less structurally flexible in a less-polar solvent, preventing the TT dissociation.
In conclusion, a series of tetracene cyclophanes demonstrated the enhanced ISF by controlled through-space orientations. (Tet)2-CyO12 exhibited the much-enhanced ΦT (108%) as compared to (Tet)2-CyO10 (14%) because of the suppression of H-Comp formation. Although the obtained ΦT are not as high as those of reported acyclic Tet dimers with the highly efficient or quantitative ΦT,7,14,15,17 our synthetic strategy utilizing cyclophanes should provide new functionalization of SF.
This work was partially supported by JSPS KAKENHI Grant-in-Aid for Transformative Research Areas, “Materials Science of Meso-Hierarchy” (JP23H04876 to T. H., JP23H04878 to Y. S.) and “Aquatic Functional Materials” (JP20H05234 to T. H. and JP20H05198 to Y. S.).
Conflicts of interest
There are no conflicts to declare.Notes and references
- M. B. Smith and J. Michl, Chem. Rev., 2010, 110, 6891–6936 CrossRef CAS PubMed.
- K. Miyata, F. S. Conrad-Burton, F. L. Geyer and X. Y. Zhu, Chem. Rev., 2019, 119, 4261–4292 CrossRef CAS PubMed.
- R. Casillas, I. Papadopoulos, T. Ullrich, D. Thiel, A. Kunzmann and D. M. Guldi, Energy Environ. Sci., 2020, 13, 2741–2804 RSC.
- R. M. Young and M. R. Wasielewski, Acc. Chem. Res., 2020, 53, 1957–1968 CrossRef CAS PubMed.
- T. Hasobe, S. Nakamura, N. V. Tkachenko and Y. Kobori, ACS Energy Lett., 2022, 7, 390–400 CrossRef CAS.
- H. Sakai, R. Inaya, H. Nagashima, S. Nakamura, Y. Kobori, N. V. Tkachenko and T. Hasobe, J. Phys. Chem. Lett., 2018, 9, 3354–3360 CrossRef CAS PubMed.
- S. Nakamura, H. Sakai, H. Nagashima, M. Fuki, K. Onishi, R. Khan, Y. Kobori, N. V. Tkachenko and T. Hasobe, J. Phys. Chem. C, 2021, 125, 18287–18296 CrossRef CAS.
- S. Nakamura, H. Sakai, M. Fuki, Y. Kobori, N. V. Tkachenko and T. Hasobe, J. Phys. Chem. Lett., 2021, 12, 6457–6463 CrossRef CAS PubMed.
- S. Lukman, K. Chen, J. M. Hodgkiss, D. H. P. Turban, N. D. M. Hine, S. Dong, J. Wu, N. C. Greenham and A. J. Musser, Nat. Commun., 2016, 7, 13622 CrossRef CAS PubMed.
- S. N. Sanders, E. Kumarasamy, A. B. Pun, M. T. Trinh, B. Choi, J. Xia, E. J. Taffet, J. Z. Low, J. R. Miller, X. Roy, X. Y. Zhu, M. L. Steigerwald, M. Y. Sfeir and L. M. Campos, J. Am. Chem. Soc., 2015, 137, 8965–8972 CrossRef CAS PubMed.
- S. Nakamura, H. Sakai, M. Fuki, R. Ooie, F. Ishiwari, A. Saeki, N. V. Tkachenko, Y. Kobori and T. Hasobe, Angew. Chem., Int. Ed., 2023, 62, e202217704 CrossRef CAS PubMed.
- T. Kinoshita, S. Nakamura, M. Harada, T. Hasobe and G. Fukuhara, Chem. Sci., 2023, 14, 3293–3301 RSC.
- J. Kim, H. T. Teo, Y. Hong, Y. C. Liau, D. Yim, Y. Han, J. Oh, H. Kim, C. Chi and D. Kim, J. Am. Chem. Soc., 2023, 145, 19812–19823 CrossRef CAS PubMed.
- T. Wang, H. Liu, X. Wang, L. Tang, J. Zhou, X. Song, L. Lv, W. Chen, Y. Chen and X. Li, J. Mater. Chem. A, 2023, 11, 8515–8539 RSC.
- N. V. Korovina, J. Joy, X. Feng, C. Feltenberger, A. I. Krylov, S. E. Bradforth and M. E. Thompson, J. Am. Chem. Soc., 2018, 140, 10179–10190 CrossRef CAS PubMed.
- Z. Wang, H. Liu, X. Xie, C. Zhang, R. Wang, L. Chen, Y. Xu, H. Ma, W. Fang, Y. Yao, H. Sang, X. Wang, X. Li and M. Xiao, Nat. Chem., 2021, 13, 559–567 CrossRef CAS PubMed.
- Y. Bo, Y. Hou, D. Thiel, R. Weiß, T. Clark, M. J. Ferguson, R. R. Tykwinski and D. M. Guldi, J. Am. Chem. Soc., 2023, 145, 18260–18275 CrossRef CAS PubMed.
- K. Majumder, S. Mukherjee, N. A. Panjwani, J. Lee, R. Bittl, W. Kim, S. Patil and A. J. Musser, J. Am. Chem. Soc., 2023, 145, 20883–20896 CrossRef CAS PubMed.
- C. Hetzer, D. M. Guldi and R. R. Tykwinski, Chem. – Eur. J., 2018, 24, 8245–8257 CrossRef CAS PubMed.
- H. M. Bergman, G. R. Kiel, R. J. Witzke, D. P. Nenon, A. M. Schwartzberg, Y. Liu and T. D. Tilley, J. Am. Chem. Soc., 2020, 142, 19850–19855 CrossRef CAS PubMed.
- Y. Morisaki, K. Inoshita and Y. Chujo, Chem. – Eur. J., 2014, 20, 8386–8390 CrossRef CAS PubMed.
- W. Kim, A. Nowak-Król, Y. Hong, F. Schlosser, F. Würthner and D. Kim, J. Phys. Chem. Lett., 2019, 10, 1919–1927 CrossRef CAS PubMed.
- D. Ramaiah, P. P. Neelakandan, A. K. Nair and R. R. Avirah, Chem. Soc. Rev., 2010, 39, 4158–4168 RSC.
- S. Thazhathethil, T. Muramatsu, N. Tamaoki, C. Weder and Y. Sagara, Angew. Chem., Int. Ed., 2022, 61, e202209225 CrossRef CAS PubMed.
- H. Horinouchi, H. Sakai, Y. Araki, T. Sakanoue, T. Takenobu, T. Wada, N. V. Tkachenko and T. Hasobe, Chem. – Eur. J., 2016, 22, 9631–9641 CrossRef CAS PubMed.
- Y. Sagara, C. Weder and N. Tamaoki, RSC Adv., 2016, 6, 80408–80414 RSC.
- Y. Sagara, Y. C. Simon, N. Tamaoki and C. Weder, Chem. Commun., 2016, 52, 5694–5697 RSC.
- J. J. Snellenburg, S. Laptenok, R. Seger, K. M. Mullen and I. H. M. van Stokkum, J. Stat. Softw., 2012, 49, 1–22 Search PubMed.
Footnote |
| † Electronic supplementary information (ESI) available. Synthesis, spectroscopic and DFT calculations of the tetracene derivatives. See DOI: https://doi.org/10.1039/d4cc00278d |
| This journal is © The Royal Society of Chemistry 2024 |