
 Open Access Article
 This Open Access Article is licensed under a Creative Commons Attribution-Non Commercial 3.0 Unported Licence
Facile construction of a BiVO4/CoV-LDHs/Ag photoanode for enhanced photo-electrocatalytic glycerol oxidation and hydrogen evolution†
Zhengzhe
Xie
a,
Xiaoyuan
Liu
ab,
Pengpeng
Jia
ab,
Yu
Zou
 ab and
Jiang
Jiang
*ab
ab and
Jiang
Jiang
*ab
ai-Lab, CAS Key Laboratory of Nano-Bio Interface, Suzhou Institute of Nano-Tech and Nano-Bionics, Chinese Academy of Sciences, Suzhou 215123, China. E-mail: jjiang2010@sinano.ac.cn
bSchool of Nano-Tech and Nano-Bionics, University of Science and Technology of China, Hefei 230026, China
First published on 7th July 2023
Abstract
Replacing water oxidation by the thermodynamically more favorable glycerol oxidation reaction in a photoelectrochemical (PEC) cell is highly desirable, which can not only improve the energy efficiency of hydrogen evolution, but also produce value-added chemicals, given that glycerol is easily accessible as a major byproduct from the biodiesel industry. Herein, a BiVO4/CoV-LDHs/Ag photoanode has been fabricated via a simple electrodeposition and redox strategy, which exhibits excellent PEC activity toward glycerol oxidation. A high photocurrent density of 7.15 mA cm−2 can be achieved at 1.23 V vs. reversible hydrogen electrode, in 0.5 M Na2SO4 solution with 0.1 M glycerol under AM 1.5G illumination, which is 2.7 times that of the pristine BiVO4 photoanode. The significantly enhanced PEC performance can be attributed to the narrowed optical band gap, and improved charge separation and injection efficiencies after surface deposition of CoV-LDHs/Ag on the BiVO4 photoanode. As a result, greatly improved hydrogen production efficiency has been achieved by coupling the photo-electrochemical glycerol oxidation on the BiVO4/CoV-LDHs/Ag photoanode, with the evolved hydrogen gas (123.5 mmol m−2 h−1) nearly double that when using the pristine BiVO4 photoanode.
Introduction
Photoelectrochemical (PEC) water splitting for hydrogen production has emerged in recent years as a promising strategy to store intermittent solar energy as chemical energy.1,2 However, efficient hydrogen production via water splitting is hindered by the kinetically sluggish oxygen evolution reaction (OER) at the photoanode. Therefore, it is highly desirable to replace the OER with thermodynamically more favourable anodic reactions (such as the oxidation of small organic molecules) for enhanced PEC hydrogen generation along with high value-added chemicals generation, which is not only beneficial for the more efficient production of hydrogen, but also significant for the upgrading of biomass resources.3 Glycerol, a by-product of the biodiesel industry, has been paid attention as a promising low-cost resource (∼0.11 USD kg−1 of crude glycerol) to produce high value-added chemicals (e.g. ∼110 USD kg−1 of formic acid and ∼150 USD kg−1 of dihydroxyacetone) through PEC routes,4–11 which is also thermodynamically significantly more favourable than the water oxidation reaction.Commonly used semiconductors working as photoanodes in a PEC electrolyser include TiO2,5 WO3,12 α-Fe2O3,13,14 ZnO15 and BiVO4.4,16–19 Among them, BiVO4 (abbreviated as BVO thereafter) is considered to be one of the best photoanodes owing to its low cost, non-toxicity, chemical stability, and appropriate band-structure.20,21 However, the severe electron–hole recombination, low charge carrier mobility, and sluggish kinetics for the oxidation reaction on pristine BVO result in a considerably lower photocurrent density than its theoretical maximum value.
To overcome the above-mentioned inherent drawbacks of the pristine BVO photoanode, numerous strategies22–24 such as morphological tailoring,25,26 interface engineering,27,28 elemental doping,29–32 and surface modification33–37 have been proposed. In particular, surface modification of BVO with hole-storage and oxidation co-catalysts has been paid much attention as an effective approach to promote the PEC performance of the BVO photoanode, mainly attributed to the boosted surface oxidation dynamics and the provision of abundant active sites.38 Recent studies have shown that transition metal hydroxides (TMHs) can effectively promote the PEC performance of the BVO photoanode owing to their ultrathin 2D structure, adjustable chemical composition, and unique water oxidation catalytic activity.39–46 For instance, Yue et al. synthesized CoAl layered double metal hydroxides (CoAl-LDHs) and decorated them on porous BVO films by using a simple hydrothermal and plasma treatment strategy.45 The BVO/CoAl-LDHs photoanode provided a photocurrent of 3.5 mA cm−2 at 1.23 V, which was about 3.2 times that of the bare BVO photoanode. Noble metal nanocrystals supporting localized surface plasmon resonances, such as Au and Ag, can act as photo-sensitizers to improve visible to near-infrared light absorption,47–50 and promote efficient charge separation/transport through direct hot electron transfer or plasmon-induced resonant energy transfer.50–52 Yet, to date, utilizing both a plasmonic metal and TMH co-catalyst to enhance interfacial charge carrier dynamics and efficiency is still at an early stage.53–55
Herein, we describe the preparation of a semiconductor/TMH/metal (BVO/CoV-LDHs/Ag) photoanode via simple electrodeposition and redox reaction, which have shown excellent activity toward glycerol oxidation reaction. A high photocurrent density of 7.15 mA cm−2 can be achieved at 1.23 V vs. reversible hydrogen electrode (RHE), in 0.5 M Na2SO4 solution with 0.1 M glycerol under AM 1.5G illumination, which is 2.7 times that of the pristine BiVO4 photoanode. Surface deposition of CoV-LDHs/Ag on the BVO photoanode improves visible light utilization, as well as the charge separation and injection efficiencies. The applied bias photon-to-current efficiency of the BVO/CoV-LDHs/Ag photoanode reached a maximal value of 0.99% at 0.71 V, in contrast to only 0.12% at 1.00 V for pristine BVO. As a result, greatly improved hydrogen production efficiency has been achieved by coupling the photo-electrochemical glycerol oxidation on the BVO/CoV-LDHs/Ag photoanode as compared to that on the BVO photoanode.
Experimental
Materials
Cobalt nitrate hexahydrate (Co(NO3)2·6H2O,![[greater than or equal, slant]](https://www.rsc.org/images/entities/char_2a7e.gif) 98.5%), nickel(II) nitrate hexahydrate (Ni(NO3)2·6H2O, 98.0%), iron(III) nitrate hexahydrate (Fe(NO3)3·9H2O, 98.5%), copper(II) nitrate trihydrate (Cu(NO3)2·3H2O, 99.0–102.0%), ammonium metavanadate (NH4VO3, 99.0%), cobalt sulfate heptahydrate (CoSO4·7H2O, 99.0%), and nickel sulfate hexahydrate (NiSO4·6H2O, 98.0%), were purchased from Shanghai Aladdin Biochemical Technology Co. Ltd. Bismuth nitrate pentahydrate (Bi(NO3)3·5H2O, 99.0%), potassium iodide (KI, 99.0%), p-benzoquinone (C6H4O2, 98.0%), vanadyl acetylacetonate (VO(acac)2, 99.0%), vanadium(III) chloride (VCl3, 97%), copper sulfate pentahydrate (CuSO4·5H2O, 99.0%), iron(II) sulfate heptahydrate (FeSO4·7H2O, 99.0–101.0%), silver nitrate (AgNO3, 99.8%), ethanol (C2H6O, 99.7%), acetone (C3H6O, 99.5%), glycerol (C3H8O3, 99.0%), nitric acid (HNO3, 65.0–68.0%), and dimethyl sulfoxide (DMSO, 99.5%) were purchased from Sinopharm Chemical Reagent Co., Ltd. FTO coated glass (sheet resistance <15 Ohm sq−1, transmittance 83%) was obtained from Zhuhai Kaivo Optoelectronic Technology Co., Ltd. The deionized water was obtained from a Millipore system.
98.5%), nickel(II) nitrate hexahydrate (Ni(NO3)2·6H2O, 98.0%), iron(III) nitrate hexahydrate (Fe(NO3)3·9H2O, 98.5%), copper(II) nitrate trihydrate (Cu(NO3)2·3H2O, 99.0–102.0%), ammonium metavanadate (NH4VO3, 99.0%), cobalt sulfate heptahydrate (CoSO4·7H2O, 99.0%), and nickel sulfate hexahydrate (NiSO4·6H2O, 98.0%), were purchased from Shanghai Aladdin Biochemical Technology Co. Ltd. Bismuth nitrate pentahydrate (Bi(NO3)3·5H2O, 99.0%), potassium iodide (KI, 99.0%), p-benzoquinone (C6H4O2, 98.0%), vanadyl acetylacetonate (VO(acac)2, 99.0%), vanadium(III) chloride (VCl3, 97%), copper sulfate pentahydrate (CuSO4·5H2O, 99.0%), iron(II) sulfate heptahydrate (FeSO4·7H2O, 99.0–101.0%), silver nitrate (AgNO3, 99.8%), ethanol (C2H6O, 99.7%), acetone (C3H6O, 99.5%), glycerol (C3H8O3, 99.0%), nitric acid (HNO3, 65.0–68.0%), and dimethyl sulfoxide (DMSO, 99.5%) were purchased from Sinopharm Chemical Reagent Co., Ltd. FTO coated glass (sheet resistance <15 Ohm sq−1, transmittance 83%) was obtained from Zhuhai Kaivo Optoelectronic Technology Co., Ltd. The deionized water was obtained from a Millipore system.
Preparation of the nanoporous BiVO4 electrode
The pristine nanoporous BVO photoanode was fabricated via electrodeposition and chemical conversion procedures according to the previously reported method.20 Firstly, BiOI nanoarrays were grown on FTO by the electrodeposition method. 1.66 g KI was dissolved in 25 mL of deionized water under magnetic stirring, with the pH value adjusted to 1.7 by adding 30 μL HNO3, and 0.485 g Bi(NO3)3·5H2O together with 20 mL of 0.23 M p-benzoquinone ethanol solution then added in. Subsequent cathodic electrodeposition was performed using a three-electrode system (−0.1 V vs. Ag/AgCl). After 5 min, the BiOI electrodes were taken out and rinsed thoroughly, followed by dropping 40 μL of DMSO solution (containing 0.4 M VO(acac)2) on each BiOI electrode surface, and then heating to 450 °C in a muffle furnace for 2 h (ramp rate 2 °C min−1). The as-obtained electrode was soaked in 1 M NaOH solution for 30 min to remove excess V2O5, and then the electrode was rinsed with deionized water and dried in air.Synthesis of powdery layered double hydroxides (LDHs)
Powdery Co-based and Ni-based LDHs were synthesized by hydrothermal reactions. Taking CoV-LDHs as an example, Co(NO3)2·6H2O (3 mmol), NH4VO3 (1 mmol), CO(NH2)2 (5 mmol), and NH4F (2 mmol) were dissolved in 50 mL of deionized water under magnetic stirring. The obtained brown solution was transferred into a 100 mL Teflon-lined stainless steel autoclave. After that, the autoclave was sealed and heated to 120 °C for 12 h. Then, the sample was centrifuged, washed with absolute ethanol, and dried in a vacuum oven at 60 °C for 12 h. Other LDHs were prepared similarly using the respective metal precursors (Ni(NO3)2·6H2O, Fe(NO3)3·9H2O, Cu(NO3)2·3H2O), keeping the starting molar ratio of Co(Ni)![[thin space (1/6-em)]](https://www.rsc.org/images/entities/char_2009.gif) :M at 3:1.
:M at 3:1.
Fabrication of the BVO/LDHs photoanode
Drop-casting and electrodeposition methods were both used to synthesize the BVO/LDHs photoanode.For the drop-coating process, a certain weight of hydrothermally synthesized LDHs (1 mg) was first dispersed into 500 μL of ethanol by sonication. Then, 50 μL of the dispersed solution was drop-cast onto the surface of the BVO photoanode and dried naturally. The drop-casting and drying procedure was repeated until all of the dispersed solution was used.
For the electrodeposition procedure, amorphous CoM-LDHs (M = V, Ni, Cu, Fe) were deposited onto the surface of the BVO electrode by electrodeposition. Taking CoV-LDHs as an example, an aqueous solution of dissolved sulfates CoSO4·7H2O, and NH4VO3 (total metal ion concentration 0.2 M) and benzoquinone (20 mM) was used as the electrolyte. The LDH was deposited at 0.7 V vs. Ag/AgCl for 300 s with a Co:V molar ratio of 3:1, 5:1, or 10:1. Other amorphous CoM-LDHs were prepared similarly using the respective metal sulfate precursors (NiSO4·6H2O, CuSO4·5H2O, and FeSO4·7H2O).
Preparation of the BVO/CoV-LDHs/Ag photoanode
The BVO/CoV-LDHs/Ag photoanode was obtained by a spontaneous redox reaction method. Typically, the BVO/CoV-LDHs photoanode was immersed in 20 mL of AgNO3 (15 mM) solution for a certain period of time, followed by washing with copious deionized water and drying naturally.Material characterizations
The crystalline structure was identified by X-ray diffraction (XRD, Bruker D8 advance, 40 kV and 40 mA). The morphology and microstructure of the photoanodes were examined by scanning electron microscopy (SEM, JEOL JSM-7500F, 10 kV). Transmission electron microscopy (TEM) and high-resolution TEM (HRTEM) images were acquired using a FEI Tecnai G2 F20 S-Twin (200 kV). The UV-vis diffuse reflectance spectra were obtained by a UV-3600Plus (Shimadzu) spectrometer.Photoelectrochemical measurements
Photoelectrochemical measurements (PEC) of all electrodes were conducted on a CHI 760E electrochemical workstation (Shanghai Chenhua Instrument Co., Ltd) in a three-electrode configuration, using Hg/HgO (1 M KOH) as the reference electrode, a platinum plate (1 cm × 1 cm) as the counter electrode, and BVO-based photoanodes as the working electrode. The light source (300 W Xenon lamp, Beijing PerfectLight Technology Co. Ltd, PLS-SXE300D) equipped with an AM 1.5G filter was chosen as simulated solar illumination (with power density adjusted to 100 mW cm−2). The total illuminated area of the working electrode was 1 cm2 (1 cm × 1 cm). The applied potential was adjusted to reversible hydrogen electrode (RHE) according to the Nernst equation: E(RHE) = E(Hg/HgO) + 0.059 × pH + 0.098. Electrochemical impedance spectroscopy (EIS) was performed at 0.1 V (vs. RHE) with a small AC amplitude of 5 mV in the frequency range from 10 kHz to 0.01 Hz under AM 1.5G illumination.PEC measurements with Na2SO3 as the hole scavenger were recorded in 0.5 M Na2SO4 with the addition of 0.1 mol L−1 Na2SO3. The efficiency of charge injection (ηinj) was calculated by the following equation:
| ηinj = JH2O/JNa2SO3 × 100% | (1) |
The charge separation efficiency (ηsep) was calculated according to the following equation:
| ηsep = JNa2SO3/Jabs × 100% | (2) |
Applied bias photon-to-current efficiency (ABPE) was calculated using the following equation:
 | (3) |
Incident photon-to-current efficiency (IPCE) measurement was performed at 1.23 V vs. RHE using a 150 W tungsten halogen lamp (Osram 64610) equipped with a monochromator (Zolix, Omni-k300).
IPCE was then calculated using the following equation:
 | (4) |
Calculation of band gap energy and carrier density
The band gap energy of the catalyst was calculated from its UV-vis spectra by using the Tauc equation as below:| αhν = A(hν − Eg)n | (5) |
The formula for calculating carrier concentration is as follows:
| Nd = (2/qεε0) × [d(1/C2)/dV]−1 | (6) |
Product analysis
The products from glycerol oxidation reactions over different photoanodes were separated and quantitatively analyzed by high-performance liquid chromatography (HPLC, UltiMate 3000, Thermo Fisher Scientific). For each HPLC measurement, 500 μL of the electrolyte solution was sampled from the H-type cell and diluted to 1.5 mL with 0.5 M H2SO4, and then 20 μL of the diluted sample was directly injected into a ChromCore Sugar-10H column. 5 mM H2SO4 solution was used as the eluent with a constant flow rate of 0.5 mL min−1. For each oxidation product, calibration curves were obtained using a known concentration of the individual standard sample solutions, which were provided in our previous report.56,57Calculations of the Faradaic efficiency (FE) of glycerol oxidation are based on the following balanced half-reactions, corresponding to the conversion of glycerol into individual products in the electrolyte:
| C3H8O3 (glycerol) + 2 OH− → C3H6O3 (glyceraldehyde) + 2 H2O + 2 e− | (7) |
| C3H8O3 (glycerol) + 2 OH− → C3H6O3 (dihydroxyacetone) + 2 H2O + 2 e− | (8) |
| C3H8O3 (glycerol) + 13/2 OH− → 3/2 C2H3O3− (glycolate) + 5 H2O + 5 e− | (9) |
| C3H8O3 (glycerol) + 14 OH− → 3/2 C2O42− (oxalate) + 11 H2O + 11 e− | (10) |
| C3H8O3 (glycerol) + 11 OH− → 3 HCOO− (formate) + 8 H2O + 8 e− | (11) |
The overall FE toward all products is calculated based on the following equation:
| FEproduct = (eproduct × Cproduct × V × F)/Qtotal ×100% | (12) |
485 C mol−1), and Qtotal is the total charge (C) passed during the electrolysis reaction.
Results and discussion
The electrodeposited BiOI nanostructures on the FTO substrate appeared to be closely arranged thin nanoflakes with lateral dimension over μm in size, as shown in their SEM image (Fig. S1a, ESI†). The X-ray diffraction peaks (Fig. S1b, ESI†) that appeared at 29.6°, 31.7°, 45.4°, 51.3°, and 55.2° correspond to the (102), (110), (200), (114), and (212) crystal planes of BiOI (JCPDS 10-0445), respectively, suggesting the successful formation of tetragonal phase BiOI. After reacting with vanadyl acetylacetonate at elevated temperature, the BiOI nanoflakes were converted to porous BVO nanostructures. When imaged under SEM, as shown in Fig. S2a and b (ESI†), the BVO nanostructures were composed of stacked worm-like BVO grains. From the side-view SEM image shown in Fig. S2c (ESI†), the BVO film thickness was determined to be around 1 μm. To confirm the successful synthesis of BVO, the XRD pattern was acquired from the pristine BVO photoanode (shown in Fig. S2d, ESI†), which displayed diffraction peaks at 28.9°, 30.5°, 34.5°, and 35.2°, corresponding to the (121), (040), (200), and (002) planes of monoclinic BiVO4 (JCPDS 14-0688), respectively.Next, for comparative purposes, the BVO/LDHs photoanode was prepared by a simple drop-casting method using hydrothermally synthesized powdery Ni-based and Co-based LDHs, so that their PEC performances can be easily screened. XRD patterns for the synthesized Co-based and Ni-based LDHs were displayed in Fig. S3 (ESI†), showing mainly Co(OH)2 and Ni(OH)2 diffractions, in accordance with our previous study.58 By dispersing the powdery LDHs into solution form, drop-casting the solution onto the surface of the BVO photoanodes, and letting them be dried naturally, BVO/LDHs photoanodes with well-defined co-catalyst loading amounts were prepared. Taking the BVO/Co(OH)2 photoanode as an example, the morphology of the as-prepared sample photoanode was characterized by SEM, as shown in Fig. S4 (ESI†), with the large flower-like Co(OH)2 dispersed on the BVO surface. To evaluate the PEC performances of the various BVO/LDHs photoanodes toward glycerol oxidation, linear sweep voltammetry (LSV) under AM 1.5G illumination (100 mW cm−2) was conducted in a three-electrode configuration, in 0.5 M Na2SO4 solution with 0.1 M glycerol. The PEC performances of the pristine BVO and BVO/TMH photoanodes were also examined under the same experimental conditions, which served as the control samples. As shown in Fig. S5a (ESI†), the BVO/CoNi-LDH and BVO/CoV-LDH exhibited enhanced photoelectrical currents, compared to that of BVO, while BVO/CoCu-LDH and BVO/CoFe-LDH displayed decreased photoelectrical currents. Similarly, BVO/NiV-LDH also exhibited the best PEC performance among the various Ni-based LDH co-catalyst modified BVO photoanodes (Fig. S5b, ESI†). The respective current densities at 1.23 V for various BVO/LDHs photoanodes were extracted from the polarization curves and summarized in Fig. S5c and d (ESI†). The results showed that the BVO/CoV-LDHs photoanode exhibits the best PEC performance, with a 27% increase in the photoelectrical current density compared to that of pristine BVO.
After establishing that the CoV-LDHs were the better ones among the various tested LDH co-catalysts, the electrodeposition method was then adopted to modify the BVO photoanodes with CoV-LDHs, which can induce a thin coating with improved mechanical adhesion and minimized interfacial resistance. As shown in Fig. S6a (ESI†), the SEM image revealed that the BVO photoanode was homogeneously wrapped by ultrathin CoV-LDHs nanosheets with smooth surfaces. The XRD pattern of the BVO/CoV-LDHs photoanode (Fig. S6b, ESI†) displayed all the characteristic diffraction peaks corresponding to the BVO and FTO substrate, with no characteristic peaks from CoV-LDHs detected, suggesting that the electrodeposited CoV-LDHs were likely amorphous, consistent with other literature reports describing the formation of amorphous LDHs on the BVO electrode.40 For comparison purposes, other Co-based TMH and LDHs were prepared similarly via the electrodeposition method, including Co(OH)2, CoNi-LDHs, CoFe-LDHs, and CoCu-LDHs. The polarization curves showed a similar trend, with CoV-LDHs as the best co-catalyst on BVO (Fig. S7, ESI†), showing a similar activity trend to those BVO/CoM-LDHs photoanodes prepared by the drop-casting method using crystalline LDHs (Fig. S5a, ESI†). Moreover, the influence of relative Co and V contents in CoV-LDHs was also evaluated by varying the starting Co:V molar ratios during the electrodeposition step. Fig. S8 (ESI†) shows that Co:V = 10:1 displayed a prominently larger photocurrent density, as compared to those made with starting feeding ratios of 5:1 and 3:1. Therefore, CoV-LDHs prepared with a Co:V feeding molar ratio of 10:1 were used for our subsequent studies.
Given that the redox potential of Ag+/Ag (Ag+ + e− → Ag, E = 0.80 V) is higher than that of Co(OH)3/Co(OH)2 (Co(OH)3 + e− → Co(OH)2 + OH−, E = 0.17 V), Co(OH)2 can be used to reduce Ag+ directly. Therefore, Ag nanoparticles (NPs) were formed and deposited on the BVO/CoV-LDHs electrode surface via a spontaneous redox reaction between Ag+ and CoV-LDHs (schematically shown in Fig. 1(a)). The micro-nanostructures of the synthesized BVO/CoV-LDHs/Ag photoanode were then examined under electron microscopes. The SEM image of the BVO/CoV-LDHs/Ag photoanode (Fig. 1(b)) shows that the ultrathin CoV-LDHs maintained their structures after Ag NP deposition. However, the original smooth surface texture became rougher, owing to the redox chemical reaction occurring on the ultrathin CoV-LDHs, and the formation of small Ag NPs. Ag NP formation was further revealed by high-resolution TEM (HRTEM) analysis, with the clearly measured lattice spacings of 0.475 nm and 0.236 nm assigned to the (101) and (111) planes of BVO and Ag, respectively (Fig. 1(c)). In addition, the HAADF-STEM image shows that Ag NPs were evenly distributed on the BVO/CoV-LDHs surface (Fig. 1(d)), and the elemental mapping images clearly reveal the homogeneous distribution of Bi, surrounded by V, O, Co, and Ag elements along the edges (Fig. 1(d)), confirming the uniform dispersion of CoV-LDHs and Ag over the BVO surface. Moreover, the line-scan profiles of the nanocomposite also show the respective spatial distributions of Bi, V, O, Co, and Ag elements (Fig. S9, ESI†), corroborating the structure of the formed BVO/CoV-LDHs/Ag nanocomposite. The XRD pattern of BVO/CoV-LDHs/Ag was similar to that of BVO (Fig. S10, ESI†), with no clear diffraction peaks from Ag observed, likely due to the masking effect of the strong diffractions from the BVO crystals, and the relatively low Ag loading.
 | ||
| Fig. 1 (a) Schematics of the fabrication process in making the BVO/CoV-LDHs and BVO/CoV-LDHs/Ag photoanode. (b) SEM and (c) HRTEM images of the BVO/CoV-LDHs/Ag photoanode. (d) HAADF-STEM image and the corresponding EDX mapping images for Bi, O, V, Co, and Ag elements in BVO/CoV-LDHs/Ag. | ||
With BVO/CoV-LDHs/Ag successfully obtained, its PEC activity was then investigated in a single-compartment cell using a standard three-electrode system under AM 1.5G (100 mW cm−2) illumination, in the presence of 0.1 M glycerol. Due to the poor carrier transport property of BVO, backlight illumination (from the FTO side) was adopted, which showed larger photocurrent densities than that of the front illumination configuration (Fig. S11, ESI†). Considering that the water oxidation reaction (OER) is the main competing reaction, the OER was also evaluated under the same conditions (with no glycerol added) for comparison.
LSV curves recorded from the BVO-based photoanodes in 0.5 M Na2SO4 aqueous solution, in the presence or absence of 0.1 M glycerol under light illumination, are shown in Fig. 2(a). As can be seen from the figure, the BVO/CoV-LDHs/Ag photoanode is highly active toward the glycerol oxidation reaction (GOR), reaching a geometric photocurrent density of 7.15 mA cm−2 at 1.23 V (vs. RHE, unless otherwise noted). In the absence of glycerol, BVO/CoV-LDHs/Ag can also be used for photoelectrochemical water oxidation, but the photocurrent density was lower in the entire potential range, reaching only 4.89 mA cm−2 at 1.23 V. The photocurrent density was found to follow the order of BVO < BVO/CoV-LDHs < BVO/CoV-LDHs/Ag, for both GOR and OER in the potential window from 0.3 to 1.25 V. In Fig. 2(b), the photocurrent densities of the BVO, BVO/CoV-LDHs, and BVO/CoV-LDHs/Ag photoanodes at 1.23 V for the GOR and OER were compared, illustrating the promotional role of CoV-LDHs/Ag deposition on BVO for enhancing its PEC performance, with a 43.6% increase in GOR current density on BVO/CoV-LDHs/Ag compared to that on BVO/CoV-LDHs. The LSV curves recorded in the dark (Fig. S12, ESI†) showed that BVO/CoV-LDHs/Ag can also improve the electrocatalytic performance of BVO and BVO/CoV-LDHs toward the GOR, with cathodic shift (80 mV) of the onset potential and larger current density. Different mass loading of Ag NPs can be achieved by varying the redox reaction time between Ag+ and CoV-LDHs, and the results displayed in Fig. S13 (ESI†) show that there was an optimal loading amount for achieving the best PEC performance. The photocurrent density first increased then decreased when the reaction time between the BVO/CoV-LDHs photoanode and AgNO3 solution was prolonged. LSV screening results show that the BVO/CoV-LDHs/Ag photoanode exhibited the largest photocurrent density when the BVO/CoV-LDHs photoanode was immersed in AgNO3 solution for 15 min, likely due to balanced loading and exposed active sites. When the immersion time was further extended to 25 min, the thus obtained BVO/CoV-LDHs/Ag photoanode performed even worse than that of BVO/CoV-LDHs. The optimal PEC performance reported herein for GOR on the BVO/CoV-LDHs/Ag photoanode surpasses that of many recently reported photoanodes, including WO3,12 Ta:BiVO4,59 Bi2O3/TiO2,5 and W:BiVO4–NiOx(OH)y.17 A more complete list of comparisons can be found in Table S1 in the ESI.†
 | ||
| Fig. 2 (a) LSV curves of different photoanodes measured in 0.5 M Na2SO4 solution with (solid lines) and without (dashed lines) 0.1 M glycerol under AM 1.5 G illumination (100 mW cm−2); scan rate 10 mV s−1. (b) Comparison of the photocurrent density at 1.23 V for different photoanodes under GOR and OER conditions. (c) Applied bias photon-to-current efficiency (ABPE) and (d) incident photon-to-current efficiency (IPCE) of the BVO, BVO/CoV-LDHs, and BVO/CoV-LDHs/Ag photoanode. | ||
Next, the photoelectric conversion capability of BVO/CoV-LDHs/Ag was quantitatively evaluated. The applied bias photon-to-current efficiency (ABPE) was first calculated from the LSV curves to quantitatively analyze the solar energy conversion efficiency under externally applied bias (Fig. 2(c)). The ABPE of the BVO/CoV-LDHs/Ag photoanode reached a maximal value of 0.99% at 0.71 V, which is higher than that of BVO/CoV-LDHs (0.54% at 0.80 V) and BVO (0.12% at 1.00 V). The external quantum efficiency was analyzed by calculating the incident photon-to-current efficiency (IPCE). As shown in Fig. 2(d), the IPCE of the pristine BVO photoanode was rather low (less than 20%). After surface modification with CoV-LDHs and CoV-LDHs/Ag co-catalysts, the IPCE values increased to 22.4% and 43.1% at 380 nm, respectively. The BVO/CoV-LDHs/Ag photoanode exhibits the highest IPCE values in the whole photon-responsive range, demonstrating significantly better solar energy conversion efficiency after CoV-LDHs and CoV-LDHs/Ag co-catalyst modification on the BVO photoanode.
To better understand the effect of Ag NPs on the BVO/CoV-LDHs photoanode, we compared the optical properties of the three photoanodes, by measuring their respective UV-vis diffuse reflectance spectra. As shown in Fig. 3(a), the electrodeposition of CoV-LDHs on BVO extended its optical absorption beyond 500 nm, and after loading Ag NPs, the sample of BVO/CoV-LDHs/Ag exhibited a strong and broad light absorption spectrum, likely due to the oxidized CoV-LDHs and coupled Ag NPs. The optical band gaps of the photoanodes can be obtained from the respective Tauc plots (Fig. 3(b)), which were calculated to be 2.28, 2.19, and 2.00 eV for BVO, BVO/CoV-LDHs, and BVO/CoV-LDHs/Ag, respectively. The apparently reduced optical band gap energy of BVO/CoV-LDHs/Ag would be beneficial for better utilization of the solar spectrum.
 | ||
| Fig. 3 (a) UV-vis diffuse reflectance spectra and (b) Tauc plot of different photoanodes. (c) The charge separation efficiency and (d) charge injection efficiency of different photoanodes. (e) Nyquist plots of EIS measurements and (f) Mott–Schottky plots of the BVO, BVO/CoV-LDHs, and BVO/CoV-LDHs/Ag photoanode. | ||
Apart from the optical band gap modification, the contributions of CoV-LDHs and CoV-LDHs/Ag toward charge separation efficiency (ηsep) and injection efficiency (ηinj) were also investigated, by adding a hole scavenger Na2SO3 into the electrolyte, which is approximated to be 100%. The LSV curves measured in Na2SO4 electrolyte with and without Na2SO3 are shown in Fig. S14 (ESI†), which were used for calculating ηsep and ηinj based on eqn (1) and (2). As shown in Fig. 3(c), the values of ηsep decreased in the order of BVO/CoV-LDHs/Ag > BVO/CoV-LDHs > BVO, revealing that Ag NPs are able to enhance the charge separation efficiency of BVO/CoV-LDHs in the entire applied bias window. Fig. 3(d) shows the calculated ηinj values, showing the same trend as ηsep on various photoanodes. ηinj was 68.3% for the BVO/CoV-LDHs/Ag photoanode at 1.23 V, higher than the values displayed on the BVO/CoV-LDHs and BVO samples at 44.2% and 31.8%, respectively. The above experimental results demonstrated that the surface modification with Ag NPs not only improved charge separation, but also facilitated hole injection, resulting in the observed significantly enhanced PEC performance. This could be due to the strong interface bonding between Ag and LDHs, as observed by Yan and Xiang et al.60 In addition, the kinetics of the charge transfer process at the photoanode/electrolyte interface was also evaluated by electrochemical impedance spectroscopy (EIS). Fig. 3(e) shows the Nyquist plots of the tested photoanodes, with data points from EIS measurements performed at 1.23 V, and the solid lines were the fitting results using the equivalent circuit model (Fig. 3(e) inset). The Rs, Rct and CPE in the equivalent circuit diagram represent solution internal resistance, charge transfer resistance and phase shifting element, respectively. The semicircle arc was related to the charge transfer kinetics at the photoanode/electrolyte interface, and the sizes of the arc increased in the order of BVO/CoV-LDHs/Ag < BVO/CoV-LDHs < BVO, indicating that the interfacial charge transfer was facilitated by the surface modification of the co-catalysts. More specifically, the Rct of BVO/CoV-LDHs/Ag is only 115 Ω, which is significantly lower than that of BVO/CoV-LDHs (371 Ω) and BVO (2472 Ω), indicating that the charge transfer process on the BVO/CoV-LDHs/Ag photoanode was much faster. Furthermore, Mott–Schottky analysis was implemented to assess the concentration of charge carrier density (Nd). The Nd of the BVO photoanode was calculated to be 3.72 × 1019 cm−3 from the slope of the straight line (using eqn (6)) in the Mott–Schottky plots, as shown in Fig. 3(f), which increased slightly to 5.49 × 10¹⁹ and 6.67 × 1019 cm−3 respectively, after BVO photoanodes were modified by CoV-LDHs and CoV-LDHs/Ag. Taken together, the above electrical and photoelectrical characterization results revealed that surface deposition of CoV-LDHs/Ag on the BVO photoanode enhanced the solar energy conversion efficiency by narrowing the apparent optical band gap, and improved charge separation and injection by accelerating the charge transfer kinetics at the photoanode/electrolyte interface.
Finally, the PEC performance for the BVO/CoV-LDHs/Ag photoanode toward selective glycerol oxidation was evaluated, by conducting the chronoamperometry tests of the three photoanodes at a constant potential of 0.8 V. The solution oxidation products were then collected and quantitatively analyzed using HPLC, when the reaction time reached 2, 4, and 6 h. The representative HPLC chromatogram of the collected solution products after PEC glycerol oxidation on the BVO/CoV-LDHs/Ag photoanode is shown in Fig. S15 (ESI†). Five liquid oxidation products can be identified in the chromatogram, with elution peaks appearing at retention times of 10.4, 13.7, 14.4, 15.4, and 16.0 min, which correspond to oxalic acid (OA), glyceraldehyde (GLAD), glycolic acid (GA), dihydroxyacetone (DHA), and formic acid (FA), respectively. By creating a calibration curve for each oxidation product using the respective pure chemicals with a series of concentrations, the yield and Faradaic efficiency for all the detected solution oxidation products can be calculated. As shown in Fig. S16 (ESI†), at the applied potential of 0.8 V, DHA, OA, and FA were found to be the main products for PEC driven glycerol oxidation on the three photoanodes. During the first 2 h of the reaction, OA was the main oxidation product, displaying the highest yield among all of the main products, regardless of the type of photoanode used. Upon prolonging the duration of photo-electrocatalysis, the yield of OA decreased, while the yield of FA and DHA increased gradually. The calculated Faradaic efficiency of the detected solution oxidation products on the BVO/CoV-LDHs and BVO/CoV-LDHs/Ag photoanode was 88.7% and 81.4% after 2 h of photo-electrocatalysis at 0.8 V (Fig. 4), which decreased to ∼60% after 6 h of photo-electrocatalysis. The reason behind the similar Faradaic efficiencies after CoV-LDHs/Ag co-catalyst loading is not clear yet. When prolonging the photoelectrolysis duration, the Faradaic efficiencies for individual solution oxidation products remained nearly constant, except for OA, suggesting potential over-oxidation of OA to CO2. To rule out the possible contribution of the OER to the lost Faradaic efficiency, the gaseous products were collected and analyzed using gas chromatography, where no O2 had been detected, implying that the extent of oxygen evolution was minimal under current experimental conditions. Considering the detected solution oxidation products and their temporal evolutions, we propose the possible photo-electrocatalytic oxidation pathway of glycerol, as shown in Fig. S17 (ESI†). DHA and GLAD were first formed via 2- and terminal hydroxyl group oxidation of glycerol, and GLAD can be oxidized to GA and FA upon C–C bond breakage. The thus formed GA can be further oxidized to OA, or to FA and CO2, while OA can be mineralized to CO2 eventually. The yield of various oxidation products on the BVO/CoV-LDHs/Ag photoanode at different applied potentials was also quantified at 0.8 V, 1.0 V, and 1.2 V over 4 h photo-electrocatalysis. As shown in Fig. S18 (ESI†), the yield of FA increased from 11.1 μmol at 0.8 V to 18.1 μmol (1.0 V) and then increased to 21.6 μmol at 1.2 V. DHA increased from 8.6 μmol at 0.8 V to 15.7 μmol and then increased to 16.5 μmol at 1.2 V. On the other hand, the yield of OA decreased upon increasing the externally applied potential, similar to the trend observed under extended photo-electrocatalytic duration at fixed potentials (Fig. S16, ESI†). The above experimental results indicated that glycerol was quickly oxidized to OA, which can be mineralized completely to CO2 upon accumulation on the BVO photoanodes under current experimental settings. However, the reason behind the relative ease of OA mineralization compared to other solution species is not yet clear. The stability of the BVO/CoV-LDHs/Ag photoanode was evaluated by chronoamperometry with a constant applied potential (Fig. S19, ESI†), which remained rather stable after a 10 h continuous test.
 | ||
| Fig. 4 The Faradaic efficiencies toward various oxidation products in 0.5 M Na2SO4 solution with the presence of 0.1 M glycerol at 0.8 V vs. RHE, and the gray area depicts the oxidation products not in the solution, likely CO2. | ||
In addition, we performed a quantitative analysis of the hydrogen generated by the three different photoanodes during the PEC reaction in an H-cell configuration (Fig. 5, left and right axis displaying H2 evolution and Faradaic efficiency, respectively). After 4 h, the actual yields of H2 on the BVO, BVO/CoV-LDHs, and BVO/CoV-LDHs/Ag photoanodes were 24.8, 25.4, and 49.4 μmol, respectively. The calculated Faradaic efficiencies are all above 95%, indicating efficient usage of photogenerated electrons for hydrogen evolution reaction.
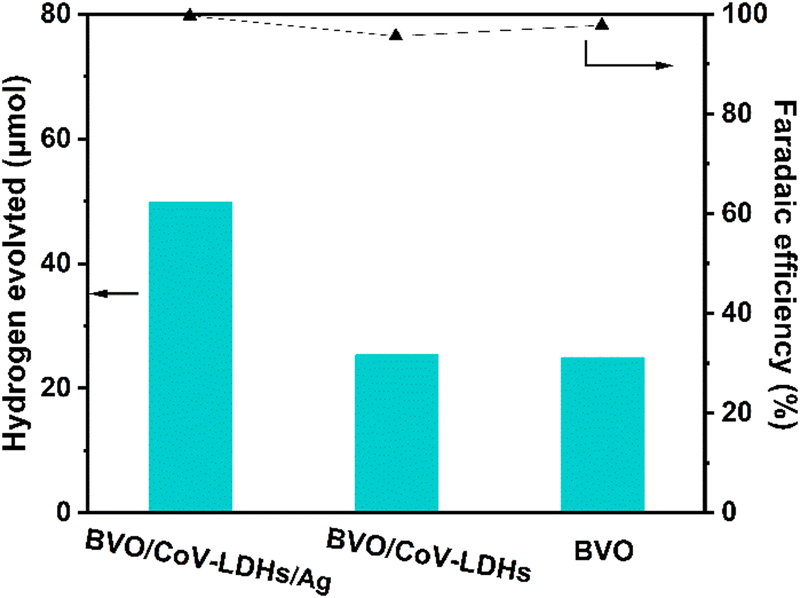 | ||
| Fig. 5 Measured hydrogen gas and the Faradaic efficiencies of hydrogen evolution on various photoanodes at 1.2 V under AM 1.5 G illumination; the electrolyte was 0.5 M Na2SO4 solution with 0.1 M glycerol. | ||
Conclusions
In summary, we have successfully synthesized a BVO/CoV-LDHs/Ag photoanode via an electrodeposition and redox strategy. The as-synthesized BVO/CoV-LDHs/Ag photoanode has shown outstanding activity in catalyzing glycerol oxidation in a PEC electrolyzer, achieving a high photocurrent density of 7.15 mA cm−2 at 1.23 V vs. RHE, in 0.5 M Na2SO4 solution with 0.1 M glycerol under AM 1.5G illumination. Through systematic investigation using electrochemical and photoelectrochemical characterizations, we have unveiled that surface deposition of CoV-LDHs/Ag on the BVO photoanode can enhance the solar energy conversion efficiency by narrowing the apparent optical band gap, and improve charge separation and injection by accelerating the charge transfer kinetics at the photoanode/electrolyte interface. By coupling the photo-electrochemical glycerol oxidation with hydrogen evolution reactions, greatly improved energy-efficient hydrogen production has been achieved when using BVO/CoV-LDHs/Ag as the photoanode, with the evolved hydrogen gas (123.5 mmol m−2 h−1) nearly double that using pristine BVO as the photoanode. This work may provide guidance for future endeavours in designing efficient photoanodes for biomass oxidations and PEC cells for better solar energy utilization and conversion.Conflicts of interest
There are no conflicts to declare.Acknowledgements
This work was funded by Jiangsu Provincial Double-innovation Doctor Program (no. JSSCBS20211432). We thank Dr Jin Fang at SINANO for helping with the IPCE measurements.Notes and references
- J. H. Kim, D. Hansora, P. Sharma, J. W. Jang and J. S. Lee, Chem. Soc. Rev., 2019, 48, 1908–1971 RSC.
- M. A. Gaikwad, U. P. Suryawanshi, U. V. Ghorpade, J. S. Jang, M. P. Suryawanshi and J. H. Kim, Small, 2022, 18, 2105084 CrossRef CAS PubMed.
- X. Lu, S. Xie, H. Yang, Y. Tong and H. Ji, Chem. Soc. Rev., 2014, 43, 7581–7593 RSC.
- D. Liu, J. C. Liu, W. Cai, J. Ma, H. B. Yang, H. Xiao, J. Li, Y. Xiong, Y. Huang and B. Liu, Nat. Commun., 2019, 10, 1779 CrossRef.
- L. Luo, W. Chen, S. M. Xu, J. Yang, M. Li, H. Zhou, M. Xu, M. Shao, X. Kong, Z. Li and H. Duan, J. Am. Chem. Soc., 2022, 144, 7720–7730 CrossRef CAS.
- Y. Han, M. Chang, Z. Zhao, F. Niu, Z. Zhang, Z. Sun, L. Zhang and K. Hu, ACS Appl. Mater. Interfaces, 2023, 15, 11678–11690 CrossRef CAS.
- Y. Liu, M. Wang, B. Zhang, D. Yan and X. Xiang, ACS Catal., 2022, 12, 6946–6957 CrossRef CAS.
- C. Lin, C. Dong, S. Kim, Y. Lu, Y. Wang, Z. Yu, Y. Gu, Z. Gu, D. K. Lee, K. Zhang and J. H. Park, Adv. Mater., 2023, 35, 2209955 CrossRef CAS.
- Z. Gu, X. An, R. Liu, L. Xiong, J. Tang, C. Hu, H. Liu and J. Qu, Appl. Catal., B, 2021, 282, 119541 CrossRef CAS.
- Y. Sun, G. Han, L. Du, C. Du, X. Zhou, Q. Sun, Y. Gao, G. Yin, Y. Li and Y. Wang, Chem. Catal., 2021, 1, 1260–1272 CrossRef CAS.
- Q. Wang, X. Ma, P. Wu, B. Li, L. Zhang and J. Shi, Nano Energy, 2021, 89, 106326 CrossRef CAS.
- J. Yu, J. González-Cobos, F. Dappozze, F. J. López-Tenllado, J. Hidalgo-Carrillo, A. Marinas, P. Vernoux, A. Caravaca and C. Guillard, Appl. Catal., B, 2022, 318, 121843 CrossRef CAS.
- N. Perini, C. Hessel, J. L. Bott-Neto, C. T. G. V. M. T. Pires, P. S. Fernandez and E. Sitta, J. Solid State Electrochem., 2021, 25, 1101–1110 CrossRef CAS.
- R.-T. Gao, J. Zhang, T. Nakajima, J. He, X. Liu, X. Zhang, L. Wang and L. Wu, Nat. Commun., 2023, 14, 2640–2652 CrossRef CAS PubMed.
- Y. Lee, S. Kim, S. Y. Jeong, S. Seo, C. Kim, H. Yoon, H. W. Jang and S. Lee, Catal. Today, 2021, 359, 43–49 CrossRef CAS.
- L.-W. Huang, T.-G. Vo and C.-Y. Chiang, Electrochim. Acta, 2019, 322, 134725 CrossRef CAS.
- Y.-H. Wu, D. A. Kuznetsov, N. C. Pflug, A. Fedorov and C. R. Müller, J. Mater. Chem. A, 2021, 9, 6252–6260 RSC.
- T.-G. Vo, C.-C. Kao, J.-L. Kuo, C.-C. Chiu and C.-Y. Chiang, Appl. Catal., B, 2020, 278, 119303 CrossRef CAS.
- R.-T. Gao, N. T. Nguyen, T. Nakajima, J. He, X. Liu, X. Zhang, L. Wang and L. Wu, Sci. Adv., 2023, 9, eade4589 CrossRef PubMed.
- T. W. Kim and K.-S. Choi, Science, 2014, 343, 990–994 CrossRef CAS PubMed.
- Y. Park, K. J. McDonald and K. S. Choi, Chem. Soc. Rev., 2013, 42, 2321–2337 RSC.
- J. H. Kim and J. S. Lee, Adv. Mater., 2019, 31, 1806938 CrossRef PubMed.
- P. Luan and J. Zhang, ChemElectroChem, 2019, 6, 3227–3243 CrossRef CAS.
- P. Mane, I. V. Bagal, H. Bae, A. N. Kadam, V. Burungale, J. Heo, S.-W. Ryu and J.-S. Ha, Int. J. Hydrogen Energy, 2022, 47, 39796–39828 CrossRef CAS.
- M. Huang, C. Li, L. Zhang, Q. Chen, Z. Zhen, Z. Li and H. Zhu, Adv. Energy Mater., 2018, 8, 1802198 CrossRef.
- H. Wu, R. Irani, K. Zhang, L. Jing, H. Dai, H. Y. Chung, F. F. Abdi and Y. H. Ng, ACS Energy Lett., 2021, 6, 3400–3407 CrossRef CAS.
- F. Niu, Q. Zhou, Y. Han, R. Liu, Z. Zhao, Z. Zhang and K. Hu, ACS Catal., 2022, 12, 10028–10038 CrossRef CAS.
- Y. Lu, Y. Yang, X. Fan, Y. Li, D. Zhou, B. Cai, L. Wang, K. Fan and K. Zhang, Adv. Mater., 2021, 34, 2108178 CrossRef.
- J.-S. Ma, L.-Y. Lin and Y.-S. Chen, Int. J. Hydrogen Energy, 2019, 44, 7905–7914 CrossRef CAS.
- K. Song, F. He, E. Zhou, L. Wang, H. Hou and W. Yang, J. Electroanal. Chem., 2022, 68, 49–59 CAS.
- Y. J. Jeong, D. H. Seo, J. H. Baek, M. J. Kang, B. N. Kim, S. k Kim, X. Zheng and I. S. Cho, Adv. Funct. Mater., 2022, 32, 2208196 CrossRef CAS.
- D. K. Bora, M. Nadjafi, A. Armutlulu, D. Hosseini, P. Castro-Fernandez and R. Toth, Energy Adv., 2022, 1, 715–728 RSC.
- S. Ren, M. Sun, X. Guo, X. Liu, X. Zhang and L. Wang, ACS Catal., 2022, 12, 1686–1696 CrossRef CAS.
- R. T. Gao, D. He, L. Wu, K. Hu, X. Liu, Y. Su and L. Wang, Angew. Chem., Int. Ed., 2020, 59, 6213–6218 CrossRef CAS PubMed.
- R. T. Gao and L. Wang, Angew. Chem., Int. Ed., 2020, 59, 23094–23099 CrossRef CAS.
- L. Luo, Z.-j Wang, X. Xiang, D. Yan and J. Ye, ACS Catal., 2020, 10, 4906–4913 CrossRef CAS.
- Y. Tang, R. Wang, Y. Yang, D. Yan and X. Xiang, ACS Appl. Mater. Interfaces, 2016, 8, 19446–19455 CrossRef CAS.
- Z. F. Huang, L. Pan, J. J. Zou, X. Zhang and L. Wang, Nanoscale, 2014, 6, 14044–14063 RSC.
- B. Zhang, L. Wang, Y. Zhang, Y. Ding and Y. Bi, Angew. Chem., Int. Ed., 2018, 57, 2248–2252 CrossRef CAS PubMed.
- B. Zhang, X. Huang, H. Hu, L. Chou and Y. Bi, J. Mater. Chem. A, 2019, 7, 4415–4419 RSC.
- T. K. Sahu, S. Alam, D. Gogoi, N. R. Peela and M. Qureshi, ACS Appl. Energy Mater., 2020, 3, 5610–5619 CrossRef CAS.
- X. Ning, P. Du, Z. Han, J. Chen and X. Lu, Angew. Chem., Int. Ed., 2021, 60, 3504–3509 CrossRef CAS PubMed.
- T.-G. Vo, K.-F. Chang and C.-Y. Chiang, J. Catal., 2020, 391, 336–345 CrossRef CAS.
- Q. Meng, B. Zhang, H. Yang, C. Liu, Y. Li, A. Kravchenko, X. Sheng, L. Fan, F. Li and L. Sun, Mater. Adv., 2021, 2, 4323–4332 RSC.
- P. Yue, H. She, L. Zhang, B. Niu, R. Lian, J. Huang, L. Wang and Q. Wang, Appl. Catal., B, 2021, 286, 119875 CrossRef CAS.
- Y. Li, L. Zhang, X. Xiang, D. Yan and F. Li, J. Mater. Chem. A, 2014, 2, 13250–13258 RSC.
- F. F. Abdi, A. Dabirian, B. Dam and R. van de Krol, Phys. Chem. Chem. Phys., 2014, 16, 15272–15277 RSC.
- G. Tang, H. Li and C. Cheng, Nanotechnology, 2019, 30, 445402 CrossRef CAS PubMed.
- A. Tavazohi, H. Abdizadeh and M. R. Golobostanfard, Int. J. Hydrogen Energy, 2022, 47, 18992–19004 CrossRef CAS.
- S. Caliskan, J. K. Kim, G. S. Han, F. Qin, I. S. Cho, H. S. Han and J.-K. Lee, ACS Appl. Energy Mater., 2020, 3, 11886–11892 CrossRef CAS.
- J. K. Kim, X. Shi, M. J. Jeong, J. Park, H. S. Han, S. H. Kim, Y. Guo, T. F. Heinz, S. Fan, C.-L. Lee, J. H. Park and X. Zheng, Adv. Energy Mater., 2018, 8, 1701765 CrossRef.
- M. G. Lee, C. W. Moon, H. Park, W. Sohn, S. B. Kang, S. Lee, K. J. Choi and H. W. Jang, Small, 2017, 13, 1701644 CrossRef PubMed.
- R. Wang, L. Luo, X. Zhu, Y. Yan, B. Zhang, X. Xiang and J. He, ACS Appl. Energy Mater., 2018, 1, 3577–3586 CrossRef CAS.
- X. Gu, J. Zhang, L. Hou, X. Fu, X. Yu, Y. Zhu and Y. Zhang, Surf. Interfaces, 2021, 25, 101224 CrossRef CAS.
- X. Ning, D. Yin, Y. Fan, Q. Zhang, P. Du, D. Zhang, J. Chen and X. Lu, Adv. Energy Mater., 2021, 11, 2100405 CrossRef CAS.
- X. Huang, Y. Zou and J. Jiang, ACS Sustainable Chem. Eng., 2021, 9, 14470–14479 CrossRef CAS.
- Z. Xie, K. Wang, Y. Zou, G. Ying and J. Jiang, Energy Adv., 2023, 2, 161–169 RSC.
- Z. Z. Xie, W. G. Wang, D. Ding, Y. Zou, Y. Cui, L. Xu and J. Jiang, J. Mater. Chem. A, 2020, 8, 12169–12176 RSC.
- H. Tateno, S.-Y. Chen, Y. Miseki, T. Nakajima, T. Mochizuki and K. Sayama, ACS Sustainable Chem. Eng., 2022, 10, 7586–7594 CrossRef CAS.
- T. Zhang, H. Shang, B. Zhang, D. Yan and X. Xiang, ACS Appl. Mater. Interfaces, 2021, 13, 16536–16544 CrossRef CAS.
Footnote |
| † Electronic supplementary information (ESI) available: Additional figures and tables. See DOI: https://doi.org/10.1039/d3ya00215b |
| This journal is © The Royal Society of Chemistry 2023 |