
 Open Access Article
 This Open Access Article is licensed under a
 Creative Commons Attribution 3.0 Unported Licence
Two-dimensional Ti3C2Tx MXene nanosheets for CO2 electroreduction in aqueous electrolytes†
Sarathkumar
Krishnan‡
 ,
Senthilkumaran
Marimuthu‡
,
Mayank K.
Singh
and
Dhirendra K.
Rai
*
,
Senthilkumaran
Marimuthu‡
,
Mayank K.
Singh
and
Dhirendra K.
Rai
*
Sustainable Energy & Environmental Materials (SEEM) Lab, Department of Metallurgical Engineering and Materials Science (MEMS), Indian Institute of Technology Indore, Simrol, Indore 453552, India. E-mail: dkrai@iiti.ac.in; Tel: +91 731 660 3278
First published on 6th June 2023
Abstract
Electroreduction of carbon dioxide (CO2) to valuable synthons is a sustainable and viable technique to reduce the carbon footprint in the atmosphere. In this work, two-dimensional Ti3C2Tx nanosheets have been investigated for selective CO2 adsorption and its subsequent electroreduction to valuable products in an aqueous electrolyte medium. Various physical and electrochemical characterizations have been performed to ascertain the structural, morphological, and electrocatalytic characteristics of Ti3C2Tx. Ti3C2Tx nanosheets show a CO2 adsorption capacity of 0.16 mmol g−1 under ambient conditions and exhibit a maximum faradaic efficiency of 96% towards CO2 electroreduction to C1 and C2+ products, mainly CO (42.2%), methanol (23.6%), ethanol (20.1%), and acetone (10.1%). Besides, it also shows high catalytic stability for product formation for a tested period of 72 h. This report sheds new light on the design of titanium-based advanced catalysts for efficient CO2 conversion in a benign aqueous medium.
1. Introduction
In this era, energy production and transportation are mainly dependent on fossil fuels which increases the emission of greenhouse gases into the atmosphere. Particularly, carbon dioxide (CO2) is one of the primary greenhouse gases, increasing dramatically in the earth's atmosphere. Rising CO2 levels (>417 ppm, as per NOAA-Mauna Lab Observatory, 2022) adversely affect the earth's atmosphere.1,2 This mandates an urgent need to mitigate CO2 emissions in the atmosphere. Besides its antagonistic environmental impact, CO2 is also an abundant C1 source for several organic products. Therefore, efforts involving CO2 mitigation by transforming it into valuable products have currently drawn huge attention.3,4 With the aim of CO2 mitigation efforts, among the different methods reported earlier, electrochemical conversion of CO2 into value-added products (C1 and C2+ carbon products) is considered an efficient and viable route for the sustainable ecosystem due to its ambient operating conditions.4,5In the process of CO2 electroreduction, various C1 products (carbon monoxide, methane, formate, methanol), C2 products (ethanol, ethylene), and C2+ products (propanol, acetone, acetate) can be formed using different homo/heterogeneous catalysts. Among them, methanol, ethanol, ethylene, and acetone are highly promising chemical synthons in industry as well as synthetic fuels to meet fuel scarcity. However, the chemically inert CO2 molecule significantly hinders the formation of various carbon products.6 Additionally, the process of CO2 electroreduction confronts two major challenges: (i) the inferior binding capability of the CO2 reduction intermediate on electrode materials and (ii) the competitive hydrogen evolution reaction (HER) occurring during the electroreduction process.7,8 To address these issues, the design of an electrocatalyst is of substantial interest. Recently, various transition metal-based oxides/hydroxides9 and metal-free carbonaceous materials10 have been reported for CO2 electroreduction. Among them, copper (Cu) and copper-containing electrocatalysts are well-recognized for the formation of the above-mentioned C2 and C2+ products due to their effective binding ability with *CO and *CHO intermediates.11,12 The quest for relatively low-cost and earth-abundant highly active catalysts with enhanced charge transfer, which is highly desired to steer the enhancement in the fundamental catalytic activity towards value-added C2 and C2+ products, still continues.
In the last decade, new families of two-dimensional materials, namely, metal carbides, nitrides, and carbonitrides (MXenes), discovered by Gogotsi et al., have aroused much attention. The applications of MXenes are extensively explored in the field of supercapacitors,13 batteries,14 electrochemical sensors,15 and water splitting16 applications due to their excellent electronic conductivity, inherent surface functional groups, and tunable interlayer spacing.17,18 MXenes (Mn+1XnTx, where M is the transition element, X is carbon or nitrogen, and Tx is the surface functional group such as –O, –F and –OH) are obtained by selective etching of A elements (A represents group 13 and 14 elements) from their parent MAX phases which have a general formula of Mn+1AXn.19
Apart from their wide range of applications, recent experimental and theoretical investigations proved the efficacy of layered MXenes for CO2 capture and its electrocatalytic conversion.20–22 Reports have suggested that the interlayer spacing between MXene lamellar structures and its high electrical conductivity are conducive to CO2 adsorption and its efficient conversion.23–25 It has been identified that the inherent surface functional groups (Tx = –F, –O, and –OH) in MXenes can change the MXene work function that effectively favors CO2 reduction intermediate adsorption. Also, the metal centers in MXenes can increase CO2 adsorption through non-covalent (O![[double bond, length as m-dash]](https://www.rsc.org/images/entities/char_e001.gif) COlp⋯M) or covalent (surface-bound CO2) interactions.24,26,27 For instance, Wang et al. reported two kinds of MXenes (Ti3C2Tx and V2CTx) for CO2 capture and obtained a maximum CO2 adsorption capacity of 5.79 mmol g−1 at 40 bar pressure.25 In recent years, a few reports investigated MXenes for electrocatalytic conversion of CO2. For example, Qu et al. investigated that the use of N-doping and titanium vacancies in the Ti3C2 MXene shows 92% faradaic efficiency towards CO production.28 Hondoko et al. reported the use of Ti2CTx and Mo2CTx for the electrocatalytic conversion of CO2 into formic acid as a primary product with a 56% faradaic efficiency. They suggested that the inherent functional groups (Tx) present in the materials are the reason for such high performance.22 Ti3C2 and Mo2C were investigated by Attanayake et al. for CO2 reduction and showed a faradaic efficiency of 90% towards CO production by using ionic liquid-based electrolytes.20 Also, a copper immobilized Ti3C2Clx MXene derived from a quaternary MAX phase (Ti3(Al1−xCux)C2) was reported for electrochemical CO2 reduction, where methanol and ethanol were the major products due to the unsaturated electronic structure of Cu.28 Bao et al. synthesized a copper single atom decorated Ti3C2Tx MXene for effective carbon monoxide reduction and achieved 98% of multi-carbon products. This is due to the formation of a favorable C–C coupling to generate the key intermediates (*CO–CHO) for multi-carbon product formation.29
COlp⋯M) or covalent (surface-bound CO2) interactions.24,26,27 For instance, Wang et al. reported two kinds of MXenes (Ti3C2Tx and V2CTx) for CO2 capture and obtained a maximum CO2 adsorption capacity of 5.79 mmol g−1 at 40 bar pressure.25 In recent years, a few reports investigated MXenes for electrocatalytic conversion of CO2. For example, Qu et al. investigated that the use of N-doping and titanium vacancies in the Ti3C2 MXene shows 92% faradaic efficiency towards CO production.28 Hondoko et al. reported the use of Ti2CTx and Mo2CTx for the electrocatalytic conversion of CO2 into formic acid as a primary product with a 56% faradaic efficiency. They suggested that the inherent functional groups (Tx) present in the materials are the reason for such high performance.22 Ti3C2 and Mo2C were investigated by Attanayake et al. for CO2 reduction and showed a faradaic efficiency of 90% towards CO production by using ionic liquid-based electrolytes.20 Also, a copper immobilized Ti3C2Clx MXene derived from a quaternary MAX phase (Ti3(Al1−xCux)C2) was reported for electrochemical CO2 reduction, where methanol and ethanol were the major products due to the unsaturated electronic structure of Cu.28 Bao et al. synthesized a copper single atom decorated Ti3C2Tx MXene for effective carbon monoxide reduction and achieved 98% of multi-carbon products. This is due to the formation of a favorable C–C coupling to generate the key intermediates (*CO–CHO) for multi-carbon product formation.29
Of all MXene-based CO2 electroreduction processes reported so far, most use either complex organic electrolytes or high temperature or demonstrate electroreduction of the CO intermediate instead of directly using CO2. There is enormous room available to explore the fundamental catalytic activity of MXenes using aqueous electrolytes for electrocatalytic CO2 conversion. In continuation of this exciting research field, herein, we have prepared the Ti3C2Tx MXene by an in situ etching method and used it as an active electrode material for electrocatalytic CO2 conversion using simple aqueous KHCO3 electrolyte. Laursen et al. and Hondoko et al. suggested that the use of Ti-based MXenes is beneficial in CO2 electroreduction due to their hydrogen-opposing behavior, which is beneficial for promising CO2 reduction.22,30 The as-prepared material has been investigated using various physical and electrochemical characterization techniques. Unlike the product formation obtained in organic electrolyte systems, we achieved the highest faradaic efficiency of 96% towards mono- as well as multi-carbon products such as CO, methanol, ethanol, and acetone in 0.5 M KHCO3 aqueous electrolyte. Moreover, the Ti3C2Tx MXene electrocatalyst exhibits excellent long-term stability. The use of an earth-abundant electrocatalyst for the transformation of CO2 in a benign aqueous medium into value-added products highlights the sustainable character of this methodology.
2. Experimental section
2.1. Chemicals
Potassium bicarbonate (KHCO3), methanol, ethanol, acetone, dimethyl sulfoxide (DMSO), lithium fluoride (LiF), and hydrochloric acid (HCl) were purchased from SRL Chemicals, India. Ti3AlC2 was procured from Y-Carbon Ltd, Ukraine. All the chemicals were used without any further purification. A Nafion N-117 membrane was procured from Alfa Aaser, India. Deionized (DI) water with a resistivity of 18.2 MΩ cm was obtained from a Millipore ultrapure water purification system.2.2. Preparation of the MXene (Ti3C2Tx)
Ti3C2Tx was prepared by a top-down approach based on previous literature.19 In a typical synthesis, 1.6 g of LiF was added to a solution containing 5 mL of DI water and 15 mL of 12 M HCl in a Teflon container (HF-safe container). The as-obtained mixture was stirred at 100 rpm at 35 °C for 5 min to obtain a homogeneous solution. Afterward, Ti3AlC2 (1 g) was added slowly and stirred for 24 h at 35 °C. Then, the resultant mixture was repeatedly washed in a centrifuge at 4000 rpm until the pH of the suspension reached a value more than 6. Finally, the sedimented Ti3C2Tx was dried at 60 °C in a vacuum oven for 8 h.2.3. Modification of the glassy carbon electrode (GCE) by Ti3C2Tx coating
5 mg of Ti3C2Tx and 5 wt% of Nafion solution (10 μL) were taken in 1 mL of ethanol and sonicated for 15 min. The obtained Ti3C2Tx slurry was applied to the freshly polished glassy carbon electrode (5 mm diameter) by repeatedly coating the electrode with 10 μL drops of the suspension. The deposition of the suspension was repeated five times. Each time the coated suspension was allowed to dry before applying the next drop of suspension.2.4. Physical characterization
Powder X-ray diffraction (PXRD) was performed using a Rigaku Ultima IV X-ray diffractometer with Cu Kα radiation (1.54 Å) in the range of 5° to 60° (step size of 0.02°). Field emission-scanning electron microscopy (FE-SEM, JEOL-7610F Plus) was used to investigate the surface morphology of the as-prepared material. The elemental composition and their distribution were examined using energy-dispersive X-ray spectroscopy (EDX) and elemental mapping, respectively. The Raman spectrum was recorded using a LabRAM HR Evolution spectrometer in the wavenumber range of 100–2000 cm−1 with a laser wavelength of 532 nm. The surface area and textural characteristics of the MXene were evaluated using a Quantachrome gas sorption analyzer (Autosorb iQ3) under a liquid nitrogen atmosphere. The surface area was calculated using the Brunauer–Emmett–Teller (BET) method in the relative pressure (P/P0) region of 0.05–0.35, and the pore size was calculated using the Barrett–Joyner–Halenda (BJH) method from the desorption region of the isotherm at a relative pressure of ∼0.99.CO2 adsorption–desorption experiments were carried out on a Quantachrome gas sorption analyzer at two different temperatures (288 and 298 K) in the relative pressure region of 0.05–1. Prior to CO2 adsorption experiments, the sample was degassed at 300 °C under a high vacuum for 12 h.
The adsorption affinity of CO2 on the MXene adsorbent was calculated from isosteric heat of adsorption (Qst) using the Clausius–Clapeyron equation:31
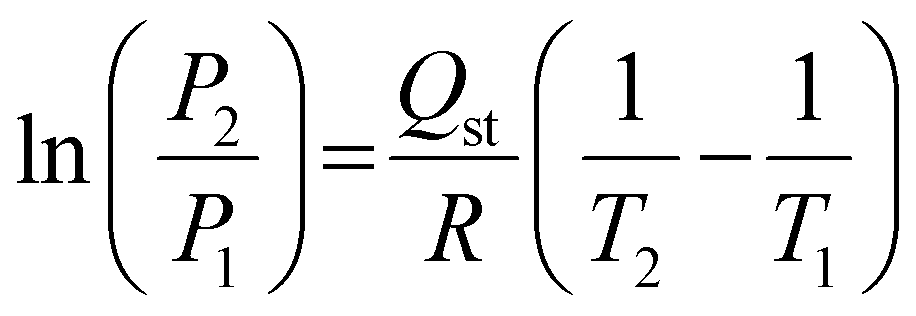 | (1) |
The CO2/N2 selectivity was calculated at 298 K using the Henry constant (KH) equation, which is given as follows:31
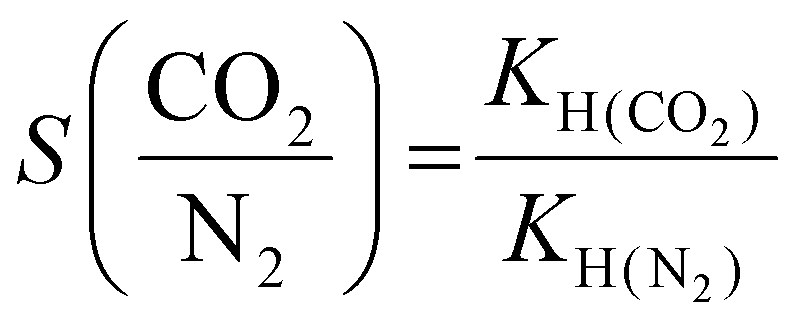 | (2) |
2.5. Electrochemical characterization
Electrochemical experiments were performed using an Autolab 204 potentiostat/galvanostat (NOVA-2.1.4 software). The electrocatalytic activity of the as-prepared electrode material was investigated using linear sweep voltammetry (LSV) and chronoamperometry (CA) techniques. Platinum (Pt) and silver/silver chloride (Ag/AgCl (3 M KCl)) electrodes were used as the counter and reference electrodes, respectively. The Ti3C2Tx coated GCE (Ti3C2Tx-GCE) was used as the working electrode. LSV was performed in the N2 saturated (N2 bubbling for 30 min) KHCO3 (0.1 M or 0.5 M) electrolyte, followed by CO2 saturated electrolyte (CO2 bubbling for 30 min), using modified electrodes. The LSV was performed in the potential range between 0 and −1.6 V (vs. Ag/AgCl) with a 10 mV s−1 scan rate.Long-term CO2 electrolysis was performed by chronoamperometry (CA) using an H-type cell. The H-type cell comprised two compartments (anodic and cathodic), which were separated by a proton exchange membrane (Nafion-117 membrane), which acted as a separator and an ion exchanger. Each compartment was filled with 25 mL of KHCO3 solution of appropriate concentration (0.1 and 0.5 M). The counter electrode was placed in the anodic compartment, while the reference and working electrodes were placed in the cathodic compartment. The schematic representation of the H-type cell is shown in Fig. S1 (ESI†). Before analysis, the cathodic compartment part was saturated with N2, followed by CO2 gas for 30 min. Long-term CO2 electrolysis was carried out for 180 min with continuous bubbling of CO2 gas at a constant flow rate (10 sccm) throughout the process. The resultant liquid electroreduction products were analyzed by 1H NMR spectroscopy with the water suppression method using an AVANCE III 400 Ascend Bruker BioSpin spectrometer. The gaseous products were analyzed using a Thermo Fisher Trace 1110 with a TCD detector. The NMR samples were prepared by mixing 0.5 mL of cathodic part solution, 100 μL of D2O, and 0.05 μL of DMSO (as the internal standard).
The faradaic efficiencies (FEs) of the products were calculated using the following equation:
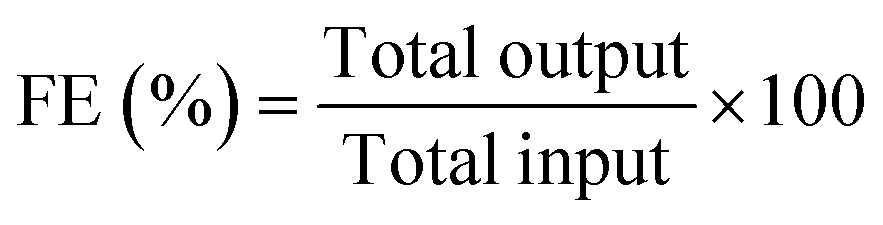 | (3) |
| Total output = Mproduct × number of electrons (n) |
where Mproduct is the number of moles of product, n is the number of electrons involved in the electrode reaction, Q is the charge (C), and F is the Faraday constant (96
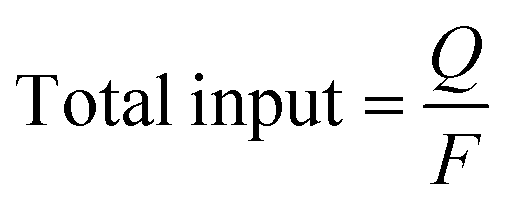
![[thin space (1/6-em)]](https://www.rsc.org/images/entities/char_2009.gif) 485 C mol−1).
485 C mol−1).
3. Results and discussion
Synthesis of Ti3C2Tx was achieved by selective in situ etching of the Al layer from its MAX phase Ti3AlC2 in the presence of the LiF and HCl etchant which led to an enhanced interlayer distance in Ti3C2Tx compared to parent Ti3AlC2.19 The phase purity and the change in the interlayer distance were confirmed by the PXRD pattern (Fig. S2, ESI†). The sharp diffraction peak at around 6° (002) shows a characteristic peak of ordered Ti3C2Tx sheets. Compared to Ti3AlC2, a shift of the (002) peak towards a lower angle in Ti3C2Tx suggests the successful etching of the Al layer in the MAX phase, resulting in an increased interlayer d-spacing. Additionally, the diffraction peaks of (103), (104), (105), (106), (108), and (109) correspond to the TiC impurities.32,33Further, the formation of the Ti3C2Tx MXene was also confirmed by Raman spectroscopy, as shown in Fig. 1(a). The low wavenumber peaks at 200, 360, 610, and 720 cm−1 are the characteristic peaks of Ti3C2Tx, which match well with the reported literature.32,34 Besides, the two indistinguishable peaks at 1345 and 1564 cm−1 are assigned to the D and G bands of carbon. The indiscernible nature of these peaks indicates less disorder in the arrangement of the nanosheets. Moreover, no peaks were identified related to anatase TiO2, confirming the absence of any anatase phase during MXene synthesis.
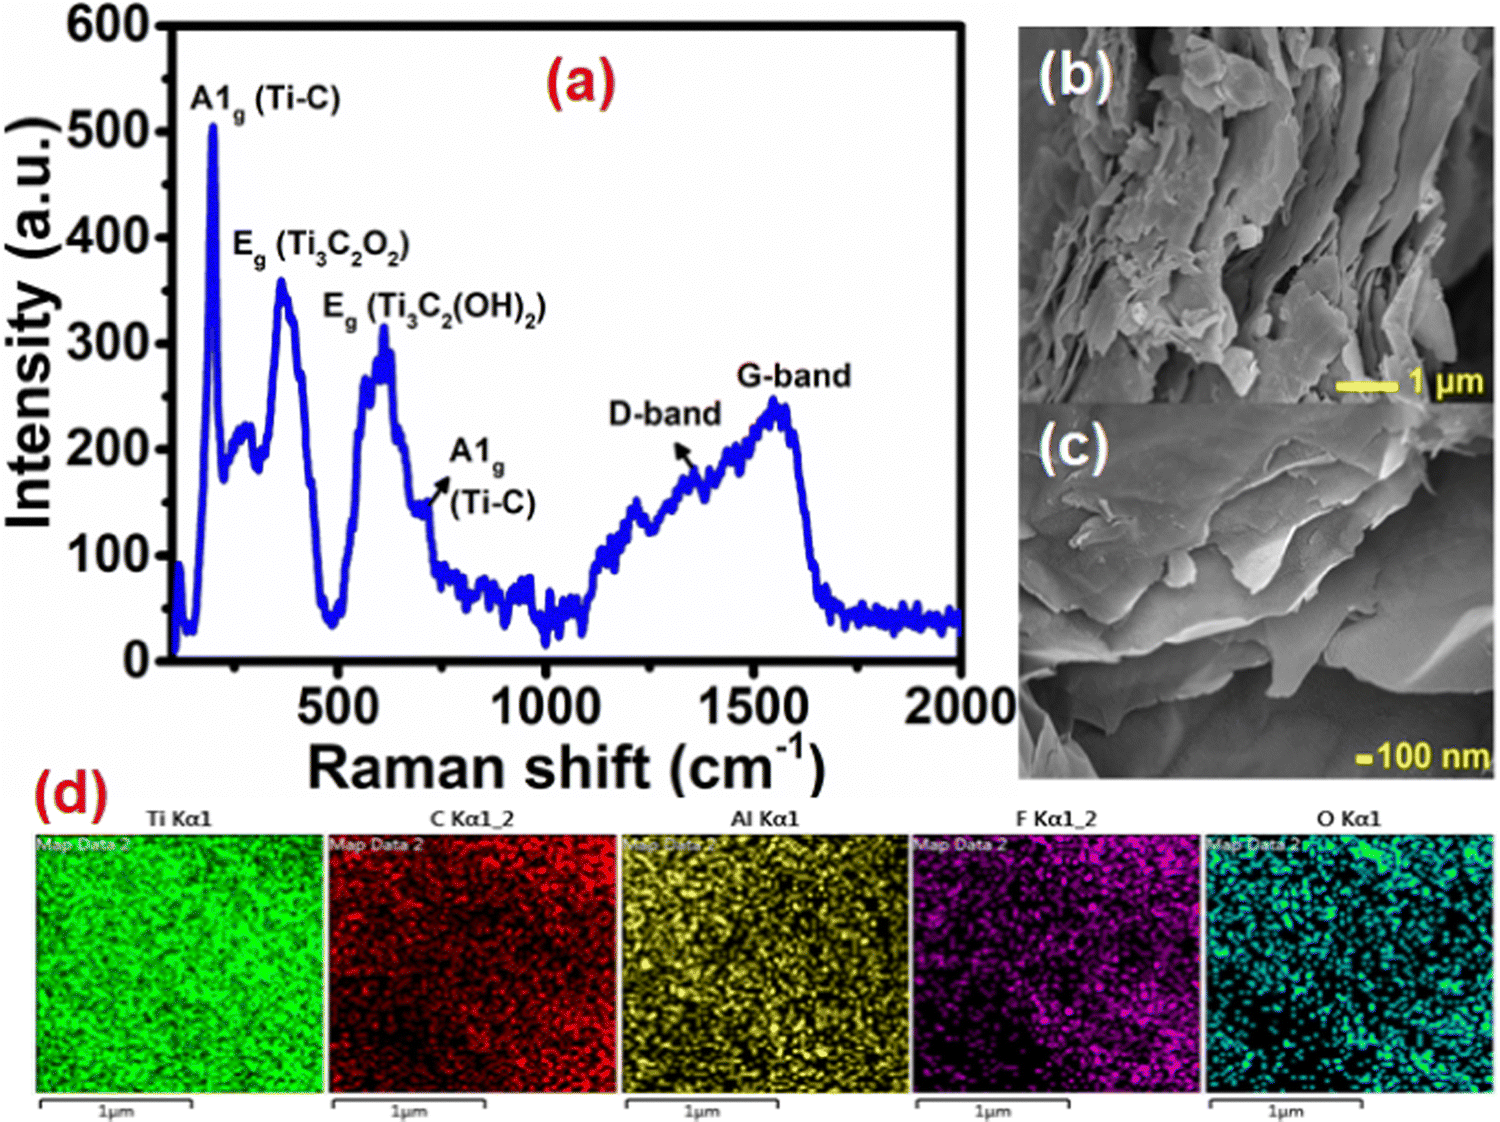 | ||
| Fig. 1 (a) Raman spectrum, (b) and (c) FE-SEM images at low and high magnifications and (d) elemental mapping of Ti3C2Tx. | ||
The morphology of the Ti3C2Tx has been investigated using field emission scanning electron microscopy (FE-SEM) and is shown in Fig. 1(b) and (c). The FE-SEM images confirm the presence of a well-separated layered ultra-thin sheet-like structure of Ti3C2Tx. The percentage element present in Ti3C2Tx was studied (Fig. S3, ESI†) by energy-dispersive X-ray spectroscopy (EDX) analysis. It shows the presence of Ti and C along with surface functional group elements O and F. The presence of only a trace amount of Al (2.5 wt%) confirms the successful etching of the Al layer from the parent Ti3AlC2. SEM-elemental mapping (Fig. 1(d)) suggests a uniform distribution of all the elements present in the Ti3C2Tx MXene nanosheets.
The surface textural properties, such as the surface area and pore size characteristics of Ti3C2Tx, were examined by the N2 adsorption–desorption experiment. As per the IUPAC classification, the N2 adsorption–desorption isotherm (Fig. 2(a)) exhibits a type IV behavior with an H3 hysteresis loop, suggesting its mesoporous nature with uniform pore size distribution.35 The Brunauer–Emmett–Teller (BET) surface area of Ti3C2Tx was calculated to be 29.63 m2 g−1. Further, the Barrett–Joyner–Halenda (BJH) pore size distribution curves (Fig. 2(b)) show the narrow pore size distribution centered at 3.8 nm.
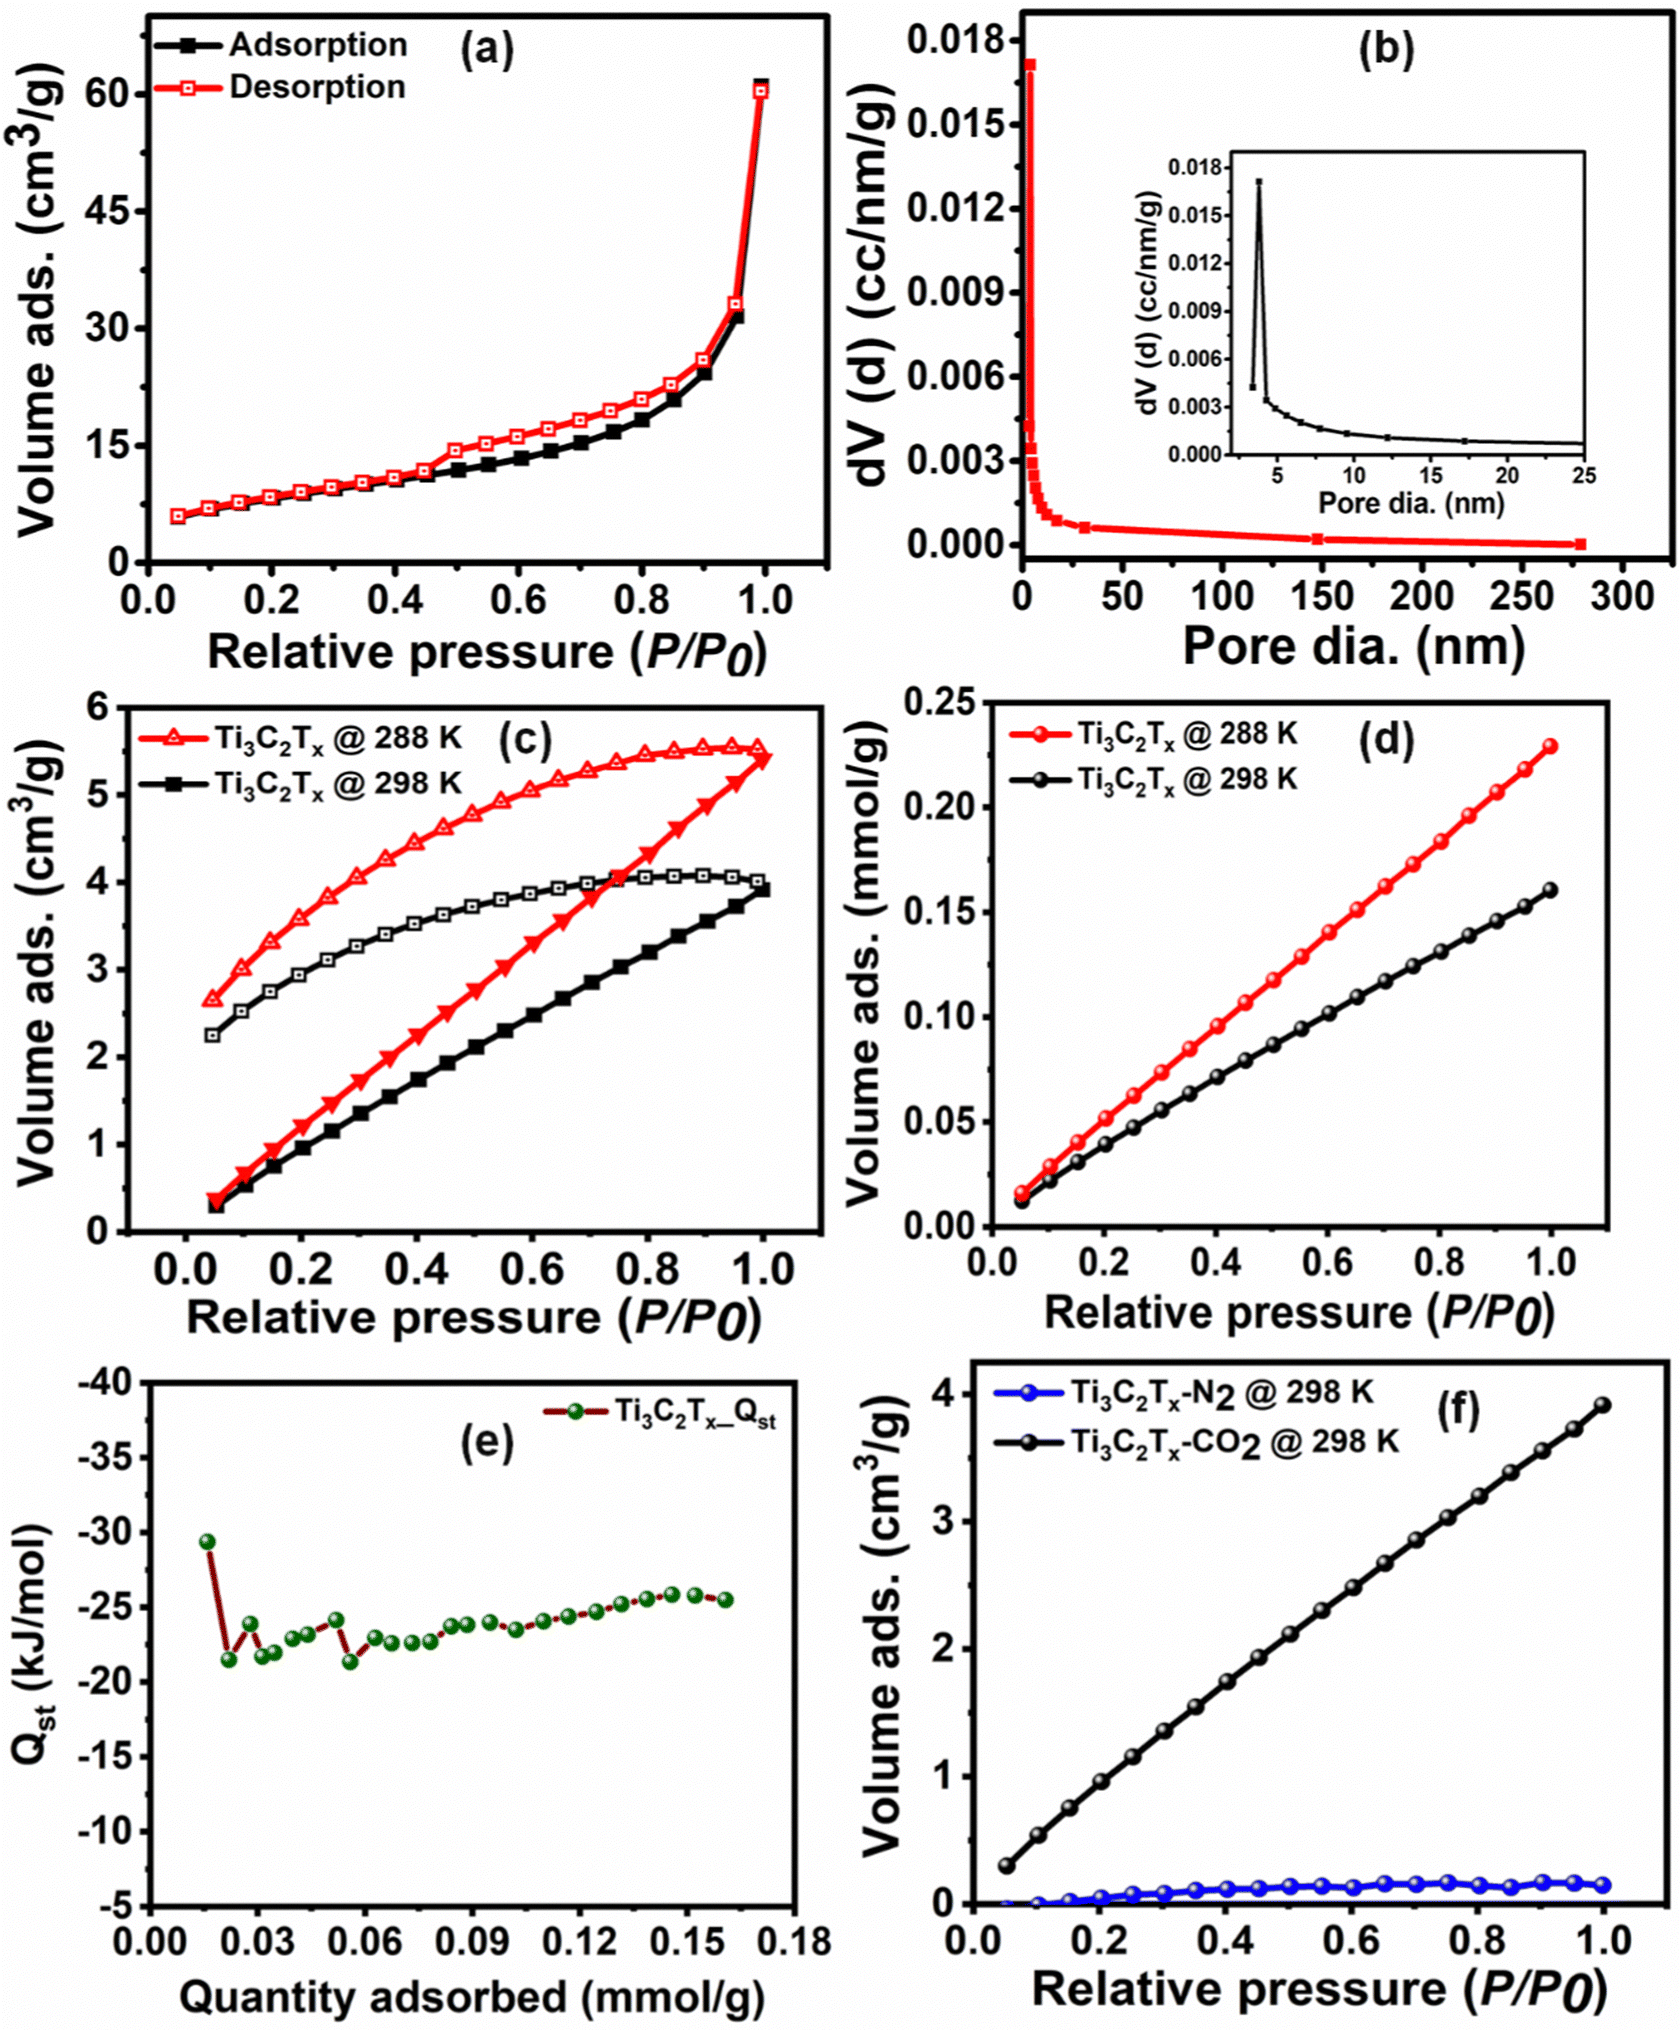 | ||
| Fig. 2 (a) and (b) BET N2 adsorption–desorption isotherm and pore size distribution, (c) and (d) CO2 adsorption–desorption isotherm in cm3 g−1 and CO2 adsorption isotherm in mmol g−1 at 288 and 298 K, (e) isosteric heat of adsorption and (f) CO2 selectivity studies over N2 at 298 K. | ||
3.1. CO2 adsorption studies
Prior to the investigation of the electrocatalytic activity of Ti3C2Tx, its CO2 affinity was assessed by studying the CO2 adsorption isotherm. The CO2 adsorption isotherm of Ti3C2Tx was investigated at two different temperatures of 288 and 298 K at a relative pressure of 1 bar (Fig. 2(c) and (d)). Fig. 2(c) depicts the adsorption–desorption isotherms at 288 and 298 K, which show maximum CO2 adsorption capacities of 0.23 and 0.16 mmol g−1, respectively (Fig. 2(d)). It is interesting to observe that, at both temperatures, a significant proportion of adsorbed CO2 (ca. 48.9% at 288 K and 57.4% at 298 K) remains bound to the surface of Ti3C2Tx even after returning to zero partial pressure of CO2. This corroborates that the Ti3C2Tx surface exhibits good binding affinity towards CO2, which is an essential criterion for CO2 electroreduction. This affinity may be attributed to the strong interactions of CO2 with the existing –OH, –O and –F surface functionalities of Ti3C2Tx.25 To further support this observation, the FT-IR spectra of vacuum-degassed MXene and MXene exposed to CO2 at high pressure were compared to see if CO2 stays on the MXene surface after the exposure (Fig. S4, ESI†). The Ti3C2Tx before CO2 adsorption shows peaks at 661, 1028, and 2012–3870 cm−1 corresponding to the stretching vibrations of Ti–O, C–F, combined hydrogen bonded O groups, and surface hydroxyl groups.36 When Ti3C2Tx is exposed to CO2, the Ti–O units on the surface of Ti3C2Tx act as good interaction sites to facilitate the adsorption of CO2 in mono- and bidentate carbonate forms (Scheme 1).37 The appearance of a new peak at 1611 cm−1 suggests the formation of bidentate carbonate species, while the splitting of the Ti–O–Ti peak into two separate peaks indicates the formation of monodentate carbonates.37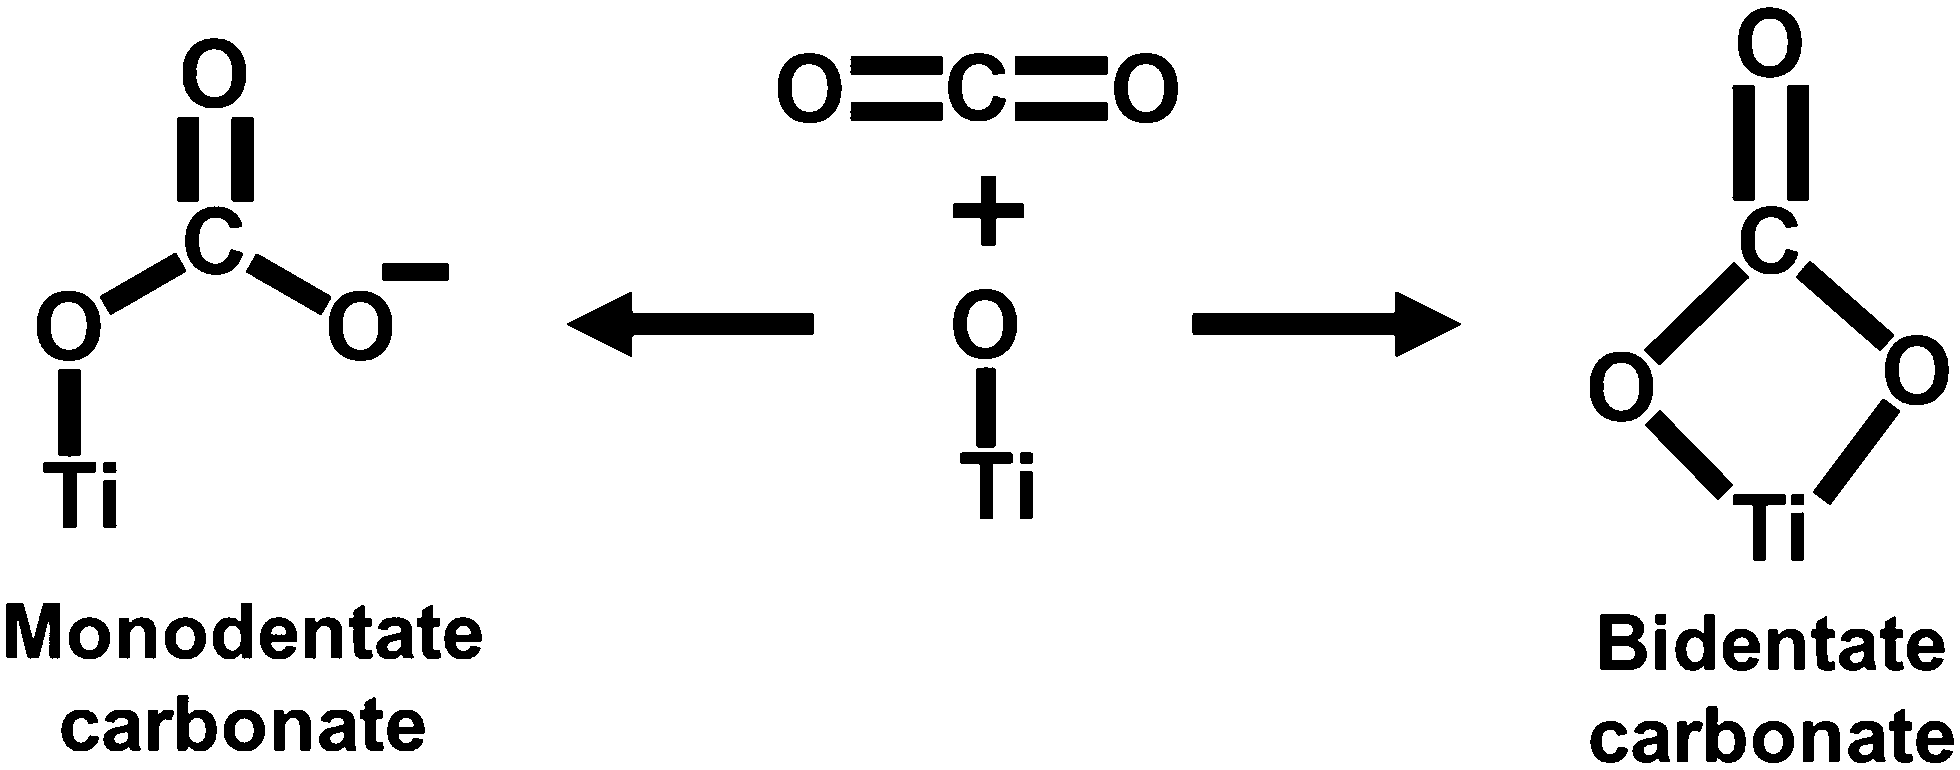 | ||
| Scheme 1 Possible CO2 interaction on the MXene surface. | ||
From the two adsorption isotherms, it is evident that decreased adsorption capacity is observed at elevated temperature, which implies that physical adsorption is the main force for the interaction between CO2 and Ti3C2Tx at low CO2 pressure.38 Also, a linearly increasing adsorption isotherm is observed with increasing relative CO2 pressure until the measured range, implying that, owing to its mesoporous nature, the surface of Ti3C2Tx is still not saturated with CO2, and even more CO2 adsorption can be achieved upon increasing the relative pressure.31
The adsorption affinity of CO2 on the Ti3C2Tx adsorbent has been calculated (Fig. 2(e)) from the CO2 adsorption isotherms at 288 and 298 K using the enthalpy of adsorption (−Qst) obtained from the Clausius–Clapeyron equation (eqn (1)). The average enthalpy of adsorption is found to be −23.6 kJ mol−1, which lies in the physisorption range (−10 to −50 kJ mol−1).39 An almost constant value of the enthalpy of adsorption at all surface coverage suggests the homogeneous surface of the Ti3C2Tx adsorbent involving a similar type of interaction all over its surface.38,40,41 To understand the practicability of the adsorbent, the CO2/N2 selectivity on Ti3C2Tx has been investigated using the Henry law equation (Fig. 2(f)). The calculations indicate that the Ti3C2Tx adsorbent exhibits almost 22 times selectivity for CO2 over N2 at room temperature, suggesting its remarkable potential as a catalyst in CO2 conversion reactions. Although CO2 and N2 have almost similar kinetic diameters (CO2: 330 pm; N2: 364 pm), the higher electric quadrupole moment of CO2 facilitates its interactions with the highly polar surface functional groups on the Ti3C2Tx surface, which renders enhanced selectivity.
3.2. Electrochemical analysis
To evaluate the electrocatalytic activity of the Ti3C2Tx modified glassy carbon electrode (GCE) (Ti3C2Tx-GCE), linear sweep voltammetry (LSV) has been carried out using a standard three-electrode system in 0.5 M KHCO3 aqueous electrolyte in the potential range between −1.6 and 0 V (vs. Ag/AgCl) at a scan rate of 10 mV s−1 (Fig. 3(a)). In the N2 saturated electrolyte, the obtained higher current density is attributed to the H2 evolution reaction. In the case of CO2-saturated electrolyte, the current density is higher than that in the case of N2-saturated electrolyte, which is due to the simultaneous reduction of both H+ and CO2. Additionally, an anodically shifted electrochemical potential has been observed for the CO2-saturated electrolyte (−1.37 V vs. Ag/AgCl) compared to the N2-saturated electrolyte (−1.51 V vs. Ag/AgCl) corresponding to a constant current density of −5 mA cm−2. These observations reveal that the electrode material active sites efficiently facilitate the electron transfer across the electrode interface and eventually help to enhance the CO2 reduction process. To assess if the coated Ti3C2Tx is the sole cause for this excellent electrocatalytic performance, we also investigated the catalytic activity of the bare GCE under similar conditions (Fig. 3(a)). The observed rise in the current densities for both N2 and CO2 saturated electrolytes is insignificant, which confirms that the overall product formation is exclusively due to the catalytic activity of Ti3C2Tx.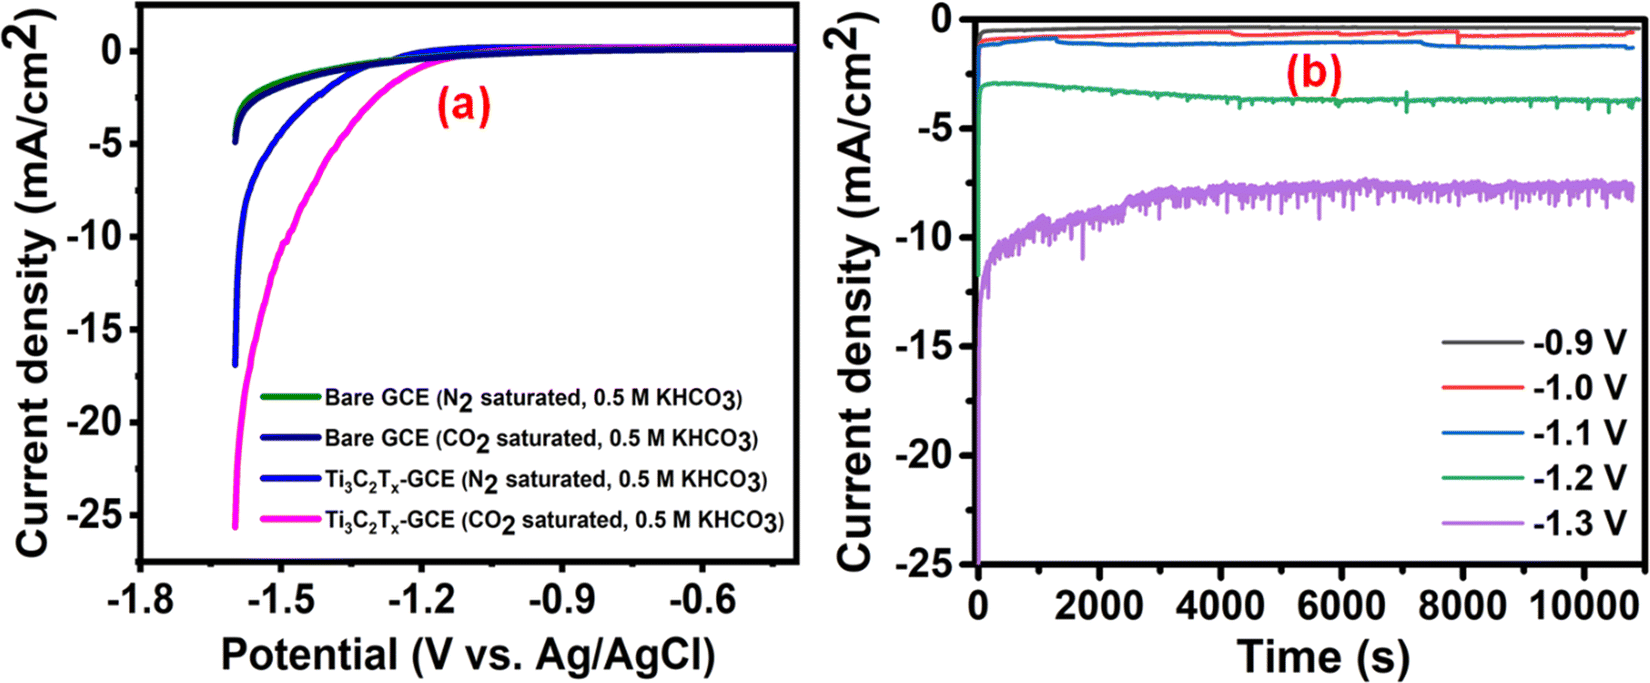 | ||
| Fig. 3 (a) LSV curves in the presence of 0.5 M KHCO3 at 10 mV s−1 and (b) CA profiles of the Ti3C2Tx-modified GCE at different potentials (vs. Ag/AgCl). | ||
The effect of electrolyte concentration is also an important factor for effective product formation. Therefore, we also investigated and compared the performance of the Ti3C2Tx-GCE at two different concentrations of electrolyte, namely 0.1 M and 0.5 M KHCO3 (Fig. S5, ESI†). The results suggest that with increasing concentration of KHCO3 electrolyte from 0.1 M to 0.5 M the current density also increases. In general, the local environment around the active materials during electrolysis is known to influence the CO2 reduction reaction (CO2RR). Nakona et al. also observed high current density at higher KHCO3 concentrations, however with decreased faradaic efficiency for CO2RR products. They suggested that, after a certain concentration of KHCO3, the K+ ions generated from the electrolyte also determine the product selectivity. At higher electrolyte concentrations, the K+ ions start accumulating around the negatively charged electrode materials, which hinders the CO2RR by preventing CO2 from accessing the electrode, resulting in the dominance of the HER.42,43 Moreover, being a basic salt (formed from a strong base and a weak acid), the higher concentration of KHCO3 increases the pH of the solution. It has been suggested that >8 pH of electrolyte causes deprotonation of the CO2 carrier HCO3− into CO32− and, thus, decreases the CO2 carrier concentration.43,44 This also favors the HER and decreases the faradaic efficiency of CO2RR products, despite the increase in the overall current density. Considering these facts, we chose a 0.5 M KHCO3 concentration (causing pH ∼ 7.47, just below 8; Fig. S6, ESI†) for further studies.
To examine the types of products formed during the CO2 electroreduction, constant potential electrolysis, i.e., chronoamperometry (CA), has been carried out in an H-type cell using a Nafion membrane as the proton exchanger and separator (Fig. S1, ESI†). Prior to the extensive investigation, we also investigated the effect of electrolyte concentration using the CA experiment at −1.1 V (vs. Ag/AgCl) at two different electrolyte concentrations (0.1 M and 0.5 M KHCO3). The evaluation of CO2RR products formed at two different electrolyte concentrations was done by 1H NMR (Fig. S7, ESI†). Fig. S7 (ESI†) clearly suggests that the product formation in 0.1 M KHCO3 is negligible. In contrast, in the case of 0.5 M KHCO3 electrolyte, well-distinguished peaks for ethanol (δ (ppm): 3.55 (q), 1.08 (t)), methanol (δ (ppm): 3.26 (s)), and acetone (δ (ppm): 2.13 (s)) are observable.45 Therefore, choosing a 0.5 M KHCO3 electrolyte concentration not only enhances the current density, as observed in the LSV experiment, but also facilitates the CO2 electroreduction.
To assess the effect of potential on the CO2RR, the CA experiment was performed at different potentials (−0.9 to −1.3 V) (Fig. 3(b)). The potential choice was based on the onset potential (−1.1 V) obtained from the CO2-saturated Ti3C2Tx-GCE LSV curve. The CA experiments were carried out at −0.9 V, −1.0 V, −1.1 V, −1.2 V, and −1.3 V (vs. Ag/AgCl) for 3 h, and the corresponding 1H NMR spectra are shown in Fig. S8 (ESI†). The time vs. current density profiles with different potentials are shown in Fig. 3(b), which confirms the stable current densities obtained at all selected onset potentials. In the case of the CA profile at −1.3 V, some disturbance was observed, which was due to vigorous H2 evolution causing bubble formation on the electrode.
Faradaic efficiency (FE) is an important measure of the catalytic activity of an electrocatalyst. The variation of the percentage FEs of the total liquid product along with the current density at different potentials is shown in Fig. 4(a). The concentrations of various products formed during the electrolysis were quantified from the standard plot obtained by plotting their relative 1H NMR peak with respect to known concentrations (Fig. S9, ESI†). From Fig. 4(a), it can be observed that, upon increasing the potential, the %FE of liquid products as well as current density gradually increases until −1.1 V (vs. Ag/AgCl) (maximum FE obtained: 53.8%), whereas a further increase in the potential causes a drastic reduction in %FE along with a sudden increase in the current density. This observation corroborates that, beyond −1.1 V, the HER is strongly favored over the CO2RR. The breakup of faradaic efficiency for individual liquid products at different voltages is shown in Fig. 4(b). It was observed that, for the highest obtained FE of 53.8%, at −1.1 V (vs. Ag/AgCl), the highest contribution came from the formation of methanol, which is comparable to most of the reported catalysts (Table S1, ESI†). In addition to liquid products, gaseous products such as CO, CH4, C2H6, and C2H4 are also known to be formed in the CO2RR. Therefore, to calculate the overall %FE, we also quantified the gaseous products at −1.1 V vs. Ag/AgCl using gas chromatography (Fig. S10, ESI†), which suggested the formation of only CO (42.2%). Based on the NMR and gas chromatography studies, the overall FE of the Ti3C2Tx electrocatalyst, at −1.1 V vs. Ag/AgCl, was calculated to be 96%.
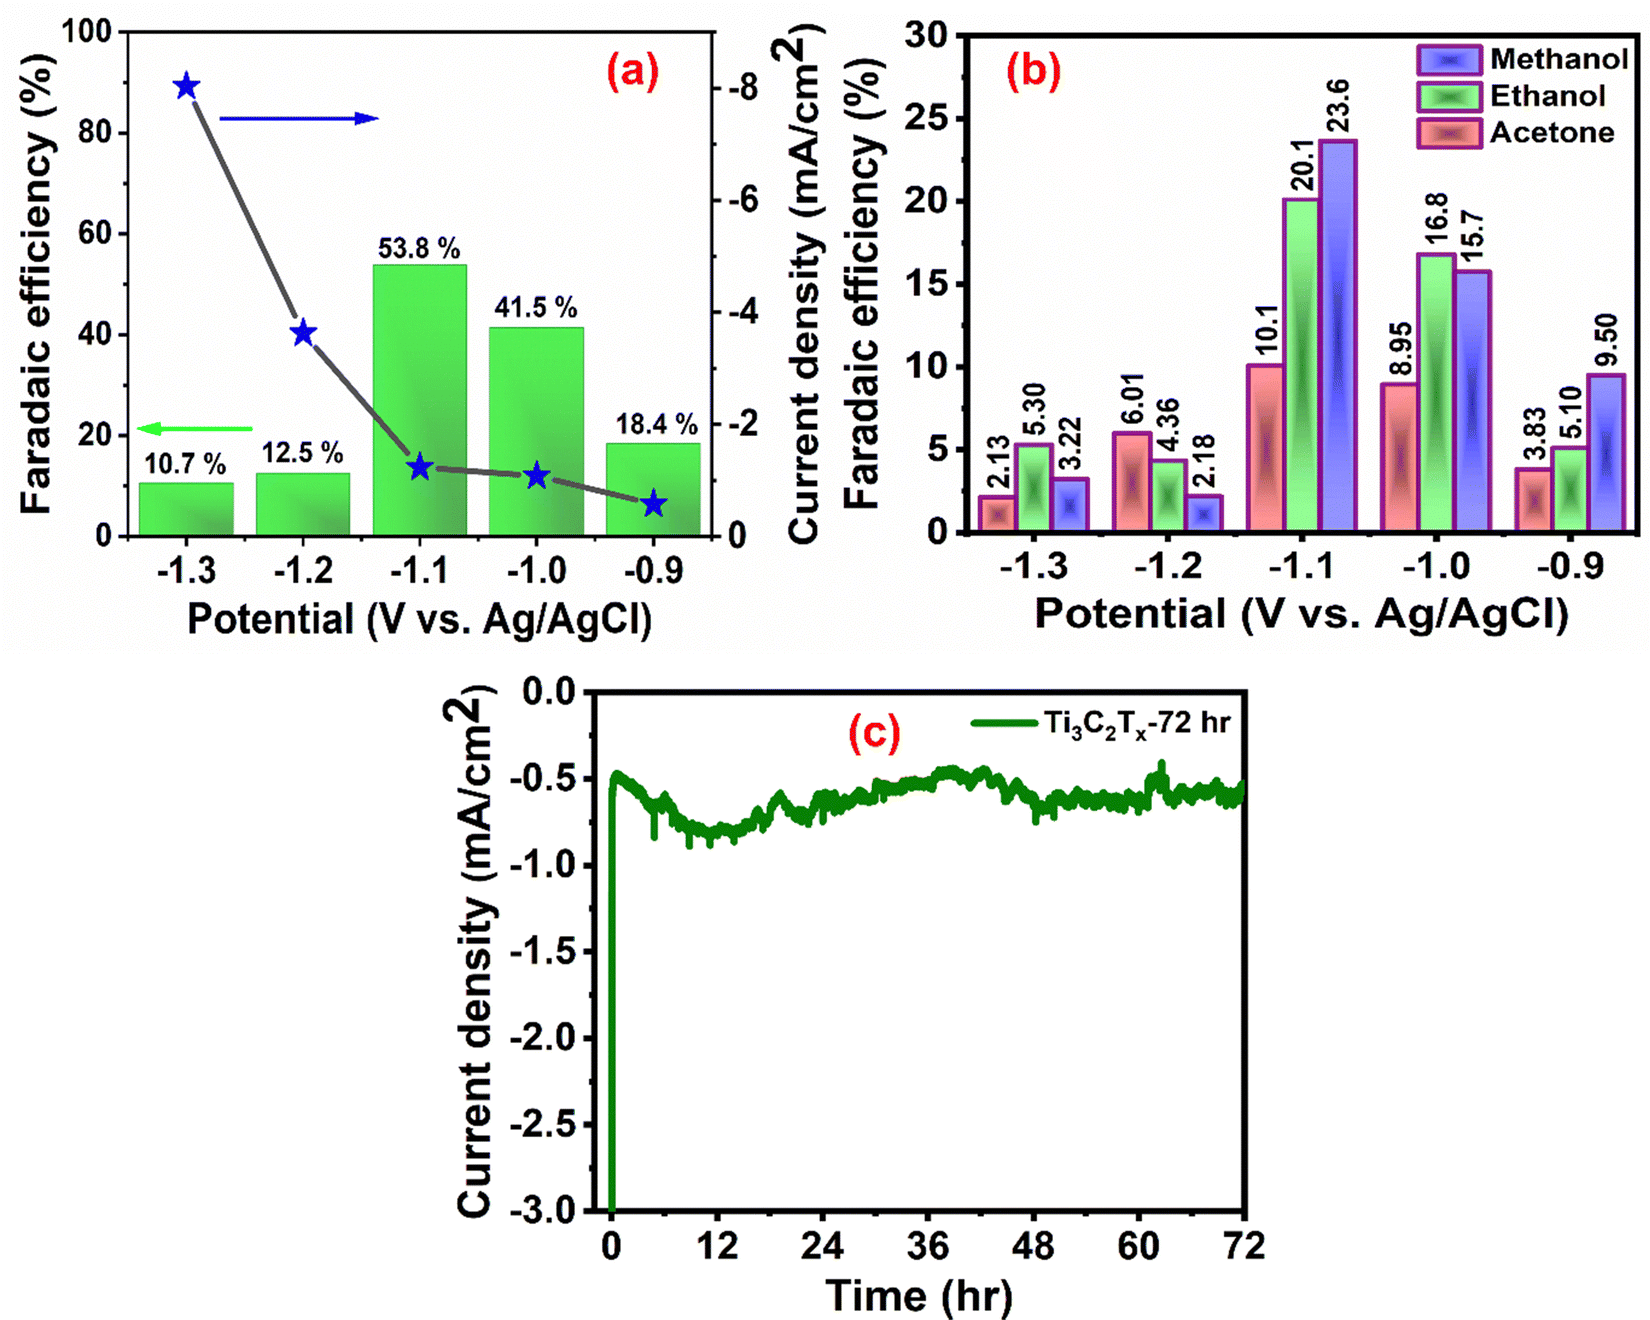 | ||
| Fig. 4 (a) The total liquid product %FE and the corresponding current density, (b) individual liquid product %FE, and (c) long-term stability test at −1.1 V vs. Ag/AgCl for 72 h. | ||
In general, the Ti3C2Tx electrode was observed to favor the formation of all C1–3 products, suggesting a strong interaction of its surface with the CO2RR intermediates.46–48 This is mainly due to the presence of –OH, –O and –F surface functional groups, which activate the electrode surface for CO2 reduction.22,46 It was further supplemented by calculating the electrochemical active surface area (ECSA) of Ti3C2Tx in terms of double layer capacitance (Cdl) from its cyclic voltammetry curves at different scan rates (10–50 mV s−1).49 Fig. S11 (ESI†) shows the ECSA plot of Ti3C2Tx, which has the maximum Cdl value of 3.19 mF cm−2. This value is comparable to most of the recently reported electrocatalysts, confirming the presence of a higher number of electrocatalytic active sites for the excellent CO2RR performance.22,49,50
The stability of the electrocatalyst for a long-time operation is one of the important concerns for finding the best catalyst for CO2 electroreduction. We investigated the long-term stability of the Ti3C2Tx-GCE for 72 h at a constant potential of −1.1 V (Fig. 4(c)). After 72 h of electroreduction, no discernible change in the current density was observed, which signifies the excellent stability of the Ti3C2Tx-GCE. The slight fluctuation in the chronoamperometry curve is due to bubble formation and explosion during continuous electrolysis. The same phenomena have also been observed in a previously reported investigation.29 To further investigate any alteration in the structural features of the catalyst after 72 h of electrolysis, FE-SEM, EDX, elemental mapping, and PXRD studies were also carried out (Fig. S12–S14, ESI†). FE-SEM images reveal the preservation of its two-dimensional morphology with slight agglomeration. EDX and elemental mapping confirm the uniform presence of all the elements pertaining to Ti3C2Tx along with electrolyte ions, confirming the overall compositional integrity of the sample after long-time electrolysis. Moreover, the PXRD pattern of the used catalysts shows all the related peaks of Ti3C2Tx with reduction and broadening of some peaks, indicating partial oxidation of some Ti sites. To investigate the changes in charge transfer dynamics, electrochemical impedance spectroscopy (EIS) of the Ti3C2Tx catalyst before and after the extended electrolysis was carried out (Fig. S15, ESI†). EIS measurements were performed in the frequency range of 0.1 Hz to 100 kHz with an alternating current amplitude of 10 mV. It was observed that, after prolonged electrolysis, the bulk resistance of the catalyst shows slight enhancement (Rs: 17.2 Ω (for fresh) and 24.3 Ω (for used)), as can be observed at high frequencies. However, the appearance of a semicircle was observed for the used catalyst, which corresponds to charge transfer resistance (Rct) due to the presence of CO2-converted or adsorbed products ( , HCO3− or any liquid product) on the electrode surface which increases the impedance.51,52
4. Conclusion
The Ti3C2Tx MXene was synthesized by a less hazardous in situ etching process, which was used as a selective CO2 adsorbent and an electrocatalyst for CO2 electroreduction. The presence of inherent functional groups, high conductivity, and metal sites in the MXene facilitates enhanced gas adsorption and endows the MXene with efficient electrocatalytic properties. Detailed volumetric CO2 gas adsorption studies reveal that the MXene material exhibits a maximum adsorption capacity of 0.16 mmol g−1 at 298 K with good CO2/N2 selectivity. In addition, the thermodynamic calculation suggests that the physical adsorption behavior is the main mechanism for CO2 adsorption on the MXene material at low pressure. The as-prepared MXene exhibits excellent electrocatalytic properties towards CO2 electroreduction in an aqueous electrolyte with an overall faradaic efficiency of 96% towards various C1 (CO, CH3OH) and C2+ (CH3CH2OH, CH3COCH3) products. The electrocatalyst exhibits a remarkably stable electroreduction performance for a duration of 72 hours as investigated by chronoamperometry using a laboratory-made H-type cell. These striking catalytic features of the MXene demonstrate its use as an attractive and abundantly available electrocatalyst for the conversion of CO2 into multi-carbon products in a benign medium.Conflicts of interest
There are no conflicts to declare.Acknowledgements
All authors thank the Department of Metallurgy Engineering and Materials Science and Sophisticated Instrumentation Center, IIT Indore, for providing research infrastructure and instrumentation facilities. S. K., M. S. K., and M. K. S. acknowledge IIT Indore for their research fellowships. All authors thank Dr C. S. Gopinath and Ms Kranti N., National Chemical Laboratory Pune, for helping in the gas chromatography study.References
- I. S. Omodolor, H. O. Otor, J. A. Andonegui, B. J. Allen and A. C. Alba-Rubio, Ind. Eng. Chem. Res., 2020, 59, 17612–17631 CrossRef CAS.
- P. Friedlingstein, M. O’Sullivan, M. W. Jones, R. M. Andrew, L. Gregor, J. Hauck, C. Le Quéré, I. T. Luijkx, A. Olsen, G. P. Peters, W. Peters, J. Pongratz, C. Schwingshackl, S. Sitch, J. G. Canadell, P. Ciais, R. B. Jackson, S. R. Alin, R. Alkama, A. Arneth, V. K. Arora, N. R. Bates, M. Becker, N. Bellouin, H. C. Bittig, L. Bopp, F. Chevallier, L. P. Chini, M. Cronin, W. Evans, S. Falk, R. A. Feely, T. Gasser, M. Gehlen, T. Gkritzalis, L. Gloege, G. Grassi, N. Gruber, Ö. Gürses, I. Harris, M. Hefner, R. A. Houghton, G. C. Hurtt, Y. Iida, T. Ilyina, A. K. Jain, A. Jersild, K. Kadono, E. Kato, D. Kennedy, K. Klein Goldewijk, J. Knauer, J. I. Korsbakken, P. Landschützer, N. Lefèvre, K. Lindsay, J. Liu, Z. Liu, G. Marland, N. Mayot, M. J. McGrath, N. Metzl, N. M. Monacci, D. R. Munro, S.-I. Nakaoka, Y. Niwa, K. O’Brien, T. Ono, P. I. Palmer, N. Pan, D. Pierrot, K. Pocock, B. Poulter, L. Resplandy, E. Robertson, C. Rödenbeck, C. Rodriguez, T. M. Rosan, J. Schwinger, R. Séférian, J. D. Shutler, I. Skjelvan, T. Steinhoff, Q. Sun, A. J. Sutton, C. Sweeney, S. Takao, T. Tanhua, P. P. Tans, X. Tian, H. Tian, B. Tilbrook, H. Tsujino, F. Tubiello, G. R. van der Werf, A. P. Walker, R. Wanninkhof, C. Whitehead, A. Willstrand Wranne, R. Wright, W. Yuan, C. Yue, X. Yue, S. Zaehle, J. Zeng and B. Zheng, Earth Syst. Sci. Data, 2022, 14, 4811–4900 CrossRef.
- A. Velty and A. Corma, Chem. Soc. Rev., 2023, 150–156 Search PubMed.
- D. Gao, R. M. Arán-Ais, H. S. Jeon and B. Roldan Cuenya, Nat. Catal., 2019, 2, 198–210 CrossRef CAS.
- S. Garg, M. Li, A. Z. Weber, L. Ge, L. Li, V. Rudolph, G. Wang and T. E. Rufford, J. Mater. Chem. A, 2020, 8, 1511–1544 RSC.
- L. Fan, C. Xia, F. Yang, J. Wang, H. Wang and Y. Lu, Sci. Adv., 2020, 6, 1–18 Search PubMed.
- Q. Fan, M. Zhang, M. Jia, S. Liu, J. Qiu and Z. Sun, Mater. Today Energy, 2018, 10, 280–301 CrossRef.
- P. P. Yang, X. L. Zhang, F. Y. Gao, Y. R. Zheng, Z. Z. Niu, X. Yu, R. Liu, Z. Z. Wu, S. Qin, L. P. Chi, Y. Duan, T. Ma, X. S. Zheng, J. F. Zhu, H. J. Wang, M. R. Gao and S. H. Yu, J. Am. Chem. Soc., 2020, 142, 6400–6408 CrossRef CAS PubMed.
- Q. Lei, H. Zhu, K. Song, N. Wei, L. Liu, D. Zhang, J. Yin, X. Dong, K. Yao, N. Wang, X. Li, B. Davaasuren, J. Wang and Y. Han, J. Am. Chem. Soc., 2020, 142, 4213–4222 CrossRef CAS PubMed.
- C. Jia, K. Ching, P. V. Kumar, C. Zhao, N. Kumar, X. Chen and B. Das, ACS Appl. Mater. Interfaces, 2020, 12, 41288–41293 CrossRef CAS PubMed.
- J. Miao, Q. Zhu, K. Li, P. Zhang, Q. Zhao and B. Xu, J. Energy Chem., 2021, 52, 243–250 CrossRef CAS.
- D. Gan, Q. Huang, J. Dou, H. Huang, J. Chen, M. Liu, Y. Wen, Z. Yang, X. Zhang and Y. Wei, Appl. Surf. Sci., 2020, 504, 144603 CrossRef CAS.
- M. K. Singh, S. Krishnan and D. K. Rai, Electrochim. Acta, 2023, 441, 141825 CrossRef CAS.
- Y. Zhang, Z. Cao, S. Liu, Z. Du, Y. Cui, J. Gu, Y. Shi, B. Li and S. Yang, Adv. Energy Mater., 2022, 12, 2103979 CrossRef CAS.
- V. Kedambaimoole, K. Harsh, K. Rajanna, P. Sen, M. M. Nayak and S. Kumar, Mater. Adv., 2022, 3, 3784 RSC.
- B. M. Abraham, V. Parey and J. K. Singh, J. Mater. Chem. C, 2022, 10, 4096–4123 RSC.
- H. Wang, Y. Wu, X. Yuan, G. Zeng, J. Zhou, X. Wang and J. W. Chew, Adv. Mater., 2018, 30, 1–28 Search PubMed.
- J. Pang, R. G. Mendes, A. Bachmatiuk, L. Zhao, H. Q. Ta, T. Gemming, H. Liu, Z. Liu and M. H. Rummeli, Chem. Soc. Rev., 2019, 48, 72–133 RSC.
- M. Alhabeb, K. Maleski, B. Anasori, P. Lelyukh, L. Clark, S. Sin and Y. Gogotsi, Chem. Mater., 2017, 29, 7633–7644 CrossRef CAS.
- N. H. Attanayake, H. R. Banjade, A. C. Thenuwara, B. Anasori, Q. Yan and D. R. Strongin, Chem. Commun., 2021, 57, 1675–1678 RSC.
- X. Zhang, Z. Zhang, J. Li, X. Zhao, D. Wu and Z. Zhou, J. Mater. Chem. A, 2017, 5, 12899–12903 RSC.
- A. D. Handoko, H. Chen, Y. Lum, Q. Zhang, B. Anasori and Z. W. Seh, iScience, 2020, 23, 101181 CrossRef CAS.
- I. Persson, J. Halim, H. Lind, T. W. Hansen, J. B. Wagner, L.-Å. Näslund, V. Darakchieva, J. Palisaitis, J. Rosen and P. O. Å. Persson, Adv. Mater., 2019, 31, 1805472 CrossRef PubMed.
- Á. Morales-García, A. Fernández-Fernández, F. Viñes and F. Illas, J. Mater. Chem. A, 2018, 6, 3381–3385 RSC.
- B. Wang, A. Zhou, F. Liu, J. Cao, L. Wang and Q. Hu, J. Adv. Ceram., 2018, 7, 237–245 CrossRef CAS.
- N. Li, X. Chen, W. J. Ong, D. R. Macfarlane, X. Zhao, A. K. Cheetham and C. Sun, ACS Nano, 2017, 11, 10825–10833 CrossRef CAS.
- A. D. Handoko, K. H. Khoo, T. L. Tan, H. Jin and Z. W. Seh, J. Mater. Chem. A, 2018, 6, 21885–21890 RSC.
- Q. Zhao, C. Zhang, R. Hu, Z. Du, J. Gu, Y. Cui, X. Chen, W. Xu, Z. Cheng, S. Li, B. Li, Y. Liu, W. Chen, C. Liu, J. Shang, L. Song and S. Yang, ACS Nano, 2021, 15, 4927–4936 CrossRef CAS.
- H. Bao, Y. Qiu, X. Peng, J. A. Wang, Y. Mi, S. Zhao, X. Liu, Y. Liu, R. Cao, L. Zhuo, J. Ren, J. Sun, J. Luo and X. Sun, Nat. Commun., 2021, 12, 1–9 CrossRef PubMed.
- A. B. Laursen, A. S. Varela, F. Dionigi, H. Fanchiu, C. Miller, O. L. Trinhammer, J. Rossmeisl and S. Dahl, J. Chem. Educ., 2012, 89, 1595–1599 CrossRef CAS.
- N. Guha, A. K. Gupta, S. Chatterjee, S. Krishnan, M. K. Singh and D. K. Rai, J. CO2 Util., 2021, 49, 101575 CrossRef CAS.
- C. Zhao, Q. Wang, H. Zhang, S. Passerini and X. Qian, ACS Appl. Mater. Interfaces, 2016, 8, 15661–15667 CrossRef CAS PubMed.
- B. Aïssa, A. Ali, K. A. Mahmoud, T. Haddad and M. Nedil, Appl. Phys. Lett., 2016, 109, 043109 CrossRef.
- A. Sarycheva and Y. Gogotsi, Chem. Mater., 2020, 32, 3480–3488 CrossRef CAS.
- S. Krishnan, S. Chatterjee, A. Solanki, N. Guha, M. K. Singh, A. K. Gupta and D. K. Rai, ACS Appl. Nano Mater., 2020, 3, 11203–11216 CrossRef CAS.
- E. Lee, A. Vahidmohammadi, B. C. Prorok, Y. S. Yoon, M. Beidaghi and D. J. Kim, ACS Appl. Mater. Interfaces, 2017, 9, 37184–37190 CrossRef CAS PubMed.
- L. Mino, G. Spoto and A. M. Ferrari, J. Phys. Chem. C, 2014, 118, 25016–25026 CrossRef CAS.
- G. Singh, K. S. Lakhi, I. Y. Kim, S. Kim, P. Srivastava, R. Naidu and A. Vinu, ACS Appl. Mater. Interfaces, 2017, 9, 29782–29793 CrossRef CAS.
- M. Senthilkumaran, C. Saravanan, P. Puthiaraj, P. Rameshkumar, G. P. Kalaignan and P. Muthu Mareeswaran, Mater. Chem. Phys., 2020, 256, 123750 CrossRef CAS.
- C. Chen, B. Li, L. Zhou, Z. Xia, N. Feng, J. Ding, L. Wang, H. Wan and G. Guan, ACS Appl. Mater. Interfaces, 2017, 9, 23060–23071 CrossRef CAS PubMed.
- N. Guha, S. Krishnan, S. Gupta and D. K. Rai, ChemNanoMat, 2023, 9, e202200519 CrossRef CAS.
- H. Zhong, K. Fujii and Y. Nakano, J. Electrochem. Soc., 2017, 164, F923–F927 CrossRef CAS.
- M. König, J. Vaes, E. Klemm and D. Pant, iScience, 2019, 19, 135–160 CrossRef PubMed.
- H. Zhong, K. Fujii, Y. Nakano and F. Jin, J. Phys. Chem. C, 2015, 119, 55–61 CrossRef CAS.
- T. Chatterjee, E. Boutin and M. Robert, Dalton Trans., 2020, 49, 4257–4265 RSC.
- K. Eid, Q. Lu, S. Abdel-Azeim, A. Soliman, A. M. Abdullah, A. M. Abdelgwad, R. P. Forbes, K. I. Ozoemena, R. S. Varma and M. F. Shibl, J. Mater. Chem. A, 2022, 10, 1965–1975 RSC.
- Y. Xiao and W. Zhang, Nanoscale, 2020, 12, 7660–7673 RSC.
- X. Qian, L. Li, Y. Li, Z. Liu, Z. Tian, C. Zhan and L. Chen, Phys. Chem. Chem. Phys., 2021, 23, 12431–12438 RSC.
- Z. Miao, W. Liu, Y. Zhao, F. Wang, J. Meng, M. Liang, X. Wu, J. Zhao, S. Zhuo and J. Zhou, Catal. Sci. Technol., 2020, 10, 967–977 RSC.
- Z. Yan, X. Wang, Y. Tan, A. Liu, F. Luo, M. Zhang, L. Zeng and Y. Zhang, Catal. Sci. Technol., 2021, 11, 6742–6749 RSC.
- F. Bienen, D. Kopljar, A. Löwe, S. Geiger, N. Wagner, E. Klemm and K. A. Friedrich, ACS Sustainable Chem. Eng., 2020, 8, 13759–13768 CrossRef CAS.
- F. Bienen, D. Kopljar, S. Geiger, N. Wagner and K. A. Friedrich, ACS Sustainable Chem. Eng., 2020, 8, 5192–5199 CrossRef CAS.
Footnotes |
| † Electronic supplementary information (ESI) available. See DOI: https://doi.org/10.1039/d3ya00117b |
| ‡ These authors contributed equally to this work. |
| This journal is © The Royal Society of Chemistry 2023 |