
 Open Access Article
 This Open Access Article is licensed under a Creative Commons Attribution-Non Commercial 3.0 Unported Licence
Organic ionic plastic crystals: flexible solid electrolytes for lithium secondary batteries
Morgan L.
Thomas
 a,
Kan
Hatakeyama-Sato†
b,
Shinkoh
Nanbu
a and
Masahiro
Yoshizawa-Fujita
*a
a,
Kan
Hatakeyama-Sato†
b,
Shinkoh
Nanbu
a and
Masahiro
Yoshizawa-Fujita
*a
aDepartment of Materials and Life Sciences, Sophia University, 7-1 Kioi-cho, Chiyoda-ku, Tokyo 102-8554, Japan. E-mail: masahi-f@sophia.ac.jp
bDepartment of Applied Chemistry, Waseda University, 3-4-1 Okubo, Shinjuku-ku, Tokyo 169-8555, Japan
First published on 25th April 2023
Abstract
The growing global demand for energy has led to the active development of efficient energy generation and storage technologies, driving the development of electrochemical devices such as high-energy density rechargeable batteries, fuel cells and solar cells. One of the essential materials for the development of high-performance electrochemical devices is the electrolyte. Currently, flammable electrolyte solutions are used, causing problems such as leakage and ignition incidents. It would be significant if the electrolyte could be replaced with a solid electrolyte, as this would eliminate these problems. In addition, with the increasing size of electrochemical devices, there is a societal demand for safer electrochemical devices, and the development of high-performance solid electrolytes is becoming more active. Although development has mainly focused on inorganic and solid polymer electrolytes, organic ionic plastic crystals (OIPCs) are beginning to attract attention as new candidates for flexible solid electrolytes. In this review, we describe OIPCs for lithium secondary batteries. Firstly, we introduce OIPCs and OIPC/polymer composites as lithium-ion conductors and discuss the effects of ionic architecture and polymer species on their ionic conduction. Secondly, we present recent progress in the development of lithium secondary batteries with OIPC-based solid electrolytes.
 Morgan L. Thomas | Morgan L. Thomas undertook undergraduate studies at the University of Bath (U.K.), and he received his PhD in 2008 from the University of Nottingham (U.K.). This was followed with post-doctoral experiences at RWTH Aachen (Germany), the University of Saskatchewan, York University and McGill University (Canada), RIKEN and Yokohama National University (Japan). He joined Sophia University as a specially appointed associate professor in 2019. His research interests are clean technologies, with a particular interest in solvent and electrolyte systems, and green chemistry. |
 Kan Hatakeyama-Sato | Kan Hatakeyama-Sato obtained his PhD in Chemistry from Waseda University in 2018. His PhD work was conducted on redox polymers and their electrochemistry. From 2018 to 2023, he worked in the same University as an assistant professor, and began the data science study for chemistry. |
 Shinkoh Nanbu | Shinkoh Nanbu graduated from the Department of Chemistry, Faculty of Science and Technology, Keio University with a Japan Society for the Promotion of Science (JSPS) fellowship (DC). Working at the Institute for Molecular Science Computer Center as research-associate, conducted development of a theory for quantum chemical reaction dynamics at Argonne National Laboratory in the state of Illinois, US. Worked at Kyushu University before assuming his current position in 2009. His research themes revolve around nonadiabatic phenomena, elementary processes, isotopologues, and photochemical reactions in the condensed phase. |
 Masahiro Yoshizawa-Fujita | Masahiro Yoshizawa-Fujita received his PhD degree (2002) from Tokyo University of Agriculture and Technology (Japan). During his PhD studies, he received a Research Fellowship for Young Scientists at the Japan Society for the Promotion of Science (JSPS). He spent two years as a postdoctoral research fellow at Monash University (Australia). He moved to Sophia University as an Assistant Professor in 2006. He was promoted to Associate Professor in 2011 and to Professor in 2019. His recent research activities are concerned with the design of ionic liquids, ionic plastic crystals, and solid polymer electrolytes, especially for battery technologies and biomass processing. |
1. Introduction
Growing interest in energy issues has increased demand for large batteries that can be used in electric vehicles and home power sources. Lithium-ion batteries (LIBs) have become widely used as compact power sources for mobile phones and other devices, but further improvements in safety and energy density are needed to meet these demands.1 However, conventional LIBs have generally reached their performance limits and there is a need to develop new energy storage devices that can be scaled up. Against this background, all-solid-state batteries, in which the cathode, electrolyte, and anode are all made of solid materials, have attracted much attention in recent years.2–4The electrolyte is responsible for conducting the carrier ions between the positive and negative electrodes, while electrically insulating the positive electrode to prevent short circuits. Solid electrolytes are more flame retardant than the organic solvent-based electrolytes used in conventional LIBs, so all-solid-state batteries are expected to be very safe. In addition, high energy densities can be achieved by manufacturing stacked cells; in the case of conventional LIBs, several small batteries are connected in series to achieve high voltages, whereas in all-solid-state batteries, high voltages can be easily achieved by stacking the cathode, electrolyte, anode and current collector. In addition, because the solid electrolyte is not liquid, it can be used as a material in different components of a single cell, i.e. for the positive electrode, negative electrode and separator, providing a high degree of freedom in battery design. There is also the possibility of using high-capacity electrode active materials such as metallic lithium and sulphur,5–8 which have been difficult to use in conventional LIBs, and expectations are high for the realisation of next-generation batteries.
There are two main types of all-solid-state batteries: thin film and bulk. Thin film all-solid-state batteries are made by growing crystals of the cathode, electrolyte and anode on a substrate using the vapour phase method. The advantage of such thin-film batteries is that achieving a good interfacial contact between the electrode and the electrolyte is facile.9,10 However, the amount of active electrode material that can be introduced into a single cell is small, resulting in low battery capacity. Bulk all-solid-state batteries are made by layering fine particles of cathode, electrolyte and anode. The advantage is that a large amount of electrode active material can be introduced, enabling the production of high capacity batteries.11 However, high cell resistance is caused by the thick electrolyte layer and many particle interfaces. Therefore, the development of solid electrolytes with excellent ionic conductivity and the formation of good particle interfaces are important issues for the practical application of bulk all-solid-state batteries.
Plastic crystals (PCs) are defined as solid materials that are composed of regularly aligned three-dimensional crystal lattices, but at the molecular level, there is a local orientational/rotational disorder. Since the molecular and ionic species in the plastic crystal phase have a higher degree of freedom than in the normal crystal state, PCs are crystalline solids exhibiting plasticity and diffusivity of constituents. The features of PCs found in early studies are summarized below.
(1) One or more solid–solid phase transitions before melting.
(2) Small change in entropy of fusion (ΔSf).
(3) High plasticity.
Timmermans reported that PCs exhibit a ΔSf value below 5 e.u. (20.92 J K−1 mol−1)‡ due to the initiation of rotational or translational motion of the constituents in the solid phases.12 PCs are classified into non-ionic compounds and ionic compounds. Succinonitrile is known as a non-ionic PC, and inorganic crystals such as Li2SO4 and α-Na3PO4 and organic crystals such as ammonium salts are known as ionic PCs. Recently, both systems are attracting much attention as soft solid electrolytes.13–18 In this paper, organic ionic compounds showing a PC phase will be referred to as organic ionic plastic crystals (OIPCs).
In the 1980s and 1990s, OIPCs based on ammonium salts were reported by mainly Japanese researchers.19–26 Recently, new OIPCs with pyrrolidinium,27–30 imidazolium,31,32 phosphonium,33,34 and metallocenium35–37 cations have been discovered and vigorously studied. Regarding anions, not only common anions of interest such as BF4− and PF6− but also B(CN)4−,38 FeCl4−,38 B(CH2CH3)3(CH3)−,39 perfluorobutane sulfonate,40 and various other anion species have been reported. Chiral ions such as camphor sulfonate have also been reported.41 The variety of OIPCs is steadily increasing year by year. Summarizing the structural features of OIPCs reported so far, it appears that disk-shaped and spherical ions tend to exhibit a PC phase. This structural feature is also common to molecular PC compounds such as fullerenes. OIPCs have many variations in molecular structure, and by changing the combination of cations and anions, the physicochemical properties of the compounds can be tuned, so they are actively studied as electrolytes for various electrochemical devices.15,18 This paper describes the development of lithium-ion conductors and lithium secondary batteries using OIPCs.
2. Lithium-ion conductors
In 1986, Cooper et al. reported lithium-ion conductors based on OIPCs consisting of ammonium salts.19 Then, in 1999, MacFarlane et al. reported a lithium-ion conductor based on N-ethyl-N-methylpyrrolidinium salt.28 After these reports, there have been many kinds of OIPCs proposed as solid electrolytes for lithium batteries. Fig. 1 shows the chemical structure of OIPCs reported as lithium-ion conductors. Although the types of OIPCs are increasing year by year, the majority of studies use pyrrolidinium salts, ammonium salts, and phosphonium salts because the starting materials for these salts are inexpensive and easily available, and the synthesis of onium salts is simple. Furthermore, these salts have excellent electrochemical stability and thermal stability, making them ideal as electrolyte materials. | ||
| Fig. 1 Chemical structures of OIPCs reported as lithium-ion conductors. | ||
2.1 Pyrrolidinium cations
Following the report of the pyrrolidinium salt 1a as a lithium-ion conductor,28 further research was carried out focusing on the pyrrolidinium cation 1 with various anions. It was found that 1b exhibited a plastic crystal phase over a wide temperature range, including room temperature, and had high ionic conductivity.421b showed a transition temperature between solid phases at −70 and −22 °C and a melting point at 205 °C. The solid phases observed in the temperature range below the melting point are defined as Phase I, II, and III (in order from the high-temperature side), and the transition temperatures between each of the solid phases are denoted TI–II and TII–III. The change in entropy of fusion (ΔSf) for 1b was 11 J K−1 mol−1, which is consistent with that of the Timmermans criterion (<20.92 J K−1 mol−1).12 This suggests that 1b is an OIPC in a wide temperature range of −22 to 205 °C, and it is interesting as an electrolyte material because it is a soft solid over a wide temperature range, including room temperature. Fig. 2 shows the photographs of 1b at room temperature. Qualitatively, it is a plastic solid that is extremely soft at room temperature and easily deforms when a force is applied, which is consistent with the characteristics of plastic crystals. It can also be processed into a self-standing film, and the obtained film can be deformed freely.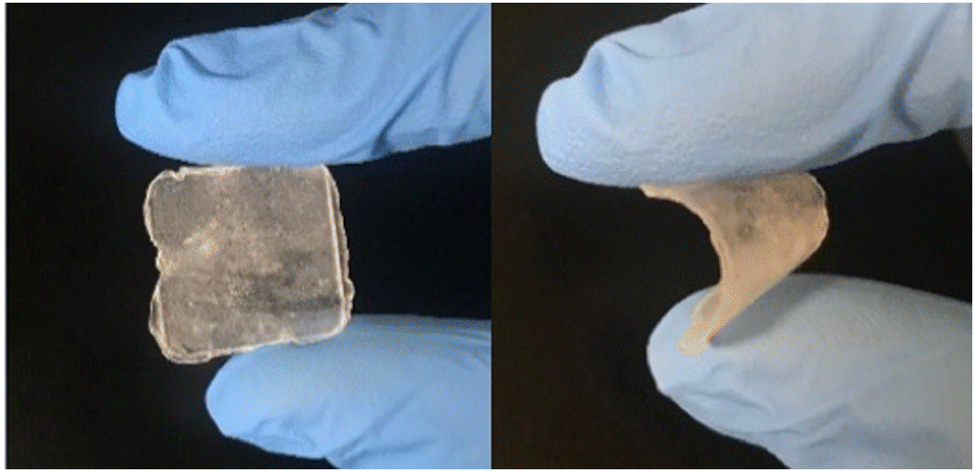 | ||
| Fig. 2 Photographs of 1b at room temperature. | ||
The ionic conductivity in Phase I of 1b increased linearly with increasing temperature, showing an Arrhenius-type temperature dependence (Fig. 3). It was suggested that the ions exhibit hopping conduction in the solid. The ionic conductivity in Phase II was as low as 10−8 S cm−1 or less but increased by about an order of magnitude in TI–II. It is considered that the rotational and translational motions of the constituent ions started in Phase I, leading to the high diffusivity of these ions. The ionic conductivity of 1b was 1.23 × 10⁻⁶ S cm−1 at 25 °C, which is about two orders of magnitude higher than that of 1a, which has a similar anion structure. The physicochemical properties changed significantly due to the slight difference in the anion structure. The influence of the cation structure on various properties was also investigated. 2b, 3b, and 4b with varying side chain lengths of pyrrolidinium cation 1 were synthesized.43–46 All compounds showed multiple solid–solid phase transitions, and ΔSf was 20.92 J K−1 mol−1 or less, suggesting that these salts are OIPCs. The ionic conductivity of 2b, 3b, and 4b in Phase I also exhibited Arrhenius type behavior. The ionic conductivity values of 2b, 3b, and 4b were 1.3 × 10⁻⁸ (25 °C), 1.3 × 10⁻⁵ (25 °C), and 1.7 × 10⁻⁶ S cm−1 (30 °C), respectively. Thus, higher ionic conductivity was observed in the order 2b < 1b < 4b < 3b, and the ionic conductivity of pyrrolidinium salts was improved with the extension of the alkyl side chain. When 5 mol% of lithium bis(fluorosulfonyl)amide (LiFSA) was added to these pyrrolidinium salts, the ionic conductivity values of 2b/LiFSA, 1b/LiFSA, and 3b/LiFSA were 2.8 × 10⁻⁶, 1.1 × 10⁻⁵, and 5.8 × 10⁻⁴ S cm−1 at 25 °C, respectively. In each system, the ionic conductivity was improved by about an order of magnitude as compared with the pristine salt (Fig. 3). The ionic conductivity of 4b/LiFSA (10 mol%) was 4.0 × 10⁻⁴ S cm−1 at 30 °C. As with other pyrrolidinium salts, the addition of Li salt improved the ionic conductivity.
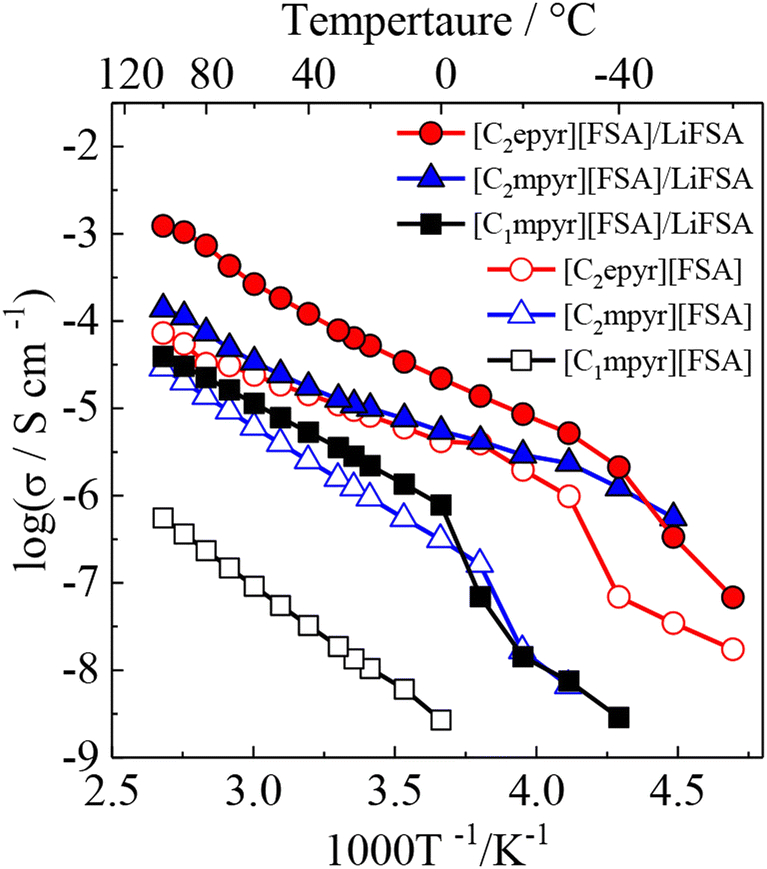 | ||
| Fig. 3 Arrhenius plots of ionic conductivities for neat pyrrolidinium salts (1b ([C2mpyr][FSA]), 2b ([C1mpyr][FSA]), 3b ([C2epyr][FSA])) and 5 mol% LiFSA-doped ones. Reprinted from ref. 43 with permission. | ||
The lithium-ion transport number (tLi+) of 3b/LiFSA (5 mol%) was 0.27.43 The tLi+ values of high-concentration electrolytes containing 50 mol% of LiFSA added to 3b and 4b have been reported. The tLi+ of 3b/LiFSA and 4b/LiFSA were 0.3944 and 0.46,45 respectively, and 4b showed higher values. It was suggested that the isopropyl group, which is a branched chain, is a functional group that promotes lithium-ion transport. Further improvement of tLi+ can be expected by optimizing the side-chain structure of the cation. The tLi+ of the composite of N-methyl-N-propylpyrrolidinium bis(fluorosulfonyl)amide and LiFSA, which has a chemical structure similar to that of 3b and 4b, is only 0.14,47 lower than those of 3b/LiFSA and 4b/LiFSA. It was revealed that OIPCs, which are solids, are superior to ionic liquids in lithium-ion transport. It has been reported that a system in which the lithium salt itself becomes an OIPC is effective for further improvement of tLi+.48 The system in which the lithium salt itself is an OIPC has a high lithium-ion concentration because half of the component ions are lithium ions. On the other hand, it is difficult to achieve a high concentration of lithium salt in OIPC/lithium-salt composites because the melting point lowers and it may become liquid at room temperature when over 10 mol% of lithium salt is added. The tLi+ of the Li salt using d as an anion was 0.7, which is a high value that is difficult to realize not only in OIPC/Li salt composite s but also in liquid electrolyte solutions. The OIPC characteristics of certain Li salts themselves is an interesting theme.
2.2 Other nitrogen-based cations
There are many reports on nitrogen-based cations other than pyrrolidinium salts. Abu-Lebdeh et al. evaluated the phase transition behavior and ionic conductivity of spiroammonium salts 5a–9a.49 Of the five spiroammonium salts, 5a, 6a, and 7a showed a plastic crystal phase. Furthermore, among the three OIPCs, 6a showed the highest ionic conductivity, which was 2.0 × 10⁻⁶ S cm−1 at 20 °C. The ionic conductivity of the 6a composite with 5 mol% of lithium bis(trifluoromethylsulfonyl)amide (LiTFSA) was 1.2 × 10⁻⁶ S cm−1 at 20 °C, and thus the ionic conductivity in the solid phase was about the same before and after the addition of the Li salt. In general, the ionic conductivity of OIPC is improved by the addition of Li salt. These spiroammonium cations are alicyclic and are considered to have a limited degree of freedom compared to pyrrolidinium cations with alkyl side-chains. The side-chain structure of pyrrolidinium cations was found to greatly affect ionic conductivity, which is consistent with the findings already mentioned.In addition to the spiroammonium salts, 10a, which is an alicyclic OIPC using 1,4-diazabicyclo[2.2.2]octane (DABCO), has been reported.50,51 It differs from the pyrrolidinium and spiroammonium salts in that a diamine is used as a starting material. When the diamine is monocationized, an ammonium salt containing a tertiary amine is obtained, and it can be expected that the Lewis basic tertiary amine moiety interacts with the Li-ion to promote the dissociation of the Li salt. The transition temperature and melting point of 10a were 33 and 76 °C, respectively, and the ΔSf was 25.3 J K−1 mol−1. This is slightly larger than the Timmermans criterion (<20.92 J K−1 mol−1). It is known that ΔSf of OIPCs having TFSA anions shows a value larger than the Timmermans criterion because of the residual entropy based on the conformations of the TFSA anion.13 The temperature dependence of the ionic conductivity of 10a showed typical OIPC behavior. The ionic conductivity increased at the phase transition temperature from Phase II to I. When LiTFSA was added to 10a, the ionic conductivity in Phase I improved by up to an order of magnitude compared to the value before the addition of LiTFSA. As a result of 7Li NMR measurement, a low magnetic field shift based on the interaction between Li-ion and 10 tertiary amines was observed. It is considered that the promotion of dissociation of Li salt contributes to the improvement of ionic conductivity, and it is expected that it can be utilized as one of the new molecular design guidelines of OIPCs.
Although the number of reports on aliphatic ammonium salts is small, there are many structural variations (11–16).52–54 Yunis et al. reported 6 types of ammonium salts by combining 11, 12, 13, and a and b, and comprehensively discussed their ion conduction behavior.52 The results of DSC measurements suggest that 5 of the ammonium salts (all except 11a) are OIPCs. The temperature range of Phase I of 12b is −8 to 133 °C, and among the 6 ammonium salts, 12b showed the highest ionic conductivity, which is 9.9 × 10⁻⁶ S cm−1 at 30 °C. It is already known that the ionic conductivity in OIPCs correlates with the defect volume.55 The correlation between the free volume and the ionic conductivity obtained by the positron annihilation method was investigated. In the TFSA system, the larger the free volume of OIPC, the higher the ionic conductivity, which is consistent with conventional knowledge. On the other hand, in the FSA system, no correlation was found between the free volume and the ionic conductivity. In the case of the FSA system, it is therefore suggested that the free volume is not a regulator of ionic conductivity, which is an interesting result. Recently, it has been reported that there is a correlation between the ionic radius ratio (ρ) and the ionic conductivity (Fig. 4),56,57 and the understanding of the molecular design guidelines for high ionic conductivity OIPCs is deepening. Further elucidation of the controlling factors of ionic conductivity is awaited.
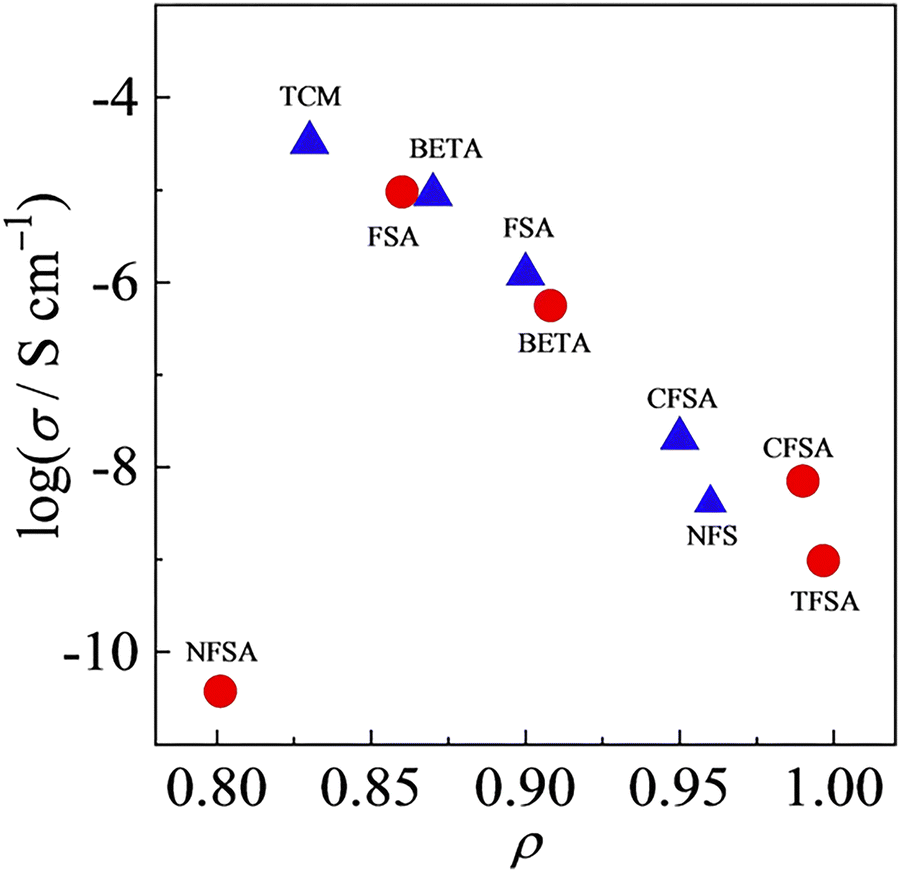 | ||
| Fig. 4 Relationship between ionic conductivity value at 25 °C and ρ for 1-(blue triangle) and 3-based salts (red circle) with various anion species. Reprinted from ref. 57 with permission. | ||
Additionally, ammonium salts comprised of a combination of 14 having a cyano group introduced in the side chain and various anions (b, e, f, g, h),58 and 17a, which has organosilicon introduced into the side chain,59 have been reported. Since the cyano group forms a protective film on the surface of metallic lithium, it is known to improve the electrochemical stability of the electrolyte and the redox cycle characteristics of lithium,60,61 and similar effects can be expected with such OIPCs. Four of the 14 salts (all except 14h) showed solid–solid phase transitions in DSC measurements. The ionic conductivity in Phase I (30 °C) showed values in the following order (only 14g was compared with Phase II values): 14d (6.6 × 10⁻⁸ S cm−1), 14b (2.1 × 10⁻⁸ S cm−1), 14g (6.7 × 10⁻⁹ S cm−1), 14f (7.2 × 10⁻¹⁰ S cm−1). The ionic conductivity of the systems in which 10 mol% Li salt was added to 14b and 14e showed different behavior. The ionic conductivity of 14b/LiFSA improved by more than 3 orders of magnitude compared to the value of 14b. On the other hand, the ionic conductivity of 14e/LiBF4 was less than an order of magnitude greater than that of 14e. When the Li salt concentration was increased to 50 mol%, 14b became a liquid at room temperature. This electrolyte showed a high tLi+, 0.56 at 50 °C. Since the redox behavior of lithium was also stable, it is presumed that various properties were improved by the effect of the cyano group. As described above, the introduction of a functional group into the cationic structure leads to the addition of other properties, which is one of the advantages of organic-based OIPCs. There are many variations of nitrogen cations that can be employed to form the skeleton of the cation; pyrazolium cations (18–23)62–64 and guanidinium cations (24)65 have also been reported. Volel et al. evaluated the mechanical properties of pyrazolium salts 18a–22a using atomic force microscopy (AFM).66 The Young's modulus of these pyrazolium salts was 100 MPa or less in the solid phase below the melting point and thus showed a value equivalent to that of elastomers (10 to 100 MPa). The Young's modulus changed before and after the phase transition and decreased by about 10 to 30 MPa in the solid phase on the high-temperature side. Few reports quantify the softness of OIPCs, and it is difficult to make a comprehensive comparison. In the future, it will be necessary to accumulate more data on mechanical properties.
2.3 Phosphonium cations
Although the number of variants of the cation structure is inferior to those of the nitrogen cation systems, the development of lithium-ion conductors using phosphonium salts has also been vigorously performed. Armel et al. synthesized 15 phosphonium salts by combining 25–28 cations with a, b, e, f, h, and i anions.67 Among these, 12 of the phosphonium salts showed a plastic crystal phase. The cations 26 to 28 have an isobutyl group in the side chain, suggesting that the branched structure is advantageous for expression of the plastic crystal phase. However, the melting points of 25b, 27b, and 28b, which exhibit a transition between solid phases, are 47, 4, and 36 °C, respectively, which are lower than those of the nitrogen-based cation system. The introduction of phosphonium cations and isobutyl groups appears to lead to lower melting points for the OIPCs. The ionic conductivity of these phosphonium salts was also evaluated. Interestingly, the ionic conductivity of 26i at 40 °C (phase I) was comparable to that of 28b in the molten state (1.75 × 10⁻³ S cm−1). The alkyl chain having a branched structure seems to be a functional group exhibiting a specific ionic conduction behavior and will be one of the structures to be utilized widely in the future.Detailed analysis of the ion-conductive mechanism in a phosphonium salt was performed using solid-state NMR.33 The solid–solid phase transition temperatures of 26f are 25 (TIII–IV), 70 (TII–III), 120 °C (TI–II), and the melting point is 150 °C. The ionic conductivity in each solid phase is 10−10 S cm−1 (phase IV), 10−8 to 10−6 S cm−1 (phase III), 10−5 to 10−4 S cm (phase II), and 10−3 S cm−1 (phase I). The ionic conductivity jumped at each solid–solid phase transition temperature. Based on the analysis results by solid-state NMR, isotropic rotation of 26 alkyl groups and e occurs in phase IV, and lattice defects occur due to uniaxial rotation of 26 in phase III, and thus the diffusion of e occurs. It was clarified that in phase II, isotropic rotations of 26 occurred, and the main diffusing species was e, and in phase I, both e and 26 diffused. There are reports using magnetic resonance imaging (MRI),68,69 and there is no doubt that NMR is an effective tool for analyzing the mechanism of ion conduction.
3. Ion conduction in OIPCs
Understanding the ion conduction mechanisms in OIPCs is a very important research topic, as it is essential for further improving their ionic conductivity as a practical requirement for rechargeable batteries. Two promising techniques (NMR techniques and MD simulations) for elucidating the ion conduction mechanisms are presented here.3.1 NMR techniques
The application of nuclear magnetic resonance (NMR) techniques to provide crucial insights into the thermochemical phenomena, dynamics and compositional variations of OIPCs for lithium batteries has been well-developed. Experimental progress in this field has built on a great deal of earlier work with OIPCs with simple anions, for example ammonium halides.70–72 The analysis of OIPCs relevant to Li battery application, and in many cases with the addition of alkali metal salts, by variable-temperature solid state NMR has been undertaken by a number of different approaches,73,74 including (i) chemical shift analysis, (ii) linewidth/lineshape analysis, (iii) self-diffusion coefficient measurements, and (iv) imaging.Regarding the determination of chemical shifts and their variation upon e.g. addition of alkali metal salts, various authors have employed such analyses to further develop understanding of interionic interactions in OIPCs. We note that whilst the primary focus of this review is on Li+-containing OIPCs, some specific finding for Na+ are also relevant. For example, Forsyth and co-workers described the existence of a second, Na+-rich, phase in 1a/NaTFSA, based in part on the observation of splitting of the 19F and 13C NMR signals, measured under magic angle spinning (MAS) conditions, into multiple peaks at high Na+ content.75
The exploration of linewidth/lineshape for elucidation and understanding of molecular motion was explored early in the development of OIPC-based Li+ electrolytes. For analysis of Li mobility, Forsyth et al. observed that for 1a/LiTFSA, the presence of a sharp 7Li signal overlaying a broader peak implies the presence of both higher and lower mobility Li+ ions (Fig. 5).29 However, MacFarlane et al. also note that some caution is necessary, as the assumed mobility leading to line narrowing does not necessarily imply that Li itself is undergoing increased mobility or related processes; the narrowing of the peak may also be due to the influence of neighbouring nuclei/species with increasing mobility.28 Nevertheless, such measurements are facile, and continue to be successfully applied for various OIPC/Li salt systems. Pringle and co-workers noted an apparently higher mobility for the 3 cation in 3b in the presence of LiFSA based on a narrowing of the 1H signal,44 and more recently applied 7Li lineshape analysis for understanding mobilities in 1e/LiFSA, and its comparison with similar zwitterionic/Li salt materials.76
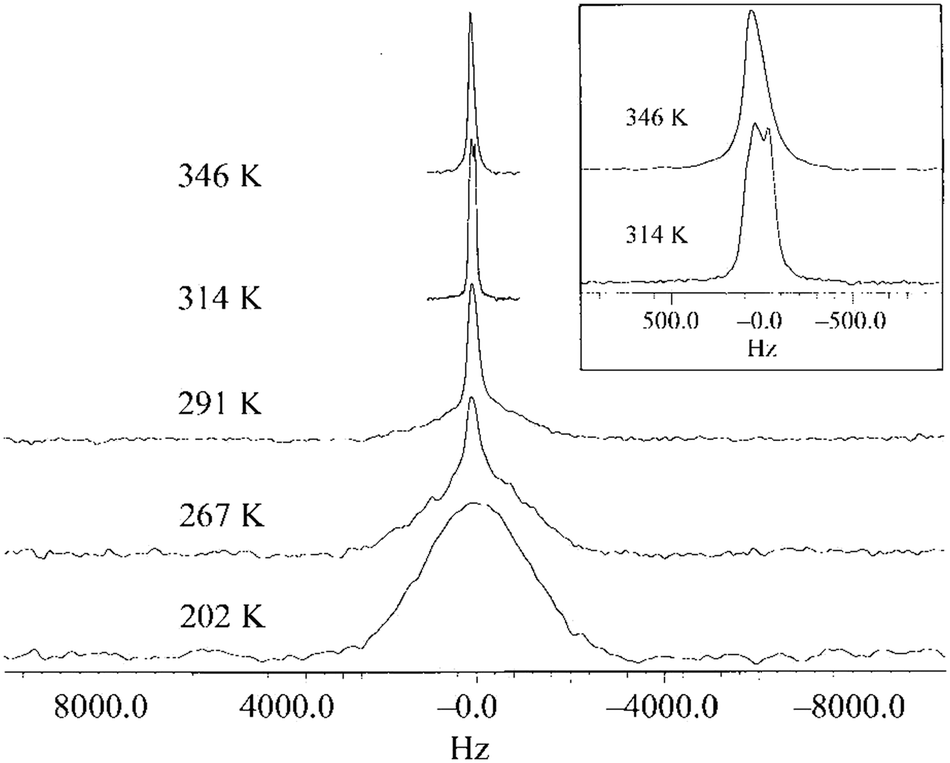 | ||
| Fig. 5 7Li NMR spectra for 9.3 mol% LiTFSA in 1a, as a function of temperature. The inset is an expansion of the peaks for 314 K and 346 K. Reprinted from ref. 29 with permission. | ||
Beyond qualitative consideration of linewidths, consideration of chemical shift anisotropy (CSA) can be used to derive important details about mobility. Pringle et al. proposed the axial rotation of the cation upon heating through consideration of CSA (specifically the shape of the peak) for 31P in neat 25b. Furthermore, the authors estimated the CSA symmetry parameter for 19F at various temperatures by modelling (3-site jump process) and comparison with the experimental data, providing key insights into the anion mobility, and enabling the estimation of activation energy.77 A further quantitative approach to linewidth analysis has also been employed, allowing the temperature-dependent correlation time (inverse of jump/hop frequency) and the corresponding activation energy to be determined from the linewidths by application of the Bloembergen, Purcell, and Pound model.78 Quantitative analyses such as these allow for more detailed examination of the ion mobility phenomena and comparison between similar systems.
Self-diffusion coefficients, measured using pulsed field gradient (PFG) NMR, can provide important details on the relative mobility of components. For example, Pringle et al. reported that the self-diffusion coefficient for Li+ was the highest of all components in 3b with 90 mol% LiFSA, resulting in a relatively high transference number of 0.63 (in good agreement with the electrochemically determined value of 0.68).44 Similar results for 90 mol% LiFSA in a zwitterion (i.e. Li cation showing the highest mobility) were also reported more recently.76
Within the plethora of imaging strategies available to NMR users, many powerful imaging techniques are based on evaluation of the transverse relaxation time constant, T2*,79 which is a measure of the decay in transverse magnetization resulting from both spin–spin relaxation and magnetic field inhomogeneities. Specifically, Romanenko and co-workers demonstrated the utilisation of pulse sequences employing single point ramped imaging with T1 enhancement (SPRITE) to probe anisotropy and develop understanding of the orientation of grain boundaries in polycrystalline OIPCs such as 25b and 26f.80 Indeed, their step-by-step progress in these measurements identified thermal-history derived variations in crystallite alignment,68,81 morphological changes upon solid–solid phase transitions (variable-temperature),82 and ultimately culminated in a landmark in operando study on a lithium cell with 28b/LiFSA electrolyte.69Fig. 6 shows the variation in Li+ ion distribution in a symmetric Li–Li cell during galvanostatic stripping and plating. The authors comment on the role of the ion conduction mechanism, grain boundaries, and presence of Li depleted domains (essentially neat OIPC) in the bulk in relation to the possible applications of OIPCs for Li batteries. Although technically challenging as compared to more routine chemical shift, lineshape and conventional diffusion measurements, further development of this (and other83) imaging techniques is expected to contribute to further understanding of the importance of grain boundaries, morphology and heterogeneity in OIPC/Li salt electrolyte based devices.
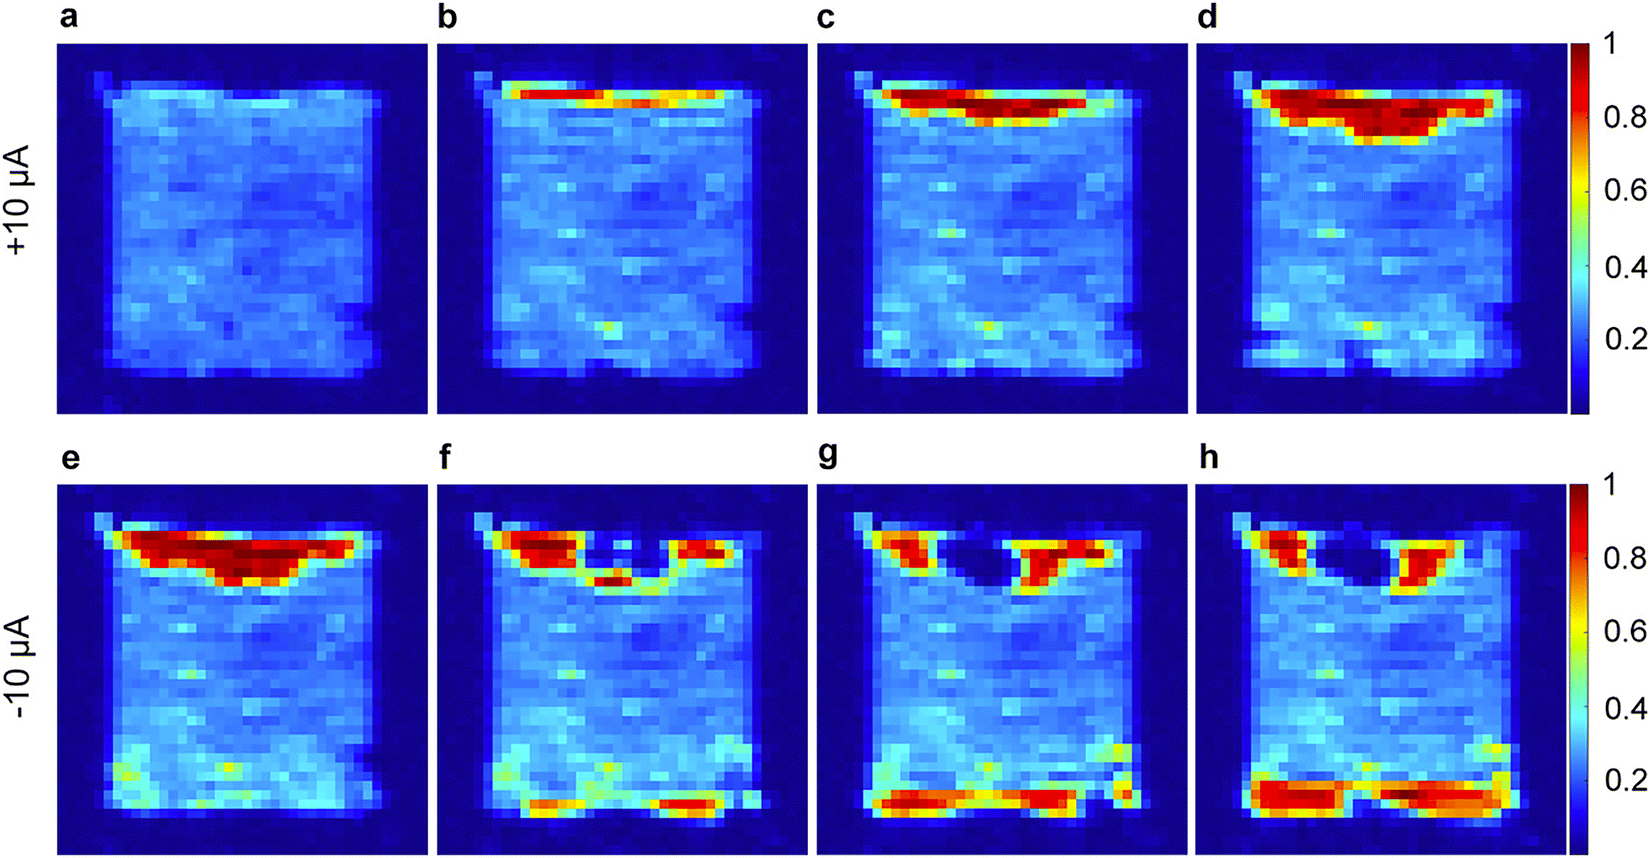 | ||
| Fig. 6 1H SPRITE images of a symmetric cell (Li coated Cu disks) with 4 mol % LiFSA-doped 28b electrolyte under galvanostatic conditions. (a) Initial cell then continuous application of +10 μA for (b) 17 h, (c) 34 h, and (d) 51 h; and reversed polarity (−10 μA) for the same cell for (e) 6 h, (f) 40 h, (g) 57 h, and (h) 77 h. Reprinted from ref. 69 with permission. | ||
3.2 Molecular dynamics and time scales
Probably the first MD (molecular dynamics) study focused on the importance of the rotational motion of anions and cations forming crystals as a dynamic behavior contributing to ionic conductivity and ion transport in OIPCs.84 In this paper, the OIPC 11h was investigated. A unit cell was constructed based on the crystal structure determined by X-ray structural analysis, and the molecular force field and charge distribution given by the CHARMM MD simulation package were used to perform the MD simulation with the DL_POLY simulation package; the NPT ensemble simulation was carried out from T = 200 to 600 K. The results successfully suggest that the rotational motion of both the anion and the cation starts at a slightly lower temperature for the cation than for the anion, while maintaining the crystal lattice near T = 0 K, which is a perfect crystal, and could correspond to the temperature of phase transitions observed experimentally in similar systems. As the unit cell size expands with the phase transition, the position of the peak of the radial distribution function (RDF) is found to shift towards the long-range side. However, the theoretical result at that time could not be directly compared with the experimental results by any means and was verified by comparison with similar OIPCs. However, Jin et al. provided the experimental evidence for the rotational motion with fixing to the lattice site.33 The OIPC 26f was investigated by the analysis of several experimental data (single crystal XRD, multinuclear solid-state NMR, DSC, ionic conductivity, and SEM) and theoretical simulations based on the second moment-based solid-state NMR line-width simulation; the peak in the NMR spectrum suggests molecular rotation, which is a small sharp peak that appears above the centre of the broad peak at temperatures above 333 K. Fig. 7 shows a schematic of molecular motion in different phases (IV to I) of 26f with increasing temperature. Four phases and melting were observed in this system, and it is attributed to the abrupt onset of uniaxial rotational motion of the cation during the transition from phase IV to phase III. This is also the dominant transport mechanism in phase III, where defect formation also results in the diffusion of a small number of anions. All the cations begin to rotate isotropically in phase II, allowing fast diffusion of a minority of cations together with the majority of anions. Perhaps, the most important point is that Jin et al. identified that the formation of defects in the ionic crystal was associated with this fast diffusion.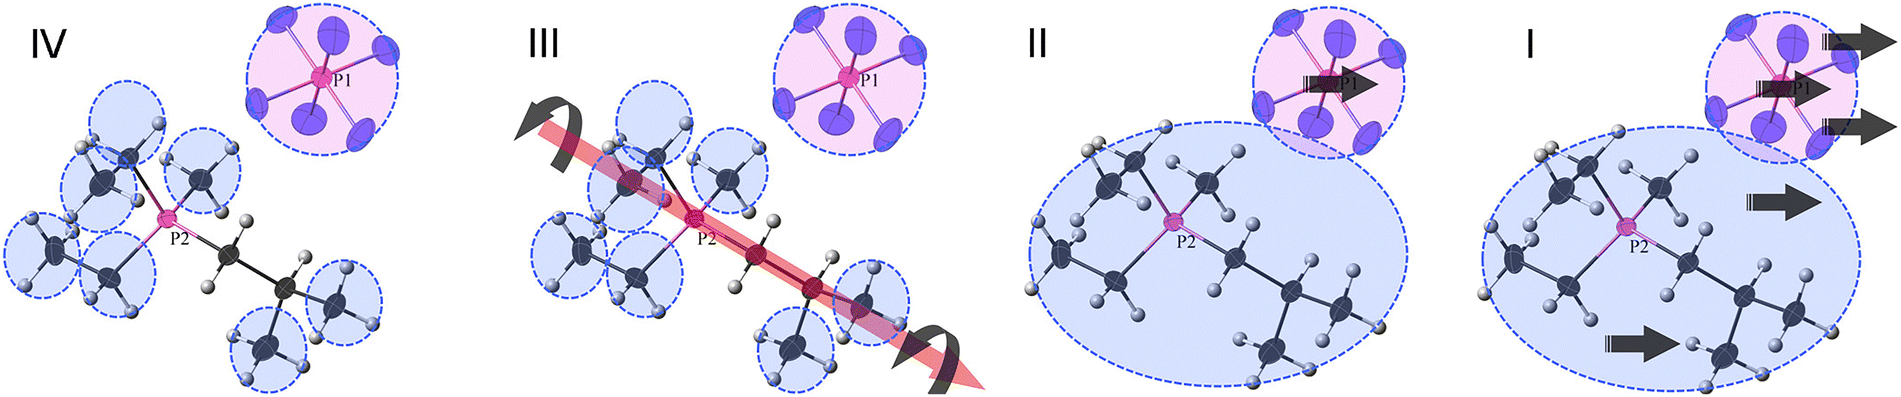 | ||
| Fig. 7 Schematic of molecular motions in different phases (IV to I) of 26f with increasing temperature. Phase IV, only the methyl and ethyl groups of the cation are rotating, but the anion is tumbling (on the NMR time scale); phase III, the whole cation can rotate around one axis, and the anion continues tumbling; phase II, the whole cation can tumble, and the anion both tumbles and diffuses; phase I, both the cation and the anion can diffuse. Reprinted from ref. 33 with permission. | ||
Jin et al. also report the effect of Li ion addition, including the investigation of defect effects, by MD simulation.85 The effect of lithium ion doping into the structure and the cell-dynamics were theoretically analyzed with the OIPC matrix-model 11h, at a complete crystal structure of 128 pairs arranged in a unit cell employed in the literature.84 Here a Li addition procedure was performed by replacing the 11 cation with Li+ to introduce impurities. The number of replacements was 5, 10, and 15. In doing so, Adebahr et al. obtained molecular insights into the significant increase in ionic conductivity when Li+ was added to the plastic crystalline phase of OIPC. In particular, the RDF shows that the plastic crystalline phase is indeed the most sensitive phase to Li+ doping. For example, in the case of a perfect crystalline structure at low temperatures, the RDF value is completely zero at a certain radial value. But when Li+ is added, the RDF value does not reach zero at the same low temperature, which indicates a melting process. This process is assigned to the formation of clusters between the h anion and Li+ in the plastic crystalline phase, which causes a restriction of the rotational dynamics of the h anion on a time scale of about 10 ps. However, on longer time scales, this process creates a “free volume” in the rest of the crystal structure, which promotes the translational motion (diffusion coefficient) of all ionic species, especially h anions that are not trapped in clusters with Li+. The molecular transport model revealed in this paper is to our knowledge the first theoretical clarification of the mechanism for enhanced conduction mechanism observed in Li+-doped OIPCs.
The OIPC model consisting of 11h has been theoretically elucidated so far, although Adebahr et al. could not compare with their theoretical results. Then, the same group performed the analogous simulations for the system consisting of 26f reported in 2012,33 where their experimental data were abundant.86 This simulation revealed new dynamical heterogeneities; the van Hove self-correlation function Gs(r,t) would be likely to be Gaussian distribution, if obtained from the Max–Boltzmann distribution for particles with Brownian motion in Fick's diffusion, which is a uniform diffusion. However, after approximately 50 ps in their simulations, the non-Gaussian shape appears; in other words, a non-uniform diffusion process was observed. The minority of ions with this anomalous dynamic process are identified in the plastic crystal phase. Furthermore, the introduction of vacancies in the crystal structure reveals the coexistence of mobile species in a rigid matrix, supporting the previous explanation for the non-uniform motion constriction based on NMR measurements. Finally, Chen et al. also evaluated the effect of Li+ and Na+ ion addition.87 The mobility of Li+ in this system appears to be higher than that of Na+. It becomes clear that the reason for this phenomenon is due to two different complex-coordination geometries for the first solvation shell of the alkali metal ions. The hopping motion of metal ions proposed here is a migration involving a sequence of destruction and reformation of this solvation structure; in the ion transport of Na+, the exchange between the tetrahedral and triangular solvation shell coordination is dominant, while in Li+, only the cooperative motion between the metal ion and the triangular solvation shell is observed. As a result, Chen et al. proposed that the different geometries and associated potential barrier changes at the solvation structures of alkali metals are responsible for the differences in transport rates. They concluded that such an analysis could be used to screen OIPC systems with different structures and chemistries and to optimize the concentration of Li+ or Na+ for optimal transport. In a subsequent report, magnetic resonance imaging (MRI) analysis revealed that the domains of the crystal exhibit different orientations and anisotropic ionic conduction with high values in certain directions.81 In this paper, Forsyth et al. comprehensively discussed this new understanding, linking molecular-level information from theory and experiment with information at the macroscopic level.
It is very interesting to consider here a series of heterogeneous dynamics in terms of the time scales and observational methods associated with molecular motion. First, Henderson et al. investigated the phase behavior and ionic conductivity of OIPC crystals composed of a mixture of 13a salt and LiTFSA.88 In particular, they observed the temperature-dependent Raman spectra, in which a Raman peak shift attributed to the νS (C4N) vibrational mode was observed, which led to distinguishing the (tg.tg) and (tt.tt) conformations of the 13 cation, where t and g indicate trans- and gauche-type. This study informs us that we can observe femtosecond molecular dynamics in OIPC. Furthermore, as mentioned above, Forsyth et al. have succeeded in observing sub-nanosecond to near-microsecond molecular dynamics by NMR measurement. Of course, they predicted rotational dynamics on picosecond time scales and alkali metal hopping motion on picosecond to nanosecond time scales by theoretical MD simulations. We are eagerly awaiting the observation of molecular dynamics in the picosecond order dynamics, which have not yet been reported.
Now, the addition of alkali metals leads to a large increase in ionic transport capacity, but different amounts and types of alkali metals need to be evaluated. Forsyth et al. performed MD simulations in mixed alkali metal salts. The addition of alkali metal ions was carried out up to 50 mol%. In both systems, the Na/Li ion concentration was found to have different effects depending on the ion species; it was suggested that alkali metal ion aggregates are formed at higher concentrations of alkali metal ions. However, the diffusion of alkali metal ions toward organic cations and anions was not affected by increasing alkali concentration. Some alkali metal ions moved most rapidly in the highest alkali metal concentration systems if the temperature was high enough to overcome the viscosity increase caused by this concentration increase. These transport features in the high concentration systems were attributed to the formation of bulky anion–alkali metal complexes. The authors stated that these complexes could enhance the dynamics of alkali metal ions in a clustered environment by increasing the opportunity to reorganize the ion coordination environment through rearrangement of the aggregates.
The ammonium-based OIPC 11b was investigated in a recent paper; the temperature dependence of the structure and ion dynamics were explored by a combination of single-crystal XRD, synchrotron powder XRD, and MD simulations.89 Both MD simulations and X-ray diffraction showed consistent anisotropic changes in the crystal structure at high temperatures. The ionic force analysis in the simulations additionally revealed that there is a very strong hydrogen-bonding interaction in one direction of the unit cell and that the expansion in this direction is minimal upon heating. It is also explained that this strong interionic force restricts ionic motions such as rotation and translation compared to the 26f system reported in others,90 resulting in low plasticity and high structural order in the high temperature solid phase. The simplicity of the cation and anion motions, i.e., the cation rotation and anion cis–trans transition resulting from the structural simplicity, leads to the simple phase behavior of 11b, in contrast to the complex phase behavior of 26f, which was derived from various levels of rotational, dislocation, and translational motions before the melting phase transition.
4. OIPC/polymer composites
As already mentioned, OIPC is a plastic solid and easily deforms when pressure is applied. When an electrochemical device using OIPC as an electrolyte is fabricated, it is assumed that if excessive pressure is applied to the device, the OIPC will be deformed, and the electrodes will come into contact with each other, resulting in a short circuit. Composites with polymers (Fig. 8) are being studied as a means of improving mechanical strength without impairing the softness of OIPC. Howlett et al. reported composites in which polyvinylidene fluoride (PVDF) nanofiber membranes were impregnated with 1e.91 The yield stress and Young's modulus of the 1e/PVDF composite were 300 and 60 MPa, respectively. Compression testing of 1e was also performed. The compressive modulus of 1e was 200 MPa at 30 °C. The compressive modulus of 1e supplemented with 10 mol% LiBF4 was 20 MPa, i.e., a reduction of an order of magnitude. Furthermore, the compressive modulus of the 1e/PVDF composite was 5 MPa, which was lower than that of the LiBF4-containing system. It is considered that 1e was plasticized by mixing with PVDF. The ionic conductivity of the composite formed by impregnation of 1e in the PVDF nanofiber membrane was about an order of magnitude higher than that of 1e in phase I and II. In the case of the PVDF-1e/LiBF4 composite, the ionic conductivity was improved in phase II. Interestingly, mixing with PVDF, which is a non-conductive polymer, improved not only the mechanical strength but also the ionic conductivity. The ionic conductivity of the composite of 1b impregnated in the PVDF nanofiber membrane was higher than that of 1b.92 On the other hand, the ionic conductivity of the polystyrene-1b composite decreased with increasing polystyrene content.93 When OIPC was mixed with PVDF, the ionic conductivity was improved regardless of the type of OIPC, demonstrating that it is a phenomenon peculiar to PVDF. PVDF is a ferroelectric polymer and is spontaneously polarized. It is believed that the interaction between PVDF and ions disrupted the arrangement of the constituent ions of the OIPC and increased the defects/pores on the PVDF surface, which promoted the rotational/translational motion of cations and anions. It was also suggested that the surface area of PVDF is an important factor in improving the physical properties of OIPC in the PVDF composite. Therefore, to increase the surface area of the polymer, the shape of PVDF was changed from fiber to fine particles, and a composite with OIPC was prepared.94 When 1b and PVDF fine particles were combined, the ionic conductivity of the 1b/PVDF fine particle composite was higher than that of the analogous composite with PVDF fibers, demonstrating the importance of the OIPC/PVDF interface.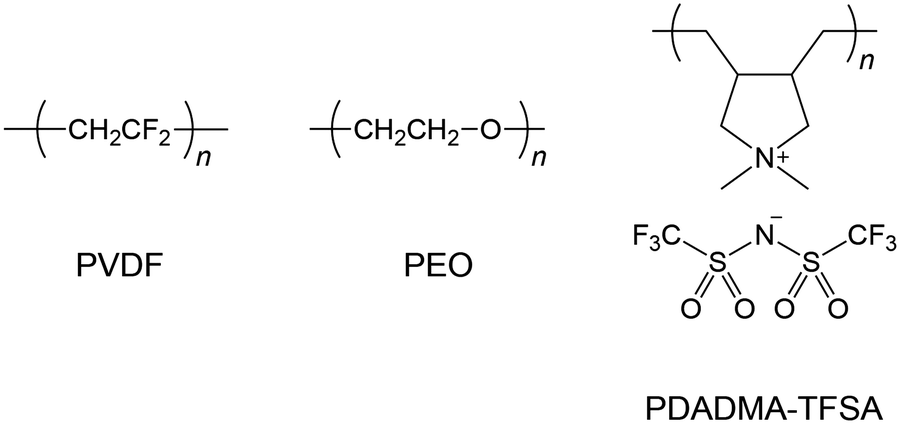 | ||
| Fig. 8 Chemical structures of host polymers for the composites with OIPCs. | ||
Formation of composites with polyethylene oxide (PEO), which is an ion conductive polymer, is also being considered. PEO is a rare polymer material in that it has both high polarity to dissociate added salts and high molecular mobility to transport the generated ions. It has been explored extensively as an electrolyte component for Li batteries.95 However, to put these PEO/Li salt composites into practical use, it is necessary to further improve the ionic conductivity and tLi+. Li et al. added 1b (0–40 wt%) to PEO/LiFSA ([Li]/[EO] = 0.05) to prepare a composite.96 The glass transition temperature (Tg) of PEO/LiFSA decreased with increasing 1b content, indicating that OIPC functions as a plasticizer in PEO. The tensile strength of PEO/LiFSA was about 4 MPa. Although the tensile strength of PEO/LiFSA decreased due to the addition of 1b, it could maintain about 2 MPa. The addition of 1b to PEO/LiFSA improved the ionic conductivity. It showed the highest value when 1b was 30 wt% and was 1.05 × 10⁻⁴ S cm−1 at 50 °C. This is thought to be due to the decrease in Tg due to the addition of OIPC. A composite was prepared by adding 3b97 or 12b98 to PEO/LiFSA ([Li]/[EO] = 0.05). The thermal and mechanical properties of these composites were comparable to those of the 1b composite. The ionic conductivity of the 3b and 12b composites was 3.02 × 10⁻⁴ and 2.14 × 10⁻⁴ S cm−1, respectively, at 50 °C. This is considered to be the result of the ionic conductivity of the added OIPC. The tLi+ of the PEO/LiFSA/1b and 12b composite s were 0.15 and 0.18, respectively, comparable to PEO/LiFSA. On the other hand, tLi+ of PEO/LiFSA/3b was 0.45. It was suggested that the ion conduction mechanism in PEO changes depending on the type of OIPC added. A more detailed analysis is needed on the role of OIPC in PEO.
A composite of poly(diallyldimethylammonium) bis(trifluoromethanesulfonyl)amide (PDADMA-TFSA), which is a polycation, and OIPC was investigated. It has been reported that a solid electrolyte obtained by adding a Li salt to PDADMA-TFSA functions as a lithium-ion conductor,99 and PDADMA-TFSA is interesting as a matrix to which OIPC is added. Li et al. varied the mass percent of PDADMA-TFSA, 1b, LiTFSA ([70/30]20, [60/40]20, [50/50]20 (LiTFSA fixed at 20%)).100 As a result of DSC and XRD measurements, both composites were found to be amorphous and the 1b-based phase transition temperature disappeared. [50/50]20, which has a high OIPC content, showed the highest ionic conductivity, with a value of 3.33 × 10⁻⁴ S cm−1 at 40 °C. It showed a higher value than the 1b/PEO composite. On the other hand, tLi+ at 40 °C was 0.17, which was comparable to that of the 1b/PEO composite. A composite of PDADMA-TFSA with 12b added was also investigated. Yang et al. altered mass percent of PDADMA-TFSA, 12b, LiTFSA ([60/40]20, [50/50]20, [40/60]20 (LiTFSA fixed at 20%)).101 The 12b composite was also amorphous, as was observed for the 1b composite. The ionic conductivity of these 12b composites improved with increasing OIPC content. The ionic conductivity of [40/60]20 was 2.08 × 10⁻⁴ S cm−1 at 25 °C, and tLi+ was 0.18 at 40 °C. Although the two types of OIPC are compounded, the effect of PDADMA-TFSA on various characteristics is unclear and needs further investigation.
5. Lithium secondary batteries
Research on the use of OIPCs as electrolytes for electrochemical devices is becoming more active, and lithium secondary batteries, sodium secondary batteries,102 fuel cells,103 dye-sensitized solar cells (DSSC),104,105 and electric double-layer capacitors,106,107etc., have been investigated as applicable electrochemical devices. Here, lithium secondary batteries will be described.5.1 Preconditioning process
It has been reported that repeated cycling at a low current density (0.01 mA cm−2) in symmetric cells using lithium metal for both electrodes improves OIPC/electrode interface contact and improves cell performance.108–110 This method, called the preconditioning process, reduced the internal resistance of the cell after the preconditioning process in symmetric cells of lithium metal using 1a,108,1102e,10925a,110 and 26f.111Fig. 9 shows the SEM images of the 1a/LiTFSA (1 mol%) and electrolyte/lithium metal interfaces before and after preconditioning.110 From the comparison of Fig. 9(a) and (b), it was observed that the particle size of 1a/LiTFSA decreased after the preconditioning process. Furthermore, by comparing Fig. 9(c) and (d), it was observed that the electrolyte/lithium interface was obscured after the preconditioning process. It was revealed that the internal resistance was reduced by the miniaturization of OIPC particles and the good contact of the OIPC/electrode interface. It is believed that repeated dissolution and precipitation of lithium causes stress due to changes in the volume of the OIPC, resulting in a decrease in the particle size of the OIPC. It is interesting that the miniaturization of OIPC particles not only improves the contact with the electrode interface but also contributes to the improvement of ionic conductivity.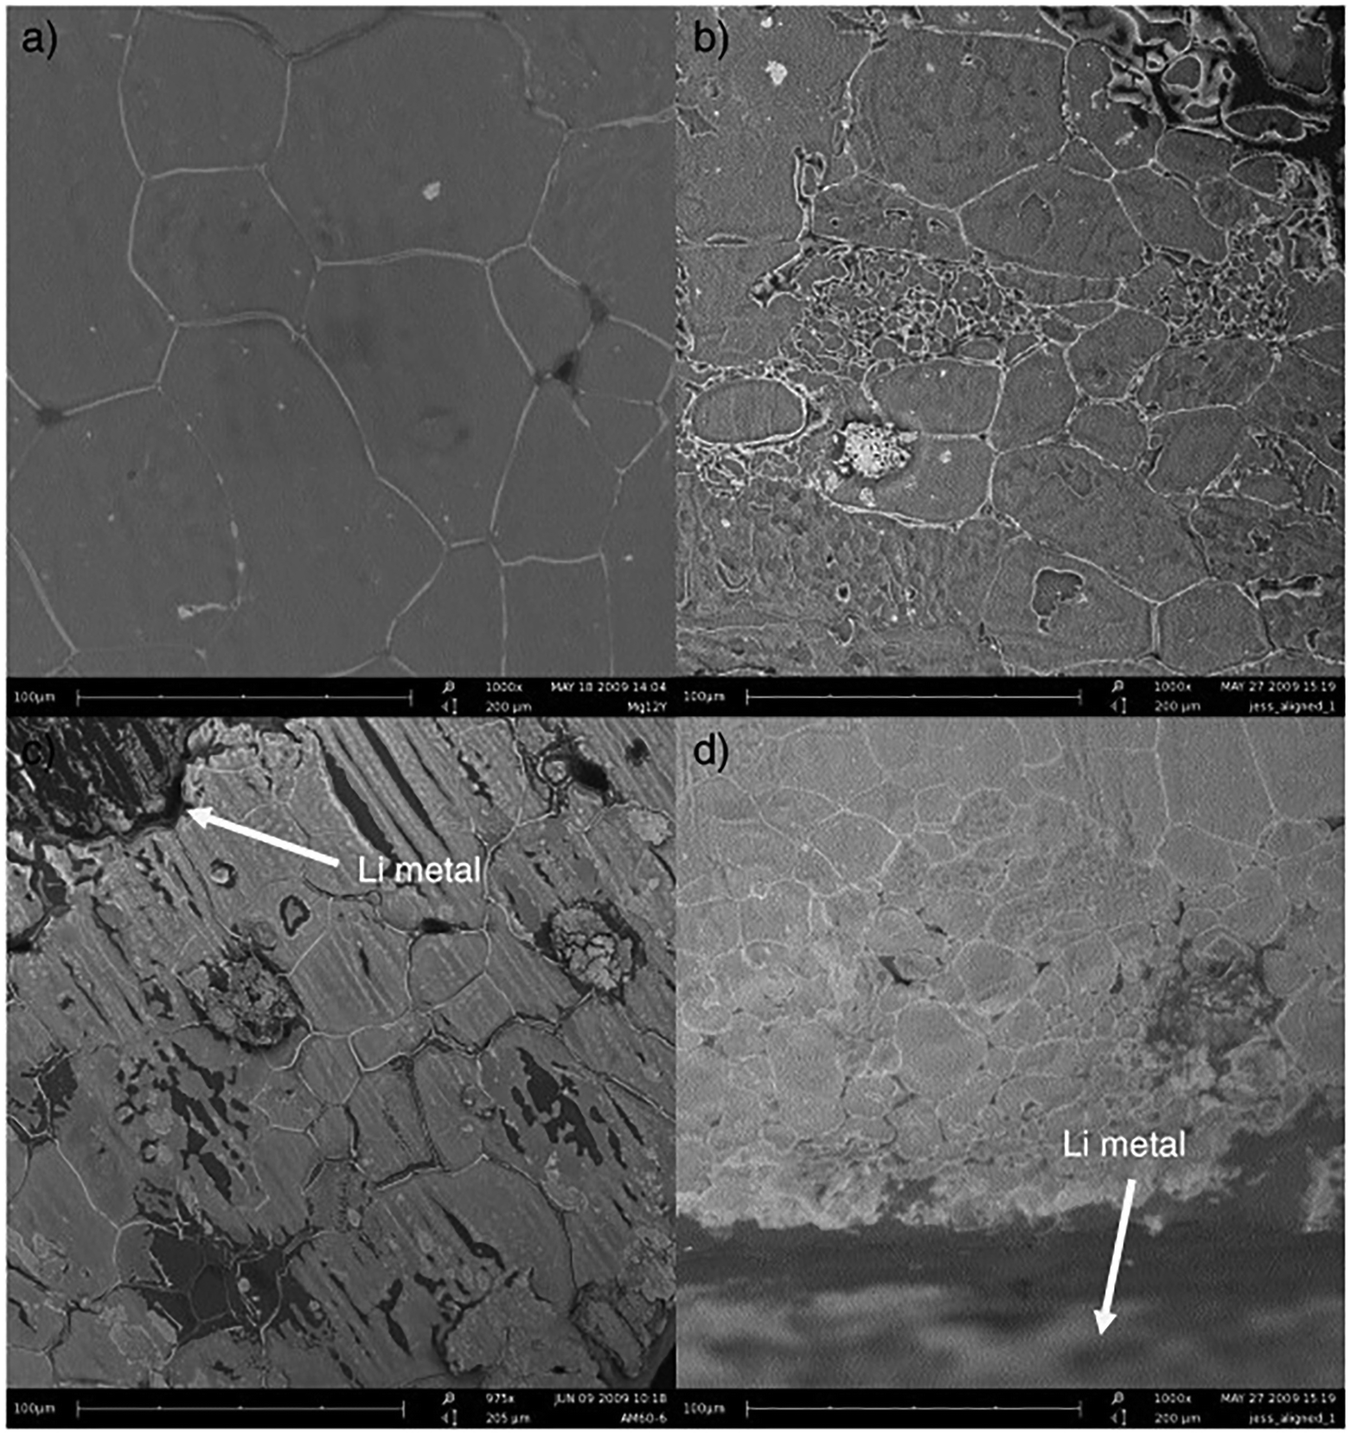 | ||
| Fig. 9 SEM micrographs of a 1 mol% LiTFSA doped 1a electrolyte. (a) Top-down view, (b) top-down view after pre-conditioning, (c) cross-section view, and (d) cross-section view after pre-conditioning. Reprinted from ref. 110 with permission. | ||
The importance of the preconditioning process was demonstrated in the Li/LiFePO4 cell (1a/LiTFSA melt-impregnated in PVDF separator) using 1a/LiTFSA (1 mol%).110 Repeated cycling at 0.01 mA cm−2 at 50 °C using the above cells reduced cell resistance and resulted in good charge/discharge cycles after the preconditioning process. In charge/discharge tests (50 °C, C/5) of a Li/LiFePO4 cell using 1a/LiTFSA (10 mol% (0.26 mol kg−1)), the initial discharge capacity was 129 mA h g−1. After 50 cycles, the discharge capacity was 110 mA h g−1. After 3 cycles, the coulombic efficiency improved sharply and remained around 99% thereafter. Furthermore, the effect of the preconditioning process was investigated by changing the thickness of the electrolyte (100 and 200 μm).1111a/LiTFSA (1 mol%) was used as the electrolyte. The internal resistance of the metallic lithium symmetric cell was similar before the preconditioning process, regardless of the electrolyte thickness. This indicates that the interfacial resistance is higher than the bulk resistance. After the preconditioning process, the 200 μm cell resistance determined by the Nyquist plot was twice that of 100 μm, reflecting the thickness of the electrolyte. The contribution to cell resistance was higher in bulk resistance, indicating that preconditioning reduced interfacial resistance, demonstrating the effectiveness of the process. The effect of the separator was also examined. As a result of the charge/discharge test (80 °C, C/10) of Li/LiFePO4 cells using 1a/LiTFSA (10 mol%), the highest discharge capacity was shown in the order of glass filter, Separion®, and PVDF. It is thought that this reflects the order of wettability, but it is also considered that the special effect of the PVDF surface also contributes, and it is thus clear that the selection of the separator is important.
A charge/discharge test of a Li/LiFePO4 cell using 28b/LiFSA (4 mol%) was conducted.34 The electrolyte was melt-impregnated into a polyethylene separator. 28b/LiFSA (4 mol%) TII–III is 8.2 °C, TI–II is 24.8 °C, and Tm is 34.6 °C. The ionic conductivity was 2.6 × 10⁻⁴ S cm−1 at 22 °C. The discharge capacity at 30 °C (phase I) and 0.3C reached 160 mA h g−1 after 5 cycles, and the coulombic efficiency improved to 99%. This is thought to be due to the formation of a stable solid electrolyte interphase (SEI) on the electrodes and the miniaturization of OIPC particles by the preconditioning process. The cell using 28b/LiFSA showed a discharge capacity of 130 mA h g−1 even at 1C. The discharge capacity at 20 °C (phase II) and C/10 reached 155 mA h g−1 after 10 cycles, which is similar to cells using ionic liquid as the electrolyte,112,113 and it was higher than cells using other OIPCs.111,114 The interfacial resistance after 10 cycles was 1000 Ω or lower than the value before the cycle, and the effect of the preconditioning process was observed more significantly than the conditions of 30 °C and 0.3C.
5.2 Charge/discharge tests
In 2004, Alarco et al. reported a charge/discharge test of Li4Ti5O12/LiFePO4 cells at 40 °C using 21a/LiTFSA (20 mol%).62 The melting point of 21a/LiTFSA (20 mol%) is 56 °C, and the ionic conductivity at 40 °C is 6.2 × 10⁻⁴ S cm−1. To prevent cell short-circuiting, the electrolyte was melt-impregnated into Celgard®. The discharge capacity at C/24 was 90 mA h g−1, and the discharge capacity decreased as the C-rate increased. The coulombic efficiency was almost 100% at all C-rates, suggesting that no side reactions occurred. The cell was made using 23a, which has better ionic conductivity than 21a.64 The melting point of 23a/LiTFSA (10 mol%) was 7.3 °C, and the ionic conductivity at 5 °C, which is a plastic crystal phase, was 6.2 × 10⁻⁴ S cm−1. The discharge capacity of the Li4Ti5O12/LiFePO4 cell using this electrolyte (melt impregnated in Celgard®) at 5 °C is 92 mA h g−1 at C/12, and 23a/LiTFSA has better charge/discharge characteristics than 21a/LiTFSA. On the other hand, the development of a lithium battery using 1e was examined without a separator. 1e has excellent mechanical strength, and it is presumed that this was taken into consideration. A charge/discharge test of a Li/LiFePO4 cell using a 1e/LiBF4 composite was performed. The discharge capacity of the cell is about 140 and 90 mA h g−1 at 100 °C, C/10, 80 °C, and C/10, respectively, which is about 80% and 50% of the theoretical capacity (168 mA h g−1). The initial capacity at each temperature was maintained after 20 cycles.In recent years, device fabrication using OIPC/polymer composites has become mainstream. There are many merits, such as device safety and improved ionic conductivity of OIPCs, so it will be a natural flow. Howlett et al. prepared and evaluated Li/LiFePO4 cells using a composite in which a PDVF nanofiber membrane was impregnated into 1e.91 At 80 °C (phase I) and C/15, the cell discharge capacity was approximately 140 mA h g−1. Although the C-rate is different, the discharge capacity at 80 °C increased compared to the result of 1e alone, and it is inferred that the improvement of ionic conductivity due to the effect of PVDF nanofibers contributes. Li/LiFePO4 cells were prepared using a solid electrolyte in which 1b and PEO96 or PDADMA-TFSA,1003b and PEO,97 and 12b and PEO98 were combined. When a composite of PEO/LiFSA ([Li]/[EO] = 0.05) and 1b (30 wt%) is used, the discharge capacity at 50 °C and C/5 gradually increases with the number of cycles, and 5 cycles. After that, it reached 157.3 mA h g−1. After 90 cycles, it maintained a capacity of 150.3 mA h g−1. The discharge capacities at 50 °C, C/2, and 1C were 148.1 and 115.6 mA h g−1, respectively, and the coulombic efficiency was almost 100% at both C-rates. When a composite of PEO/LiFSA ([Li]/[EO] = 0.05) and 3b (30 wt%) was used, the discharge capacities at 50 °C were 158.4 at C/5, 151.5 at C/2, and 113.7 mA h g−1 1C, respectively. When 1b and PDADMA-TFSA ([50/50]20) were used, the discharge capacity at 40 °C and C/5 reached 152 mA h g−1 after several cycles. The discharge capacities at 40 °C, C/2 and 1C were 147.6 and 111.2 mA h g−1, respectively, and the coulombic efficiency was almost 100% at both C-rates. There are also reports of cells using PEO/LiFSA ([Li]/[EO] = 0.05)/12b (30 wt%) and 12b/PDADMA-TFSA ([60/40]20) composites as electrolytes. The discharge capacity of these cells were in the range of 155 and 158 mA h g−1 at C/5, and the cell performance of 1b/PEO, 3b/PEO, 12b/PEO, 1b/PDADMA-TFSA, and 12b/PDADMA-TFSA complexes was almost the same. It is considered that the result reflects the ionic conductivity and tLi+ of these complexes, and the specific effects of OIPC and polymer structure on the cell performance could not be found. On the other hand, Li/LiFePO4 cells prepared using a composite of 1b/LiFSA (amount of substance ratio 9![[thin space (1/6-em)]](https://www.rsc.org/images/entities/char_2009.gif) :1) and PVDF fine particles (40 wt%) showed different behavior (Fig. 10(a)).94 The discharge capacity of the cell at 50 °C and C/10 was 124 mA h g−1, which was lower than that of the above composite but increased to 128 mA h g−1 at C/2. The discharge capacities at 1, 2, and 5C were 127, 124, and 115 mA h g−1, respectively. Even though the charge/discharge rate is doubled, the discharge capacities at 1 and 2C were the same within error, and even at 5C, 90% of the discharge capacity at 1C was maintained. The effect of the C-rate on the discharge capacities was small. A phenomenon peculiar to PVDF, and not found in other polymers, was observed. In addition, cycle tests were performed at room temperature and 2C. At the beginning of the cycling, the discharge capacity was about 100 mA h g−1. The discharge capacity after 1200 cycles was about 80 mA h g−1, and the coulombic efficiency was maintained at almost 100%. In a similar test using LP30, which is an electrolyte solution, the discharge capacity at the beginning of the cycle was about the same, but after 630 cycles, it decreased to about 70 mA h g−1, showing the superiority of the OIPC/PVDF fine particle composite.
:1) and PVDF fine particles (40 wt%) showed different behavior (Fig. 10(a)).94 The discharge capacity of the cell at 50 °C and C/10 was 124 mA h g−1, which was lower than that of the above composite but increased to 128 mA h g−1 at C/2. The discharge capacities at 1, 2, and 5C were 127, 124, and 115 mA h g−1, respectively. Even though the charge/discharge rate is doubled, the discharge capacities at 1 and 2C were the same within error, and even at 5C, 90% of the discharge capacity at 1C was maintained. The effect of the C-rate on the discharge capacities was small. A phenomenon peculiar to PVDF, and not found in other polymers, was observed. In addition, cycle tests were performed at room temperature and 2C. At the beginning of the cycling, the discharge capacity was about 100 mA h g−1. The discharge capacity after 1200 cycles was about 80 mA h g−1, and the coulombic efficiency was maintained at almost 100%. In a similar test using LP30, which is an electrolyte solution, the discharge capacity at the beginning of the cycle was about the same, but after 630 cycles, it decreased to about 70 mA h g−1, showing the superiority of the OIPC/PVDF fine particle composite.
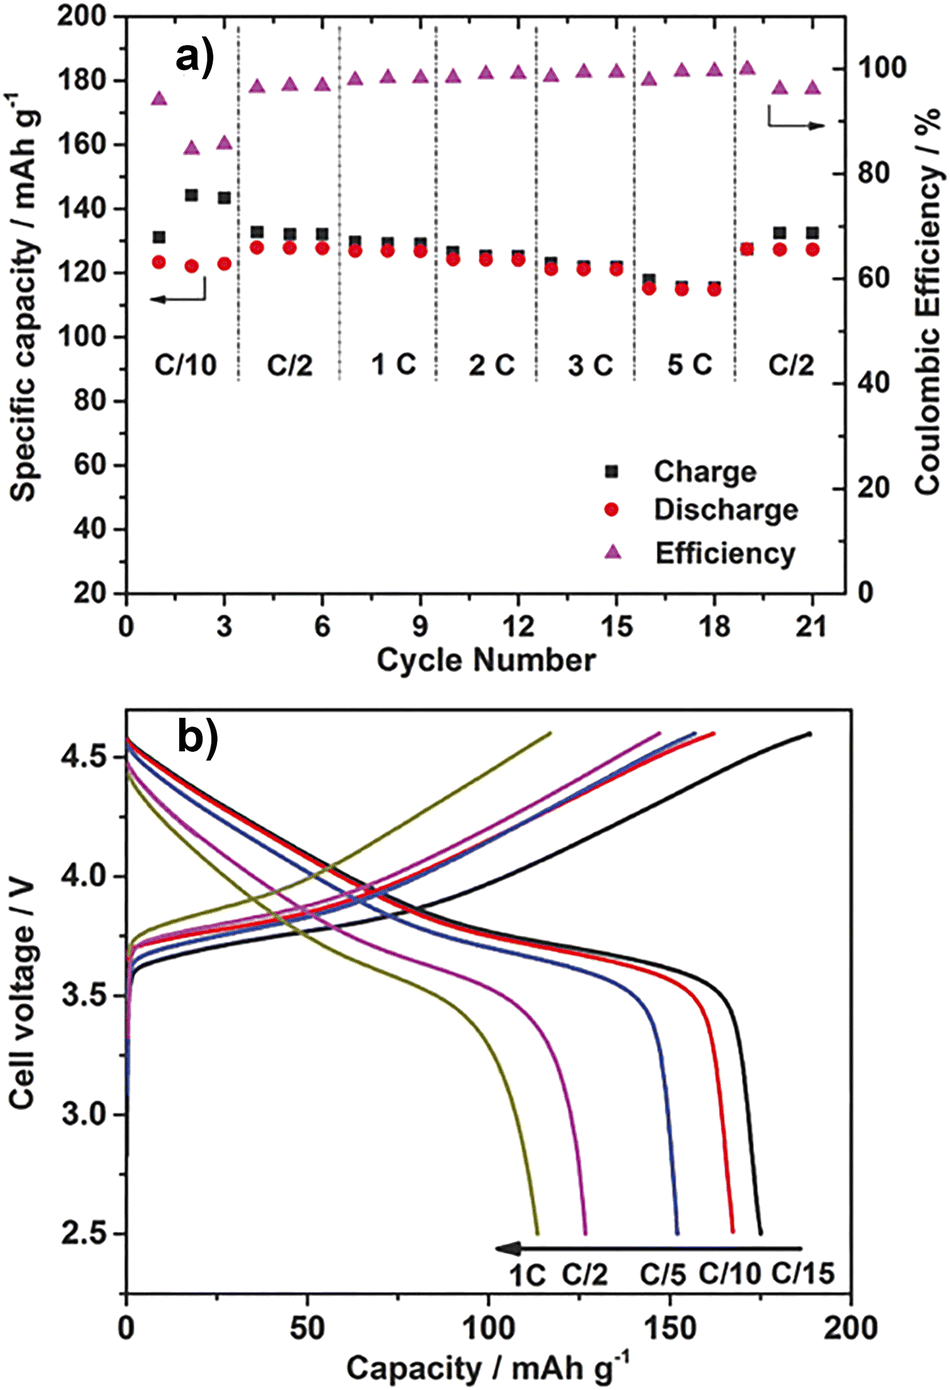 | ||
| Fig. 10 Electrochemical measurements of 40 wt% Li0.110.9b/PVDF composites. (a) Specific capacities and coulombic efficiencies of Li/LiFePO4 cells at different current rates, ranging from C/10 to 5C, 50 °C. (b) Charge–discharge curves of the Li/LiCo1/3Ni1/3Mn1/3O2 cell using 40 wt% Li0.110.9b/PVDF composites (cut-off voltage 2.5–4.6 V), 50 °C. (Figure partly modified from the original one.) Reprinted from ref. 94 with permission. | ||
The development of a lithium secondary battery using LiNi1/3Co1/3Mn1/3O2 (NCM111) as a positive electrode active material to replace LiFePO4 has been reported.94 Since the OIPC potential window is wide, high voltage positive electrode materials such as NCM can be applied. A-Li/NCM111 cell was prepared using a composite of 1b/LiFSA (amount of substance ratio 9:1) and PVDF fine particles (40 wt%), and a charge/discharge test was performed at a cut-off voltage of 2.5 to 4.6 V (charge/discharge test). Fig. 10(b). The discharge capacity of the Li/NCM111 cell at 50 °C was 178 mA h g−1 at C/15 and 113 mA h g−1 at 1C. The value was higher than that of the Li/LiFePO4 cell. It was also reported that cells were prepared and evaluated using LiNi0.6Co0.2Mn0.2O2 (NCM622) with an increased Ni ratio for higher energy density.97 The discharge capacity of the Li/NCM622 cell using the composite of PEO/LiFSA ([Li]/[EO] = 0.05) and 3b (30 wt%) as the electrolyte is 60 °C, C/5, C/2, and 1C. At that time, they were 155, 133, and 103 mA h g−1 respectively (cutoff voltage was 2.8 to 4.3 V). It was found that various positive electrode active materials are applicable.
OIPCs are beneficial for interface engineering in all-solid-state batteries.91,94,111,115,116 The compounds contribute to faster charge/discharge of solid-state batteries by forming continuous ion-conduction pathways throughout the electrode layer (Fig. 11).
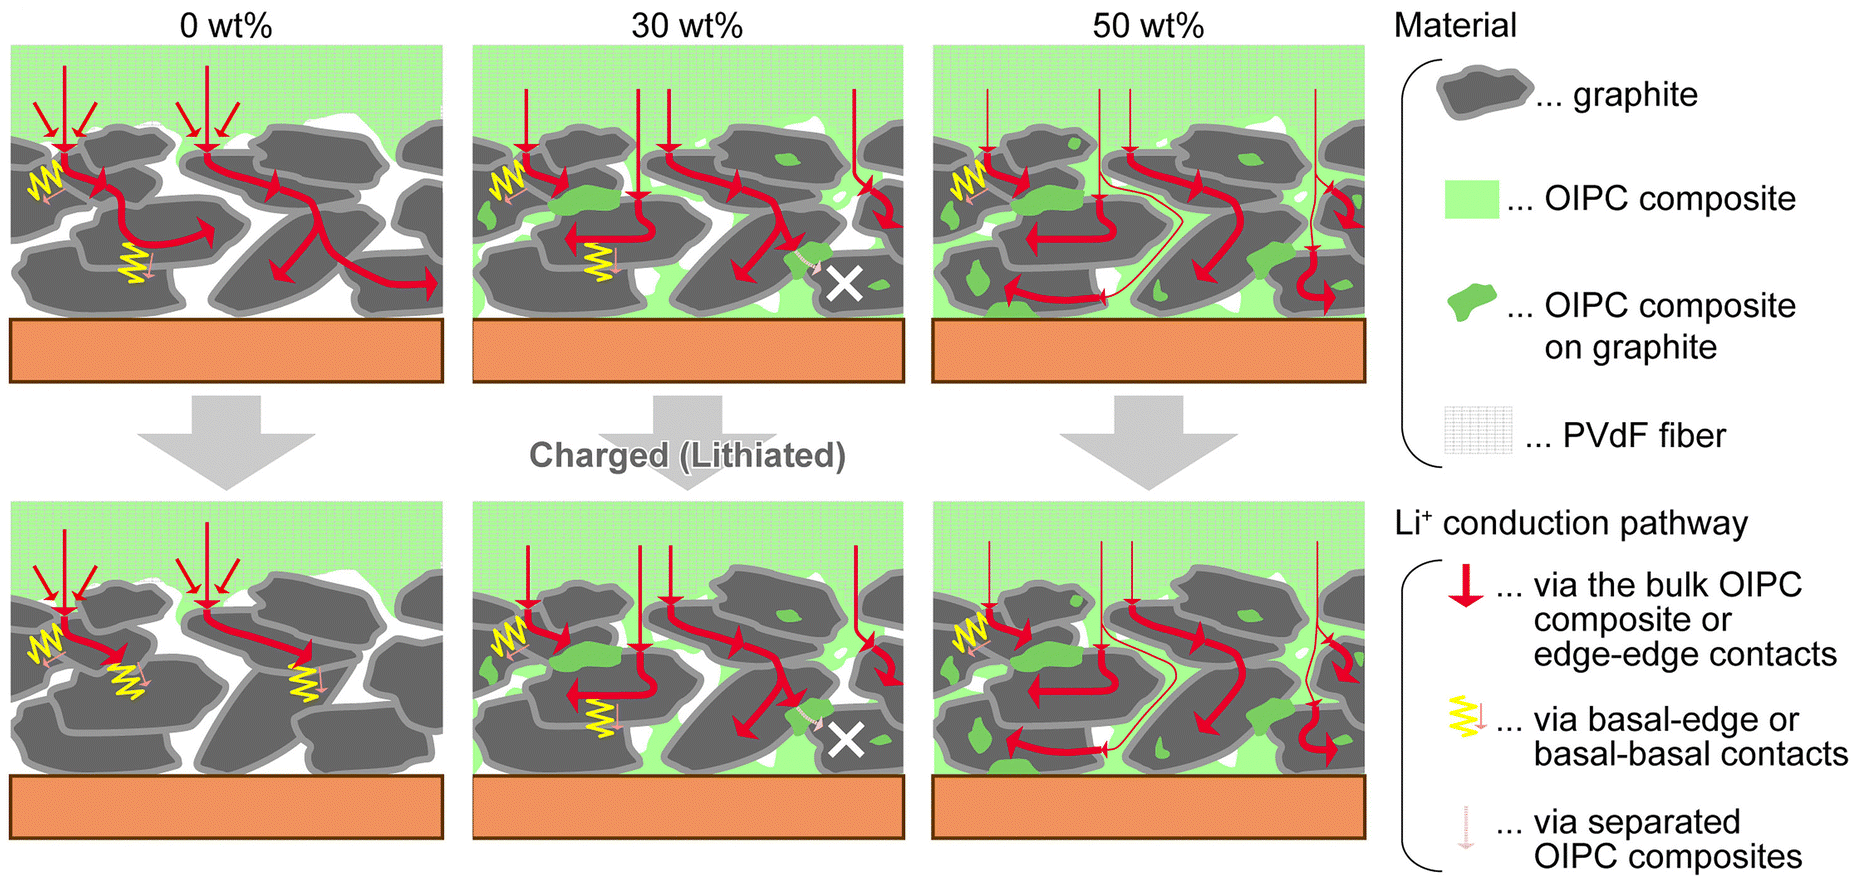 | ||
| Fig. 11 Role of OIPC in the solid-state electrodes. Mixing OIPC with graphite anode promotes Li+ conduction and electrochemical reaction in the electrode layer. Reprinted from ref. 115 with permission. | ||
Ueda et al. reported the electrode characteristics of an OIPC composite(1b and LiFSA) and graphite as the active material.115 The experimental capacity of the prepared electrode reached over 80% against the theoretical value at a rate of 1C, whereas only 50% was obtained without OIPC. The addition of the OIPC composite also increased cycle performances (>100 cycles). The improvements were explained by the ion-conducting and binding properties of the OIPC composite, accelerating the charge transport throughout the electrolyte layer, active material, and current collector.
From a practical viewpoint, OIPC may increase the energy density of solid-state batteries. The paper claimed that the volume fraction of the electrolyte components could be smaller than the usual liquid electrolyte systems; OIPCs filled the electrode voids effectively.115 On the other hand, suppression of side reactions at the electrode interfaces is an ongoing challenge. The initial coulombic efficiency of the OIPC electrodes tended to be lower (88–95%) than the regular liquid electrolyte system (>97%), also taking longer (>20) cycles for stable solid electrolyte interphase (SEI) formation. Molecular engineering is critical to effectively suppressing unfavorable degradation of OIPC, primarily occurring at the anode side where bond dissociation of OIPCs proceeds easily.117
6. Conclusions and outlook
The development of lithium secondary batteries using OIPCs as electrolytes is steadily progressing. However, the ionic conductivity of OIPC is lower than that of electrolyte solutions and inorganic solid electrolytes, so further improvement will be necessary. OIPCs exceeding 10−3 S cm−1 at room temperature have been reported,118 and it is expected that high lithium-ion conductivity can be achieved by clarifying molecular design guidelines in the future. An effort has already been initiated to better understand the correlation between chemical structure and motion-mode of each ion for OIPCs.119 The motion-mode for each ion was discussed by comparing ion symmetry and the site symmetry where the ion was positioned based on their powder crystal diffraction data. The diffraction intensities of samples with spherically rotating ions were calculated. In addition, a correlation between the ionic radius ratio of cations and anions composed of OIPCs and the ionic conductivity has been reported, providing an indicator for molecular design guidelines.56,57 Further understanding of the correlation between chemical structure and physicochemical properties will further improve ionic conductivity.On the other hand, artificial intelligence (AI)-based screening of highly conductive OIPCs will be an interesting challenge. AI-assisted exploration of solid polymer electrolytes has already been reported,120 and glass-type lithium-ion conductors with aromatic structures, which is an unfamiliar electrolyte design, showed the ionic conductivity of around 10−3 S cm−1 at room temperature. The glassy polymer electrolyte design was contrary to the traditional concept of rubbery polymer electrolytes. The suggestions provided by machine learning models can help to discover unexpected chemical structures with a high ionic conductivity.
Furthermore, as with the synergistic effect of mixing OIPC and macromolecules, mixing OIPC with organic or inorganic materials is also an interesting technique for achieving high lithium-ion conductivity. For example, the tLi+ of the composite of the covalent organic framework (COF) and OIPC was 0.58, which is a high value for a Li salt mixed system.121 There is also a report that OIPC was applied to the surface of Li metal by spin coating to reduce the contact resistance between Li7La3Zr2O12 (LLZO), which is a solid ceramic electrolyte, and the electrode.122 On the other hand, the use of Li metal anodes in sulfide electrolyte (SE)-based all-solid-state lithium metal batteries (ASSLMBs) has been less successful. The main challenges are the pronounced interfacial reactions between Li metal and SE and Li dendrite formation. A solid plastic crystal electrolyte (PCE) based on succinonitrile and LiTFSA was designed as an interlayer for SE-based ASSLMB, and it was demonstrated that the PCE interlayer can prevent the interfacial reaction between SE and Li metal and the formation of Li dendrites by Wang et al.123 These are good examples of utilizing the softness of OIPC and PC is a technology that simplifies the cell fabrication process using solid inorganic solid electrolytes. In the future, it is expected that the implementation of OIPC not only in lithium secondary batteries but also in other electrochemical devices will be achieved by elucidating the correlation between chemical structures and physicochemical properties and optimizing the combination of dissimilar materials.
Author contributions
Conceptualization: MYF; resources: MLT, KHS, SN, MYF; data curation: MLT, KHS, SN, MYF; formal analysis: MLT, KHS, SN, MYF; supervision: MYF; funding acquisition: MLT, KHS, SN, MYF; investigation: MLT, KHS, SN, MYF; visualization: MLT, KHS, SN, MYF; methodology: MLT, KHS, SN, MYF; project administration: MYF; writing – original draft: MLT, KHS, SN, MYF; writing – review & editing: MLT, KHS, SN, MYF.Conflicts of interest
There are no conflicts to declare.Acknowledgements
Recent studies were supported by JSPS KAKENHI grant number 19K05604 for M. Y. F., JSPS Bilateral Program grant number JPJSBP120199977 for M. Y. F., and a Sophia University Special Grant for Academic Research. The authors also acknowledge the great efforts of staff and students working on ionic plastic crystals in our laboratories.Notes and references
- J. M. Tarascon and M. Armand, Nature, 2001, 414, 359–367, DOI:10.1038/35104644.
- S. Chen, K. Wen, J. Fan, Y. Bando and D. Golberg, J. Mater. Chem. A, 2018, 6, 11631–11663, 10.1039/C8TA03358G.
- S. K. Sharma, G. Sharma, A. Gaur, A. Arya, F. S. Mirsafi, R. Abolhassani, H.-G. Rubahn, J.-S. Yu and Y. K. Mishra, Energy Adv., 2022, 1, 457–510, 10.1039/D2YA00043A.
- Y. Ma, R. Shang, Y. Liu, R. Lake, M. Ozkan and C. S. Ozkan, J. Power Sources, 2023, 559, 232647, DOI:10.1016/j.jpowsour.2023.232647.
- Y. Lu, X. Huang, Y. Ruan, Q. Wang, R. Kun, J. Yang and Z. Wen, J. Mater. Chem. A, 2018, 6, 18853–18858, 10.1039/C8TA07241H.
- Y. Liu, Q. Sun, Y. Zhao, B. Wang, P. Kaghazchi, K. R. Adair, R. Li, C. Zhang, J. Liu, L.-Y. Kuo, Y. Hu, T.-K. Sham, L. Zhang, R. Yang, S. Lu, X. Song and X. Sun, ACS Appl. Mater. Interfaces, 2018, 10, 31240–31248, DOI:10.1021/acsami.8b06366.
- V. Lacivita, A. S. Westover, A. Kercher, N. D. Phillip, G. Yang, G. Veith, G. Ceder and N. J. Dudney, J. Am. Chem. Soc., 2018, 140, 11029–11038, DOI:10.1021/jacs.8b05192.
- R. Murugan, V. Thangadurai and W. Weppner, Angew. Chem., Int. Ed., 2007, 46, 7778–7781, DOI:10.1002/anie.200701144.
- D.-L. Xiao, J. Tong, Y. Feng, G.-H. Zhong, W.-J. Li and C.-L. Yang, Solid State Ionics, 2018, 324, 202–206, DOI:10.1016/j.ssi.2018.07.011.
- J. Glenneberg, G. Kasiri, I. Bardenhagen, F. La Mantia, M. Busse and R. Kun, Nano Energy, 2019, 57, 549–557, DOI:10.1016/j.nanoen.2018.12.070.
- M. Calpa, N. C. Rosero-Navarro, A. Miura and K. Tadanaga, Electrochim. Acta, 2019, 296, 473–480, DOI:10.1016/j.electacta.2018.11.035.
- J. Timmermans, J. Phys. Chem. Solids, 1961, 18, 1–8, DOI:10.1016/0022-3697(61)90076-2.
- D. R. MacFarlane and M. Forsyth, Adv. Mater., 2001, 13, 957–966, DOI:10.1002/1521-4095(200107)13:12/13<957::AID-ADMA957>3.0.CO;2-#.
- J. M. Pringle, P. C. Howlett, D. R. MacFarlane and M. Forsyth, J. Mater. Chem., 2010, 20, 2056–2062, 10.1039/B920406G.
- J. M. Pringle, Phys. Chem. Chem. Phys., 2013, 15, 1339–1351, 10.1039/c2cp43267f.
- H. Zhu, D. R. MacFarlane, J. M. Pringle and M. Forsyth, Trends Chem., 2019, 1, 126–140, DOI:10.1016/j.trechm.2019.01.002.
- P.-J. Alarco, Y. Abu-Lebdeh, A. Abouimrane and M. Armand, Nat. Mater., 2004, 3, 476–481, DOI:10.1038/nmat1158.
- J. Hwang, K. Matsumoto, C.-Y. Chen and R. Hagiwara, Energy Environ. Sci., 2021, 14, 5834–5863, 10.1039/D1EE02567H.
- E. I. Cooper and C. A. Angell, Solid State Ionics, 1986, 18–19, 570–576, DOI:10.1016/0167-2738(86)90180-3.
- H. Ishida, R. Ikeda and D. Nakamura, Bull. Chem. Soc. Jpn., 1986, 59, 915–924, DOI:10.1246/bcsj.59.915.
- S. Sato, R. Ikeda and D. Nakamura, Bull. Chem. Soc. Jpn., 1986, 59, 1981–1989, DOI:10.1246/bcsj.59.1981.
- T. Tanabe, D. Nakamura and R. Ikeda, J. Chem. Soc., Faraday Trans., 1991, 87, 987–990, 10.1039/FT9918700987.
- M. Tansho, D. Nakamura and R. Ikeda, J. Chem. Soc., Faraday Trans., 1991, 87, 3255–3258, 10.1039/FT9918703255.
- H. Ishida, N. Hayama and R. Ikeda, Chem. Lett., 1992, 1333–1336, DOI:10.1246/cl.1992.1333.
- H. Ishida, T. Iwachido and R. Ikeda, Ber. Bunsenges. Phys. Chem., 1992, 96, 1468–1470, DOI:10.1002/bbpc.19920961023.
- H. Ishida and Y. Furukawa, Z. Naturforsch., A: Phys. Sci., 1996, 51, 83–86, DOI:10.1515/zna-1996-1-212.
- H. Ono, S. i Ishimaru, R. Ikeda and H. Ishida, Bull. Chem. Soc. Jpn., 1999, 72, 2049–2054, DOI:10.1246/bcsj.72.2049.
- D. R. MacFarlane, J. Huang and M. Forsyth, Nature, 1999, 402, 792–794, DOI:10.1038/45514.
- M. Forsyth, J. Huang and D. R. MacFarlane, J. Mater. Chem., 2000, 10, 2259–2265, 10.1039/b003168m.
- J. Golding, N. Hamid, D. R. MacFarlane, M. Forsyth, C. Forsyth, C. Collins and J. Huang, Chem. Mater., 2001, 13, 558–564, DOI:10.1021/cm000625w.
- A. L. Chong, M. Forsyth and D. R. MacFarlane, Electrochim. Acta, 2015, 159, 219–226, DOI:10.1016/j.electacta.2015.01.180.
- M. Lee, Y.-H. Lee, J. H. Park and U. H. Choi, Org. Electron., 2017, 48, 241–247, DOI:10.1016/j.orgel.2017.06.004.
- L. Jin, K. M. Nairn, C. M. Forsyth, A. J. Seeber, D. R. MacFarlane, P. C. Howlett, M. Forsyth and J. M. Pringle, J. Am. Chem. Soc., 2012, 134, 9688–9697, DOI:10.1021/ja301175v.
- L. Jin, P. C. Howlett, J. M. Pringle, J. Janikowski, M. Armand, D. R. MacFarlane and M. Forsyth, Energy Environ. Sci., 2014, 7, 3352–3361, 10.1039/C4EE01085J.
- T. Mochida, Y. Funasako, M. Ishida, S. Saruta, T. Kosone and T. Kitazawa, Chem. – Eur. J., 2016, 22, 15725–15732, DOI:10.1002/chem.201603170.
- T. Tominaga, T. Ueda and T. Mochida, Phys. Chem. Chem. Phys., 2017, 19, 4352–4359, 10.1039/C6CP08308K.
- H. Kimata and T. Mochida, Cryst. Growth Des., 2018, 18, 7562–7569, DOI:10.1021/acs.cgd.8b01390.
- T. Mochida, M. Ishida, T. Tominaga, K. Takahashi, T. Sakurai and H. Ohta, Phys. Chem. Chem. Phys., 2018, 20, 3019–3028, 10.1039/C7CP02746J.
- T. Hayasaki, S. Hirakawa and H. Honda, Bull. Chem. Soc. Jpn., 2013, 86, 993–1001, DOI:10.1246/bcsj.20130040.
- X. Chen, H. Tang, T. Putzeys, J. Sniekers, M. Wübbenhorst, K. Binnemans, J. Fransaer, D. E. De Vos, Q. Li and J. Luo, J. Mater. Chem. A, 2016, 4, 12241–12252, 10.1039/C6TA05472B.
- M. Matsuki, T. Yamada, N. Yasuda, S. Dekura, H. Kitagawa and N. Kimizuka, J. Am. Chem. Soc., 2018, 140, 291–297, DOI:10.1021/jacs.7b10249.
- M. Yoshizawa-Fujita, E. Kishi, M. Suematsu, T. Takekawa and M. Rikukawa, Chem. Lett., 2014, 43, 1909–1911, DOI:10.1246/cl.140833.
- H. Yamada, Y. Miyachi, Y. Takeoka, M. Rikukawa and M. Yoshizawa-Fujita, Electrochim. Acta, 2019, 303, 293–298, DOI:10.1016/j.electacta.2019.02.076.
- D. Al-Masri, R. Yunis, H. Zhu, L. Jin, P. Bruce, A. F. Hollenkamp and J. M. Pringle, J. Mater. Chem. A, 2019, 7, 25389–25398, 10.1039/c9ta11175a.
- D. Al-Masri, R. Yunis, A. F. Hollenkamp, C. M. Doherty and J. M. Pringle, Phys. Chem. Chem. Phys., 2020, 22, 18102–18113, 10.1039/D0CP03046E.
- D. Al-Masri, R. Yunis, A. F. Hollenkamp and J. M. Pringle, ChemElectroChem, 2020, 7, 4118–4123, DOI:10.1002/celc.202000772.
- H.-T. Kim, O. M. Kwon, J. Mun, S. M. Oh, T. Yim and Y. G. Kim, Electrochim. Acta, 2017, 240, 267–276, DOI:10.1016/j.electacta.2017.04.078.
- M. Moriya, D. Kato, W. Sakamoto and T. Yogo, Chem. Commun., 2011, 47, 6311–6313, 10.1039/c1cc00070e.
- Y. Abu-Lebdeh, E. Austin and I. J. Davidson, Chem. Lett., 2009, 38, 782–783, DOI:10.1246/cl.2009.782.
- M. Yoshizawa-Fujita, D. MacFarlane, P. Howlett and M. Forsyth, Electrochem. Commun., 2006, 8, 445–449, DOI:10.1016/j.elecom.2006.01.008.
- Y. Lauw, T. Rüther, M. D. Horne, K. S. Wallwork, B. W. Skelton, I. C. Madsen and T. Rodopoulos, Cryst. Growth Des., 2012, 12, 2803–2813, DOI:10.1021/cg201592u.
- R. Yunis, D. Al-Masri, A. F. Hollenkamp, C. M. Doherty, H. Zhu and J. M. Pringle, J. Electrochem. Soc., 2020, 167, DOI:10.1149/1945-7111/ab76a2.
- K. Nishikawa, T. Yamada, K. Fujii, H. Masu, K.-I. Tozaki and T. Endo, Bull. Chem. Soc. Jpn., 2021, 94, 2011–2018, DOI:10.1246/bcsj.20210159.
- Z.-B. Zhou and H. Matsumoto, Electrochem. Commun., 2007, 9, 1017–1022, DOI:10.1016/j.elecom.2006.12.012.
- J. Huang, A. Hill, M. Forsyth, D. MacFarlane and A. Hollenkamp, Solid State Ionics, 2006, 177, 2569–2573, DOI:10.1016/j.ssi.2006.01.041.
- S. Yamaguchi, H. Yamada, Y. Takeoka, M. Rikukawa and M. Yoshizawa-Fujita, New J. Chem., 2019, 43, 4008–4012, 10.1039/c8nj05127e.
- M. Yoshizawa-Fujita, H. Yamada, S. Yamaguchi, H. Zhu, M. Forsyth, Y. Takeoka and M. Rikukawa, Batteries Supercaps, 2020, 3, 884–891, DOI:10.1002/batt.202000040.
- R. Yunis, J. M. Pringle, X. Wang, G. M. A. Girard, R. Kerr, H. Zhu, P. C. Howlett, D. R. MacFarlane and M. Forsyth, J. Mater. Chem. A, 2020, 8, 14721–14735, 10.1039/D0TA03502E.
- X.-Y. Zhao, J.-L. Wang, H. Luo, H.-R. Yao, C.-Y. Ouyang and L.-Z. Zhang, J. Zhejiang Univ., Sci., A, 2016, 17, 155–162, DOI:10.1631/jzus.A1500099.
- M. Egashira, S. Okada, J.-I. Yamaki, D. A. Dri, F. Bonadies and B. Scrosati, J. Power Sources, 2004, 138, 240–244, DOI:10.1016/j.jpowsour.2004.06.022.
- M. Egashira, M. Nakagawa, I. Watanabe, S. Okada and J.-I. Yamaki, J. Power Sources, 2005, 146, 685–688, DOI:10.1016/j.jpowsour.2005.03.069.
- P.-J. Alarco, Y. Abu-Lebdeh, N. Ravet and M. Armand, Solid State Ionics, 2004, 172, 53–56, DOI:10.1016/j.ssi.2004.02.029.
- P.-J. Alarco, Y. Abu-Lebdeh and M. Armand, Solid State Ionics, 2004, 175, 717–720, DOI:10.1016/j.ssi.2003.10.024.
- Y. Abu-Lebdeh, A. Abouimrane, P.-J. Alarco and M. Armand, J. Power Sources, 2006, 154, 255–261, DOI:10.1016/j.jpowsour.2005.03.231.
- K. Biernacka, D. Al-Masri, R. Yunis, H. Zhu, A. F. Hollenkamp and J. M. Pringle, Electrochim. Acta, 2020, 357, 136863, DOI:10.1016/j.electacta.2020.136863.
- M. Volel, P.-J. Alarco, Y. Abu-Lebdeh and M. Armand, ChemPhysChem, 2004, 5, 1027–1033, DOI:10.1002/cphc.200400070.
- V. Armel, D. Velayutham, J. Sun, P. C. Howlett, M. Forsyth, D. R. MacFarlane and J. M. Pringle, J. Mater. Chem., 2011, 21, 10.1039/c1jm10417a.
- K. Romanenko, L. Jin, L. A. Madsen, J. M. Pringle, L. A. O’Dell and M. Forsyth, J. Am. Chem. Soc., 2014, 136, 15638–15645, DOI:10.1021/ja508290z.
- K. Romanenko, L. Jin, P. Howlett and M. Forsyth, Chem. Mater., 2016, 28, 2844–2851, DOI:10.1021/acs.chemmater.6b00797.
- M. Hattori, S.-i Fukada, D. Nakamura and R. Ikeda, J. Chem. Soc., Faraday Trans., 1990, 86, 10.1039/ft9908603777.
- S. Iwai, M. Hattori, D. Nakamura and R. Ikeda, J. Chem. Soc., Faraday Trans., 1993, 89, 827–831, 10.1039/ft9938900827.
- T. Shimizu, S. Tanaka, N. Onoda-Yamamuro, S. I. Ishimaru and R. Ikeda, J. Chem. Soc., Faraday Trans., 1997, 93, 321–326, 10.1039/a605760h.
- J. M. Chezeau and J. H. Strange, Phys. Rep., 1979, 53, 1–92, DOI:10.1016/0370-1573(79)90077-2.
- H. Zhu and L. A. O’Dell, Chem. Commun., 2021, 57, 5609–5625, 10.1039/d1cc02151f.
- M. Forsyth, T. Chimdi, A. Seeber, D. Gunzelmann and P. C. Howlett, J. Mater. Chem. A, 2014, 2, 3993–4003, 10.1039/c3ta15153k.
- F. Makhlooghiazad, L. A. O’Dell, L. Porcarelli, C. Forsyth, N. Quazi, M. Asadi, O. Hutt, D. Mecerreyes, M. Forsyth and J. M. Pringle, Nat. Mater., 2022, 21, 228–236, DOI:10.1038/s41563-021-01130-z.
- L. Jin, K. M. Nairn, C. D. Ling, H. Zhu, L. A. O’Dell, J. Li, F. Chen, A. F. Pavan, L. A. Madsen, P. C. Howlett, D. R. MacFarlane, M. Forsyth and J. M. Pringle, J. Phys. Chem. B, 2017, 121, 5439–5446, DOI:10.1021/acs.jpcb.7b02780.
- N. Goujon, R. Kerr, C. Gervillie, Y. V. Oza, L. A. O’Dell, P. C. Howlett and M. Forsyth, ACS Omega, 2020, 5, 2931–2938, DOI:10.1021/acsomega.9b03773.
- G. B. Chavhan, P. S. Babyn, B. Thomas, M. M. Shroff and E. M. Haacke, Radiographics, 2009, 29, 1433–1449, DOI:10.1148/rg.295095034.
- K. Romanenko, Annu. Rep. NMR Spectrosc., 2017, 67–114, DOI:10.1016/bs.arnmr.2016.12.002.
- M. Forsyth, F. Chen, L. A. O’Dell and K. Romanenko, Solid State Ionics, 2016, 288, 160–166, DOI:10.1016/j.ssi.2015.11.025.
- K. Romanenko, J. M. Pringle, L. A. O’Dell and M. Forsyth, Phys. Chem. Chem. Phys., 2015, 17, 18991–19000, 10.1039/C5CP03294F.
- M. Casalegno, F. Castiglione, G. Raos, G. B. Appetecchi, S. Passerini, A. Mele and E. Ragg, ACS Appl. Mater. Interfaces, 2020, 12, 23800–23811, DOI:10.1021/acsami.0c01890.
- J. Adebahr, F. C. Grozema, S. W. deLeeuw, D. R. MacFarlane and M. Forsyth, Solid State Ionics, 2006, 177, 2845–2850, DOI:10.1016/j.ssi.2006.07.061.
- L. Jin, S. de Leeuw, M. V. Koudriachova, J. M. Pringle, P. C. Howlett, F. Chen and M. Forsyth, Phys. Chem. Chem. Phys., 2013, 15, 19570–19574, 10.1039/C3CP53604A.
- F. Chen, S. W. de Leeuw and M. Forsyth, J. Phys. Chem. Lett., 2013, 4, 4085–4089, DOI:10.1021/jz402222j.
- F. Chen, J. M. Pringle and M. Forsyth, Chem. Mater., 2015, 27, 2666–2672, DOI:10.1021/acs.chemmater.5b00538.
- W. A. Henderson, D. M. Seo, Q. Zhou, P. D. Boyle, J.-H. Shin, H. C. De Long, P. C. Trulove and S. Passerini, Adv. Energy Mater., 2012, 2, 1343–1350, DOI:10.1002/aenm.201200130.
- N. Sirigiri, F. Chen, C. M. Forsyth, R. Yunis, L. O’Dell, J. M. Pringle and M. Forsyth, Mater. Today Phys., 2022, 22, 100603, DOI:10.1016/j.mtphys.2022.100603.
- F. Chen and M. Forsyth, Phys. Chem. Chem. Phys., 2016, 18, 19336–19344, 10.1039/C6CP01411A.
- P. C. Howlett, F. Ponzio, J. Fang, T. Lin, L. Jin, N. Iranipour and J. Efthimiadis, Phys. Chem. Chem. Phys., 2013, 15, 13784–13789, 10.1039/c3cp51986d.
- Y. Zhou, X. Wang, H. Zhu, M. Armand, M. Forsyth, G. W. Greene, J. M. Pringle and P. C. Howlett, Phys. Chem. Chem. Phys., 2017, 19, 2225–2234, 10.1039/c6cp07415d.
- F. Nti, L. Porcarelli, G. W. Greene, H. Zhu, F. Makhlooghiazad, D. Mecerreyes, P. C. Howlett, M. Forsyth and X. Wang, J. Mater. Chem. A, 2020, 8, 5350–5362, 10.1039/c9ta12827a.
- X. Wang, H. Zhu, G. W. Greene, Y. Zhou, M. Yoshizawa-Fujita, Y. Miyachi, M. Armand, M. Forsyth, J. M. Pringle and P. C. Howlett, Adv. Mater. Technol., 2017, 2, 1700046, DOI:10.1002/admt.201700046.
- J. Mindemark, M. J. Lacey, T. Bowden and D. Brandell, Prog. Polym. Sci., 2018, 81, 114–143, DOI:10.1016/j.progpolymsci.2017.12.004.
- S. Li, K. Yang, Z. Zhang, L. Yang and S.-I. Hirano, Ind. Eng. Chem. Res., 2018, 57, 13608–13614, DOI:10.1021/acs.iecr.8b01964.
- Z. Fang, M. Zhao, Y. Peng and S. Guan, Solid State Ionics, 2021, 373, 115806, DOI:10.1016/j.ssi.2021.115806.
- W. Wang, Z. Fang, M. Zhao, Y. Peng, J. Zhang and S. Guan, Chem. Phys. Lett., 2020, 747, 137335, DOI:10.1016/j.cplett.2020.137335.
- X. Wang, F. Chen, G. M. A. Girard, H. Zhu, D. R. MacFarlane, D. Mecerreyes, M. Armand, P. C. Howlett and M. Forsyth, Joule, 2019, 3, 2687–2702, DOI:10.1016/j.joule.2019.07.008.
- X. Li, Z. Zhang, S. Li, K. Yang and L. Yang, J. Mater. Chem. A, 2017, 5, 21362–21369, 10.1039/c7ta04204c.
- K. Yang, Z. Liao, Z. Zhang, L. Yang and S.-I. Hirano, Mater. Lett., 2019, 236, 554–557, DOI:10.1016/j.matlet.2018.11.003.
- F. Makhlooghiazad, P. C. Howlett, X. Wang, M. Hilder, D. R. MacFarlane, M. Armand and M. Forsyth, J. Mater. Chem. A, 2017, 5, 5770–5780, 10.1039/c6ta10340e.
- J. Luo, A. H. Jensen, N. R. Brooks, J. Sniekers, M. Knipper, D. Aili, Q. Li, B. Vanroy, M. Wübbenhorst, F. Yan, L. Van Meervelt, Z. Shao, J. Fang, Z.-H. Luo, D. E. De Vos, K. Binnemans and J. Fransaer, Energy Environ. Sci., 2015, 8, 1276–1291, 10.1039/c4ee02280g.
- V. Armel, M. Forsyth, D. R. MacFarlane and J. M. Pringle, Energy Environ. Sci., 2011, 4, 10.1039/c1ee01062j.
- Q. Li, J. Zhao, B. Sun, B. Lin, L. Qiu, Y. Zhang, X. Chen, J. Lu and F. Yan, Adv. Mater., 2012, 24, 945–950, DOI:10.1002/adma.201103976.
- R. Taniki, K. Matsumoto, T. Nohira and R. Hagiwara, J. Power Sources, 2014, 245, 758–763, DOI:10.1016/j.jpowsour.2013.07.020.
- M. Yoshizawa-Fujita, S. Kubota and S. Ishimoto, Front. Energy Res., 2022, 10, DOI:10.3389/fenrg.2022.854090.
- P. C. Howlett, Y. Shekibi, D. R. MacFarlane and M. Forsyth, Adv. Eng. Mater., 2009, 11, 1044–1048, DOI:10.1002/adem.200900186.
- L. Jin, P. Howlett, J. Efthimiadis, M. Kar, D. Macfarlane and M. Forsyth, J. Mater. Chem., 2011, 21, 10.1039/c0jm04401f.
- P. C. Howlett, J. Sunarso, Y. Shekibi, E. Wasser, L. Jin, D. R. MacFarlane and M. Forsyth, Solid State Ionics, 2011, 204–205, 73–79, DOI:10.1016/j.ssi.2011.09.012.
- J. Sunarso, Y. Shekibi, J. Efthimiadis, L. Jin, J. M. Pringle, A. F. Hollenkamp, D. R. MacFarlane, M. Forsyth and P. C. Howlett, J. Solid State Electrochem., 2012, 16, 1841–1848, DOI:10.1007/s10008-011-1566-6.
- A. P. Lewandowski, A. F. Hollenkamp, S. W. Donne and A. S. Best, J. Power Sources, 2010, 195, 2029–2035, DOI:10.1016/j.jpowsour.2009.10.059.
- H. Yoon, G. H. Lane, Y. Shekibi, P. C. Howlett, M. Forsyth, A. S. Best and D. R. MacFarlane, Energy Environ. Sci., 2013, 6, 979–986, 10.1039/C3EE23753B.
- Y. Shekibi, T. Rüther, J. Huang and A. F. Hollenkamp, Phys. Chem. Chem. Phys., 2012, 14, 10.1039/c2cp24077g.
- H. Ueda, F. Mizuno, R. Kerr, M. Forsyth and P. C. Howlett, Batteries Supercaps, 2022, 5, e202200057, DOI:10.1002/batt.202200057.
- L. Jin, P. C. Howlett, J. M. Pringle, J. Janikowski, M. Armand, D. R. MacFarlane and M. Forsyth, Energy Environ. Sci., 2014, 7, 3352–3361, 10.1039/c4ee01085j.
- I. A. Shkrob, T. W. Marin, Y. Zhu and D. P. Abraham, J. Phys. Chem. C, 2014, 118, 19661–19671, DOI:10.1021/jp506567p.
- R. Taniki, K. Matsumoto, R. Hagiwara, K. Hachiya, T. Morinaga and T. Sato, J. Phys. Chem. B, 2013, 117, 955–960, DOI:10.1021/jp311558h.
- K. Nishikawa, K. Fujii, T. Yamada, M. Yoshizawa-Fujita and K. Matsumoto, Chem. Phys. Lett., 2022, 803, 139771, DOI:10.1016/j.cplett.2022.139771.
- K. Hatakeyama-Sato, T. Tezuka, M. Umeki and K. Oyaizu, J. Am. Chem. Soc., 2020, 142, 3301–3305, DOI:10.1021/jacs.9b11442.
- Z. Wu, Q. Xu, J. Li and X.-M. Zhang, Chem. – Eur. J., 2021, 27, 4583–4587, DOI:10.1002/chem.202005032.
- A. Gutiérrez-Pardo, F. Aguesse, F. Fernández-Carretero, A. I. Siriwardana, A. García-Luis and A. Llordés, ACS Appl. Energy Mater., 2021, 4, 2388–2397, DOI:10.1021/acsaem.0c02439.
- C. Wang, K. R. Adair, J. Liang, X. Li, Y. Sun, X. Li, J. Wang, Q. Sun, F. Zhao, X. Lin, R. Li, H. Huang, L. Zhang, R. Yang, S. Lu and X. Sun, Adv. Funct. Mater., 2019, 29, 1900392, DOI:10.1002/adfm.201900392.
Footnotes |
| † Current address: Materials Science and Engineering, School of Materials and Chemical Technology, Tokyo Institute of Technology, 2-12-1-S8-36 Ookayama, Meguro-ku, Tokyo 152-8552, Japan. |
| ‡ The entropy of the fusion for plastic crystals is known to be less than 20 J K−1 mol−1. However, Timmermans proposed 5 e.u., which is equivalent to 20.92 J K−1 mol−1. In this review, we have adopted 20.92 J K−1 mol−1 as a more accurate value. |
| This journal is © The Royal Society of Chemistry 2023 |