
 Open Access Article
 This Open Access Article is licensed under a
 Creative Commons Attribution 3.0 Unported Licence
P3-type layered K0.6Cr0.6Ti0.4O2 for potassium storage applications†
Alok K.
Pandey
a,
Benoît D.L.
Campéon
b,
Itsuki
Konuma
b and
Naoaki
Yabuuchi
 *ab
*ab
aDepartment of Chemistry and Life Science, Yokohama National University, 79-5 Tokiwadai, Hodogaya-ku, Yokohama, Kanagawa 240-8501, Japan. E-mail: yabuuchi-naoaki-pw@ynu.ac.jp
bAdvanced Chemical Energy Research Center, Institute of Advanced Sciences, Yokohama National University, 79-5 Tokiwadai, Hodogaya-ku, Yokohama, Kanagawa 240-8501, Japan
First published on 3rd December 2022
Abstract
P3-type K0.6Cr0.6Ti0.4O2 is synthesized via a solid-state method and is tested as a positive electrode for potassium-ion batteries. It operates at a higher potential of Eave. = 3.14 V vs. K/K+, while delivering a reversible capacity superior to 40 mA h g−1 in a K cell. Excellent reversibility as an electrode material is achieved with a 3.9 V cutoff based on solid-state redox reaction of Cr ions. An in situ X-ray diffraction study reveals a reversible phase transition during K+ ion extraction/insertion. Furthermore, the excellent cyclability for 500 cycles at a rate of 40 mA g−1 coupled with good rate capability demonstrates its advantage as the host structure for potassium ion storage applications.
Introduction
Increasing renewable energy demand has put a lot of pressure on the Li-ion battery (LIB) industry due to the limited abundance and uneven presence of lithium resources around the world.1,2 An alternative to LIBs is deemed necessary for the future of sustainable energy storage systems. With similar intercalation chemistry, K-ion batteries (KIBs) have gained renewed attention in this regard, due to the high abundance of potassium (K+) ions in the Earth's crust and to its relatively low cost.3 Furthermore, the lower redox potential for potassium, E° (K/K+) = −2.93 V vs. standard hydrogen redox potential, compared to other metallic elements such as magnesium, makes it a potential battery system for high voltage operations. The lower solvation ability of K+ ions in organic electrolytes as compared with that of Li+ ions also results in the development of battery applications with high-power density.3 Recently, several materials have been reported as potential negative and positive electrodes for KIBs.4Graphite can (de)intercalate K+ ions, which satisfies the requirements for negative electrode materials.5–7 Good electrode reversibility has also been reported for the metallic potassium electrode.8 However, to realize the commercial application of KIBs, the development of positive electrodes with higher energy density is essential.9,10 Layered transition metal oxides have been extensively studied as positive electrode materials for alkali metal-ion batteries because such materials offer well-defined paths in the structure, which leads to fast ion migration. In this respect, several layered oxides with K+ ions, KxTMO2 (TM = 3d transition metal ions), have been reported in the past several years, including KxMnO2 (x = 0.3 and 0.5), KxCoO2 (x = 0.44 and 0.6), KxCrO2 (x = 0.69, 0.8, and 1), K0.48Mn0.4Co0.6O2, K0.7Fe0.5Mn0.5O2, K0.45Mn0.5Coo.5O2, K0.5Mn0.8Co0.1Ni0.1O2etc.11–21 Indeed, except for KCrO2, other stochiometric compounds of KTMO2 form non-layered structures. This phenomenon originates from the non-compatibility between large K+ ions and small TM ions. Large K+ ions induce strong in-plane K+–K+ repulsive electrostatic interactions, which necessitates large a lattice parameters, while relatively small TM ions tend to favor smaller a lattice parameters, leading to energetic destabilization of the O3-type layered structure. Herein, “O” denotes that Li ions are accommodated at octahedral sites, and “3” denotes the number of TMO2 layers in a unit cell.22 In contrast, LiCoO2 and LiNiO2 with small Li+ ions, which are also used for practical battery applications, crystallize into the O3-type layered structure, in which Li and TM ions sit in the two distinct octahedral sites alternately along the c-axis direction.23
In stoichiometric KCrO2, however, the compound surprisingly crystallizes in the O3-type structure. The stability of O3 KCrO2 is found to originate from Cr3+ ions having an unusual ligand field preference for the octahedral environment, which compensates for the energy penalty emerging from the short K+–K+ distance.19 However, O3 KCrO2 undergoes complex phase transitions during charge, and at the end of the first discharge, full reinsertion of K+ ions is not achieved. Furthermore, inferior cycling stability and rate capability is noted as electrode materials. Instead, other K-deficient Cr-based layered metal oxides with satisfactory electrochemical performance have been reported such as P3 K0.69CrO2 and P′3 K0.8CrO2.15,16 Unlike stochiometric O3 KCrO2, in these materials, the crystallographic site of K+ ions is prismatic (“P” denotes that K+ ions occupy prismatic sites), which provides larger free volume compared with octahedral sites, leading to easier migration for larger K+ ions. Nonetheless, all these Cr-based electrode materials operate at an average potential of <3.0 V. A high potential positive electrode vs. E° (K/K+) is required to develop KIBs with high voltage operation. In this article, we report a Ti-substituted Cr-based layered oxide, P3 K0.6Cr0.6Ti0.4O2, as a potential positive electrode material for KIBs. Excellent reversibility for K+ ion insertion/extraction coupled with good rate capability is achieved for P3 K0.6Cr0.6Ti0.4O2 and a higher operating voltage, superior to 3.0 V, is also demonstrated.
Results and discussion
For the synthesis of KxCrxTi1−xO2 materials, mixtures of K2CO3, TiO2, and Cr2O3 were ball milled with ethanol and pelletized followed by calcination at 1000 °C for 5 hours in an argon atmosphere. An excess of 5% K2CO3 was used to compensate for potassium loss at high temperatures. After the heat treatment and cooling, the samples were immediately transferred to an argon-filled glove box. The crystal structures of the as-prepared samples were analyzed using an X-ray diffractometer (a D2 PHASER instrument, Bruker) with an airtight sample holder to prevent air/moisture exposure. Fig. 1a shows the X-ray diffraction (XRD) patterns of KxCrxTi1−xO2 materials with different chemical compositions (x = 0.4, 0.5, 0.6, and 0.65). At x = 0.4 in KxCrxTi1−xO2, an impurity phase appears along with the major P3 phase. This impurity phase can be assigned to a tunnel-type structure and is expected to be a hollandite phase. In the 0.5 ≤ x ≤ 0.6 composition range, nearly single phase KxCrxTi1−xO2 compounds are successfully synthesized. Nevertheless, further increase in K+ ion content results in segregation of the starting material, Cr2O3, as evidenced by the XRD pattern of x = 0.65. The diffraction pattern with composition x = 0.6 was analyzed by Rietveld analysis (Fig. 1b and Fig. S1, ESI†) with the RIETAN-FP program.24 The lattice parameters were calculated to be ahex. = 2.968 and chex. = 19.06 Å for K0.6Cr0.6Ti0.4O2 in a hexagonal setting with rhombohedral symmetry (s.g. R![[3 with combining macron]](https://www.rsc.org/images/entities/char_0033_0304.gif) m) in accordance with P3 K0.69CrO2. However, the presence of minor impurity phases, which cannot be assigned as P3 phases, is also noted. The corresponding crystal structure schematic, which was drawn using the VESTA program,25 is also shown as an inset in Fig. 1b. K+ ions are accommodated in prismatic sites between (Cr, Ti)O2 layers with the “ABBCCA” oxygen sequence. The morphological observation of the as-prepared K0.6Cr0.6Ti0.4O2via field emission scanning electron microscopy (FE-SEM) (SU8010, Hitachi High-Tech) reveals that K0.6Cr0.6Ti0.4O2 consists of plate-shaped particles with a 0.5–1 μm size range exhibiting a layered structure (Fig. 1c). The energy-dispersive X-ray spectroscopy (EDX) mapping further confirms the presence and homogeneous distribution of all constituent elements. Furthermore, the layered structure of P3 K0.5Cr0.5Ti0.5O2 was directly observed at the atomic scale by high-angle annular dark-field scanning transmission electron microscopy (HAADF-STEM) as shown in Fig. 1d. The HAADF-STEM images were obtained using a JEOL JEM-ARM200F instrument with a CEOS CESCOR STEM Cs corrector (spherical aberration corrector) operated at an acceleration voltage of 200 kV. Details of the experimental setup, including specimen preparation, can be found in the literature.26 The HAADF-STEM images show significant contrast attributed to Cr0.5Ti0.5 and K layers. In particular, the presence of Cr and Ti ions is clearly visualized and the arrangement of both ions along the c-axis direction is consistent with the P3-type sequence. in the in-plane and through-plane interatomic distances are also in good agreement with the lattice parameters of P3 K0.5Cr0.5Ti0.5O2 (Fig. S1, ESI†). The interlayer distances of 255 and 630 pm in Fig. 1d correspond to those of the (100) and (003) planes, respectively.
m) in accordance with P3 K0.69CrO2. However, the presence of minor impurity phases, which cannot be assigned as P3 phases, is also noted. The corresponding crystal structure schematic, which was drawn using the VESTA program,25 is also shown as an inset in Fig. 1b. K+ ions are accommodated in prismatic sites between (Cr, Ti)O2 layers with the “ABBCCA” oxygen sequence. The morphological observation of the as-prepared K0.6Cr0.6Ti0.4O2via field emission scanning electron microscopy (FE-SEM) (SU8010, Hitachi High-Tech) reveals that K0.6Cr0.6Ti0.4O2 consists of plate-shaped particles with a 0.5–1 μm size range exhibiting a layered structure (Fig. 1c). The energy-dispersive X-ray spectroscopy (EDX) mapping further confirms the presence and homogeneous distribution of all constituent elements. Furthermore, the layered structure of P3 K0.5Cr0.5Ti0.5O2 was directly observed at the atomic scale by high-angle annular dark-field scanning transmission electron microscopy (HAADF-STEM) as shown in Fig. 1d. The HAADF-STEM images were obtained using a JEOL JEM-ARM200F instrument with a CEOS CESCOR STEM Cs corrector (spherical aberration corrector) operated at an acceleration voltage of 200 kV. Details of the experimental setup, including specimen preparation, can be found in the literature.26 The HAADF-STEM images show significant contrast attributed to Cr0.5Ti0.5 and K layers. In particular, the presence of Cr and Ti ions is clearly visualized and the arrangement of both ions along the c-axis direction is consistent with the P3-type sequence. in the in-plane and through-plane interatomic distances are also in good agreement with the lattice parameters of P3 K0.5Cr0.5Ti0.5O2 (Fig. S1, ESI†). The interlayer distances of 255 and 630 pm in Fig. 1d correspond to those of the (100) and (003) planes, respectively.
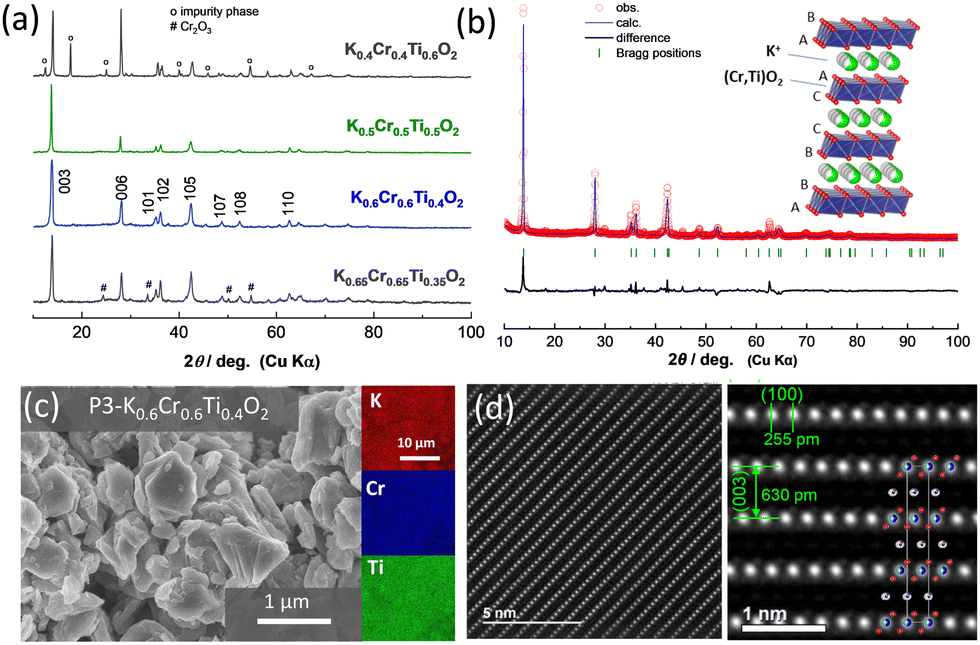 | ||
| Fig. 1 Structural characterization of KxCrxTi1−xO2; (a) the XRD patterns of KxCrxTi1−xO2 with different chemical compositions, (b) the Rietveld refined XRD pattern of K0.6Cr0.6Ti0.4O2 and a schematic illustration of the P3-type layered structure is also shown in the inset, (c) the FE-SEM image and EDX maps of K0.6Cr0.6Ti0.4O2, and (d) the HAADF-STEM images of K0.5Cr0.5Ti0.5O2. | ||
The electrochemical behavior of P3 K0.6Cr0.6Ti0.4O2 was further examined in the K cells. The composite electrode consisted of 80 wt% K0.6Cr0.6Ti0.4O2, 10 wt% acetylene black, and 10 wt% of poly(vinylidene fluoride) cast on an aluminum foil current collector. Metallic potassium was used as a counter electrode. The electrolyte solution used was 1.0 mol dm−3 KPF6 in ethylene carbonate and propylene carbonate (1![[thin space (1/6-em)]](https://www.rsc.org/images/entities/char_2009.gif) :1 in volume ratio, battery grade, Kishida Chemical). Electrochemical extraction of K+ ions from K0.6Cr0.6Ti0.4O2 was first studied in two ranges with different higher voltage cutoffs, 3.9 and 4.3 V, with a fixed lower voltage cutoff, 2.0 V, at a rate of 5 mA g−1. The galvanostatic charge/discharge at 2.0–3.9 V shows a sloping voltage profile from 2.7–3.9 V with a short voltage plateau at 2.9 V and delivers capacities of 45 and 41 mA h g−1 in the first charge and discharge, respectively (Fig. 2a). When the voltage cutoff was set to 3.9 V, reversible K+ ion intercalation is achieved for subsequent cycles with a higher operating voltage of Eave. = 3.14 V VS. K/K+. When the voltage cutoff is increased to 4.3 V, a lowered reversibility is observed (Fig. 2b). Indeed, the first charge capacity is increased to 60 mA h g−1, but the corresponding discharge capacity is limited to 46 mA h g−1, resulting in a low Coulombic efficiency of 77%. When charged to 3.9 V, distinguished voltage plateaus are observed in the dQ/dE curves as shown in Fig. 2c. However, the phase transitions are clearly less pronounced when compared with O3 K1−yCrO2.19 An identical trend was also reported in NaxCr1−xTixO2, and the presence of Ti ions, which are randomly substituted for Cr ions, effectively suppresses in-plane Na+ ion ordering coupled with charge ordering of Cr3+/Cr4+ ions.27,28 Similar phenomena in the electrochemical cycles are expected for P3 K0.6−yCr0.6Ti0.4O2. In contrast, after charging to 4.3 V, the voltage plateaus are less pronounced, resulting in a monotonous voltage profile. This observation implies that irreversible structural changes happen in the high-voltage region. Moreover, the effect of voltage cutoffs on the long-term cyclability of K0.6Cr0.6Ti0.4O2 has been evaluated at an elevated rate of 10 mA g−1. The results reported in Fig. 2d show that the voltage cutoff has a tremendous effect on the capacity retention of K0.6–yCr0.6Ti0.4O2. In the voltage range of 2.0–4.3 V, although a high discharge capacity of 53 mA h g−1 is obtained in the first cycle, the capacity rapidly fades to 20 mA h g−1 at the 150th cycle. This behavior indicates destabilization of the charged phase, including the electrolyte, during high voltage cycling. In contrast, highly reversible behavior is observed in the voltage range of 2.0–3.9 V. P3 K0.6Cr0.6Ti0.4O2 shows 94% retention even after 150 cycles. The electrochemical properties of P3 K0.5Cr0.5Ti0.5O2 are shown in Fig. S2 (ESI†). Although the reversible capacity is slightly reduced compared with K0.6Cr0.6Ti0.4O2, better capacity retention is evidenced with a 4.3 V cutoff with higher operating voltage.
:1 in volume ratio, battery grade, Kishida Chemical). Electrochemical extraction of K+ ions from K0.6Cr0.6Ti0.4O2 was first studied in two ranges with different higher voltage cutoffs, 3.9 and 4.3 V, with a fixed lower voltage cutoff, 2.0 V, at a rate of 5 mA g−1. The galvanostatic charge/discharge at 2.0–3.9 V shows a sloping voltage profile from 2.7–3.9 V with a short voltage plateau at 2.9 V and delivers capacities of 45 and 41 mA h g−1 in the first charge and discharge, respectively (Fig. 2a). When the voltage cutoff was set to 3.9 V, reversible K+ ion intercalation is achieved for subsequent cycles with a higher operating voltage of Eave. = 3.14 V VS. K/K+. When the voltage cutoff is increased to 4.3 V, a lowered reversibility is observed (Fig. 2b). Indeed, the first charge capacity is increased to 60 mA h g−1, but the corresponding discharge capacity is limited to 46 mA h g−1, resulting in a low Coulombic efficiency of 77%. When charged to 3.9 V, distinguished voltage plateaus are observed in the dQ/dE curves as shown in Fig. 2c. However, the phase transitions are clearly less pronounced when compared with O3 K1−yCrO2.19 An identical trend was also reported in NaxCr1−xTixO2, and the presence of Ti ions, which are randomly substituted for Cr ions, effectively suppresses in-plane Na+ ion ordering coupled with charge ordering of Cr3+/Cr4+ ions.27,28 Similar phenomena in the electrochemical cycles are expected for P3 K0.6−yCr0.6Ti0.4O2. In contrast, after charging to 4.3 V, the voltage plateaus are less pronounced, resulting in a monotonous voltage profile. This observation implies that irreversible structural changes happen in the high-voltage region. Moreover, the effect of voltage cutoffs on the long-term cyclability of K0.6Cr0.6Ti0.4O2 has been evaluated at an elevated rate of 10 mA g−1. The results reported in Fig. 2d show that the voltage cutoff has a tremendous effect on the capacity retention of K0.6–yCr0.6Ti0.4O2. In the voltage range of 2.0–4.3 V, although a high discharge capacity of 53 mA h g−1 is obtained in the first cycle, the capacity rapidly fades to 20 mA h g−1 at the 150th cycle. This behavior indicates destabilization of the charged phase, including the electrolyte, during high voltage cycling. In contrast, highly reversible behavior is observed in the voltage range of 2.0–3.9 V. P3 K0.6Cr0.6Ti0.4O2 shows 94% retention even after 150 cycles. The electrochemical properties of P3 K0.5Cr0.5Ti0.5O2 are shown in Fig. S2 (ESI†). Although the reversible capacity is slightly reduced compared with K0.6Cr0.6Ti0.4O2, better capacity retention is evidenced with a 4.3 V cutoff with higher operating voltage.
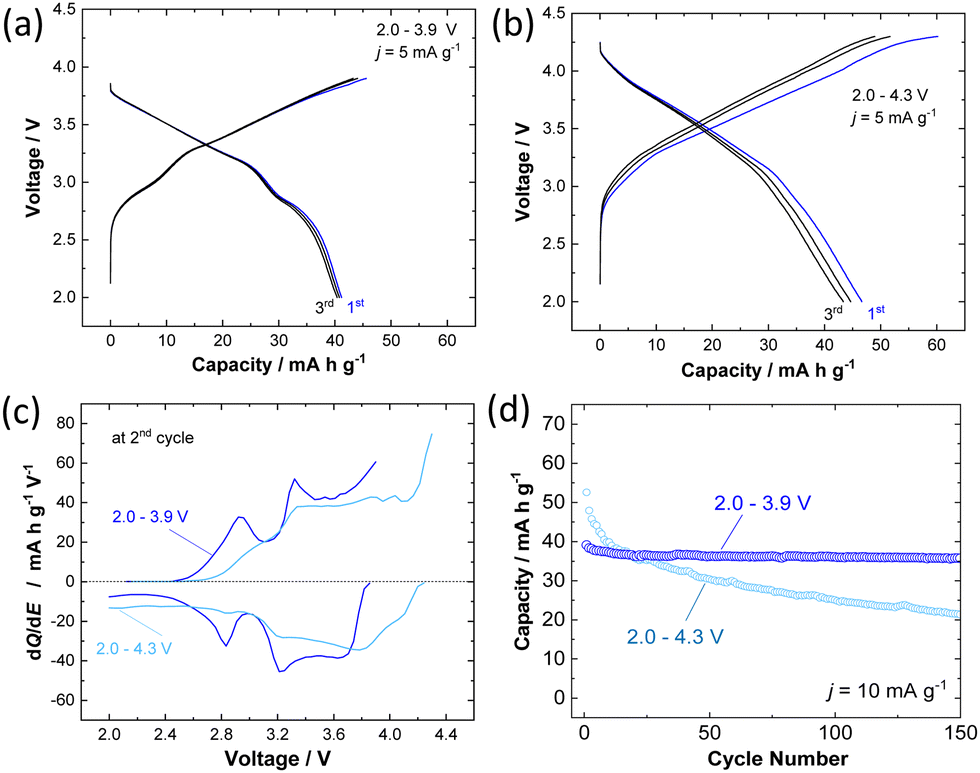 | ||
| Fig. 2 Electrochemical properties of K0.6Cr0.6Ti0.4O2; (a) the charge/discharge curves of the sample in the potential window range of 2.0–3.9 V at a current rate of 5 mA g−1, (b) charge/discharge profiles in the potential window range of 2.0–4.3 V, (c) dQ/dE plots at the 2nd cycle in the voltage range of 2.0–3.9 V and 2.0–4.3 V, and (d) capacity retention for 150 cycles with two distinct voltage cutoffs at a current rate of 10 mA g−1. | ||
To understand the K+ ion storage mechanisms of K0.6−yCr0.6Ti0.4O2, an in situ XRD study during the first two cycles was conducted (Fig. 3a). During the charging, the 003 and 006 peaks shift towards lower angles resulting from the expansion of the layer distance between alternating (Cr, Ti)O2 layers and the peaks return back to their original position on subsequent discharge, indicating highly reversible changes as electrode materials. Continuous changes in the peak positions, suggesting single phase reaction and solid solution formation, are found, except for the plateau region around 2.9 V, which is indicative of two-phase coexistence at the start of charge. Non-continuous change in the diffraction lines at the 2.9 V plateau region is clearly observed for the 006 diffraction line at 27.8 degrees. Simultaneously, the peak intensity of the 10l diffraction lines, especially for the 105 line at 42.3 degrees, is reduced on charge beyond this voltage plateau. Note that the peak intensity is recovered after the end of discharge. Because the prismatic sites are energetically stabilized by the presence of large K+ ions, K+ ion extraction induces phase transition and generally P3 to O3 phase transition is observed.15 P3 to O3 phase transition is confirmed by the disappearance of the 105 peak for the P3 phase and the simultaneous appearance of the 104 peak corresponding to the O3 phase.12 Unfortunately, the peak position of a Be window used for the in situ cell coincides with the position of the 104 peak at 41 degrees (Fig. S3, ESI†). Therefore, additional ex situ XRD data were collected during the charging process. Fig. S4 (ESI†) shows the simulated XRD patterns of K0.6Cr0.6Ti0.4O2 with P3- and O3-type structures and the presence of 104 or 105 peaks can differentiate between the two layered phases. The experimentally observed ex situ XRD patterns for the charged samples are also shown in Fig. S4 (ESI†). The 104 peak does not appear during charging to 3.9 V, suggesting that the P3 phase is retained on cycling and no phase transition to the O3 phase is evidenced. However, the broadening of the 105 peak suggests that stacking faults, probably associated with the partial formation of the O3 phase, are induced along the c-axis direction after K+ ion extraction.29 The lattice parameter changes upon charging during the 2nd cycle are also shown in Fig. 3b. The c-axis lattice parameter increases on charging because the K+ ion extraction results in the increased electrostatic repulsion of the (Cr, Ti)O2 layers and the expansion of the interlayer distance. From the in situ XRD patterns, although the co-existence of two distinct P3 phases with different interlayer distances is noted at the start of charge, averaged interlayer distances are plotted in Fig. 3b for simplicity. On the other hand, the a-axis lattice parameter decreases as the in-plane K+–K+ repulsive electrostatic interaction is reduced. The overall change in unit cell volume is relatively small, ∼0.27% in the voltage range of 2.0–3.9 V, leading to good capacity retention as an electrode material. The volume change during charge/discharge is one of the lowest among electrode materials for KIBs reported so far (Table S2, ESI†). The structural changes were further examined by an in situ XRD study with a higher voltage cutoff of 4.3 V (Fig. S5, ESI†). Upon charging, the intensity of the 006 peak is significantly decreased above 3.9 V. Moreover, the peak intensity of the 105 line is not recovered after discharge. Such irreversibility of structural evolution is indicative of structural deterioration on charging above 3.9 V, resulting in inferior reversibility as an electrode material.
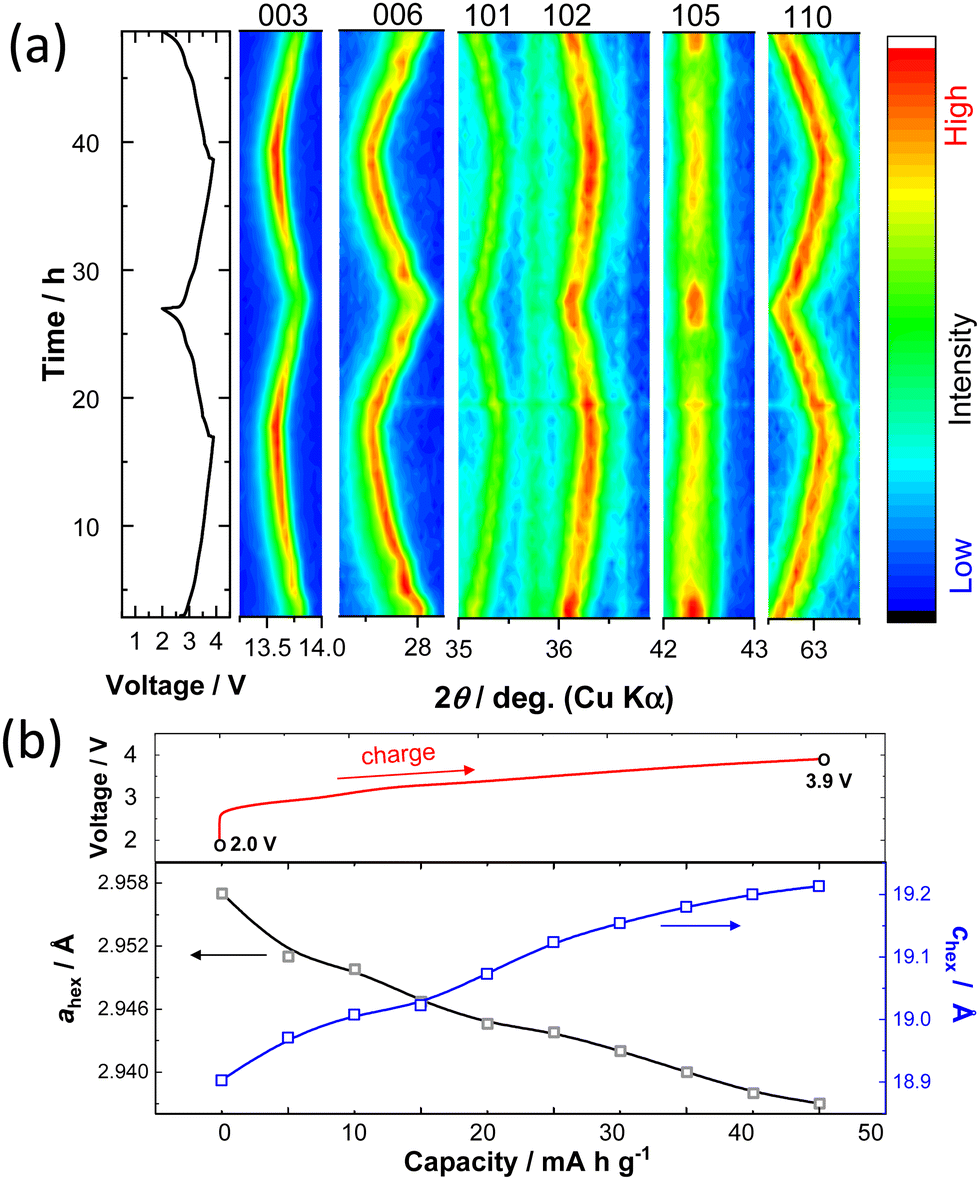 | ||
| Fig. 3 Structural changes of K0.6–yCr0.6Ti0.4O2 during charge/discharge; (a) the contour plots of in situ XRD data during the first two cycles in the voltage range of 2.0–3.9 V at a rate of 4 mA g−1. The voltage change of the in situ cell is also shown. (b) Lattice parameter variations during the 2nd charge cycle. | ||
To further assess the practical feasibility of P3 K0.6Cr0.6Ti0.4O2 for battery applications, the long-term cyclability was also tested and the sample was cycled for 500 cycles in the potential range of 2.0–3.9 V at a rate of 40 mA g−1 (Fig. 4a). A reversible capacity of 30 mA h g−1 is retained (i.e., 98% of initial capacity) after 500 cycles along with 99.7% Coulombic efficiency for charge/discharge cycles. The selected charge/discharge curves (200th, 300th, 400th, and 500th cycles) provided in Fig. 4b show no significant change attesting to the remarkable structural stability of K0.6Cr0.6Ti0.4O2 against repeated K+ ion insertion/de-insertion. The fast K+ ion conduction due to low solvation energy associated with lower charge density for large K+ ions is evidenced by the rate capability test (Fig. 4c). A discharge capacity of 30 mA h g−1 is achieved even at a rate of 640 mA g−1. Although the reversible capacity of K0.6Cr0.6Ti0.4O2 (40 mA h g−1) is smaller compared with that of KCrO2 (80 mA h g−1), the higher operating voltage (Eave. = 3.14 V for K0.6Cr0.6Ti0.4O2vs. ∼2.5 V for KCrO219) coupled with superior durability is advantageous to design a full cell with graphite. The combination of average potential and reversibility makes K0.6Cr0.6Ti0.4O2 an attractive positive electrode in comparison to other positive electrodes for KIBs (Table S3, ESI†).
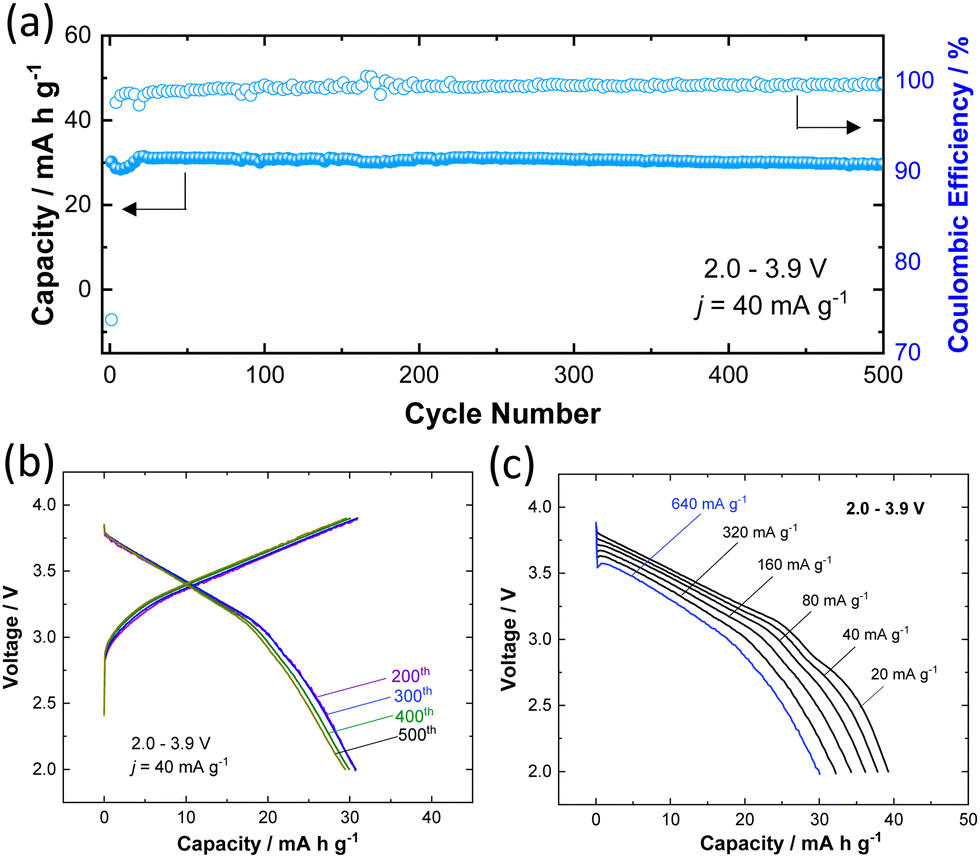 | ||
| Fig. 4 Electrochemical properties of K0.6Cr0.6Ti0.4O2 as a potential positive electrode material for KIBs; (a) cycling stability for 500 cycles in the potential range of 2.0–3.9 V, (b) corresponding charge/discharge curves at the 200th, 300th, 400th, and 500th cycles, and (c) rate capability (active material mass loading: 2.16 mg cm−2). | ||
In summary, we have successfully synthesized phase pure P3-type K0.6Cr0.6Ti0.4O2via a facile solid-state route. Without any optimization for particle size and morphology, it has delivered a reversible capacity of 43 and 30 mA h g−1 at a current rate of 5 and 640 mA g−1, respectively, with excellent capacity retention. This compound with reversible Cr redox was found to show less pronounced phase transition on K+ ion (de)insertion processes when compared with other layered oxides, which is beneficial for long life operation. Because Cr ions are not used as electrode materials for lithium battery applications, Cr-based layered oxides could be potentially used for potassium/sodium battery applications. This research progress will lead to the development of cost-effective and high-performance KIBs with moderate energy density in the future.
Conflicts of interest
There are no conflicts to declare.Acknowledgements
This work has been partially supported by JSPS, Grant-in-Aid for Scientific Research (Grant Numbers 19H05816 and 21H04698), and JST, CREST Grant Number JPMJCR21O6, Japan. We thank Dr Yoshinobu Miyazaki and Dr Tomohiro Saito from Sumika Chemical Analysis Service, Ltd for the STEM observation. We thank Dr Debasmita Dwibedi for partial support of manuscript preparation.References
- L. Mauler, X. Lou, F. Duffner and J. Leker, Energy Adv., 2022, 1, 136–145 RSC.
- B. D. L. Campéon and N. Yabuuchi, Chem. Phys. Rev., 2021, 2, 041306 CrossRef.
- J. C. Pramudita, D. Sehrawat, D. Goonetilleke and N. Sharma, Adv. Energy Mater., 2017, 7, 1602911 CrossRef.
- L. Fan, Y. Hu, A. M. Rao, J. Zhou, Z. Hou, C. Wang and B. Lu, Small Methods, 2021, 5, 2101131 CAS.
- Z. Jian, W. Luo and X. Ji, J. Am. Chem. Soc., 2015, 137, 11566–11569 CrossRef CAS PubMed.
- D. Igarashi, K. Kubota, T. Hosaka, R. Tatara, T. Inose, Y. Ito, H. Inoue, M. Takeuchi and S. Komaba, Electrochemistry, 2021, 89, 433–438 CrossRef CAS.
- K. Kubota, Electrochemistry, 2020, 88, 507–514 CAS.
- W. Xu, H. Wang, Y. Gao, Y. Wei, H. Zhang, C. Gao, F. Kang and D. Zhai, Energy Adv., 2022, 1, 191–196 Search PubMed.
- T. Hosaka, K. Kubota, A. S. Hameed and S. Komaba, Chem. Rev., 2020, 120, 6358–6466 CAS.
- H. Kim, J. C. Kim, M. Bianchini, D. H. Seo, J. Rodriguez-Garcia and G. Ceder, Adv. Energy Mater., 2018, 8, 1702384 Search PubMed.
- C. Vaalma, G. A. Giffin, D. Buchholz and S. Passerini, J. Electrochem. Soc., 2016, 163, A1295 CAS.
- H. Kim, D. H. Seo, J. C. Kim, S. H. Bo, L. Liu, T. Shi and G. Ceder, Adv. Mater., 2017, 29, 1702480 Search PubMed.
- Y. Hironaka, K. Kubota and S. Komaba, Chem. Commun., 2017, 53, 3693–3696 CAS.
- H. Kim, J. C. Kim, S. H. Bo, T. Shi, D. H. Kwon and G. Ceder, Adv. Energy Mater., 2017, 7, 1700098 Search PubMed.
- J.-Y. Hwang, J. Kim, T.-Y. Yu, S.-T. Myung and Y.-K. Sun, Energy Environ. Sci., 2018, 11, 2821–2827 CAS.
- N. Naveen, S. C. Han, S. P. Singh, D. Ahn, K.-S. Sohn and M. Pyo, J. Power Sources, 2019, 430, 137–144 CAS.
- K. Sada and P. Barpanda, Chem. Commun., 2020, 56, 2272–2275 CAS.
- X. Wang, X. Xu, C. Niu, J. Meng, M. Huang, X. Liu, Z. Liu and L. Mai, Nano Lett., 2017, 17, 544–550 CAS.
- H. Kim, D.-H. Seo, A. Urban, J. Lee, D.-H. Kwon, S.-H. Bo, T. Shi, J. K. Papp, B. D. McCloskey and G. Ceder, Chem. Mater., 2018, 30, 6532–6539 CAS.
- Z. Zhang, J. Sun, L. Duan, Y. Du, J. Li, J. Shen and X. Zhou, J. Mater. Chem. A, 2022, 10, 554–560 CAS.
- L. Duan, Y. Xu, Z. Zhang, J. Xu, J. Liao, J. Xu, Y. Sun, Y. He and X. Zhou, J. Mater. Chem. A, 2021, 9, 22820–22826 CAS.
- C. Delmas, C. Fouassier and P. Hagenmuller, Physica B+C, 1980, 99, 81–85 CAS.
- N. Ikeda, I. Konuma, H. B. Rajendra, T. Aida and N. Yabuuchi, J. Mater. Chem. A, 2021, 9, 15963–15967 CAS.
- F. Izumi and K. Momma, Solid State Phenom., 2007, 130, 15–20 CAS.
- K. Momma and F. Izumi, J. Appl. Crystallogr., 2011, 44, 1272–1276 CAS.
- T. Masese, Y. Miyazaki, G. Mbiti Kanyolo, T. Takahashi, M. Ito, H. Senoh and T. Saito, ACS Appl. Nano Mater., 2021, 4, 279–287 CAS.
- Y. Tsuchiya, K. Takanashi, T. Nishinobo, A. Hokura, M. Yonemura, T. Matsukawa, T. Ishigaki, K. Yamanaka, T. Ohta and N. Yabuuchi, Chem. Mater., 2016, 28, 7006–7016 CAS.
- R. Umezawa, Y. Tsuchiya, T. Ishigaki, H. B. Rajendra and N. Yabuuchi, Chem. Commun., 2021, 57, 2756–2759 CAS.
- C. Delmas and C. Tessier, J. Mater. Chem., 1997, 7, 1439–1443 CAS.
Footnote |
| † Electronic supplementary information (ESI) available. See DOI: https://doi.org/10.1039/d2ya00223j |
| This journal is © The Royal Society of Chemistry 2023 |