
 Open Access Article
 This Open Access Article is licensed under a
 Creative Commons Attribution 3.0 Unported Licence
Spatio-temporal variation in air quality and unexpected pollution levels during the lamp event over the Indo-Gangetic Plain in the first wave of the COVID-19 pandemic†
Isha
Goyal
,
Puneet Kumar
Verma
,
Vipin
Singh
,
K. Maharaj
Kumari
and
Anita
Lakhani
 *
*
Department of Chemistry, Dayalbagh Educational Institute, Agra-282005, India. E-mail: anita.lakhani01@gmail.com; anitalakhani@dei.ac.in
First published on 25th October 2022
Abstract
This study focuses on spatio-temporal variation in air quality caused by the nationwide lamp event of nine minutes named as the “#9 pm 9 min event” during the historic lockdown in the first wave of the COVID-19 pandemic across India in the year 2020. Due to the Janta curfew (March 22, 2020) and the lockdown (from March 25 to May 31, 2020), the concentration of pollutants like fine particulate matter (PM2.5), trace gases such as nitrogen dioxide (NO2), sulphur dioxide (SO2), and carbon monoxide (CO), and volatile organic compounds (VOCs), namely benzene and toluene reduced significantly in the six most polluted cities, i.e., Agra, Ghaziabad, Lucknow, Meerut, Noida and Varanasi in the Indo-Gangetic Plain (IGP), while the concentration of ozone increased. A maximum decline in PM2.5 concentrations was observed in Noida (43%), followed by Ghaziabad (39%), Lucknow (33%), Meerut (25%), Agra (23%) and Varanasi (5%) during phase-1 (P1) of lockdown in comparison with the period before lockdown. Similar to PM2.5, other pollutants also decreased at all sites under consideration. This event (lamp event, #9 pm 9 min event) offered an exclusive opportunity to study the effects of burning oil lamps or candles in an open environment with minimum industrial and vehicular emissions. The decline in pollution levels reversed in the wake of the lamp event, which resulted in a sharp increase in pollutant concentrations, except for ozone levels. PM2.5 mass concentrations were significantly correlated with benzene (0.7) and CO (0.7), whereas toluene was moderately correlated with benzene (0.5). Principal component analysis (PCA) also revealed that increases in the concentrations of PM2.5, NO2, CO, benzene and toluene were largely due to oil-based emissions. The study points out that future policy initiatives should take into account the changes in air quality which were seen during the lamp event. These changes have reinforced the necessity for comprehensive action across all emission sectors to achieve significant air quality improvements. It is also advised that people should strictly follow the guidelines issued by the government during such events.
Environmental significanceThe peer-reviewed literature includes assessments of air quality and unexpected pollution levels during the lamp event over the Indo-Gangetic Plain in the first wave of the COVID-19 pandemic. During phase-1 of lockdown, levels of atmospheric pollutants such as PM2.5, SO2, NOx, CO, benzene and toluene dropped in ambient air in all the considered sites, while ozone levels increased. However, PM2.5 levels increased unusually, followed by benzene, toluene, NOx, and CO while the concentration of ozone decreased in ambient air during the lamp event. The study indicated that pollution trends got reversed during the lockdown. However, this is the first work that relates the impact of the lamp-event named as the #9 pm 9 min event on the atmosphere in an open environment with minimum industrial and vehicular emissions during phase-1 (P1) of the lockdown period during COVID-19. This study concludes that emissions from small lamps, candles, oil-lamps, etc. on a large scale can play an important role in transforming ambient pollution levels. The study could add new aspects to the field of atmospheric sciences by correlating substantial emissions from the use of oil-based lamps and candles with air pollutants like PM2.5, benzene, and toluene in the absence of conventional pollution sources like industries and vehicular activity. |
1. Introduction
The COVID-19 pandemic almost brought the whole world to its knees. As part of the fight against the outbreak of the disease, governments of several countries engaged in unprecedented control measures like evacuating citizens, halting international flights, banning large-scale public gatherings and imposing curfews on citizen movements.1 These curtailed anthropogenic emissions during the COVID-19 pandemic lockdown, and pollution levels reduced across the globe, which confirmed that natural processes like deposition, diffusion and dispersion can effectively clear the air.2 From 2019 to 2020, 65% of cities across the world had prodigious improvements in air quality, while 84% of the countries saw an overall improvement globally,3 including India.4–6In response to the global pandemic, the Government of India (GoI) declared a nationwide lockdown of 21 days from March 24 to April 14, extending further to May 31, 2020.7 Indian lockdown was a historical event, which locked almost 1.3 billion people inside their homes, and most of the governmental, social and community mobility activities were restricted completely. Industrial and mass transportation were banned, except for “essential services” including water, electricity and health services.8 Further, as a collective measure and as a token of appreciation for the entire medical community and armed forces for their services, Indian Prime Minister, Mr Narendra Modi urged Indians to light candles or oil lamps (diyas) or hold torches for 9 minutes at 9:00 pm (21:00 h) on April 5, 2020. This was thought to be a symbolic gesture for the collective strength of 1.3 billion Indians that would strengthen the country in the fight against the COVID-19 pandemic. In response to this appeal, millions of Indians across the country lit candles, oil lamps and electrical flashlights at 9:00 pm for 9 minutes on April 5, 2020 to express their spirits, i.e., “collective resolve and solidarity” towards the fight against Coronavirus.9 Perhaps , in over-enthusiasm, many citizens considered it as a call to celebrate early Diwali (the festival of lights) and took this call to set off firecrackers further. Consequently, the air quality in several Indian cities began to degrade (https://www.indiatoday.in/diu/story/coronvirus-lockdown-april-5-fireworks-air-quality-1664276-2020-04-07). The exhaust fumes of candles made with different waxes and finishing chemicals have shown the presence of dibenzofurans (PCDF), polychlorinated dibenzo-p-dioxins (PCDD), a few chlorinated pesticides, polycyclic aromatic hydrocarbons (PAH), and a few VOCs, even, the composition of combustion products is comparable to that of diesel engine fumes as well.10,11 Similar oil-based emissions from rituals and religious activities have also been reported which significantly contribute to India's total carbonaceous aerosol emissions, amounting to 102 Gg per year for organic carbon and 73 Gg per year for black carbon.12 Hence, the burning of candles or oil-lamps and a few instances of bursting crackers during the lamp event were thought to be the main causes of the high levels of particulate matter (PM) and gaseous pollutants like CO and VOCs. Although several studies have explored the air quality in various parts of India during the complete lockdown,4,7,13–16 none have explored the impact of the lamp event on air quality. This study explicitly investigates how the lamp event influenced ambient air quality during this rare occasion through a comprehensive analysis of both temporal and diurnal variations of several air pollutants.
2. Methodology
2.1. Study area
The IGP region covers 700 thousand kilometers (172-million acres) of the northern part of the Indian subcontinent, which includes northern and eastern India, middle Pakistan and southern plains of Bangladesh. It comprises five states, namely Punjab, Haryana, Uttar Pradesh (U.P.), Bihar (excluding Chhota Nagpur plateau), West Bengal (W.B.) and one union territory, Delhi. Extremes of cold, heat, and rainfall characterize the annual weather cycle, which is governed by seasonality.17 The present study was carried out at six highly polluted cities, namely Agra, Ghaziabad, Lucknow, Meerut, Noida and Varanasi in the Indo-Gangetic Plain (IGP). Five out of six cities of concern were mentioned as the most polluted regional cities by the World Health Organization (WHO).32.2. Data collection
The data of meteorological parameters, namely, ambient temperature (AT), relative humidity (RH), wind direction (WD), wind speed (WS), solar radiation (SR), and rainfall (RF) and the criteria air pollutants, i.e., PM2.5 (particles less than 2.5 μm in diameter), NO2, SO2, CO, O3, benzene and toluene were obtained from the online portal of Continuous Ambient Air Quality Monitoring Stations (CAAQMS) (https://app.cpcbccr.com/ccr/) of Sanjay Place, Agra (A); Loni, Ghaziabad (G); Gomti Nagar, Lucknow (L); Ganga Nagar, Meerut (M); Sector-1, Noida (N) and Ardhali Bazar, Varanasi (V) (Fig. 1). These CAAQM stations are managed by the Central Pollution Control Board (CPCB), and their detailed information is provided in Table 1. The recorded data with a time resolution of one-hour were analysed from March 1 to April 14, 2020. The data of fire counts were taken from the Fire Information for Resources Management System (FIRMS) portal (https://firms.modaps.eosdis.nasa.gov/map/). The mobility data were also retrieved from Google maps (https://www.google.com/covid19/mobility/).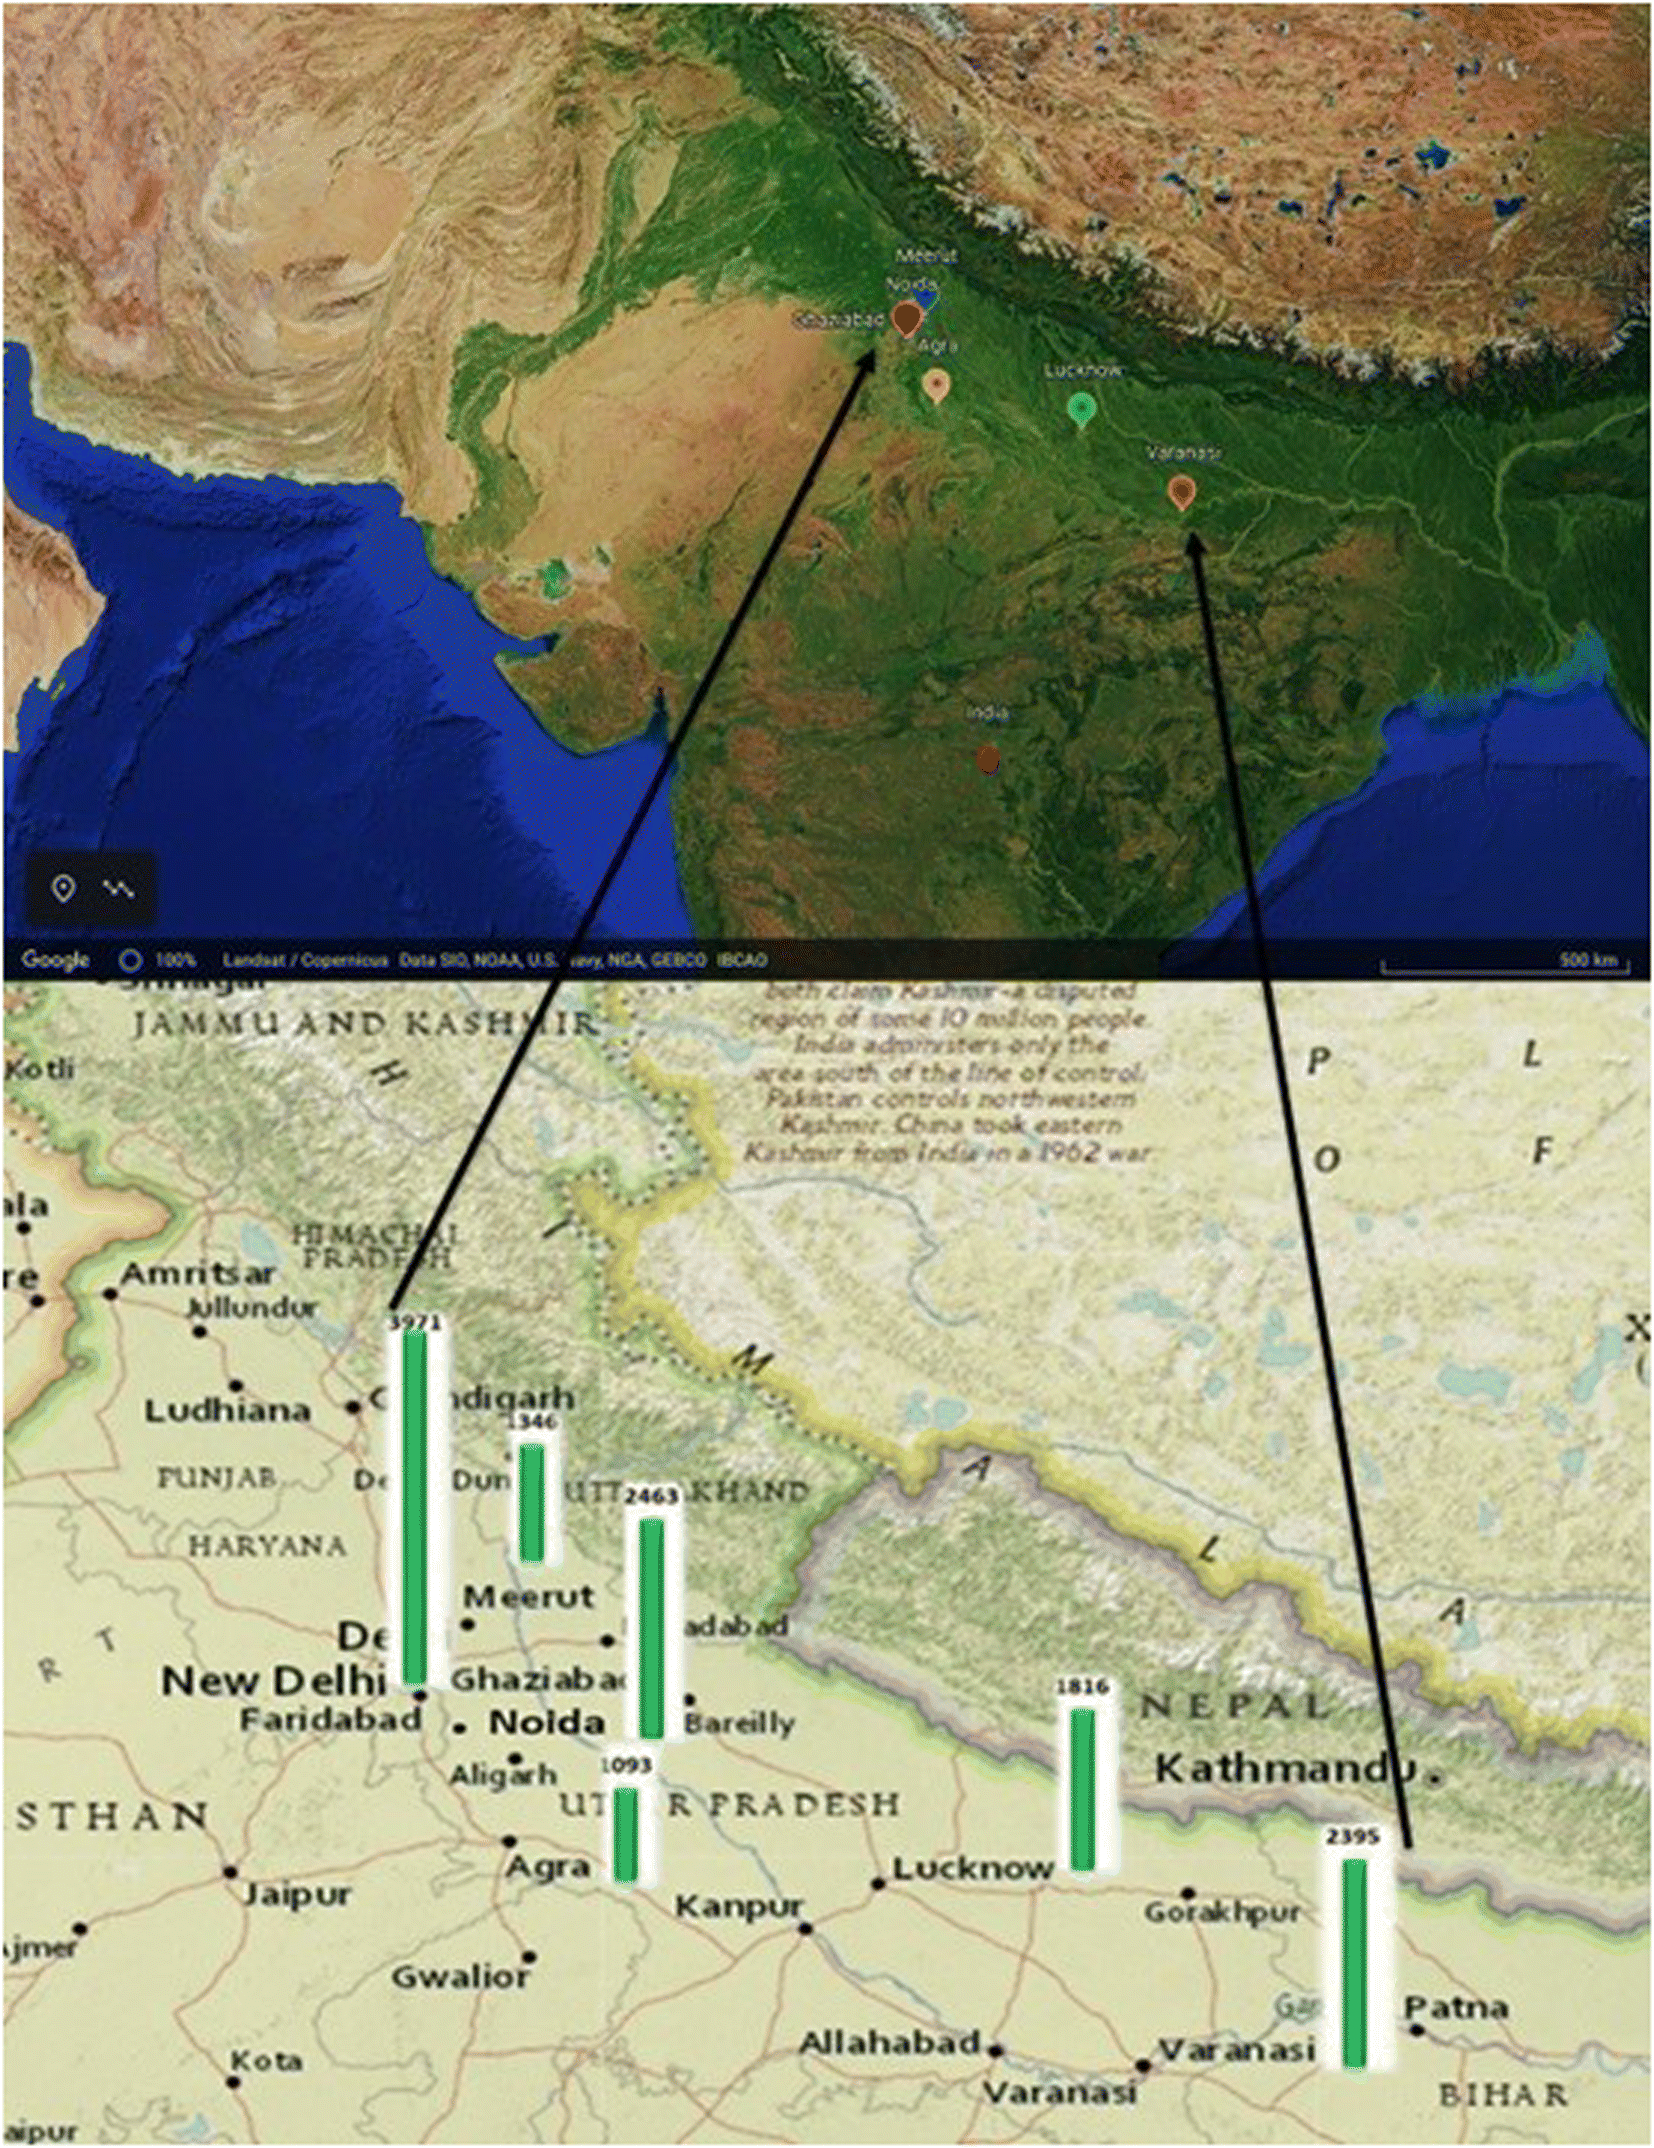 | ||
| Fig. 1 Selected cities used for the study of air pollutants along with their population density (in per km2). Source: Google Earth. | ||
| Stations, locations | Latitude, longitude | Population density (in per km2)27 | Site description, pollution sources |
|---|---|---|---|
| Sanjay Place, Agra (A) | 27° 10′ N, 78° 05′ E | 1093 | Commercial site, vehicular exhaust, road dust, domestic cooking, industries (point source & area source), garbage burning & agriculture waste burning28 |
| Loni, Ghaziabad (G) | 28° 40′ N, 77° 28′ E | 3971 | Industrial site, vehicular exhaust, road dust, construction & demolition activities, industries29 |
| Gomti Nagar, Lucknow (L) | 26° 55′ N, 80° 59′ E | 1816 | Commercial site, vehicular exhaust, road dust, construction & demolition activities, industries (point source & areas source), garbage burning & agriculture waste burning30 |
| Ganga Nagar, Meerut (M) | 29° 01′ N, 77° 45′ E | 1346 | Commercial site, vehicular exhaust, road dust, construction & demolition activities, industries (point source & areas source), domestic cooking, garbage burning & agriculture waste burning31 |
| Sector-1, Noida (N) | 28° 54′ N, 77° 33′ E | 2463 | Industrial site, vehicular exhaust, road dust, construction & demolition activities, industries (point source & areas source), garbage burning & agriculture waste burning32 |
| Ardhali Bazar, Varanasi (V) | 25° 20′ N, 83° 00′ E | 2395 | Commercial site, vehicular exhaust, road dust, domestic cooking, construction & demolition activities, garbage burning & agriculture waste burning33 |
To obtain a better insight into the variation in the concentration of pollutants during P1 of the lockdown (March, 25 to April 14, 2020), the data of Agra and Varanasi, during the same period, from the year 2015 to 2019, were analysed and compared with P1 of the lockdown. This facilitated minimising the effect of meteorological conditions. Missing records, incorrect data, and outliers in the observation were excluded from the study and considered invalid data. During the analysis period, only sites with more than 80% valid data were explored for the study.
To explore the specific characteristics of the lamp event, the temporal variation of PM2.5, NO2, SO2, CO, O3, benzene, toluene and planetary boundary layer height (PBLH) at Agra was further analysed during the second week of P1 of lockdown (April 3 to April 8, 2020) with a time resolution of one-hour. High-resolution data (averaged over 15 min intervals) of PM2.5, benzene and PBLH were also assessed to examine the intense effect of the lamp event. The data of PBLH were computed from the final run data archive of the Global Data Assimilation System Model using NOAA (National Oceanic and Atmospheric Administration), Air Resources Laboratory (ARL), and Hybrid Single-Particle Lagrangian Integrated Trajectory (HYSPLIT) Models (https://www.arl.noaa.gov/ready/hysplit4.html) for Agra at 1:00 h (UTC) during the study period.18
PM2.5 is quantified using the beta attenuation principle, while nitrogen oxides are measured using the chemiluminescence technique. Carbon monoxide is measured using the nondispersive infrared (NDIR) method with gas filter correlation. The principle of pulsed UV fluorescence is used to analyse SO2, whereas the UV photometric approach is used to analyse ozone. Benzene and toluene are measured using online gas chromatographs.19 Using state-of-the-art technology, all the meteorological parameters, such as AT, RH, WD, WS, SR, and RF, are measured using meteorological instruments, which transmit automated data every 15 minutes on the online portal of CAAQMS. Capacitive methods are adopted for measuring AT and RH and an ultrasonic anemometer is used for measuring WS and WD. SR is measured using a pyranometer and RF is determined using a tipping bucket. CPCB provides quality assurance and data quality after following a rigorous protocol for the sampling, analysis and calibration, which is ensured as per the standards set by CPCB, India (https://cpcb.nic.in/quality-assurance-quality-control/).
2.3. Statistical analysis
The data were subjected to multivariate statistical analysis, including correlation, p-value, and principal component analysis, using SPSS software (version 16.0).PCA is the most frequently used technique for multivariate statistical analysis among several available alternatives.20 PCA reduces the multidimensionality of a large dataset having a number of variables by converting it to an easily interpretable small dataset with a new set of components or factors which denote the variables of an old dataset having linear combinations between them.5 These new factors are arranged according to the computed percentage variance. This technique is widely used to identify air pollution sources.21–26 PCA was performed using 15 min (number of data points: 192 in each city) average concentrations of PM2.5, NO2, SO2, CO (except for Lucknow and Varanasi), ozone, benzene and toluene on April 5–6, 2020 acquired from the selected CAAQM stations. PCA was accomplished by the Varimax Rotation to improve the orthogonality of resolved factors using SPSS software (version 16.0). Principal component (PC) extractions were made by considering eigen values ≥1.
3. Results and discussion
3.1. Spatio-temporal variation in the concentrations of air pollutants during the COVID-19 pandemic
Variations in pollution levels occurred due to the numerous restrictions imposed to combat the threat of COVID-19. These changes in air pollution levels were caused by various factors, including a halt in public transportation, mobility of citizens, shut down of industries and power plants, and many other components. Despite this, the lamp event has been highlighted with constrained anthropogenic activity during P1 of lockdown. Table 2 summarises the key sources and variations in activities that occurred before the lockdown and during P1 of the lockdown.| Period | Before lockdown | During P1 of the lockdown | Ref. | |
|---|---|---|---|---|
| a https://www.nytimes.com/2020/03/24/world/asia/india-coronavirus-lockdown.html. b https://www.livemint.com/news/india/pm-modi-announces-extension-of-lockdown-till-3-may-11586839412073.html. c https://www.ndtv.com/india-news/nationwide-lockdown-over-coronavirus-extended-for-two-weeks-beyond-may-4-2221782. d https://firms.modaps.eosdis.nasa.gov/map/. e No activity was performed during the period. | ||||
| Duration | March 1 to March 24, 2020 | March 25 to April 5, 2020 | April 6 to April 14, 2020 | , , |
| Crop (Rabi) cycle | Wheat growing | Harvest | Harvest | 34 |
| Fire counts per day | 36 | 35 | 46 | |
| Vehicular exhaust | Unrestricted | Restricted movement/only essential services | Restricted movement/only essential services | 35 |
| Road dust | Normal | No change | Same as from March 25 to April 5, 2020 | 35 |
| Industries | Unrestricted | Completely closed | Completely closed | , |
| Power plant | Unrestricted | 44% reduction in power demand due to the complete closure of almost all industries | Same as from March 25 to April 5, 2020 | 9 |
| Local coal combustion | Normal | 95% reduction in coal combustion sources | Same as from March 25 to April 5, 2020 | 35 |
| Biomass burning | Unrestricted | Reduced by appx. 25% w.r.t. before lockdown | Same as from March 25 to April 5, 2020 | 35 |
| Stubble burning | Nile | Nile | Slight | 34 |
As a general trend, it has been observed that during P1 of the lockdown, all the cities under consideration experienced a significant reduction in PM2.5 concentrations below the National Ambient Air Quality Standards (NAAQS; 60 μg m−3 for 24 h) (ESI Table 1†). A decrease of 23.4, 38.7, 32.5, 25.3, 43.4 and 5.1% was observed for PM2.5 concentrations during this phase at Agra, Ghaziabad, Lucknow, Meerut, Noida and Varanasi, respectively (ESI Table 1†). An eloquent improvement in the concentrations of PM can be attributed to a conspicuous reduction in vehicular traffic, a halt in construction activities and industrial shutdown.5
Moreover, a substantial decrease in the concentrations of PM2.5 was observed in Noida and Ghaziabad among the explored cities (ESI Table 1†).8 This is most likely a result of the CAAQM stations being positioned in the industrial region of these cities (Noida and Ghaziabad), as shown in Table 1. Additionally, these cities have been impacted by the sudden halt on the workplace mobility activity during P1 of the lockdown as shown in ESI Fig. 1.†
Fig. 2, portrays 24 h mean PM2.5 values at the selected sites between March 1 and April 14, 2020. A variation of 10–150 μg m−3 was noted for 24 h mean PM2.5 concentrations, with peak values of 70–150 μg m−3. A reduction in the concentration of PM2.5 was observed during March 5–6, March 14 and then later on March 27–28, 2020, which was associated with rain events (1.0–9.0, 0.1–14.3 and 0.2–7.0 mm of rainfall, respectively). The rain washout effect reduced PM2.5 concentrations to 35 μg m−3 (and ∼50 μg m−3) on March 5–6 (and March 14, 2020) before lockdown. However, a similar drop in PM2.5 levels was observed during the first week of the lockdown due to strict control measures. After the first week of lockdown (March 25 to March 31, 2020), an increase in PM2.5 was recorded for 3–4 days in the second and third weeks of P1. This is likely due to regulations (relaxations) that allowed residents to move for essential services.5,36 Additionally, power plants and essential industries, located outside COVID-19 infected regions (Red and Orange Zones), were permitted to operate in a controlled manner.8 A decrease of 15–60% in PM2.5 concentration was observed during the first week of the lockdown (ESI Fig. 2†). Overall, the PM concentration was lowest during the first week of lockdown with a substantial drop in air quality indices. However, PM2.5 levels were still higher than the average 24 h concentration of PM2.5 (25 μg m−3) as recommended by the WHO37 which has been revised downwards to 15 μg m−3.38 Additionally, 38% of days had AQI, within the moderate category during P1 of lockdown, whereas before lockdown, 88% of days had an unhealthy AQI. However, from April 4, 2020 onwards, the air quality was in the unhealthy category probably due to conditional relaxations in lockdown (Table 2).
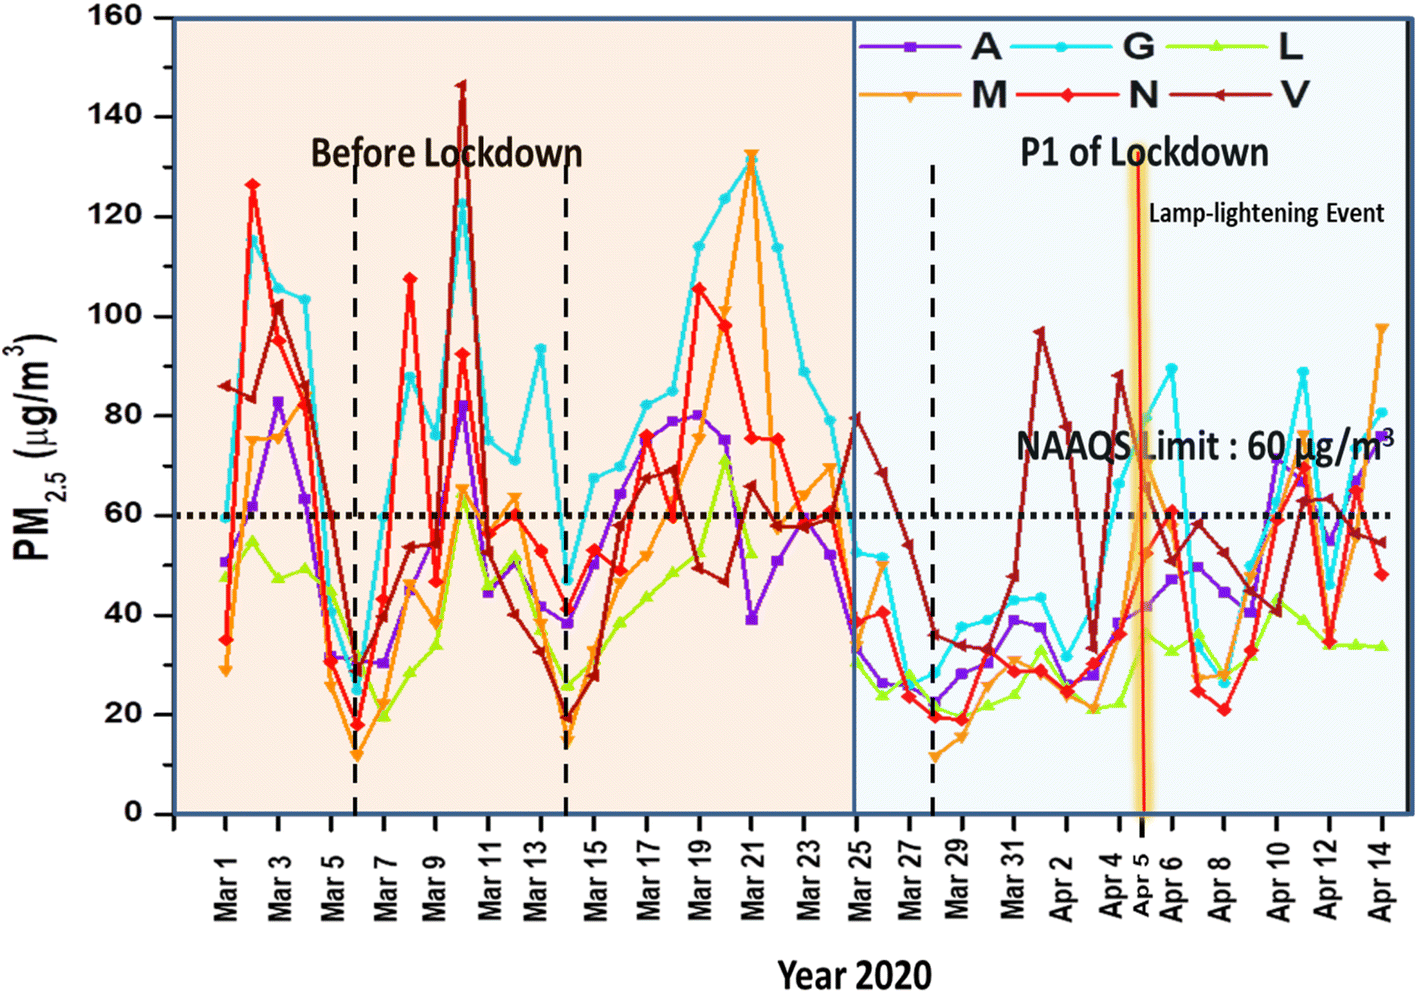 | ||
| Fig. 2 Daily average PM2.5 concentration from March 1 to April 14, 2020 (covering P1 of the lockdown period i.e., March 25 to April 14, 2020) over six cities Sanjay Place, Agra (A); Loni, Ghaziabad (G); Gomti Nagar, Lucknow (L); Ganga Nagar, Meerut (M); Sector-1, Noida (N) and Ardhali Bazar, Varanasi (V). In addition, the lamp event day is shown with a vertical yellow glow line, which corresponds to the increase in PM2.5 and rainfall occurrence days are shown with vertical dashed lines, which correspond to a dip in PM2.5. | ||
A reduction in the concentrations of VOCs namely benzene and toluene was also observed. These VOCs largely emanate from the burning of coal, vehicular exhaust, evaporation from fuel tanks and industries.39 The average concentrations of benzene before lockdown were 3.1, 0.5, 0.5, 0.4 and 4.2 μg m−3, which reduced to 2.4, 0.2, 0.4, 0.2 and 3.4 μg m−3 at Agra, Ghaziabad, Meerut, Noida and Varanasi, respectively during P1 of the lockdown. It was noticed that the average concentration of benzene increased from 2.0 to 2.6 μg m−3 at Lucknow during P1 of lockdown as compared to the concentration before the lockdown period. The concentration of toluene ranged from 1.3 to 11.7 μg m−3 before the lockdown period, and it decreased to 0.6–6.8 μg m−3 during P1 of lockdown accounting for a decrease of 42–83% at the different stations (ESI Table 1†). Among benzene and toluene, the concentration of benzene was always within the standards prescribed by NAAQS as shown in ESI Fig. 3(a and b).†
Even, trace gases, NO2, SO2 and CO, which are released from factories, burning of biomass and road transportation, decreased by a factor of 2–3, as shown in ESI Fig. 3(c–f).† NO2 levels were 20–55 μg m−3 and 4–46 μg m−3 before and during P1 of the lockdown period respectively in the IGP denoting a considerable decline. The maximum drop of NO2 was observed at Noida (70%) and the minimum at Agra (9%) with an exceptional increase at Varanasi (62%) (ESI Table 1†). However, the SO2 level was found to be increased at Agra (0.5%), Ghaziabad (12.3%), Noida (2.7%) and Varanasi (18.8%), while, the maximum drop in SO2 concentration was noticed at Lucknow (i.e., 15%) (ESI Table 1†). CO levels declined from 1–3 mg m−3 to 0.3–1.5 mg m−3 over the selected CAAQM stations (ESI Fig. 3(e)†). The maximum drop of the CO level was in Noida (30%) and minimum in Meerut (7%) with an exceptional increase in Ghaziabad (3.1%) (ESI Table 1†). Conversely, photochemically produced O3 increased from 5–55 μg m−3 (before lockdown) to 12–61 μg m−3 (during P1 of lockdown) (ESI Fig. 3(f)).† This contrasting trend of O3 was attributed to increased solar radiation and a decline in NO2, which encourages photochemical reactions producing ozone.40
A comparison of the mean concentration of criteria pollutants, during March 25 to April 14 in 2015–2019 and 2020 (P1 of the lockdown period) is shown in Table 3. The period 2015–2019 was selected to minimize the influence of meteorological parameters. There was almost 48% reduction in the concentration of PM2.5 at Agra, while in Varanasi we observed a decline of 50%. As the vehicular and industrial activities have a direct effect on NO2 levels, a notable reduction in the NO2 level was observed during P1 of the lockdown. NO2 levels increased in Agra by 63%, while 36% decrease was noticed in Varanasi. A similar increase in NO2 levels was also observed at Jorapokhar, Ludhiana, Noida, Thiruvananthapuram and Patna.41 The highest increase of 240% was observed in the concentration of SO2 in Agra and for Varanasi it was 113%, the probable reason of this increasing trend might be that no restrictions were imposed on thermal power plants, although power consumption was reduced.9,41 Similar to SO2, benzene levels increased by 26% in Agra and 277% in Varanasi. The concentration of ozone and toluene decreased by 37 and 27% respectively in Agra, while, a 2% and 126% increase was observed in the concentration of ozone and toluene respectively in Varanasi. O3 levels in most of the cities of northern India were found to increase (13.1–60.5 μg m−3 range) during P1 of the lockdown period in comparison to before lockdown whereas, it showed the reverse trend at Agra with respect to the mean concentration in 2015–2019. This may be attributed to the increase in NOx levels (as a precursor of ozone formation). In Agra, levels of CO decreased by 20% (for Varanasi data were not available for the year of 2020).41
| Parameters | Agra | Varanasi | ||||
|---|---|---|---|---|---|---|
| 2015–2019 | 2020 | % Change | 2015–2019 | 2020 | % Change | |
| a Data were not available. | ||||||
| PM2.5 (μg m−3) | 81.5 ± 27.2 | 42.6 | −48 | 114.2 ± 58.6 | 57.1 | −50 |
| NO2 (μg m−3) | 27.9 ± 13.1 | 45.4 | 63 | 51.3 ± 33.6 | 32.6 | −36 |
| SO2 (μg m−3) | 7.8 ± 4.6 | 26.7 | 240 | 15.4 ± 14.5 | 32.8 | 113 |
| CO (mg m−3) | 1.2 ± 1.9 | 1 | −20 | 1.4 ± 3.7 | —a | —a |
| Ozone (μg m−3) | 20.9 ± 13.4 | 13.1 | −37 | 37.7 ± 37.2 | 38.6 | 2 |
| Benzene (μg m−3) | 1.9 ± 2.8 | 2.4 | 26 | 0.9 ± 1.0 | 3.4 | 277 |
| Toluene (μg m−3) | 3.6 ± 4.5 | 2.7 | −27 | 3.0 ± 5.1 | 6.8 | 126 |
3.2. Meteorology and its impact on air quality
Meteorological conditions for the dispersal of pollutants on the Indian subcontinent are relatively uniform in March and April.8 Despite this, meteorology also partially yet significantly affected the pollution level during the COVID-19 lockdown over the IGP.42 It is well known that the dispersion of air pollutants is more conducive by high wind speeds and low relative humidity than by calm or stagnant conditions.43 The time series analysis of meteorological parameters (AT, WS, RH, SR, and RF) for Agra is shown in ESI Fig. 4.† During the summer, high AT increases atmospheric instability, which eventually increases the mixing height of pollutants.5 Furthermore, an increase in solar radiation also enhances photochemical reactions. Trend analysis revealed no considerable change in temperature during P1 of lockdown (28.3 ± 0.2 °C) at Agra, in comparison to the period before lockdown (28.5 ± 0.4 °C). The average wind speed slightly increased from 2.0 ± 0.8 m s−1 (before lockdown) to 2.5 ± 0.8 m s−1 (during P1 of lockdown). Additionally, particulate matter as well as other pollutants accumulate at different rates depending on the relative humidity. Relative humidity generally declined during the study period, with a few exceptions, increasing on days with rainfall events (ESI Fig. 4†). During P1 of lockdown, relative humidity decreased from 61.4 ± 11.5% to 45.1 ± 11.4%. Except for a few peaks before lockdown, the relative humidity throughout the study period remained favourable for accumulation of PM2.5. Furthermore, this could also explain the lower variations in PM2.5 concentrations over the study period. Lou et al. (2017) found that PM2.5 accumulation rates are stimulated by very low (<45%) to low (60–70%) relative humidity in ambient air, while PM10, SO2, and NO2 accumulation rates peak at 40 ± 5% relative humidity.44 Similarly, Munir et al. also reported a relationship between relative humidity and particulate matter.45 SR values ranged between 17.6 and 194.3 W m−2 with an average of 159.2 ± 39.4 W m−2 before lockdown and between 84.8 and 227.7 W m−2 with an average of 201.1 ± 31.5 W m−2 during P1 of lockdown. Rain occurred on March 5–6 (0.9 mm), March 14 (0.02 mm), March 24 (0.25 mm) and then later on March 27–28, 2020 (0.21 mm), which showed its scavenging effect on pollutants from the atmosphere. Hence, besides the lockdown, meteorological factors also partially contributed to the reduction of air pollutants at these sites.5,8,43,463.3. Temporal variation of PM2.5 and other air pollutants during the lamp event
The lamp event, known as the #9 pm 9 min event, was unique as it involved an additional loading of pollutants within a short course of time during P1 of lockdown, the period when most of the anthropogenic activities were halted, except for “essential services”. As anticipated, the event received an unprecedented response from all corners of the country and as expected a considerable increase in ambient pollutants was observed in almost every state. The massive use of oil-lamps, wax candles and gas lamps along with the bursting of fire-crackers demonstrated a significant variation in the concentration of air pollutants ranging from several hours to days (Fig. 3). An immediate increase in the concentration of PM2.5 and other pollutants was noticed during this event whereas a decrease in the concentration of O3 was found on the next morning of the event as shown in Fig. 3.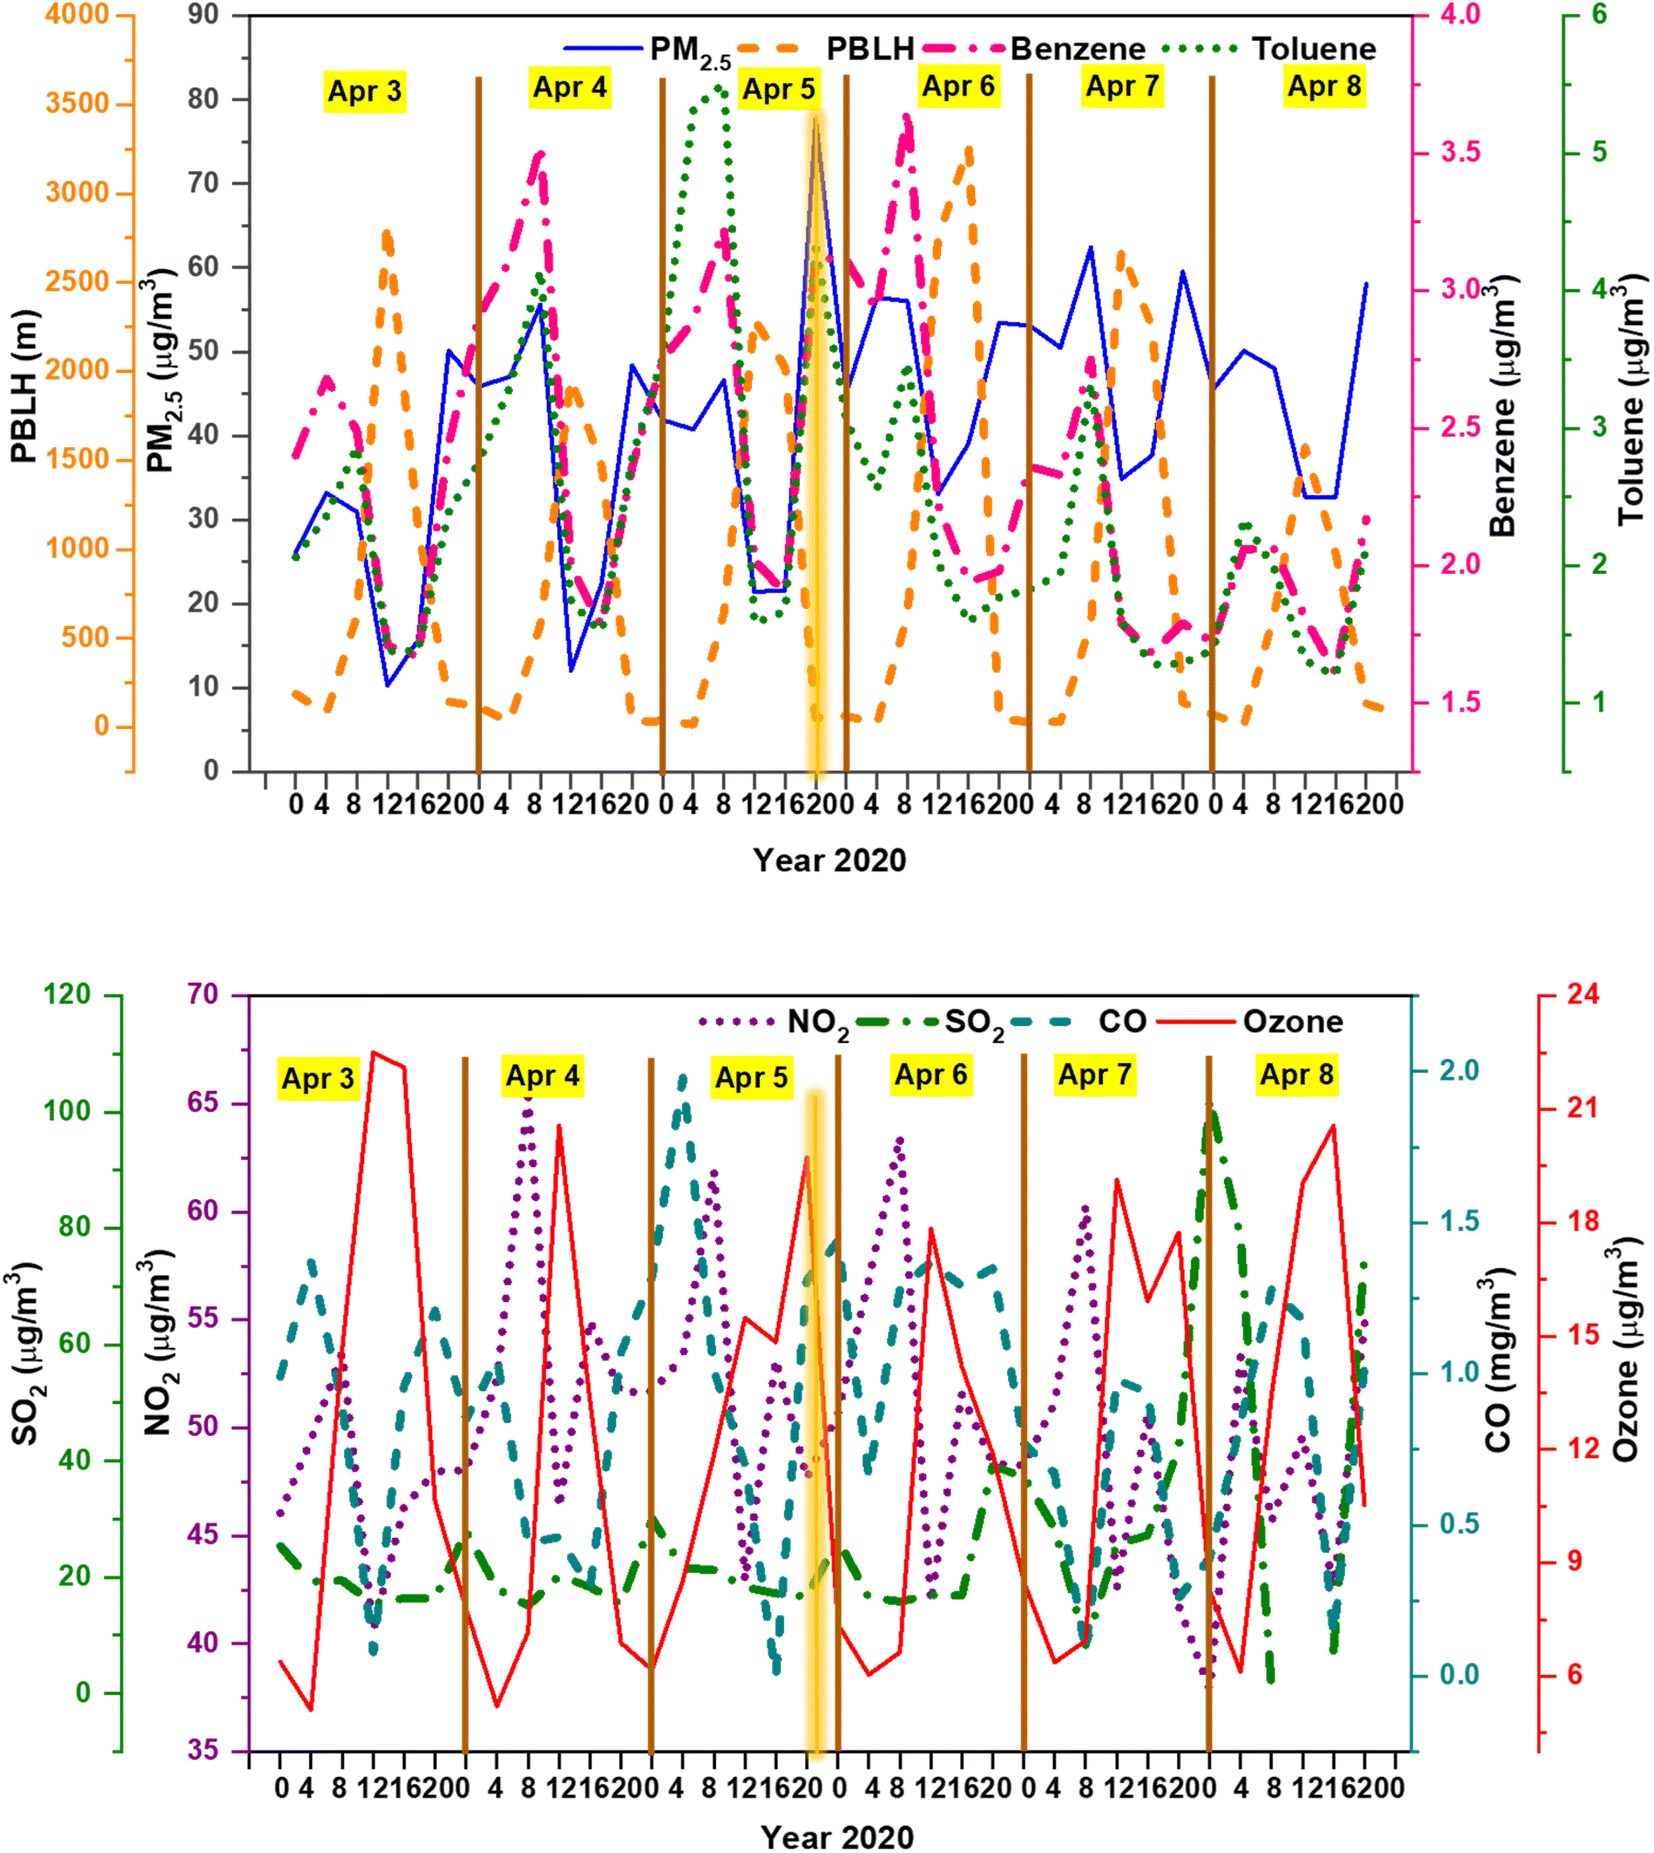 | ||
| Fig. 3 Vertical yellow glow line represents the day on which the lamp event occurred. Upper panel: hourly concentrations of PM2.5, benzene and toluene along with diurnal variation of PBLH at Agra. Lower panel: illustrates the diurnal variation of NO2, SO2, CO and O3 during the second week of P1 of lockdown (April 3–8, 2020). | ||
As mentioned earlier, the first week of lockdown resulted in a considerable reduction in the concentration of particulate matter at all CAAQM stations that peaked at approximately ∼50 μg m−3 (ESI Fig. 2†). However, twin peak (bimodal) behaviour seems to be a natural tendency of PM2.5 in the IGP with the tendency of rising in the morning and evening hours; however, from 8:00 h to 20:00 h it remains less than 45 μg m−3. It is vital to note that pollution levels vary considerably depending on whether the measurements are taken in urban or suburban areas of the IGP.8 Hence, to study the temporal variation of pollutants during the lamp event, Sanjay Place, Agra was selected as the urban site as all the parameters were available for this period for this site.
The temporal variations of PM2.5 (hourly mean), benzene, toluene with PBLH and NO2, SO2, CO and ozone are shown in Fig. 3 (upper panel) and Fig. 3 (lower panel), respectively, during April 3 to 8, 2020. The twin peak feature of PM2.5 was observed with large variability in PM2.5 concentrations. Moreover, PM2.5 varied from 10.3–62.4 μg m−3 and reached a maximum concentration (95 μg m−3) on April 5, 2020, between 20:00 h and 24:00 h due to the lamp event, and reduced to ∼50 μg m−3 from the next day onwards. The variation of PM2.5 concentrations and the notable increase of the PM2.5 levels during the evening hours may be attributed to emissions during the lamp event.
It is also evident from Fig. 3 that the concentrations of benzene and toluene also followed a similar diurnal pattern to PM2.5: higher concentrations during the night and lower during the day. This diurnal behaviour could be due to their greater dispersion during the day and accumulation during the night.5 However, it is interesting to note that on the morning of April 6, 2020, the maximum concentration of benzene (3.7 μg m−3) was observed probably due to its emissions remaining in the atmosphere. Benzene has a comparatively long atmospheric lifetime with a half-life varying from 3 to 10 days in the lower atmosphere and half-life of 7–22 days in the troposhere.47 Toluene levels spiked (5.5 μg m−3) on the morning of April 5, 2020, between 8:00 h and 12:00 h, before the event and then decreased followed by a substantial increase during the event at 20:00 h (4.3 μg m−3). The concentrations of benzene and toluene both significantly decreased during P1 of lockdown, emphasising the possible impact of COVID-19 lockdown on these pollutants, except during the lamp event.5
In addition to PM2.5 and VOCs, the variations of trace gases were also studied during the lamp event. The temporal variation of NO2 was similar to that of PM2.5 and VOCs. The peak value of NO2 was recorded at 9:00 h on April 4, 2020, and April 6, 2020, in the morning, however, the evening peak was highest on April 4, 2020 (54.9 μg m−3) followed by April 5, 2020 (53.2 μg m−3) between 20:00 h and 24:00 h. The temporal trend of CO levels showed a considerable change on April 5–6, 2020 with the highest concentration of 2.0 μg m−3 at 4:00 h in the morning of April 5, 2020, and the night peak disappeared by the next morning (April 6, 2020) at 4:00 h (1.4 μg m−3). There was no significant difference between the highest and lowest concentrations of the temporal trend of SO2 during the study period. The least variation of SO2 levels was recorded during this period.5 O3 levels are primarily caused by increased precursors in the presence of solar radiation, which creates a favourable atmosphere for photochemical reactions and leads to enhanced O3 production. O3 showed a typical pattern with a peak at mid-day between 12:00 h and 16:00 h. A bimodal peak was observed for O3 on April 5, 2020, with one peak around 12:00 h (17.5 μg m−3) in the noon and another between 21:00 and 22:00 h in the night (25.8 μg m−3). The day peak obviously is due to the photochemical production of ozone while the night peak may be attributed to the role of non-linear chemistry that increases the concentration of O3 in a VOC-limited environment when nitrogen oxides are reduced.5,6
3.4. Diurnal variation of PM2.5 and benzene along with PBLH during the lamp event
To study the specific characteristics of the lamp event, diurnal scale data were further analysed. On April 5, 2020, a significant decrease in the concentration of PM2.5 was observed from morning to evening hours, i.e., 6:00 h to 18:00 h whereas it became negligible in the afternoon due to the increase in PBLH which favours the maximum diffusion of pollutants in the atmosphere. However, the trend of benzene was similar to PBLH which is common in urban regions.48 After the event, around 21:30 h, within 20 min, it was observed that the PM2.5 levels rose suddenly from 66 μg m−3 to 95–100 μg m−3 (Fig. 4), whereas the concentration of PM2.5 at night generally ranged between 40 and 55 μg m−3 during P1 of the lockdown (Fig. 3 (upper panel)). Additionally, the concentration of benzene showed a similar diurnal pattern to PM2.5 with concentration 2.3 ± 0.6 μg m−3 during the day and 2.5 ± 0.4 μg m−3 during the night in the course of P1 of the lockdown, while, on April 5, 2020 following the lamp event, the night levels of benzene rose to 3.9 μg m−3, indicating an additional source of pollutants in the same environment. In addition to Agra, Ghaziabad, Lucknow, Meerut, Noida, and Varanasi were also affected by this event and the impact of the event was observed at 21:00 h or later at that night (ESI Fig. 5†).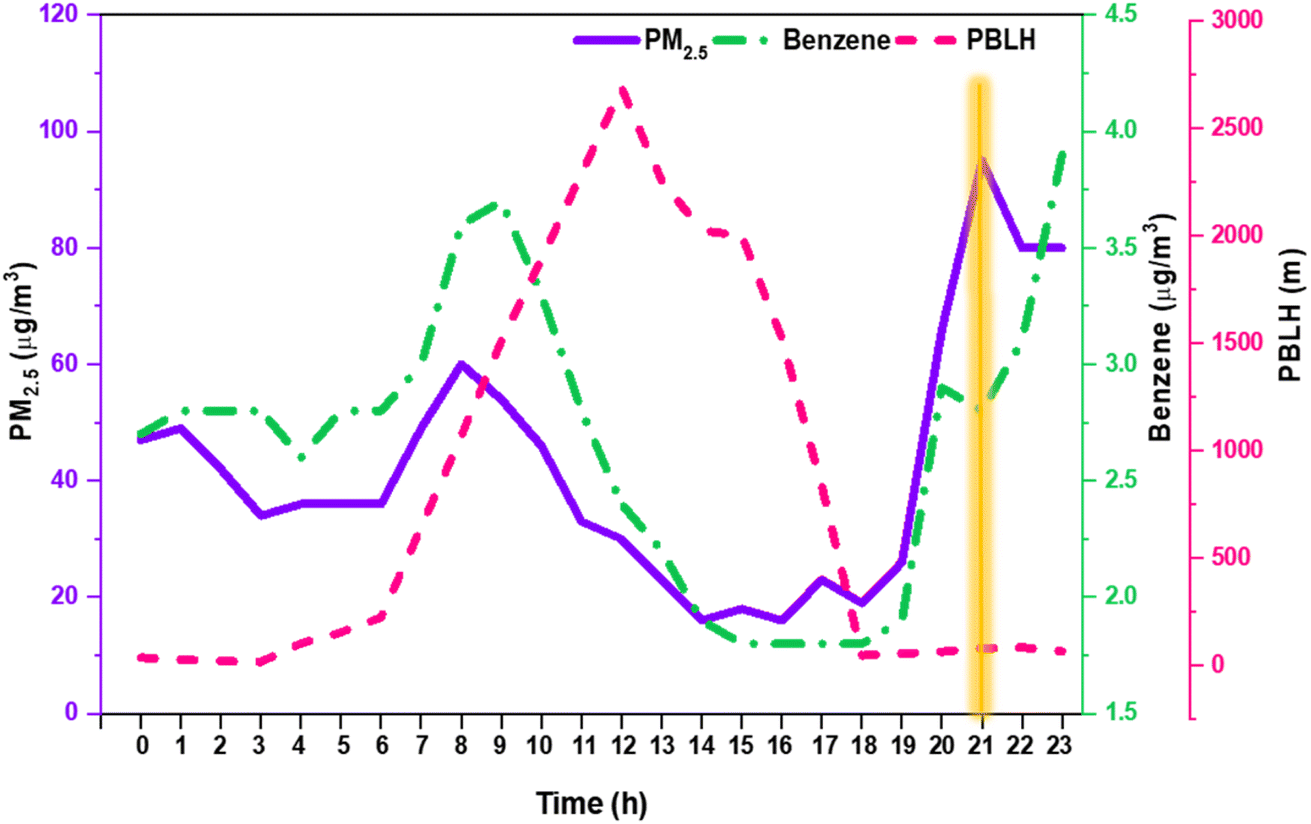 | ||
| Fig. 4 High resolution monitoring data (averaged over 15 min interval) of PM2.5 and benzene with PBLH on April 5, 2020. The yellow glow line highlights the lamp event at 21:00 h. | ||
In order to better understand the factors influencing PM concentrations, Pearson's correlation was determined between the 15 minutes data points of PM and the meteorological factors viz, RH, WS, SR and AT (ESI Table 2†). The correlation coefficient between RH and PM2.5 concentrations was 0.7, suggesting that RH (23% during the day, 50% during the night) exacerbates the accumulation and chemical reaction of pollutants. Relative humidity can affect PM concentrations by manipulating the particle mass and particle diameter through atmospheric physical and chemical processes. Similarly, SR and AT were negatively correlated with the PM2.5 concentration, indicating that small increases in solar intensity and temperature lead to lower PM2.5 concentrations. A weak negative correlation was found between the PM concentration and wind speed, indicating dispersion and dilution of particulate matter with high wind speeds blowing from a particular direction. On April 5, 2020, high PM concentrations were observed from south westerly winds.
It is also observed from the correlation matrix (ESI Table 2†) that PM2.5 has a strong significant (p < 0.05) correlation with benzene (0.8), CO (0.7) and RH (0.7), positive, but weak (r < 0.5) association with NO2 and toluene, and negative but non-significant (p > 0.05) relation with SO2 and ozone. This indicates the emission of PM2.5, CO and benzene in the atmosphere from similar sources, namely, fossil fuel combustion from vehicles, industries, and oil-based emissions. Additionally, NO2–CO (0.8), NO2–benzene (0.5), NO2–toluene (0.5), CO–benzene (0.7), CO–toluene (0.5) and toluene–benzene (0.5) also had a good correlation suggesting their similar origin. In addition, RH was also positively associated with NO2 (0.6), CO (0.5) and benzene (0.5), which leads to high emissions at night when relative humidity is high.
3.5. Principal component analysis
PCA output statistics on the number of components with their eigenvalues and percentage variance explained by each component, as well as total variance explained by all components at Agra are described in Table 4. Only two principal components (PC), PC1 and PC2, were extracted across all monitoring sites because most pollution sources were halted during lockdown.49 PC1 and PC2 explained about 90% variance of the data cumulatively; the remaining could be attributed to additional contaminants not included in this study. PC1 explained 46 to 65% of the variance of the dataset, whereas PC2 explained 16 to 28%. High loadings of PM2.5 and benzene were observed at all monitoring sites in PC1, along with the site-specific loadings of NO2, CO and toluene, which represent emissions from fossil fuel combustion of vehicles, industries, and oil-based emissions.48 Moreover, the higher loadings of PM2.5 and benzene reflect a larger contribution from the emissions of oil-lamps or candles in the vicinity of the monitoring sites rather than vehicles or industries whereas site-specific loadings of NO2, CO and toluene could be associated with limited vehicular activity (mostly for grocery and pharmacy) or diffused coal burning that was not uniform during lockdown (ESI Fig. 1†). This is further supported by the strong correlations observed between PM2.5 and benzene (0.8), PM2.5 and CO (0.7), toluene and benzene (0.5), and toluene and CO (0.5).| Variables | PC 1 | PC 2 |
|---|---|---|
| a Loading values ≥0.5 are represented in bold. | ||
| PM2.5 | 0.8 | −0.1 |
| NO2 | 0.8 | 0.2 |
| SO2 | −0.0 | 0.8 |
| CO | 0.9 | 0.1 |
| Ozone | 0.0 | 0.7 |
| Benzene | 0.9 | −0.0 |
| Toluene | 0.7 | −0.1 |
| Eigen values | 3.3 | 1.2 |
| % Variance | 47.5 | 16.5 |
| Cumulative % variance | 47.5 | 64.0 |
In PC2, the higher loadings of SO2 (0.8) and O3 (0.7) suggest atmospheric photochemical reactions leading to the formation of secondary aerosol at Agra (Table 4). On the other hand, it was not possible to analyse the association of O3 with PC2 or SO2 at particular sites in the present dataset (ESI Fig. 6†).
4. Conclusion
The COVID-19 pandemic rejuvenated the environment due to a significant reduction in anthropogenic activities by prompting many countries to impose partial or complete lockdown in terms of prohibiting outdoor activities, less mobility and commercial shutdowns. All these activities caused the general population to suffer, but in contrast, they contributed by improving the air quality to a greater extent and healed the environment by limiting the emission of pollutants into the atmosphere. Initially, the levels of atmospheric pollutants like PM2.5, SO2, NOx, CO, benzene and toluene decreased in the ambient air of a number of cities in India, during lockdown. The total decrease of 23.4, 38.7, 32.5, 25.3, 43.4 and 5.1% was observed for PM2.5 concentrations at Agra, Ghaziabad, Lucknow, Meerut, Noida and Varanasi during P1 of lockdown as compared to the period before lockdown respectively. However, an increase in the concentration of ozone was observed during the lockdown period that can be ascribed to enhanced photochemical production and a decrease in the photolysis of tropospheric ozone. During P1 of lockdown, atmospheric levels of pollutants decreased to safer levels which indicates that reduction in emission and controlling the sources of pollutants can immediately affect air quality levels.A major change in the concentration of these pollutants during the lamp event was studied and evaluated in the IGP. A remarkable increase in concentration was observed for PM2.5 followed by benzene, toluene, NOx, and CO, whereas the concentration of ozone decreased during this event in ambient air. As a result of the lamp event, PM2.5 levels suddenly rose at 21:00 h or later that night, which lasted for several hours. Additionally, a strong correlation was found between the concentrations of PM2.5 and benzene, and PM2.5 and CO, suggesting a possible contribution from oil-based emissions during the lamp event, which was confirmed by PCA. Furthermore, PCA output statistics revealed that higher PM2.5 and benzene loadings reflect a significant contribution of emissions from oil-lamps or candles near monitoring sites rather than vehicular and industrial emissions. From this study, it can be concluded that emissions from small lamps, candles, oil-lamps, etc. on a large scale can play an important role in transforming ambient pollution levels. This study advised that the changes in air quality that were observed during this type of event, which were primarily brought on by large-scale emissions in an open environment in India with baseline emissions, be taken into account in future regulatory attempts.
The above changes have even served to emphasize the need for comprehensive action across all emissions sectors in order to achieve significant air quality improvements. People are also advised to adhere strictly to the rules of such activities.
Disclaimer
This paper is the work of the authors and the opinions herein are those of the authors alone and do not necessarily reflect the view or opinions of their institutions.Data availability
The authors declare that all data supporting the findings of this study are available within the article and its ESI files.†Author contributions
Isha Goyal – data compilation, analysis and manuscript writing. Puneet Kumar Verma – data compilation. Vipin Singh – review, editing and final approval of manuscript. K. Maharaj Kumari – review, editing and final approval of manuscript. Anita Lakhani – planning of manuscript with Isha Goyal, final approval, funding acquisition.Conflicts of interest
The authors confirm that there’s no financial/personal interest or belief that could affect the objectivity. All authors have read the paper and approved it.Acknowledgements
This work was supported by the Department of Science and Technology (EMR/2017/002648) and Department of Science and Technology – Fund for Improvement of S&T Infrastructure (SR/FST/CS-II/2017/38) for the research, authorship and publication of this article. The authors are grateful to the Director, Dayalbagh Educational Institute and Head, Department of Chemistry for providing necessary support and research facilities to conduct this work. The authors also thank the Central Pollution Control Board (CPCB), India for maintaining online data servers during this lockdown period.References
- G. He, Y. Pan and T. Tanaka, Nat. Sustain., 2020, 3, 1005–1011 CrossRef.
- Y. Wang, Y. Wen, Y. Wang, S. Zhang, K. M. Zhang, H. Zheng, J. Xing, Y. Wu and J. Hao, Environ. Sci. Technol. Lett., 2020, 7, 802–808 CrossRef CAS.
- IQAir, World Air Quality Report, 2020 Search PubMed.
- C. Navinya, G. Patidar and H. C. Phuleria, Aerosol Air Qual. Res., 2020, 20, 1759–1771 CrossRef CAS.
- S. Mor, S. Kumar, T. Singh, S. Dogra, V. Pandey and K. Ravindra, Chemosphere, 2021, 263, 127978 CrossRef CAS.
- S. K. Dhaka, V. Kumar, V. Panwar, A. P. Dimri, N. Singh, P. K. Patra, Y. Matsumi, M. Takigawa, T. Nakayama, K. Yamaji, M. Kajino, P. Misra and S. Hayashida, Sci. Rep., 2020, 10, 1–8 CrossRef.
- CPCB, in Impact of Lockdown (25th March to 15th April) on Air Quality “Impact of Janta Curfew & Lockdown”, 2020 Search PubMed.
- S. Mahato and K. G. Ghosh, Environ. Res., 2020, 188, 109835 CrossRef CAS PubMed.
- POSOCO, Report on Pan India Lights off Event (9 PM 9 Minutes) on 5th April 2020 Impact on Indian Power System, 2020 Search PubMed.
- T. Olszowski and A. Kłos, Bull. Environ. Contam. Toxicol., 2013, 91, 588–594 CrossRef CAS PubMed.
- C. Lau, H. Fiedler, O. Hutzinger, K. H. Schwind and J. Hosseinpour, Chemosphere, 1997, 34, 1623–1630 CrossRef CAS.
- R. K. Chakrabarty, I. J. Arnold, D. M. Francisco, B. Hatchett, F. Hosseinpour, M. Loria, A. Pokharel and B. M. Woody, J. Quant. Spectrosc. Radiat. Transfer, 2013, 122, 25–30 CrossRef CAS.
- S. Lokhandwala and P. Gautam, Environ. Res., 2020, 188, 109807 CrossRef CAS PubMed.
- A. S. Gautam, N. K. Dilwaliya, A. Srivastava, S. Kumar, K. Bauddh, D. Siingh, M. A. Shah, K. Singh and S. Gautam, Environ. Dev. Sustain., 2021, 23(6), 8774–8797 CrossRef PubMed.
- A. Saxena and S. Raj, Urban Clim., 2021, 35, 100754 CrossRef PubMed.
- S. Sharma, M. Zhang, J. Gao, H. Zhang and S. H. Kota, Sci. Total Environ., 2020, 728, 138878 CrossRef CAS.
- N. Singh and N. A. Sontakke, Clim. Change, 2002, 52, 287–313 CrossRef.
- A. F. Stein, R. R. Draxler, G. D. Rolph, B. J. B. Stunder, M. D. Cohen and F. Ngan, Bull. Am. Meteorol. Soc., 2015, 96, 2059–2077 CrossRef.
- R. Suman, M. Javaid, S. K. Choudhary, A. Haleem, R. P. Singh, D. Nandan, S. Ali and S. Rab, Sustain. Oper. Comput., 2021, 2, 1–11 CrossRef.
- D. Sah, P. K. Verma, M. K. Kandikonda and A. Lakhani, Urban Clim., 2019, 27, 149–162 CrossRef.
- C. Bi, Y. Chen, Z. Zhao, Q. Li, Q. Zhou, Z. Ye and X. Ge, Chemosphere, 2020, 238, 124620 CrossRef CAS PubMed.
- M. Ahmad, S. Cheng, Q. Yu, W. Qin, Y. Zhang and J. Chen, Atmos. Res., 2020, 234, 104715 CrossRef CAS.
- A. Mangal, A. Satsangi, A. Lakhani and K. M. Kumari, Environ. Geochem. Health, 2021, 43, 621–642 CrossRef CAS PubMed.
- P. Siudek, Environ. Sci.: Processes Impacts, 2020, 22, 2230–2243 CAS.
- R. Jan, R. Roy, S. Yadav and P. G. Satsangi, Environ. Geochem. Health, 2018, 40, 255–270 CrossRef CAS PubMed.
- A. Srivastava, S. Gupta and V. K. Jain, Aerosol Air Qual. Res., 2008, 8, 188–200 CrossRef CAS.
- Registrar General & Census Commissioner, Census of India: Population Enumeration Data, 2011 Search PubMed.
- U. P. P. C. B. Regional Office, in Action Plan for the Control of Air Pollution in Agra City, 2019 Search PubMed.
- U. P. P. C. B. Regional Office, in Action Plan for the Control of Air Pollution in Ghaziabad City, 2019 Search PubMed.
- U. P. P. C. B. Regional Office, in Action Plan for the Control of Air Pollution in Lucknow City, 2019 Search PubMed.
- U. P. P. C. B. Regional Office, in Meerut City Clean Air Action Plan, 2020 Search PubMed.
- U. P. P. C. B. Regional Office, in Action Plan for the Control of Air Pollution in Noida City, 2019 Search PubMed.
- U. P. P. C. B. Regional Office, in Action Plan for the Control of Air Pollution in Varanasi City, 2019 Search PubMed.
- J. Mohite, S. Sawant, A. Pandit and S. Pappula, Environ. Monit. Assess., 2022, 194, 1–19 CrossRef.
- C. Manchanda, M. Kumar, V. Singh, M. Faisal, N. Hazarika, A. Shukla, V. Lalchandani, V. Goel, N. Thamban, D. Ganguly and S. N. Tripathi, Environ. Int., 2021, 153, 106541 CrossRef CAS PubMed.
- A. K. Srivastava, P. D. Bhoyar, V. P. Kanawade, C. Panuganti, S. Devara, A. Thomas and V. K. Soni, Urban Clim., 2021, 36, 100791 CrossRef PubMed.
- World Health Organization, Air quality guidelines: Global update 2005: Particulate matter, ozone, nitrogen dioxide, and sulfur dioxide, World Health Organization, 2006 Search PubMed.
- WHO, WHO Global Air Quality Guidelines. Particulate Matter (PM2.5 and PM10), Ozone, Nitrogen Dioxide, Sulfur Dioxide and Carbon Monoxide, 2021 Search PubMed.
- M. Wang, S. Lu, M. Shao, L. Zeng, J. Zheng, F. Xie, H. Lin, K. Hu and X. Lu, Sci. Total Environ., 2021, 757, 143823 CrossRef CAS PubMed.
- I. Anil and O. Alagha, Air Qual., Atmos. Health, 2021, 14, 117–128 CrossRef CAS PubMed.
- S. Kumari, A. Lakhani and K. M. Kumari, Aerosol Air Qual. Res., 2020, 20, 2592–2603 CrossRef CAS.
- V. Singh, S. Singh, A. Biswal, A. P. Kesarkar, S. Mor and K. Ravindra, Environ. Pollut., 2020, 266, 115368 CrossRef CAS.
- S. Jain and T. Sharma, Aerosol Air Qual. Res., 2020, 20, 1222–1236 CrossRef CAS.
- C. Lou, H. Liu, Y. Li, Y. Peng, J. Wang and L. Dai, Environ. Monit. Assess., 2017, 189, 1–16 CrossRef CAS PubMed.
- S. Munir, T. M. Habeebullah, A. M. F. Mohammed, E. A. Morsy, M. Rehan and K. Ali, Aerosol Air Qual. Res., 2017, 17, 453–464 CrossRef CAS.
- X. Yang, W. Qian, D. Gong, C. Zhao, P. W. Chan, W. Zhou, Y. Huang, F. Zhang and Z. Li, Atmosphere, 2021, 12, 1–16 Search PubMed.
- A. L. Rich and H. T. Orimoloye, Environ. Health Insights, 2016, 10, 75–82 Search PubMed.
- U. S. Saharan, R. Kumar, P. Tripathy, M. Sateesh, J. Garg, S. K. Sharma and T. K. Mandal, Urban Clim, 2022, 41, 101059 CrossRef PubMed.
- S. Chaudhary, S. Kumar, R. Antil and S. Yadav, J. Heal. Pollut., 2021, 11, 1–11 CrossRef PubMed.
Footnote |
| † Electronic supplementary information (ESI) available. See DOI: https://doi.org/10.1039/d2va00114d |
| This journal is © The Royal Society of Chemistry 2023 |