 Open Access Article
Reversible vis-NIR electrochromic/electrofluorochromic switching in dual-functional devices modulated by different benzothiadiazole-arylamine anodic components†
Giuseppina Anna
Corrente
 *a,
Dora A.
González
 bc,
Ece
Aktas
 cd,
Agostina Lina
Capodilupo
 e,
Francesco
Ruighi
 e,
Gianluca
Accorsi
 e,
Daniela
Imbardelli
a,
Cristina
Rodriguez-Seco
bf,
Eugenia
Martinez-Ferrero
 b,
Emilio
Palomares
 bg and
Amerigo
Beneduci
 *a
*a
aDepartment of Chemistry and Chemical Technologies, University of Calabria, Via P. Bucci, Cubo 15D, 87036 Arcavacata di Rende, Italy. E-mail: giuseppina.corrente@unical.it; amerigo.beneduci@unical.it
bInstitut Català d’Investigació Química (ICIQ)-CERCA, The Barcelona Institute of Science and Technology (BIST), E-43007 Tarragona, Spain
cDepartament d’Enginyeria Electrònica, Elèctrica i Automàtica. Universitat Rovira i Virgili, Avda. Països Catalans, 26, Tarragona, E-43007, Spain
dDepartment of Chemical, Materials and Production Engineering, University of Naples Federico II, Piazzale Tecchio 80, 80125 Fuorigrotta, Italy
eInstitute of Nanotechnology (CNR-NANOTEC), c/o Campus Ecotekne, via Monteroni, 73100 Lecce, Italy
fÉnergie Matériaux et Télécommunications, Institut National de la Recherche Scientifque (INRS), Varennes, QC, Canada
gInstitució Catalana de Recerca i Estudis Avançats. (ICREA), 08010 Barcelona, Spain
First published on 16th November 2023
Abstract
Redox active materials, whose optical emission and absorption spectra are both electrically switchable, are said to be dual functional electrochromic and electrofluorochromic materials. They are intriguing for a wide range of applications, e.g., displays, smart-windows, sensing, information storage, and encryption/anticounterfeiting devices. Herein, we investigated the performance of benzothiadiazole-arylamine compounds serving as either anodic components or electroactive fluorophores, in dual functional electrochromic/electrofluorochromic solid state devices, fabricated as all-in-one ITO/gel/ITO sandwiches. We systematically investigated the electrochromic and electrofluorochromic responses of the devices, by varying the anode among a set of structurally different benzothiadiazole-arylamines and using the ethyl viologen as a cathodic component. All the devices show an interesting vis-NIR electrochromism with a pink/orange to deep dark color switching, arising from the superposition of the electrochromic bands of the viologen and arylamine, with contrasts up to 36%/75% in the NIR/vis ranges and switching times from fractions of a second up to several seconds. Moreover, they show a panchromatic fluorescence from about 450 nm up to 850 nm, due to the intramolecular charge transfer character of the emission typical of these arylamine–benzothiadiazole-arylamine compounds with donor–acceptor–donor architecture. Notably, the relatively strong fluorescence of the devices (fluorescence quantum yields up to 38%) due to the aggregation induced emission (AIE) of the fluorophores in the gel (fluorescence enhancement of up to 63 times with respect to the solution phase with comparable polarity) undergoes a voltage-dependent quenching, with electrofluorochromic contrast ratios of up to 9, and a shift of the emission from NIR/red to yellow. Such an electrofluorochromic response is due to an uneven fluorescence quenching across the whole emission band, the twisted charge transfer states being majorly quenched at lower energy (red-NIR range). Interestingly, the voltage threshold for achieving the above electrochromic and electrofluorochromic responses increases with the first oxidation potential of the anodic component. Mechanistic insights provided by electrochemical impedance spectroscopy clearly show that the above threshold corresponds to the onset for electron injection/ejection at the cathode and anode, respectively, and depends on the difference between the viologen reduction potential and the oxidation potential of the arylamine. Finally, the devices show high stabilities with more than 2000 life cycles.
1. Introduction
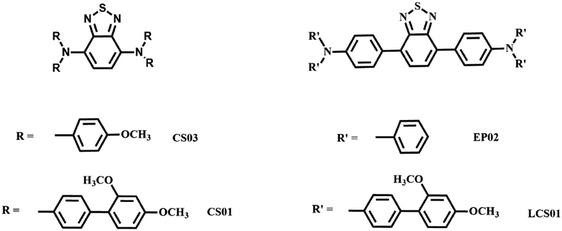
Among the different external stimuli that can be used to induce a functional response on a material, such as photo, thermal, mechanical, etc., electrical ones are of paramount importance since they can be rapidly and repeatedly applied.1 Moreover, they can be easily combined with other stimuli to induce multiple responses on multi-stimuli responsive materials. One of the most intriguing combinations is with light. In this context, redox active materials that change their optical properties in response to external electric triggers have attracted considerable research interest.2,3 Indeed, upon applying voltages, the absorption and fluorescence spectra of redox-active materials can undergo reversible changes, accompanied by variation of their color and emission. These phenomena are referred to as electrochromism (EC)4,5 and electrofluorochromism (EFC).6–8 In both types of materials, reversible spectral changes are induced by electrochemical redox reactions, generating reduced/oxidized species with different optical properties.4–7,9 Electrochromic materials are of high interest in many application fields, such as switchable windows and mirrors, controllable light-reflective or light-transmissive devices for optical information and storage, electromagnetic shutters, controllable aircraft canopies, military protective eyewear and glare reduction systems for automotive and transport.10–12 Electrofluorochromic technology is highly desirable in several electro-optic applications12–14 as well as in fluorescence imaging.6,15,16 Over the past decade, there has been growing interest in the development of dual-functional electrochromic and electrofluorochromic materials, from polymeric systems17–24 to metallo-organic25 and small organic molecules.26–33 These dual-mode materials pose a great challenge for potential application in advanced anti-counterfeiting/information encryption, storage, and display technologies. Sun and co-workers proposed polyamides with bis(diphenylamino)-fluorene units acting as electroactive fluorophores that showed excellent reversible stability of multicolor electrochromic characteristics (colorless-orange-blue) after over 1000 cyclic switches and strong fluorescence with a quantum yield of up to 50.2%, which could be reversibly modulated by electrochemical redox reactions leading to good cyclability and high contrast ratios.17 Nakamura et al. reported on a dual mode display where the emission of an Eu(III) complex was controlled by the ethyl viologen (HV2+) electrochromism via an intermolecular energy transfer mechanism. When HV2+ was in the colorless state, a strong red emission was observed from the complex. In contrast, the electrochemically colored state HV+ and HV effectively quenched the red emission of the Eu(III) complex.25 In addition, several intriguing examples of small organic molecules were reported, such as those based on fluoran derivatives,26,27 extended viologens incorporating different conjugated fluorophore bridges,29–31 arylamine-dibenzophenazine32 triphenylamine with fluorescent tetraphenyl ethylene, and ionic conductive imidazole groups33 and arylamine-fluorene redox-active fluorophores.34 As far as small organic molecules are concerned, it can be argued that the right choice and combination of redox-active units and fluorophores are the key to achieve smart materials exhibiting EC and EFC responses. These can ultimately lead to materials with multiple reversible redox-states, high transmittance/emission contrast ratio, modulation of response times, high coloration efficiency and fluorescence quantum yield. Recently, we studied the electrochromic and electrofluorochromic behavior in a solution of donor–acceptor–donor (DAD) benzothiadiazole-arylamine derivatives35 with the acceptor benzothiadiazole (BT) bridge, linking two arylamine donor units (Scheme 1). They can be grouped into benzothiadiazole-diphenylamines (BTDPA – molecules CS01 and CS03) and benzothiadiazole-triphenylamines (BTTPA – molecules EP02 and LCS01) (Scheme 1). This architecture has been conceived to take advantage of the strong electron-withdrawing character of the BT and its high fluorescence for obtaining redox active fluorophores with (i) vis-NIR electrochromism, (ii) fluorescence emission extending in the NIR region and (iii) tunable electrofluorochromic response of both intensity and wavelength. In fact, the benzothiadiazole group acts as a good electron coupling bridge between the arylamine centers in the radical cation mixed valence state, giving rise to intervalence charge transfer transitions in the NIR region. Moreover, it promotes efficient twisted intramolecular charge transfer states at lower energy, from the arylamine units to the BT core, contributing to the fluorescence emission in the red/NIR range. We have shown the dual EC/EFC functionality of these compounds with a red-NIR electrochromism and an intriguing red-NIR electroluminochromism characterized by fluorescence quenching and a voltage-dependent color tuning of the fluorescence emission from red to green regions.35Following the deep comprehension of these systems in solution, herein we investigate their possible application in solid state devices. Generally, the transition from the solution to the solid state is not trivial and several issues must be overcome. When dealing with fluorophores, one of the most important issues is the aggregation-caused quenching, such that the fluorophore can no longer be utilized.8 Here we developed all-in-one ITO/gel/ITO solid state devices with the above compounds incorporated as anodic components, into polymer gels together with the commercial ethyl viologen cation, serving as a cathodic component. Importantly, all the fluorophores show a huge aggregation-induced emission effect in the organogel, with a fluorescence enhancement of up to about 200 times relative to that measured in solution, leading to electroactive films with a fluorescence quantum yield of about 40%. The devices were studied by extensive electrochemical, spectroelectrochemical and impedance spectroscopy characterization to gain insights into their electrooptical response and working mechanism.
2. Experimental methods
2.1. Materials
N 4,N4,N7,N7-tetrakis(4-methoxyphenyl)benzo[c][1,2,5]thiadiazole-4,7-diamine: CS03; N4,N4,N7,N7-tetrakis(2′,4′-dimethoxy-[1,1′-biphenyl]-4- yl)benzo[c][1,2,5]thiazole-4,7-diamine: CS01, 4,4′-(benzo[1,2,5]thiadiazole-4,7-diyl)bis(N,N-diphenylaniline): EP02, and N,N′-(benzo[c][1,2,5]thiadiazole-4,7-diylbis(4,1-phenylene)) bis(N-(2′,4′-dimethoxy-[1,1′-biphenyl]-4-yl)-2′,4′-dimethoxy-[1,1′-biphenyl]-4-amine): LCS01 were synthesized freshly before use.36,37 Poly(vinyl formal) (PVF) and ethyl viologen (EV) were purchased from Sigma-Aldrich and were not further purified before use. N-Methyl-2-pyrrolidinone, NMP, (Panreac) and propylene carbonate (PC) were used as solvents.2.2. Device fabrication
The EC/EFC polymer gels were prepared by first dissolving the electroactive species (anode: BTDPAs or BTTPAs and cathode: ethyl viologen) in the solvent plasticizer, either NMP or PC, at room temperature and then by mixing the resultant solution with the polymer polyvinyl formal (PVF) under continuous stirring at 130 °C for 30 minutes. Different compositions of the polymeric gels were investigated in order to optimize the electrochromic and electrofluorochromic response. The concentration ranges used were 1–2% (w/w) of the anodic and cathodic components, 30–46% (w/w) of PVF and 58–66% (w/w) of the solvent plasticizer. ITO/EC-EFC gel/ITO devices were assembled by drop casting the hot EC mixture onto an ITO-coated glass support (Visiontek Systems Ltd with a sheet resistance of 25 Ω sq−1 and a thickness of 1 mm) with a second ITO electrode used to create a sandwich with an active area of 1 × 1.5 cm2. The cell gap was controlled by inserting cylindrical spacers with a mean base diameter of 120 × 10−4 cm for CV, spectroelectrochemical and fluorescence measurements and of 5 × 10⁻⁴ cm for impedance measurement. The results presented in this work refer to the optimized devices.2.3. Cyclic voltammetry and spectroelectrochemistry
Standard cyclic voltammetry of the polymer gel was performed using an Amel 7050 model potentiostat on the ITO/EC-EFC gel/ITO cell in which the two ITO plates served as working and counter electrodes. Spectroelectrochemical experiments were performed on the two-electrode device, with the Vertex 80 (Bruker) spectrophotometer. The potential was supplied by means of an Amel 2049 model potentiostat. Measurements were performed at 25 °C.31,38,392.4. Impedance spectroscopy
Electrochemical impedance spectra were recorded on the ITO/EC-EFC gel/ITO cell by a Metrohm Autolab Nova 2.1.5 frequency response analyzer (FRA32M module) coupled with the AUTOLAB PGSTAT204 potentiostat in the frequency range of 1 MHz–10 Hz at the following potential ranges, 0 V–1.9 V for CS03, 0 V–2.4 V for CS01, 0 V–2.4 V for LCS01 and 0 V–2.0 V, with voltage step intervals of 0.2 V and an amplitude of 0.01 VRMS. The analysis of the impedance data obtained from all the devices was performed using the software ZSimpWin, 3.5 version, by EChem Software Company.402.5. Photophysics
Emission spectra were obtained using a Varian Cary Eclipse spectrometer. Luminescence quantum yields (Φem) in solution obtained from spectra on a wavelength scale (nm) were measured according to the approach described by Demas and Crosby41 using air-equilibrated [Ru(bpy)3Cl2 in water solution with Φem = 0.028]42 as the standard. Emission lifetimes in the ps-μs range were determined using the single photon counting technique by means of the same Edinburgh FLS980 spectrometer using a laser diode as an excitation source (1 MHz, λexc = 407 nm) and an Hamamatsu MCP R3809U-50 (time resolution 20 ps) as a detector. To record the 77 K luminescence spectra, the samples were put in glass tubes (2 mm diameter) and inserted in a special quartz dewar, filled up with liquid nitrogen. For solid samples, the values of Φem have been calculated using corrected emission spectra obtained from an apparatus consisting of a barium sulphate-coated integrating sphere (4 or 6 inches), a He–Cd laser (λexc: 325 nm, 5 mW) or a 450 W Xe lamp (λexc = tunable by a monochromator supplied with the instrument) as light sources, and a R928 photomultiplier tube or a CCD AVA-Spec2048 as signal detectors, following the procedure described by De Mello et al.433. Results and discussion
3.1. Electrochemistry and spectroelectrochemistry of the devices
The electrochemical behavior of the anodic components used in the devices has already been studied in solution.35 They generally show two distinct one-electron oxidation processes in the potential range of 0.6–1.1 V vs. AgCl/Ag (Table S1, ESI†). The electrochemical splitting, ΔE(V), measured in CH2Cl2/TBAPF6 (0.1 M), i.e., the difference between the half-wave redox potentials of the above two processes, is higher for CS03 and CS01 than for EP02 and LCS01 (Table S1, ESI†). It is related to the Gibbs free energy of the comproportionation reaction, ΔGc (eqn (1)), occurring between the neutral and dication species to form the monocation one. The comproportionation constant, Kc, is a measure of the relative stability of the monocation mixed valence species with respect to the neutral and dication species.44–46ΔGc = −nFΔE = −RTln![[thin space (1/6-em)]](https://www.rsc.org/images/entities/char_2009.gif) Kc Kc | (1) |
The Kc values (Table S1, ESI†), calculated using eqn (1), are larger for the BTDPA compounds, clearly showing that the mixed valence state of the BTDPA compounds is more stable than that of the BTTPA ones.
On the other hand, the well-known one-electron reduction processes of the ethyl viologen dication occur in the potential window between −0.4 and −1.2 Volts vs. AgCl/Ag38 (Table S1, ESI†). Therefore, cathodic and anodic processes occur in almost symmetrical (with respect to the zero NHE), though opposite, restricted potential windows and, for this reason, the different arylamines can be, in principle, used as complementary anodic components with the viologen in two-electrode devices. The latter were fabricated with an architecture of the type ITO/(EC-EFC) gel/ITO sandwich cell,31,34 in which two ITO-coated glass plates served as working and counter electrodes.
Fig. 1 and 2 display cyclic voltammetry during the positive scan and the corresponding spectroelectrochemistry measurement for each device based on the BTDPA and BTTPA arylamines, respectively. Fig. S1 (ESI†) provides the complete CVs across the entire potential window from the corresponding negative to positive values, and several cycles to show the full electrochemical reversibility of the devices.
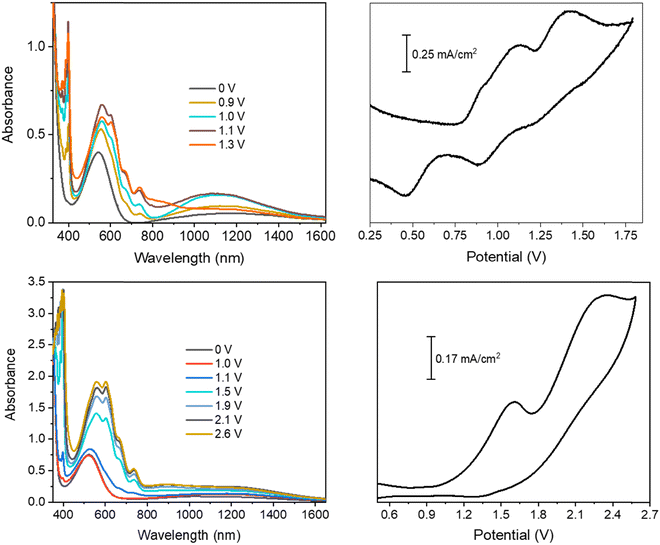 | ||
| Fig. 1 Spectroelectrochemistry and cyclic voltammetry measurements of the CS03/ethyl viologen (top) and CS01/ethyl viologen (bottom) devices. | ||
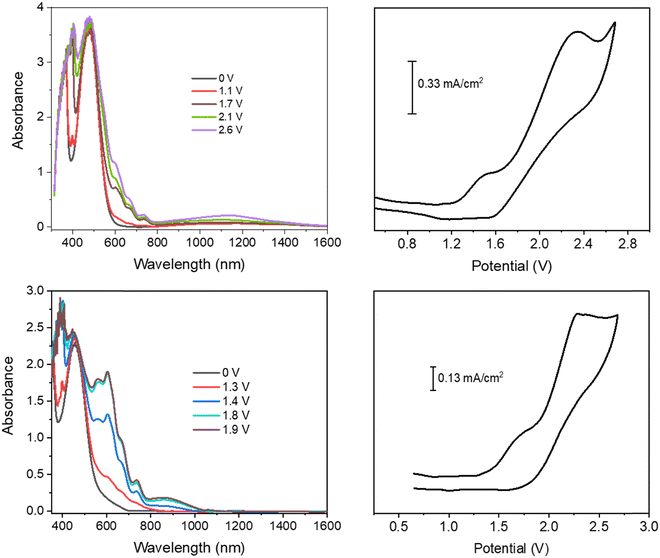 | ||
| Fig. 2 Spectroelectrochemistry and cyclic voltammetry of the LCS01/ethyl viologen (top) and EP02/ethyl viologen (bottom) devices. | ||
In order to better understand the electrochemical processes occurring in the devices, it is useful to discuss together the cyclic voltammetry measurement and the corresponding spectroelectrochemistry measurement. In the off state (0 V), the spectra of all the devices show only the intramolecular charge transfer band from the arylamine (D) to the BT core (A), located at λmax = 543 nm for CS03 and 522 nm for CS01, and at 456 nm and 479 nm for EP02 and LCS01, respectively. This band is mainly responsible for the initial coloration of the gels: pink for the BTDPA systems and orange for the BTTPA ones.
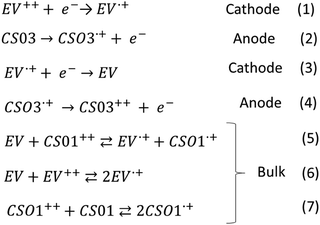
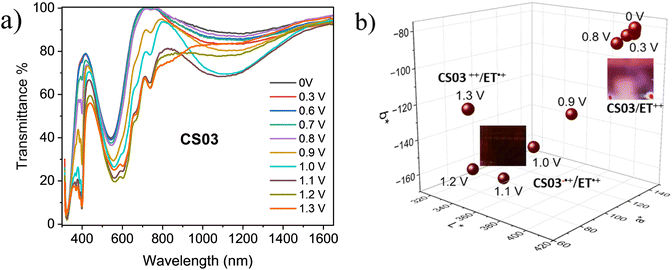
In the CS03 device, at least three redox processes can be clearly detected in the range of potential difference between 0.25 V and 1.8 V. The onset of the first oxidative half-wave is at about 0.8 V followed by two other processes with peak maxima at 1.1 V and 1.35 V, the latter being rather wide. In the absence of a reference, the assignment of the above processes cannot be directly performed using the CV measurement, though it is expected that the first processes should be attributed to the formation of the radical cation species of both the anode, at one ITO electrode, and the cathode at the opposite ITO electrode, according to the reactions (1) and (2) (Scheme 2). Fortunately, spectroelectrochemistry (Fig. 1a and Fig. S2, ESI†) clearly supports the assignment. Indeed, upon the application of a ΔV of 0.9 V, the spectroelectrochemical response shows the quasi-simultaneous appearance of the typical electrochromic band of the EV.+ species between 400 nm and 800 nm and that of the CS03.+ species in the NIR region.
These two bands grow up to about 1.1 V, therefore up to the conclusion of the second oxidation process observed in the CV. Above this potential, they are bleached and another band at about 850 nm appears, which can be attributed to the dication species of the arylamine. Thus, the last oxidation process in the CV corresponds to the formation of the neutral EV species and the CS03++ species (reactions (3) and (4)) (Scheme 2).
In the device with CS01, only two wide oxidation half-waves can be observed in the CV spectra up to 2.6 V. In this case, the band of the viologen monocation occurs early at 1.1 V in the spectroelectrochemistry measurement, at the beginning of the first redox process in the CV measurement, before the occurrence of the IVCT band of CS01+ at 1.5 V (Fig. 1 and Fig. S3, ESI†). Therefore, the first oxidation process in the CV measurement of this device is a superposition between the half-wave oxidation peak of CS01 and the half-wave oxidation peak related to the first reduction of EV++. The color of the device switched from light pink to blue-violet. As the potential difference between the two ITO electrodes is increased across the second oxidation process, the above absorption continuously grows up to a maximum intensity, and the color of the device switches to dark due to the increase of absorption in the visible region. Interestingly, we did not observe any bleaching either of the EV+ band or of that related to the arylamine, which can be accounted for by the possible reactions (5)–(7) occurring in the gel (Scheme 2). The other two devices based on the BTTPA arylamines share a behavior common to that of the CS01 device and all the related considerations above essentially hold for both (Fig. 2 and Fig. S4, S5, ESI†). It is worth noticing that the onset of the first redox process and the corresponding electrochromic response are progressively delayed on going from the CS03 to the EP02 devices, which reflects the corresponding increasing order of the first oxidation potential of the arylamines and the increasing difference with the first reduction potential of the ethyl viologen (Table S1, ESI†).
As already described, the application of a potential difference gives rise to profound changes in the absorption spectra either in the visible or in the NIR range (Fig. 1, 2 and Fig. S2–S5, ESI†), inducing significant color changes from light pink to black for the BTDPA devices and from orange to dark green/grey for the BTTPA devices (Fig. 3 and Fig. S3–S5, ESI†). These color switches are due to two main contributions: the electrochromic absorption typical of the viologen, covering the 350–450 nm and 530–750 nm regions, and the broad electrochromic absorption of the arylamines in the vis-NIR range, attributed to N-to-bridge (NBCT) and intervalence charge transfer (IVCT) transitions typical of arylamine MV compounds.34,35,44–46 The 1976 CIE LAB color space colorimetry analysis, performed on the transmittance spectra (Fig. 3a and Fig. S3–S5, ESI†), clearly shows that the devices exhibit a progressive decrease in the lightness and luminosity of the electrochromic film, both related to the CIE coordinate L*, as a function of the voltage applied, i.e. as the redox processes occur (Fig. 3b and Fig. S3–S5, ESI†). This means that the materials become progressively less transmissive as the fraction of radical cations generated from the ethyl viologen (EV) and the arylamine (CS03) increases in the film. Moreover, significant perturbations of the red-green and yellow-blue balances occur, evidenced by the changes in the CIE LAB coordinates a* and b*, respectively, which decreases with the voltage (Fig. 3b), in agreement with the color switching observed.
Interestingly, above a certain voltage threshold, a further color switching occurs due to the bleaching of the band associated with the radical cation of the arylamines CS03 (>1.1 V) and CS01 (>1.8 V), as a consequence of its further oxidation to the dication species (Fig. 1, Fig. 4a and Fig. S2, ESI†). This cannot be observed for the other devices since the bands of the radical cation and dication species are superimposed because they are generated almost simultaneously due to the close proximity of their oxidation potentials.35
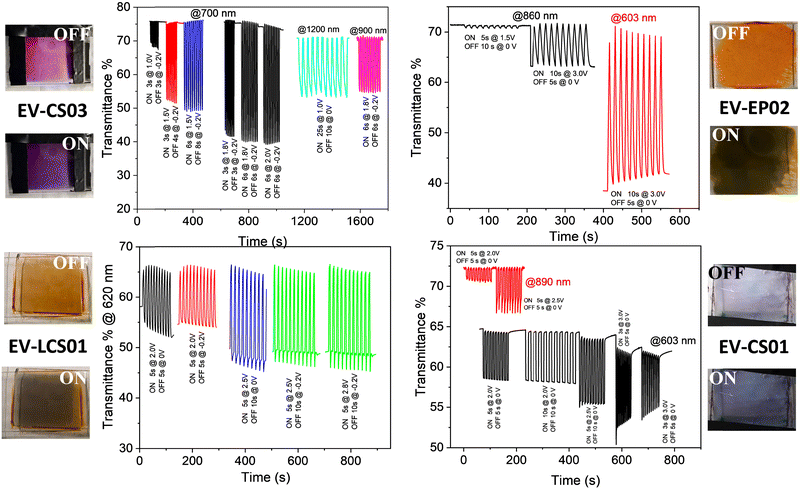 | ||
| Fig. 4 Electrochromic switching of the transmittance of the devices in the visible and near infrared range for different switching pulse sequences. | ||
In agreement with the cyclic voltammetry analysis, the application of potential biases between 0.9 and 1.0 V is sufficient for achieving an electrochromic response with the generation of the radical cation species of both the viologen and the arylamines of the BTDPA series, while larger values (≥1.4 V) are necessary for the BTTPA devices. As will be seen shortly, the EIS mechanistic analysis shows that this is due to a mismatch between electron injection at the cathode and electron ejection at the anode, caused by the higher oxidation potentials of the BTTPA compounds.44,45
From an applicative point of view, transmittance changes, switching times and cyclability are important performance metric parameters of the devices. They were evaluated by quantitatively monitoring the transmittance changes of the devices as a function of the ON/OFF switching pulse sequence at different wavelengths in the vis-NIR range, as displayed in Fig. 4 and Table 1. The reversibility of the electrochromic response can be nicely appreciated in Fig. 4 as well as in the Video S1 and S2 (ESI†) acquired during several switching experiments. The performance metrics for the devices, i.e., coloration time (τon), bleaching time (τoff) and transmittance contrast (ΔT), are reported in Table 1 for a wide range of switching pulse sequences. In general, the contrast is higher in the vis range than in the NIR one, with the switching conditions being the same, and at larger cell gaps (5 μm vs. 120 μm). We observed a range of 5 < ΔT% ≤ 36 in the NIR region and a range of 6 < ΔT% ≤ 75 in the vis region (Table 1). The switching times span the range from fractions of a second up to several seconds, depending on the pulse sequence and the response is relatively very fast for the smallest cell gap investigated (0.5 ≤ τon (s) ≤ 7.7; 0.7 ≤ τoff (s) ≤ 4.5). Compared to similar devices with the same cathodic component, i.e., the EV++/EV+ couples and different anodic couples,39,46 here we got comparable contrasts in the visible range and slightly smaller contrasts in the NIR but with relatively shorter response times.
| Device | Cell gap (μm) | λ (nm) | Pulse sequence ON time@Volts/OFF time@Volts | ΔT% | τ off (s) | τ on (s) |
|---|---|---|---|---|---|---|
| a Values reported as average and standard deviations in parentheses. | ||||||
| EV/LCS01 | 5 | 603 | 5 s@2 V/5 s@0 V | 12.9 (0.2) | 2.3 (0.3) | 3.0 (0.3) |
| 5 s@2 V/5 s@−0.2 V | 11.7 (0.02) | 2.97 (0.06) | 3.5 (0.1) | |||
| 5 s@2.5 V/10 s@0 V | 19.2 (0.02) | 1.3 (0.3) | 2.9 (0.3) | |||
| 5 s@2.5 V/10 s@−0.2 V | 18.71 (0.03) | 0.9 (0.1) | 3.2 (0.1) | |||
| 5 s@2.8 V/10 s@−0.2 V | 19.8 (0.1) | 1.3 (0.3) | 2.4 (0.3) | |||
| 120 | 603 | ON 2.5 V up to the maximum contrast | 75.2 (0.4) | — | ||
| 1133 | 22.0 (0.2) | |||||
| EV/EP02 | 5 | 890 | 10 s@3.0 V/ 5 s@0 V | 8.4 (0.2) | 7.7 (0.4) | 3.6 (0.3) |
| 603 | 29.9 (0.8) | 5.2 (0.3) | 4.5 (0.7) | |||
| 120 | 603 | ON 2.4 V up to the maximum contrast | 65.1 (0.3) | — | ||
| 860 | 36.1 (0.2) | |||||
| EV/CS03 | 5 | 700 | 3 s@1 V/3 s@−0.2 V | 7.6 (0.1) | 2.35 (0.05) | 1.32 (0.05) |
| 3 s@1.5 V/4 s@−0.2 V | 23.4 (0.3) | 2.07 (0.05) | 1.3 (0.2) | |||
| 6 s@1.5 V/8 s@−0.2 V | 26.8 (0.1) | 2.9 (0.1) | 1.5 (0.3) | |||
| 3 s@1.8 V/3 s@−0.2 V | 34.40 (0.02) | 1.48 (0.04) | 2.0 (0.1) | |||
| 6 s@1.8 V/6 s@−0.2 V | 35.6 (0.2) | 2.29 (0.04) | 1.37 (0.04) | |||
| 6 s@2.0 V/6 s@−0.2 V | 35.7 (0.2) | 1.4 (0.1) | 2.2 (0.1) | |||
| 900 | 6 s@1.8 V/6 s@−0.2 V | 16.1 (0.2) | 2.4 (0.1) | 2.9 (0.1) | ||
| 120 | 1100 | 25 s@1 V/10 s@0 V | 16.4 (0.3) | 19 (1) | 4.1 (0.4) | |
| 1100 | ON 1.1 V up to the maximum contrast | 20.5 (0.1) | — | |||
| 556 | 21.4 (0.2) | |||||
| EV/CS01 | 5 | 890 | 5 s@2.5 V/5 s@0 V | 5.4 (0.3) | 0.5 (0.1) | 5.2 (0.3) |
| 603 | 5 s@2.0 V/5 s@0 V | 6.0 (0.3) | 0.65 (0.08) | 0.7 (0.1) | ||
| 3 s@3.0 V/5 s@0 V | 9 (1) | 0.8 (0.1) | 1.0 (0.2) | |||
| 120 | 890 | ON 2.5 V up to the maximum contrast | 33.1 (0.3) | — | ||
| 603 | 54.3 (0.4) | |||||
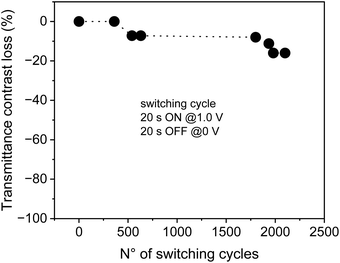
Finally, in order to evaluate the life cycle stability of the devices, we have performed a cyclability study up to 2100 cycles on the not sealed EV/CS03 device, obtaining a decay of transmittance of less than 8% after 500 cycles and of about 16% after 2000 cycles (Fig. 5). Under the switching conditions used in the cycle stability experiment, the device experiences low fatigue, working continuously for more than 24 h. It is important to underline that the contrast loss observed is not due to materials’ degradation and/or due to a loss of reversibility, because the electrochemistry of the device remains almost unaltered after 2100 cycles (Fig. S1a, ESI†).
We highlight here that the stability of our device is relatively very good compared to other all solid state devices,8 and even compared to liquid type devices where viologens and arylamines were used.47,48 Finally, Table 1 also reports the maximum transmittance changes obtained for all the devices on saturation at a specific potential and at a specific λmax, in the vis and NIR ranges. Overall, they show relatively high transmittance changes in the vis range (up to 65%) and moderate contrasts in the NIR range.
3.2. Impedance spectroscopy
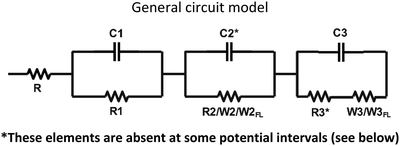
Impedance spectra of all the devices at different dc potential biases were fitted by the equivalent circuit models reported in Table 2:| Circuit elements operative at different potential | ||||||
|---|---|---|---|---|---|---|
| R(C1R1) | R(C1R1) | R(C1R1) | R(C1R1) | R(C1R1) | R(C1R1) | |
| (C2R2) | (C2R2) | (C2R2) | (C2R2) | W2FL | W2 | |
| (C3W3FL) | (C3W3) | (C3R3W3FL) | (C3R3W3) | (C3R3W3) | (C3R3W3) | |
| EV/CS03 | V < 0.8 | V = 0.8 | 1.0 ≤ V ≤ 1.2 | 1.4 ≤ V ≤ 1.6 | ||
| EV/CS01 | V < 1.0 | V = 1.0 | 1.2 ≤ V ≤ 1.9 | 2.1 ≤ V ≤2.4 | ||
| EV/EP02 | V = 1.6 | V < 1.6 | ||||
| V > 1.6 | ||||||
| EV/LCS01 | 0 ≤ V ≤ 1.4 | V = 1.6 | 1.8 ≤ V ≤ 2.2 | |||
The specification of circuit elements is as follows: R is the resistance of the bulk polymeric blend with an average value of 47 Ohm, which corresponds to an average bulk ionic conductivity of 7.1 × 10⁻⁵ S cm−1. This is due to the presence of ethyl viologen dibromide and is negligibly affected by the introduction of small percentage (1–2% w/w) of the neutral BTDPA and BTTPA compounds. C1R1 accounts for the capacitive and resistive electronic processes occurring at high frequency; the circuit elements C2R2 and C3R3 describe the capacitance of the double layer of the anode and cathode, respectively, and the charge transfer resistance at the anode/electrode and cathode/electrode interfaces, respectively. The Warburg diffusion element (W), also known as the semi-infinite transmission line, describes the semi-infinite linear diffusion, that is, diffusion in one dimension, only bounded by a large planar electrode on one side.
W
FL is the finite length diffusion, often called ‘Finite Length Warburg’ (or FLW), signfying the diffusion of ions in a limited space. It results in a dispersion expressed through a cotangent-hyperbolic function, characterized by two parameters: an “admittance’’ parameter, WFLY (units: Ω−1 s1/2), and a “time constant” parameter, B (units: sec½).49 The equation for the complex Warburg admittance (WFLY(ω)) is:50–52
EIS measurements were performed on ITO/(EC-EFC) gel/ITO devices, as a function of the potential bias applied to the cell, to get insight into their capacitive and resistive behavior. Fig. S6–S9 and Table S2–S5 (ESI†) respectively report the Nyquist plots with the fitted spectra and the relative fitting parameters.
Fig. 6 shows the Nyquist plot for the device containing the CS03 anode, at different applied potential biases. It can be readily seen that as the bias increases, the impedance of the device decreases and Warburg diffusion processes intervene. This behavior was found for all the devices (Fig. S6–S9, ESI†) and is clearly due to the electrochemical reaction occurring at the electrodes. However, different and complex behaviors were found among the studied devices due to the different anodic components displaying different oxidation potential values. In fact, at least 2 equivalent circuit models were used for fitting the impedance spectra of all the devices.
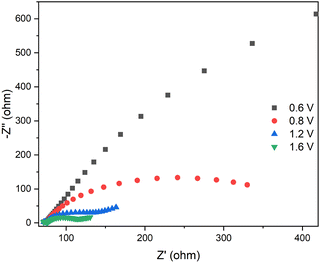 | ||
| Fig. 6 EIS spectra of the CS03-based device at different voltages. The inset is a zoom of the high frequency range. | ||
The circuit element (C1R1), which accounts for the resistive and capacitive electronic processes occurring at high frequency, is shared by all the devices. The values of C1 do not vary within each system and R1 slightly increases with voltage. Important differences were instead observed on C2R2, C3R3 and W. Among all the systems, the CS03-based device shows the best electrochemical matching between electronic injection at the cathode and electronic extraction at the anode, due to the matching between the reduction potential of the viologen and the oxidation potential of CS03 (Fig. 1 and Table S1, ESI†). As the potential difference increases, the charge transfer resistance associated with anodic component R2 significantly decreases (almost by three orders of magnitude) and the electric double layer capacitances C2 and C3 build up to a maximum value (two orders of magnitude higher) almost close to the peak reduction/oxidation voltage of CS03 and EV (Fig. 1 and Table S2, ESI†). This is the condition at which the electrochromic bands of the viologen and CS03 monocations are observed in the spectroelectrochemistry measurement (Fig. 1). Before viologen reduction, a WFL accounts for the diffusive behavior of this dication species towards the electrode surface, while no Warburg elements are needed to describe the neutral anode components. However, upon the formation of the radical cation species, the diffusive processes become dominant for both electrodes.
The impedance spectral voltage-dependent behavior of the devices, containing the CS01 and LCS01 anodes, is quite similar to that with CS03 and can be well-fit by the circuit models used for the CS03-based device. However, the maximum capacitive behavior, both at the anode and at the cathode, occurring at the onset of the redox processes, is by far less important than that observed for CS03. This observation also holds for the other device containing the anode, EP02. This may be due to the partial mismatch between the first redox potentials of the electroactive components (Table S1, ESI†), which, as already seen, causes an increasing delay in the onset potential for viologen reduction, which means that electron injection at the cathode becomes more difficult as the oxidation potential of the anode increases, and an overpotential must be applied until it is close to the onset for electron ejection at the anode. Moreover, at higher potential values, other redox reactions may occur in the bulk of the gel, due to the further viologen reduction to the neutral species and oxidation of the arylamines to the dication ones, which may subsequently activate the comproportionation reactions (6) and (7), or the electron exchange reaction (5), which contribute to reduce the accumulated charges at the electrodes.
3.3. Fluorescence properties and electrofluorochromic effect
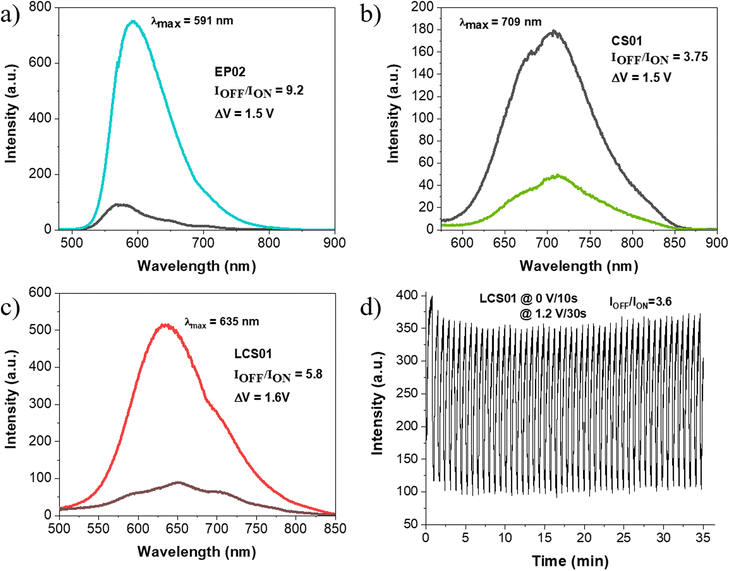
The fluorescence spectra of the devices in the off state (0 V) are displayed in Fig. 7a–c. They arise from the presence of the anodic components, which are highly fluorescent due to the benzothiadiazole central bridge. The spectra are characterized by broad and structured absorption bands which cover a wide range from about 500 nm to 850 nm in the NIR range. These spectral features are due to the superposition of the localized emission and the emission from charge transfer states at lower energy, determined by the intramolecular twisting of the arylamine units relative to the BT bridge (TICT).35 The charge transfer character of the fluorescence is highlighted by the Stokes shift observed in the gel matrix, which is only slightly smaller than those observed in PC/NMP solutions (Table 3), due to the relatively high polar medium constituting the gel (∼65% NMP (PC), ε = 32 (65) + ∼30% PVF, ε ∼ 3) where the fluorophores are embedded. It has been shown that the fluorescence of these BT–arylamines strongly decreases with the medium polarity35 and indeed, the fluorescence quantum yields FLQYs in NMP and PC solutions are very small and comparable to those observed in ACN.35 Interestingly, the FLQYs in the gel matrix are much higher than those measured in NMP and PC solutions and follow the decreasing order EP02 > LCS01 > CS01 > CS03, which substantially agrees with that observed in NMP/PC solutions (Table 3) and in several other solvents of different polarity (MCH, THF, DCM and ACN).35 Moreover, the FLQYs of the fluorophores incorporated in the solid matrix of the PVF polymer (without any solvent) are even higher. The huge fluorescence enhancement occurring in the gel phase cannot be accounted for by a decrease of the medium polarity but it should be caused by aggregation phenomena of the fluorophores in the gel and in the solid phases. Furthermore, the above fluorescence enhancement is accompanied by a significant increase of the lifetimes that could reflect a decrease of the non-radiative decay rate due to aggregation and also due to an increase of the matrix rigidity with respect to the solution, like that observed in dithien–benzothiadiazole derivatives in a PMMA solid matrix.53,54| Solvent | Polymer matrixa | Deviceb | |||
|---|---|---|---|---|---|
| PC | NMP | ||||
| a Prepared by dissolving the fluorophore (2% (w/w)) and PVF (40% (w/w)) in CH2Cl2 (58% (w/w)) and then by evaporating the solvent at 40 °C. b The solvent used for the devices was NMP for CS03 and PC for the others. | |||||
| CS01 | λ max π–π*/ICT (nm) | 315/523 | 317/533 | 522 | |
| λem (nm) | 769 | 747 | 719 | 742 | |
| Stokes Shift (cm−1) | 6116.6 | 5374.9 | 5680 | ||
| Φ PL (%) | 0.7 | 1.9 | 13.4 | 3.3 | |
| Lifetime (ns, λexc: 405 nm, λem = λmax) | 1.3 (76%)/6.8 (24%) | 2.5 (63%)/8.1 (37%) | 8.5 | 1.9 (34%)/4.6 (66%) | |
| CS03 | λ max π–π*/ICT (nm) | 291/537 | 290/546 | 545 | |
| λ em (nm) | 799 | 783 | 740 | 768 | |
| Stokes Shift (cm−1) | 6106.3 | 5543.6 | 5327.8 | ||
| Φ PL (%) | 0.1 | 0.7 | 5.3 | 1.7 | |
| Lifetime (ns, λexc: 405 nm, λem = λmax) | 0.5 (89%)/5.3 (11%) | 1.3 (82%)/6.8 (18%) | 6.4 | 1.3 (60%)/4.2 (40%) | |
| LCS01 | λ max π–π*/ICT (nm) | 330/469 | 333/479 | 479 | |
| λ em (nm) | 740 | 702 | 661 | 670 | |
| Stokes Shift (cm−1) | 7808.5 | 6631.8 | 5951.5 | ||
| Φ PL (%) | 0.2 | 0.4 | 38.6 | 12.6 | |
| Lifetime (ns, λexc: 405 nm, λem = λmax) | 0.3 | 0.5 (84%)/5.6 (16%) | 2.5 (47%)/6.0 (53%) | 1.9 (45%)/6.0 (55%) | |
| EP02 | λ max π–π*/ICT (nm) | 310/454 | 313/464 | 456 | |
| λ em (nm) | 684 | 666 | 606 | 634 | |
| Stokes Shift (cm−1) | 7406.6 | 6536.7 | 6157 | ||
| Φ PL (%) | 17.4 | 27.2 | 75.2 | 38.8 | |
| Lifetime (ns, λexc: 405 nm, λem = λmax) | 3.5 | 6.5 | 9.1 | 6.3 | |
Since the FLQY of CS03 is too low in the gel matrix, we investigated the electrofluorochromic response of the devices with EP02, CS01 and LCS01 only. Upon application of a potential difference able to achieve the oxidation of the arylamine, fluorescence quenching occurs for all the systems (Fig. 7a–c), which can be measured in terms of contrast ratio, which is the ratio between the intensity of the emission band measured at the maximum emission wavelength (λmax) in the OFF state (IOFF) over that in the ON state (ION). More specifically, a significant quenching occurs at ΔV = 1.5 V for EP02 with a contrast ratio of 9.2, while for the CS01 and LCS01 systems, the contrasts are 3.8 and 5.8 at 1.5 V and 1.6 V, respectively.
Deconvolution analysis of the fluorescence spectra acquired in the off state (0 V) shows the presence of at least two different emitting species in the gel matrix (Fig. S10–S12, ESI†) in which the red-NIR emission contribution is significant (Table S6, ESI†). Interestingly, the emission spectra of all the devices undergo a significant blue-shift of the whole band in the quenched state, which is more marked for EP02 (Fig. 7a). Spectral deconvolution in the on state (Fig. S10–S12 and Table S6, ESI†) indeed shows that the contribution of the charge transfer states at lower energy (those in the red-NIR range) decreases with respect to the emission spectra acquired in the off state. This is supported by the significant red to orange shift of the emission color of the devices, shown by the CIE 1976 coordinates reported in Fig. 8. They show a fine tuning of the emission color due to a gradual voltage-dependent spectral change, in a small voltage range. It must be noted, however, that the above shift is underestimated because the CIE coordinates do not consider the fraction of NIR absorption contributing to the overall emission, which, as shown before, is more important in the spectra at 0 V.
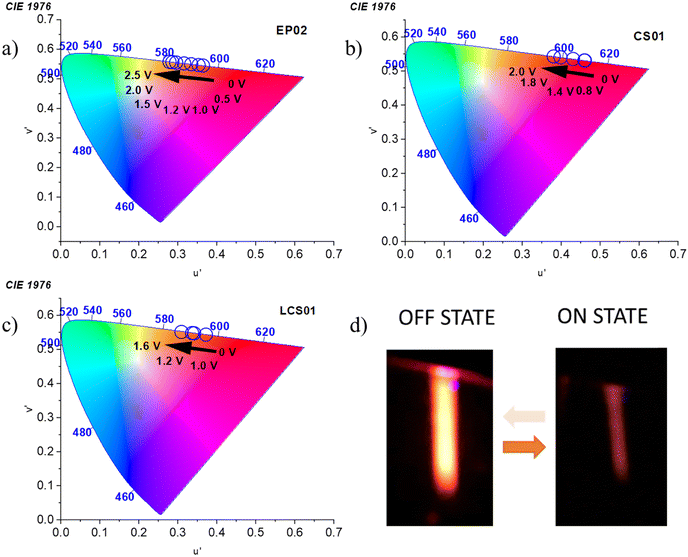 | ||
| Fig. 8 Voltage-dependent 1976 CIE chromaticity coordinates of the fluorescent emission of (a) EP02/EV, (b) CS01/EV, and (c) LCS01/EV systems. (d) EFC response of the LCS01-based device. | ||
Importantly, the EFC response is highly reversible as is the case for the electrochromic one (Fig. 4). Actually, the processes involved in both cases are the same, with the redox reactions taking place at the electrodes, i.e. reduction of the viologen and oxidation of the anodic component. The devices can be indeed switched on and off from the emissive to the quenched state several times with τON and τOFF values of 10.4 ± 0.6 s and 26 ± 1 s, respectively (Fig. 7d). Representative images of the fluorescence of the device with the LCS01 fluorophore in the off and on states are shown in Fig. 8d. Moreover, the EFC response of this device can be nicely appreciated in Video S3 (ESI†) during several switching cycles.
4. Conclusion
Herein, we presented all-in-one thermoplastic gel-based EC and EFC devices whose electroactive components belong to the class of small organic mixed valence compounds. In particular, here we combined the well-known ethyl viologen cathode with different donor–acceptor–donor triads of the type arylamine-BT-arylamine, showing for the first time that the latter can work well as anodic components. Moreover, their unique electrooptical properties, resulting from the integration of the intriguing electron acceptor and optical properties of BT and the huge redox-active properties of the arylamines, were used to develop dual functional EC/EFC solid state devices by which modulation of light absorption and emission in the vis-NIR range is possible. Cyclic voltammetry and impedance spectroscopy showed an intriguing electrochemical behavior of the devices, which depends on the anodic components. Two different coloration switches were obtained from light pink to black for EV/BTDPA devices and from orange to dark green/grey for the EV/BTTPA ones. Colorimetry analysis showed that the above switching can be fine-tuned by the voltage which induces a gradual change in the CIE LAB color coordinates, pointing toward lower lightness and luminosity (L*) and higher green (a*) and blue (b*) balances. The devices also show high electrochromic reversibility in the vis-NIR region and can be switched from a transmissive to an opaque state with coloration/bleaching times in the range of 0.5/0.4–7.7/4.5 seconds, and transmittance contrasts (ΔT) of 5–36% in the NIR and 6–75% in the vis range. Moreover, they show long-term life cycle stability of more than 2000 cycles. Extremely fascinating is the electrochrofluorochromic effect because small potential differences are sufficient to tune the light emission both in terms of intensity and color, with significant fluorescence shifts from NIR-red to yellow and fluorescence quenching that can be tuned by the voltage applied. Analogous to the electrochromic response, the electrofluorochromic effect is highly reversible and the devices can be switched from the emissive to the quenched state in a few seconds (∼10 s and 26 s for τon and τoff, respectively). These characteristics make them promising materials for intelligent displays in the dual-mode anticounterfeiting technologies.Author contributions
Giuseppina Anna Corrente: conceptualization, methodology, investigation, writing – original draft. Dora A. González: investigation. Ece Aktas: investigation. Agostina Lina Capodilupo: investigation, data curation, writing – original draft. Francesco Ruighi: investigation. Gianluca Accorsi: data curation, validation, writing – original draft, funding acquisition. Daniela Imbardelli: data curation, writing – original draft. Cristina Rodriguez-Seco: investigation. Eugenia Martinez-Ferrero: writing – review & editing, supervision. Emilio Palomares: conceptualization, methodology, supervision, resources, funding acquisition. Amerigo Beneduci: conceptualization, methodology, validation, resources, data curation, writing – original draft, writing – review & editing, supervision, funding acquisition.Conflicts of interest
The authors declare no conflict of interest.Acknowledgements
The authors are grateful to the Ministero dell’Università e della Ricerca Italiano (MUR) and the University of Calabria for supporting this project in the framework of the ex 60% budget grant. Funding from MCIN (project PID2019-109389RB-I00 and MCIN/AEI/10.13039/501100011033 (CEX2019-000925-S)) and SGRAGAUR (project 2021SGR01261) is also acknowledged. E. P. is also thankful to ICIQ, CERCA, and ICREA for the financial support. D. A. G. acknowledges the financial support from the MINECO predoctoral fellowship (BES-2017-082439). A. L. C. acknowledges the Italian Ministry of Research (MUR) under the complementary actions to the NRRP (PNC0000007) “Fit4MedRob- Fit for Medical Robotics” Grant (contract number CUP B53C22006960001). G. A. C. and A. B. acknowledge the financial support from MUR postdoctoral fellowship DM 737/2021 – Grant b.1 (CUP H25F21001420001).References
- K. Nakamura, K. Kanazawa and N. Kobayashi, J. Photochem. Photobiol. C: Photochem., 2022, 50, 100486 CrossRef CAS.
- S. Seo, S. Pascal, C. Park, K. Shin, X. Yang, O. Maury, B. D. Sarwade, C. Andraud and E. Kim, Chem. Sci., 2014, 5, 1538–1544 RSC.
- C. Quinton, V. Alain-Rizzo, C. Dumas-Verdes, F. Miomandre, G. Clavier and P. Audebert, Chem. Eur. J., 2015, 21, 2230–2240 CrossRef CAS PubMed.
- R. J. Mortimer, Chem. Soc. Rev., 1997, 26, 147–156 RSC.
- R. J. Mortimer, D. R. Rosseinsky and P. M. S. Monk, Electrochromic Materials and Devices, ed. R. J. Mortimer, D. R. Rosseinsky, P. M. S. Monk, Wiley-VCH, 2015, vol. 7, p. 211 Search PubMed.
- P. Audebert and F. Miomandre, Chem. Sci., 2013, 4, 575–584 RSC.
- H. Al-Kutubi, H. R. Zafarani, L. Rassaei and K. Mathwig, Eur. Polym. J., 2016, 83, 478–498 CrossRef CAS.
- G. A. Corrente and A. Beneduci, Adv. Opt. Mater., 2020, 8, 2000887 CrossRef CAS.
- Y. Watanabe, K. Nakamura and N. Kobayashi, Phys. Chem. Chem. Phys., 2011, 13, 19420–19426 RSC.
- G. Cai, J. Wang and P. S. Lee, Acc. Chem. Res., 2016, 19, 1469–1476 CrossRef PubMed.
- P. M. Beaujuge and J. R. Reynolds, Chem. Rev., 2010, 110, 268–320 CrossRef CAS PubMed.
- S. M. Yan, Y. J. Dong, W. J. Li, L. Chen, Y. Y. Dai, N. Ren, Y. Z. Wu, Y. J. Zhang and C. Zhang, New J. Chem., 2019, 43, 9566–9573 RSC.
- X. J. Wang, W. M. Lau and K. Y. Wong, Appl. Phys. Lett., 2005, 87, 113502 CrossRef.
- S. Koyuncu, O. Usluer, M. Can, S. Demic, S. Icli and N. S. Sariciftci, J. Mater. Chem., 2011, 21, 2684–2693 RSC.
- G. Ding, H. Zhou, J. Xu and X. Lu, Chem. Commun., 2014, 50, 655–657 RSC.
- X. Wang, W. Li, W. Li, C. Gu, H. Zheng, Y. Wang, Y.-M. Zhang, M. Li and S. X.-A. Zhang, Chem. Commun., 2017, 53, 11209–11212 RSC.
- N. Sun, S. Meng, D. Chao, Z. Zhou, Y. Du, D. Wang, X. Zhao, H. Zhou and C. Chen, Polym. Chem., 2016, 7, 6055–6063 RSC.
- N. Sun, F. Feng, D. Wang, Z. Zhou, Y. Guan, G. Dang, H. Zhou, C. Chen and X. Zhao, RSC Adv., 2015, 5, 88181–88190 RSC.
- N. Sun, Z. Zhou, D. Chao, X. Chu, Y. Du, X. Zhao, D. Wang and C. Chen, J. Polym. Sci., Part A: Polym. Chem., 2017, 55, 213–222 CrossRef CAS.
- L. Lu, K. Wang, H. Wu, A. Qin and B. Z. Tang, Chem. Sci., 2021, 12, 7058–7065 RSC.
- J. Liu, Y. Shi, J. Wu, M. Li, J. Zheng and C. Xu, RSC Adv., 2017, 7, 25444–25449 RSC.
- K. Su, N. Sun, X. Tian, X. Li, D. Chao, D. Wang, H. Zhou and C. Chen, Mater. Today Chem., 2021, 22, 100536 CrossRef CAS.
- T. Yu, P. Theato, H. Yao, H. Liu, Y. Di, Z. Sun and S. Guan, Chem. Eng. J., 2023, 451, 138441 CrossRef CAS.
- S. Yang, Y. Lin, J. Sun, C. Li, Y. Zhang and C. Zhang, Electrochim. Acta, 2022, 421, 140443 CrossRef CAS.
- K. Nakamura, K. Kanazawa and N. Kobayashi, Chem. Commun., 2011, 47, 10064–10066 RSC.
- K. Kanazawa, K. Nakamura and N. Kobayashi, Sol. Energy Mater. Sol. Cells, 2016, 145, 42–53 CrossRef CAS.
- K. Kanazawa, K. Nakamura and N. Kobayashi, J. Phys. Chem. A, 2014, 118, 6026–6033 CrossRef CAS PubMed.
- T. J. Adams, A. R. Brotherton, J. A. Molai, N. Parmar, J. R. Palmer, K. A. Sandor and M. G. Walter, Adv. Funct. Mater., 2021, 31, 2103408 CrossRef CAS.
- A. N. Woodward, J. M. Kolesar, S. R. Hall, N.-A. Saleh, D. S. Jones and M. G. Walter, J. Am. Chem. Soc., 2017, 139, 8467–8473 CrossRef CAS PubMed.
- A. Beneduci, S. Cospito, M. La Deda, L. Veltri and G. Chidichimo, Nat. Commun., 2014, 5, 3105 CrossRef PubMed.
- A. Beneduci, S. Cospito, M. La Deda and G. Chidichimo, Adv. Funct. Mater., 2015, 25, 1240–1247 CrossRef CAS.
- B. Sk, M. Sarkar, K. Singh, A. Sengupta and A. Patra, Chem. Commun., 2021, 57, 13590–13593 RSC.
- R. Huang, X. Jia, M. Zhou, Y. Xie and D. Chao, Chem. Eng. J., 2023, 459, 141664 CrossRef CAS.
- G. A. Corrente, E. Fabiano, M. La Deda, F. Manni, G. Gigli, G. Chidichimo, A. L. Capodilupo and A. Beneduci, ACS Appl. Mater. Interfaces, 2019, 11, 12202–12208 CrossRef CAS PubMed.
- G. A. Corrente, D. A. González, E. Aktas, A. L. Capodilupo, G. Mazzone, F. Ruighi, G. Accorsi, D. Imbardelli, C. Rodriguez-Seco, E. Martinez-Ferrero, E. Palomares and A. Beneduci, Adv. Opt. Mater., 2023, 11, 2201506 CrossRef CAS.
- C. Rodríguez-Seco, S. Biswas, G. D. Sharma, A. Vidal-Ferran and E. Palomares, J. Phys. Chem. C, 2018, 122, 13782–13789 CrossRef.
- C. Rodriguez-Seco, M. Mendez, C. Roldan-Carmona, L. Cabau, A. M. Asiri, M. K. Nazeeruddin and E. Palomares, ACS Appl. Mater. Interfaces, 2020, 12, 32712–32718 CrossRef CAS PubMed.
- G. Chidichimo, B. C. De Simone, D. Imbardelli, M. De Benedittis, M. Barberio, L. Ricciardi and A. Beneduci, J. Phys. Chem. C, 2014, 118, 13484–13492 CrossRef CAS.
- S. Cospito, B. C. De Simone, A. Beneduci, D. Imbardelli and G. Chidichimo, Mater. Chem. Phys., 2013, 140, 431–434 CrossRef CAS.
- B. Yeum, Electrochemical Impedance Spectroscopy: Data Analysis Software. Echem Software, Ann Arbor ( 2001).
- J. N. Demas and G. A. Crosby, J. Phys. Chem., 1971, 75, 991–1024 CrossRef.
- K. Nakamaru, Bull. Chem. Soc. Jpn., 1982, 55, 2697–2705 CrossRef CAS.
- J. C. De Mello, H. F. Wittmann and R. H. Friend, Adv. Mater., 1997, 9, 230–232 CrossRef CAS.
- A. Heckmann and C. Lambert, Angew. Chem., Int. Ed., 2012, 51, 326–392 CrossRef CAS PubMed.
- A. Beneduci, G. A. Corrente, E. Fabiano, V. Maltese, S. Cospito, G. Ciccarella, G. Chidichimo, G. Gigli and A.-L. Capodilupo, Chem. Commun., 2017, 53, 8960–8963 RSC.
- G. A. Corrente, E. Fabiano, F. Manni, G. Chidichimo, G. Gigli, A. Beneduci and A.-L. Capodilupo, Chem. Mater., 2018, 30, 5610–5620 CrossRef CAS.
- J.-T. Wu, H.-T. Lin and G.-S. Liou, ACS Appl. Mater. Interfaces, 2019, 11, 14902–14908 CrossRef CAS PubMed.
- Y. Shi, J. Liu, M. Li, J. Zheng and C. Xu, Electrochim. Acta, 2018, 285, 415–423 CrossRef CAS.
- https://www.lacey.se/science/eis/diffusion-impedance (visited on 27 Jan 2023).
- E. Barsukov and J. R. Mcdonald, Impedance Spectroscopy, Wiley Interscience, 2005, pp. 84–101 Search PubMed.
- A. Lasia, Electrochemical Impedance Spectroscopy and Its Applications, Modern Aspects of Electrochemistry, ed. B. E. Conway, J. Bockris, and R. E. White, Kluwer Academic/Plenum Publishers, New York, 1999, vol. 32, p. 91 Search PubMed.
- consultrsr.net/resources/eis/diffusion.htm (visited 27 Jan 2023).
- B. Patrizi, A. Iagatti, L. Abbondanza, L. Bussotti, S. Zanardi, M. Salvalaggio, R. Fusco and P. Foggi, J. Phys. Chem. C, 2019, 123, 5840–5852 CrossRef CAS.
- A. Iagatti, B. Patrizi, A. Basagni, A. Marcelli, A. Alessi, S. Zanardi, R. Fusco, M. Salvalaggio, L. Bussotti and P. Foggi, Phys. Chem. Chem. Phys., 2017, 19, 13604–13613 RSC.
Footnote |
| † Electronic supplementary information (ESI) available. See DOI: https://doi.org/10.1039/d3tc03577h |
| This journal is © The Royal Society of Chemistry 2023 |

