
 Open Access Article
 This Open Access Article is licensed under a Creative Commons Attribution-Non Commercial 3.0 Unported Licence
Peripheral engineering of Ir(III) emitters with imidazo[4,5-b]pyrazin-2-ylidene cyclometalates for blue organic light emitting diodes†
Jie
Yan‡
 a,
Yixin
Wu‡
a,
I-Che
Peng‡
b,
Yi
Pan‡
a,
Shek-Man
Yiu
a,
Ken-Tsung
Wong
c,
Wen-Yi
Hung
*b,
Yun
Chi
*a and
Kai-Chung
Lau
*a
a,
Yixin
Wu‡
a,
I-Che
Peng‡
b,
Yi
Pan‡
a,
Shek-Man
Yiu
a,
Ken-Tsung
Wong
c,
Wen-Yi
Hung
*b,
Yun
Chi
*a and
Kai-Chung
Lau
*a
aDepartment of Materials Sciences and Engineering, Department of Chemistry, and Center of Super-Diamond and Advanced Films (COSDAF), City University of Hong Kong, Hong Kong. E-mail: yunchi@cityu.edu.hk; kaichung@cityu.edu.hk
bDepartment of Optoelectronics and Materials Technology, National Taiwan Ocean University, Keelung 20224, Taiwan. E-mail: wenhung@mail.ntou.edu.tw
cDepartment of Chemistry, National Taiwan University, Taipei 10617, Taiwan
First published on 8th August 2023
Abstract
Ir(III) based carbene complexes are highly sought after in the field of organic light-emitting diodes (OLEDs), as they are expected to solve the thorny issue of efficient and durable blue phosphors. Hence, three tris-bidentate Ir(III) based carbene complexes, namely, f-ct4a–c, were synthesized and fully characterized by both spectroscopic and structural methods, presenting a bulky 2,6-dimethylphenyl substituent on the imidazo[4,5-b]pyrazin-2-ylidene fragment, and a distinctive N-aryl (i.e., either phenyl or 4-t-butylphenyl) appendage and cyclometalating group. These complexes exhibited sky-blue emission with a peak max. located between 473 and 482 nm and a photoluminescent quantum yield (PLQY) of 50–68% recorded in degassed toluene, and furthermore, a much-improved PLQY of 71–87% upon doping in the 2,8-bis(diphenylphosphoryl)dibenzo[b,d]thiophene (PPT) host matrix. Remarkably, the f-ct4b based OLED device and respective hyper-OLED device exhibited blue Commission Internationale de L’Eclairage CIEx,y coordinates of (0.19,0.47) and (0.11,0.44), and max. external quantum efficiencies (EQEs) of 17.4% and 21.5%, respectively, demonstrating their potential in future OLED applications.
Introduction
Over the past two decades, phosphorescent organic light emitting diodes (PhOLEDs) have been extensively investigated for future use in flat panel displays and lighting applications due to their capability in harvesting 100% excitons generated during electrical excitation.1 This process is competitive with that of thermally activated delayed fluorescence (TADF) emitters, in which their small energy gap between singlet and triplet excited states (ΔEST) allowed effective utilization of all excitons,2 but is significantly better than that of fluorescent emitters, in which only 25% of the electrical generated singlet excitons can be utilized according to the spin statistics.3Next, tuning their emission to standard RGB colour is also of particular importance for OLED applications. Many Ir(III) complexes have already shown red and green electroluminescence with satisfactory long term stability, but not for the blue ones.4 This is attributed to their high excitation energy for blue emission that could severely limit its emission efficiency and stability. Specifically, in contrast to the typical red and green phosphors with relatively short radiative lifetime of ∼1 μs and below, the inherent long radiative lifetime of blue phosphors, i.e., ≫1 μs, which is a result of the diminished metal-to-ligand charge transfer (MLCT) contribution in the excited state manifolds and reduced spin–orbit coupling, has caused significant efficiency roll-off, exciton–exciton and exciton–polaron annihilation for devices at a higher driving current density.5 Furthermore, it is well understood that the parasitic annihilation processes between excited states could lead to the hot excited states with energy well above the ground-state, i.e., ≥6 eV, causing unavoidable chemical deterioration for the blue phosphors upon excitation.6 Therefore, efficient blue phosphors with both greater long term stability and shortened radiative lifetime are urgently needed for better device efficiency wanted in future commercial applications.7
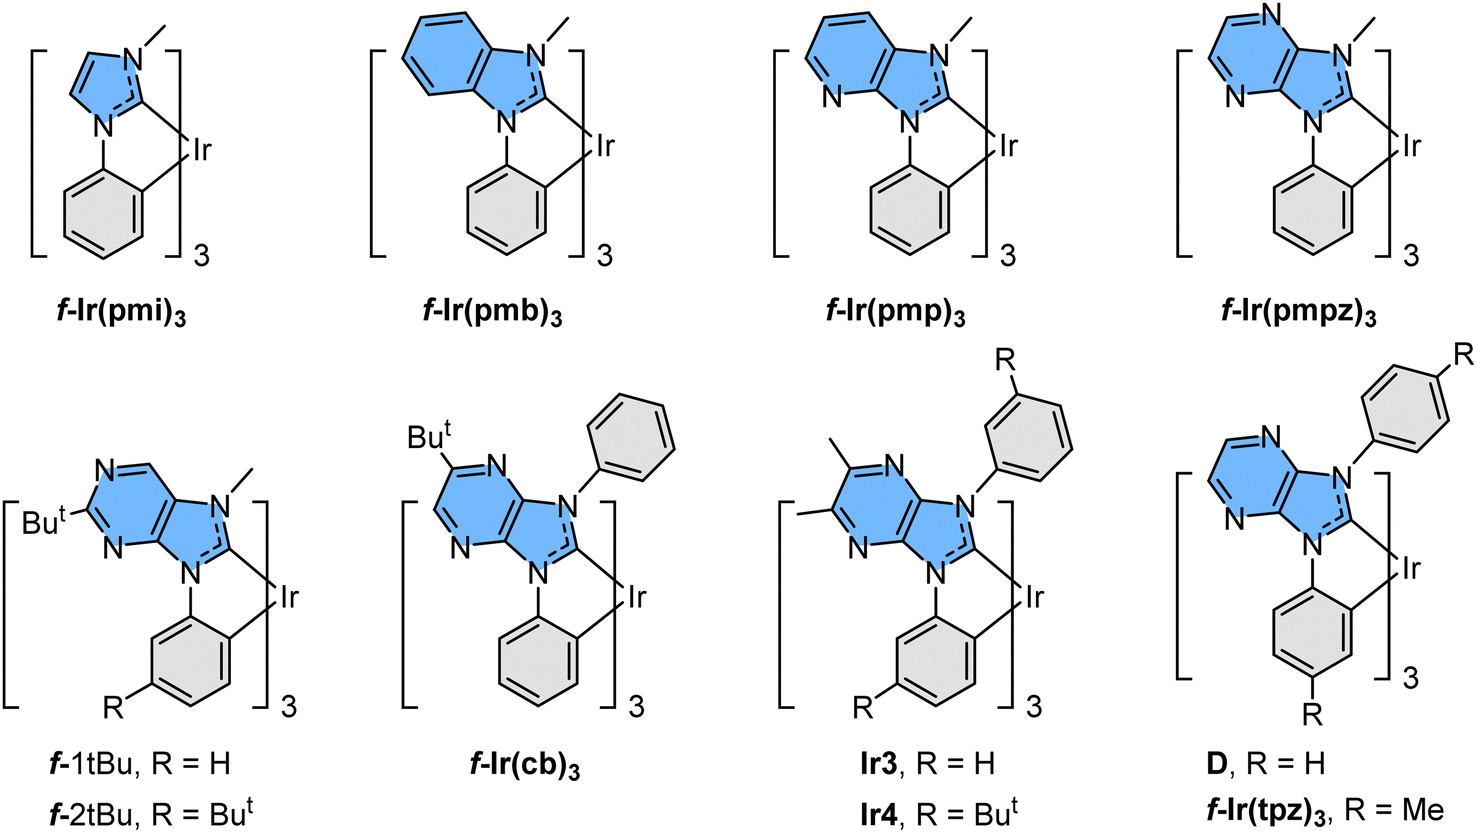
There are many intrinsic factors that could affect the fundamentals of blue phosphors.8 However, homoleptic Ir(III) carbene complexes were known to be the best possible candidates due to their highly destabilized metal centred (MC) dd excited states,9 which is attributed to their six Ir–C bonding vectors; i.e., the strongest metal–chelate bonding known to all transition-metal complexes. Ultimately, this molecular design improved their intrinsic stability and emission efficiency at the same time. These properties are far superior to those of their predecessor, namely: FIrpic, in which its intrinsic instability and dominant ππ* transition character in the excited state have seriously hampered the overall performances and long-term durability of the fabricated OLED devices.10 Moreover, the notably destabilized lowest unoccupied molecular orbital (LUMO) of the Ir(III) carbene complexes afforded high energy emission in the near UV region, as shown in m.f-Ir(pmi)311 and m.f-Ir(pmb)3.12 Subsequently, shifting emission to the true-blue region has been achieved by insertion of skeletal N atoms adjacent to the carbene entities as shown in m-Ir(tbpbp)3 and analogues,13f-Ir(pmp)3,14f-Ir(pmpz)3,15f-1tBu and f-2tBu,16D and derivatives,17f-Ir(tpz)3,15Ir3 and Ir4,18 and f-Ir(cb)3.19 Selective drawings are depicted in Scheme 1, among which many imidazo[4,5-b]pyrazin-2-ylidene based derivatives have already been utilized in the fabrication of efficient and relatively durable blue emissive OLED devices, particularly those with functional N-aryl appendages such as f-Ir(cb)3 and analogues.
 | ||
| Scheme 1 Representative drawings of near UV and blue emissive Ir(III) complexes reported in the literature. | ||
Herein, our approach is to modify the existing blue emissive Ir(III) carbene complexes with adequate performances, i.e., homoleptic complexes such as f-Ir(cb)3 and analogues,19 as well as a similar set of Ir(III) complexes bearing t-butyl substituted imidazo[4,5-b]pyrazin-2-ylidene chelates, i.e., f-ct1a–d,20 and tuned their physical and photophysical properties to suit the possible requirements demanded by the PhOLED devices of the future. We have selected the 2,6-dimethylphenyl fragment as the designated functional group in replacement for the t-butyl substituent on the carbene fragments, as the imposed steric encumbrance of similar substituents is expected to suppress the dopant-host interaction and further boost the OLED device efficiency as shown in the literature.21 Moreover, the same steric encumbrance prevented electronic delocalization between the 2,6-dimethylphenyl group and carbene core structure; thereby, it offered a slightly reduced bandgap demanded for genuine blue emission. As depicted in this article, the studied phosphors revealed excellent performance with EQE > 20% and relatively suppressed efficiency roll-off, confirming the usefulness of this synthetic approach and investigation.
Results and discussion
Syntheses of chelate and metal emitters
The 2,6-dimethylphenyl functionalized imidazo[4,5-b]pyraz-3-ium pro-chelate was synthesized using experimental protocols as depicted in Scheme 2. We started from commercially available pyrazin-2-amine, from which the addition of N-bromosuccinimide afforded 5-bromopyrazin-2-amine in high yield.22 Next, the 2,6-dimethylphenyl substituent was introduced by Suzuki cross coupling, and the second bromination afforded the desired 3-bromo-5-(2,6-dimethylphenyl)pyrazin-2-amine. Next, it was transformed into the imidazole intermediate using a three-steps-in-one approach:23i.e., (i) treatment with triethyl orthoformate to afford an ethyl N-arylformimidate,24 and (ii) direct condensation with 4-tert-butlyaniline in giving asymmetric N,N′-diarylformamidine,25 (iii) followed by copper-catalyzed intramolecular C–N bond formation to yield the demanded 1-(4-(t-butyl)phenyl)-6-(2,6-dimethylphenyl)-1H-imidazo[4,5-b]pyrazine.26 Finally, this chelate synthesis was completed by (iv) N-arylation with diphenyliodonium triflate in the presence of a Cu(OAc)2 catalyst,27 affording asymmetric, di-N-aryl substituted imidazo[4,5-b]pyraz-3-ium pro-chelate in high yield.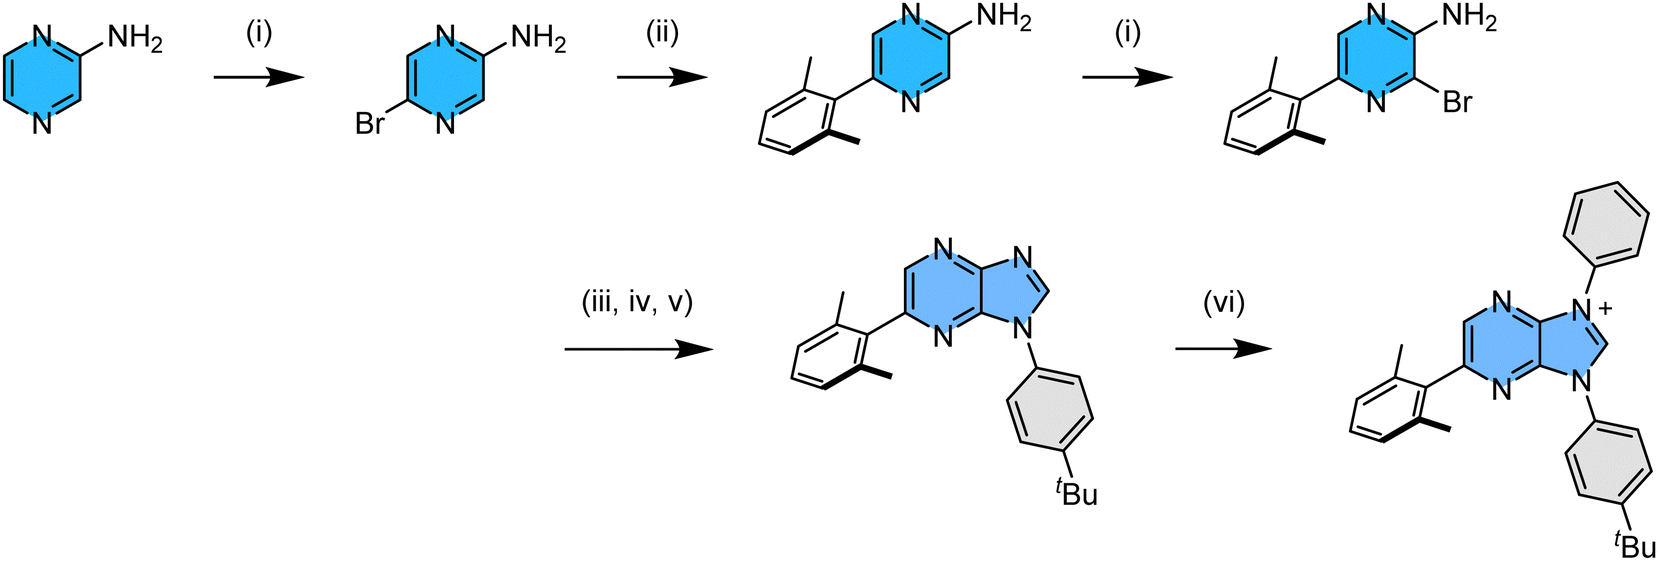 | ||
| Scheme 2 Synthetic protocol to the functional imidazo[4,5-b]pyraz-3-ium pro-chelate; experimental conditions: (i) NBS, 0 °C to RT; (ii) 2,6-dimethylphenyl boronic acid, Pd(PPh3)2Cl2, K2CO3, reflux; (iii) triethyl orthoformate, 140 °C; (iv) 4-t-butyl aniline, 140 °C; (v) DBU, CuI, 110 °C; (vi) Cu(OAc)2, (Ph2I+)(CF3SO3−), 110 °C. | ||
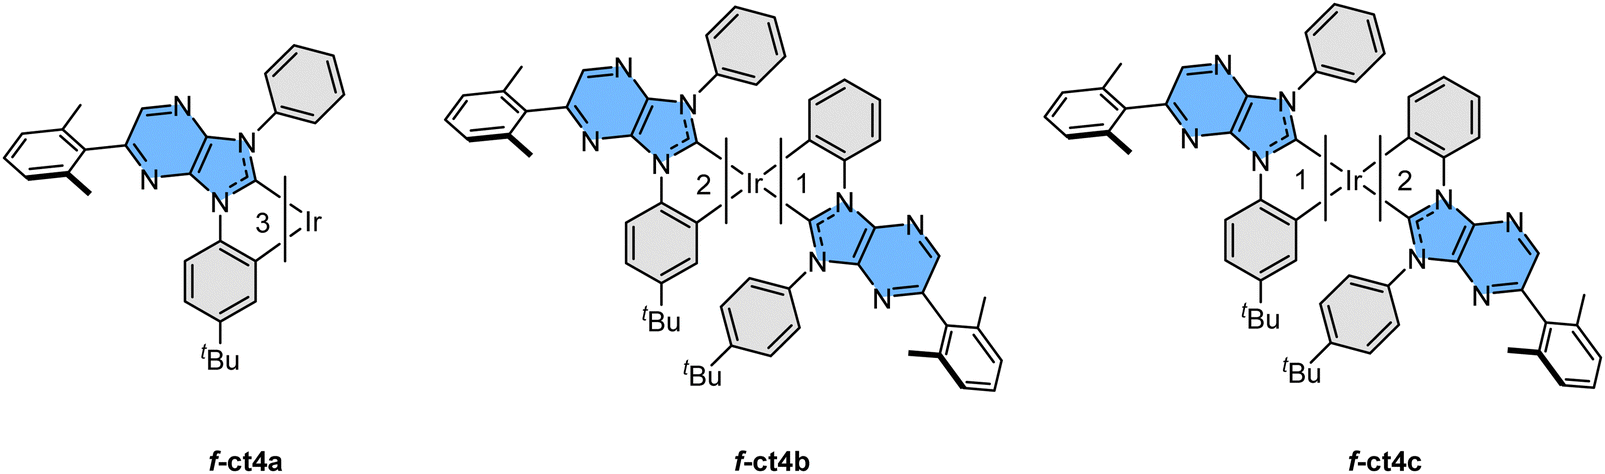
Next, we employed this pro-chelate, iridium reagent [IrCl3(tht)3] and sodium acetate as the catalyst to prepare the required Ir(III) based carbene complexes.28 Accordingly, heating of the trios in refluxing o-dichlorobenzene (bp = 180 °C) afforded a mixture of three fac- isomers, namely: a yellow f-ct4a, a yellow f-ct4b, and a light-yellow f-ct4c in an approx. ratio of 1![[thin space (1/6-em)]](https://www.rsc.org/images/entities/char_2009.gif) :5:3, respectively. Analogous reactions conducted in refluxing 1,2,4-trichlorobenzene (bp = 213 °C) afforded the same mixture of f-ct4a, f-ct4b and f-ct4c, but in a slightly different ratio of 1:10:5. A schematic drawing of these Ir(III) based carbene complexes is depicted in Scheme 3. In addition, heating purified samples of f-ct4b and f-ct4c in the presence of both p-toluenesulfonic acid and sodium acetate at 213 °C for 48 hours also afforded a similar distribution of isomeric products, with no obvious decomposition. This result is greatly different from the control experiments with heating in the presence of either no sodium acetate catalyst or, alternatively, sodium acetate but without the added sulfonic acid, both of which afforded no isomerization after prolonged heating in refluxing 1,2,4-trichlorobenzene. Hence, the detected isomerization could be initiated by protonation of the unique cyclometalating aryl group, forming a mono-dentate carbene entity with two free aryl pendants, followed by reversible generation of respective Ir–C bonding at one of the aryl pendants during heating.29 A recent report on homoleptic Ir(III) complexes bearing metalated N-heterocyclic carbenes may also provide clues to the possible intermediates and pathway of isomerization processes.30
:5:3, respectively. Analogous reactions conducted in refluxing 1,2,4-trichlorobenzene (bp = 213 °C) afforded the same mixture of f-ct4a, f-ct4b and f-ct4c, but in a slightly different ratio of 1:10:5. A schematic drawing of these Ir(III) based carbene complexes is depicted in Scheme 3. In addition, heating purified samples of f-ct4b and f-ct4c in the presence of both p-toluenesulfonic acid and sodium acetate at 213 °C for 48 hours also afforded a similar distribution of isomeric products, with no obvious decomposition. This result is greatly different from the control experiments with heating in the presence of either no sodium acetate catalyst or, alternatively, sodium acetate but without the added sulfonic acid, both of which afforded no isomerization after prolonged heating in refluxing 1,2,4-trichlorobenzene. Hence, the detected isomerization could be initiated by protonation of the unique cyclometalating aryl group, forming a mono-dentate carbene entity with two free aryl pendants, followed by reversible generation of respective Ir–C bonding at one of the aryl pendants during heating.29 A recent report on homoleptic Ir(III) complexes bearing metalated N-heterocyclic carbenes may also provide clues to the possible intermediates and pathway of isomerization processes.30
 | ||
| Scheme 3 Schematic molecular drawings of the studied Ir(III) complexes. | ||
Structural characterization
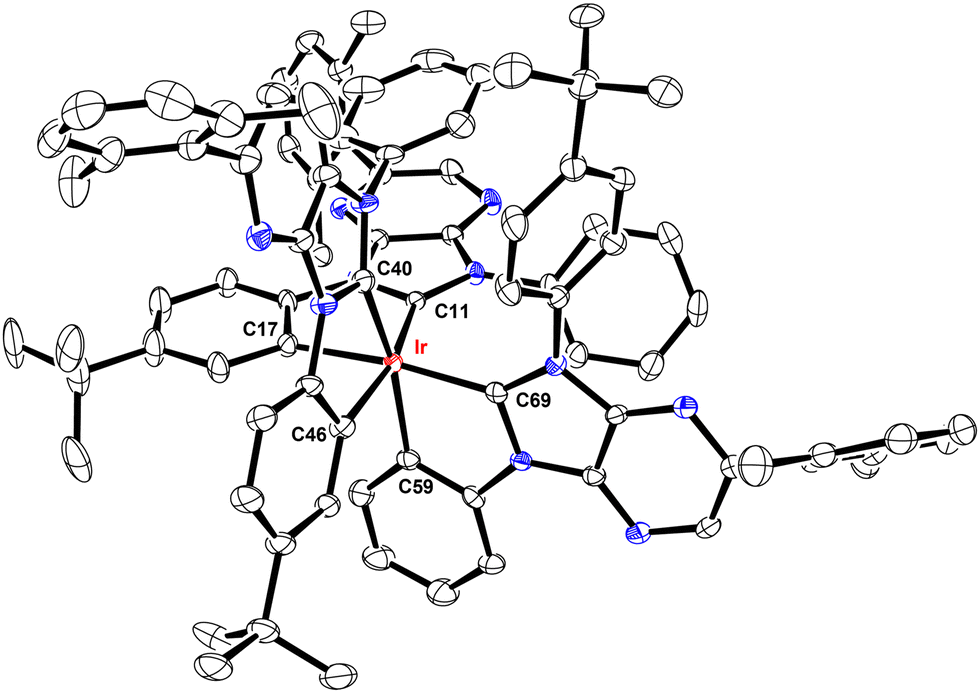
These Ir(III) complexes were characterized by single crystal X-ray diffraction studies and their structural drawings are depicted in Fig. 1–3. Notably, all Ir(III) complexes exhibited a quasi-octahedral arrangement with trans-arranged C(carbene)–Ir–C(aryl) bonding angles of 166.48–175.89°. Moreover, all Ir–C(carbene) distances (2.018–2.048 Å) are notably shorter than Ir–C(aryl) distances (2.080–2.110 Å), indicating a much stronger Ir–C bonding interaction for the formers. The variations of Ir–C distances between carbene and aryl carbon atoms are consistent with the generalized structural features of facially coordinated Ir(III) carbene complexes reported in the literature.15,16,23 Interestingly, the average Ir–C(carbene) distance of f-ct4a (2.039 Å) was relatively longer than that of f-ct4b and f-ct4c (2.022 Å and 2.023 Å), while there is a small decrease in the average Ir–C(aryl) distance of f-ct4c (2.091 Å) vs. that of f-ct4b and f-ct4a (2.093 Å and 2.097 Å), respectively. Although this variation fell within the estimated standard deviations, the change in Ir–C bond distances may reflect the differences in thermal stability and product distribution observed for this series of Ir(III) metal complexes.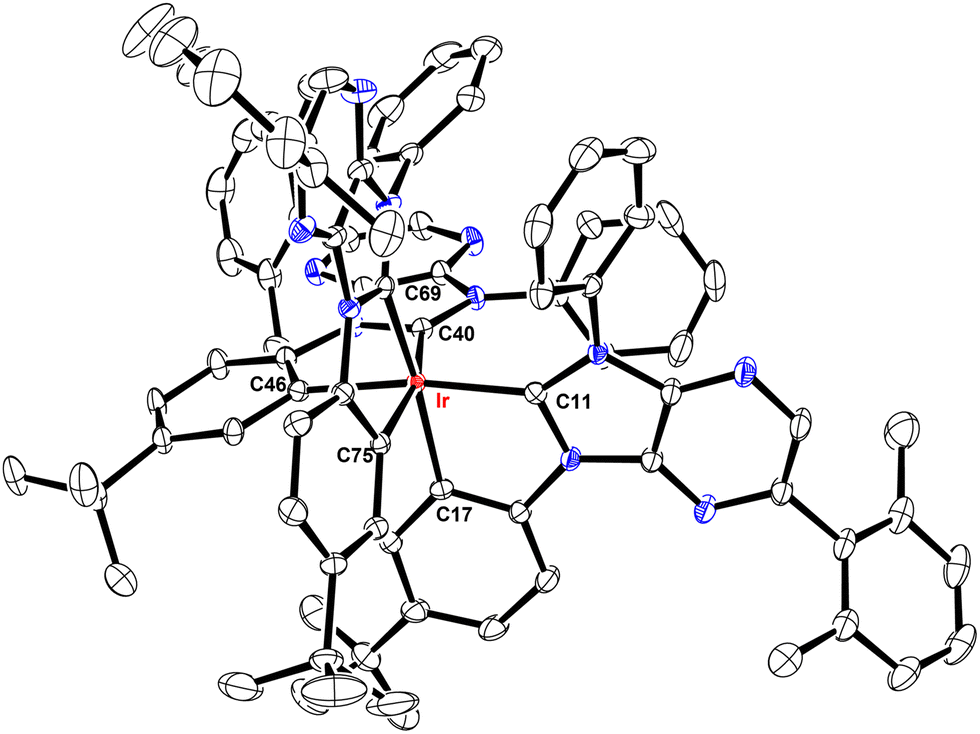 | ||
| Fig. 1 Structure of f-ct4a with thermal ellipsoids shown at the 30% probability level. Selected bond lengths (Å): Ir–C11 = 2.038(4), Ir–C40 = 2.031(4), Ir–C69 = 2.048(4), Ir–C17 = 2.093(4), Ir–C46 = 2.102(4), Ir–C75 = 2.095(4). Selected bond angles (°): C11–Ir–C46 = 168.38(14), C40–Ir–C75 = 166.48(15), C69–Ir1–C17 = 169.49(14), C11–Ir–C17 = 78.49(15), C40-Ir–C46 = 78.77(15), C69-Ir–C75 = 78.45(14). Hydrogen atoms were omitted for clarity. | ||
 | ||
| Fig. 2 Structure of f-ct4b with thermal ellipsoids shown at the 30% probability level. Selected bond lengths (Å): Ir–C11 = 2.026(5), Ir–C40 = 2.022(5), Ir–C69 = 2.018(5), Ir–C17 = 2.097(5), Ir–C46 = 2.094(5), Ir–C59 = 2.087(5). Selected bond angles (°): C11–Ir–C46 = 167.39(19), C40–Ir–C59 = 166.8(2), C69–Ir1–C17 = 172.0(2), C11–Ir–C17 = 78.38(19), C40–Ir–C46 = 78.2(2), C59–Ir–C69 = 78.5(2). Hydrogen atoms were omitted for clarity. | ||
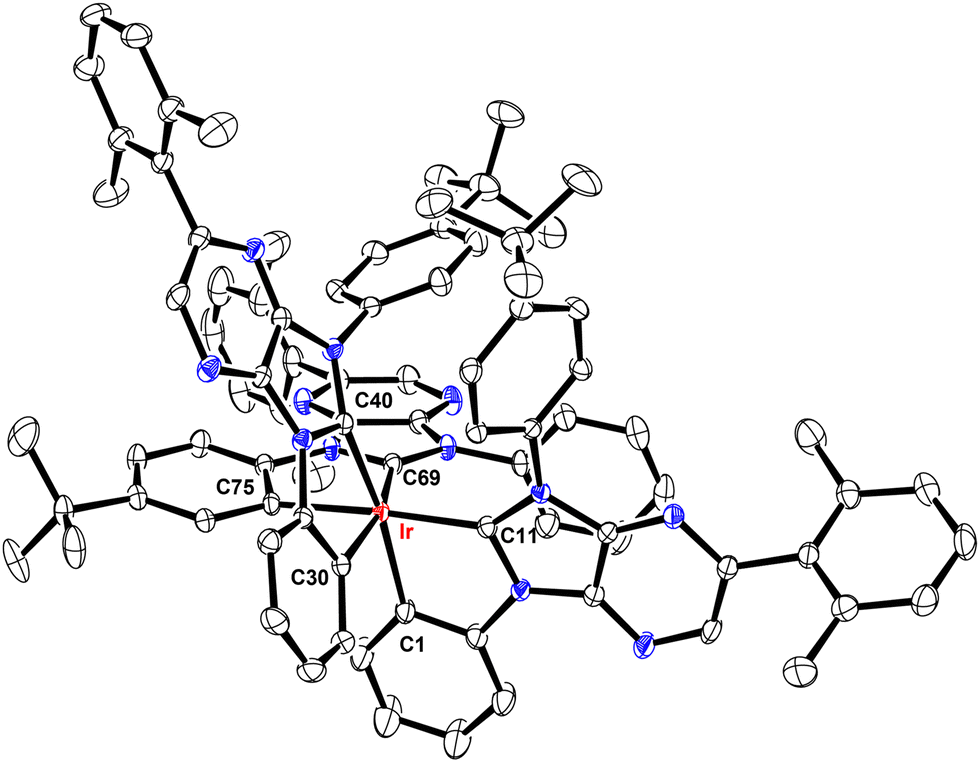 | ||
| Fig. 3 Structure of f-ct4c with thermal ellipsoids shown at the 30% probability level. Selected bond lengths (Å): Ir–C11 = 2.024(3), Ir–C40 = 2.021(4), Ir–C69 = 2.023(4), Ir–C1 = 2.084(4), Ir–C30 = 2.080(4), Ir–C75 = 2.110(3). Selected bond angles (°): C11–Ir–C75 = 175.89(14), C40–Ir–C1 = 170.68(14), C69–Ir1–C30 = 166.89(13), C1–Ir–C11 = 78.57(14), C30–Ir–C40 = 78.63(14), C69–Ir–C75 = 77.89(14). Hydrogen atoms were omitted for clarity. | ||
Photophysical characterization
As depicted in Fig. 4, the UV-Vis absorption and photoluminescent spectra of studied Ir(III) carbene complexes were recorded in toluene and degassed toluene solution, respectively. A strong absorption band with a peak wavelength at ∼400 nm was observed for all of them. These peaks also exhibited an absorption extinction coefficient of over 2.6 × 10⁴ M−1 cm−1 and with the peak onset extended beyond 440 nm, showing that the pattern is consistent with the facial coordinative arrangement.31 Next, the photoluminescence was recorded at RT, showing that their structureless profile is consistent with the dominant MLCT contribution. Notably, their emission peak position follows the descending order of 482 nm (f-ct4a) > 478 nm (f-ct4b) > 473 nm (f-ct4c), which agrees with the reduced number of p-t-butylphenyl cyclometalate units attached to the Ir(III) metal centre. Hence, this observation is due to the reduction of electron density at the Ir(III) metal center that, in turn, provided an enlarged optical energy gap for f-ct4c in reference to both f-ct4a and f-ct4b. Most importantly, all these Ir(III) complexes exhibited good PLQYs and relatively short radiative lifetimes between 1508 ns and 2813 ns under the measurement conditions. These photophysical properties, together with a total of three t-butyl substituents and three 2,6-dimethylphenyl groups residing around three carbene chelates, offered additional advantages such as higher rigidity and reduced intermolecular stacking interaction needed for achieving superior OLED performances.21a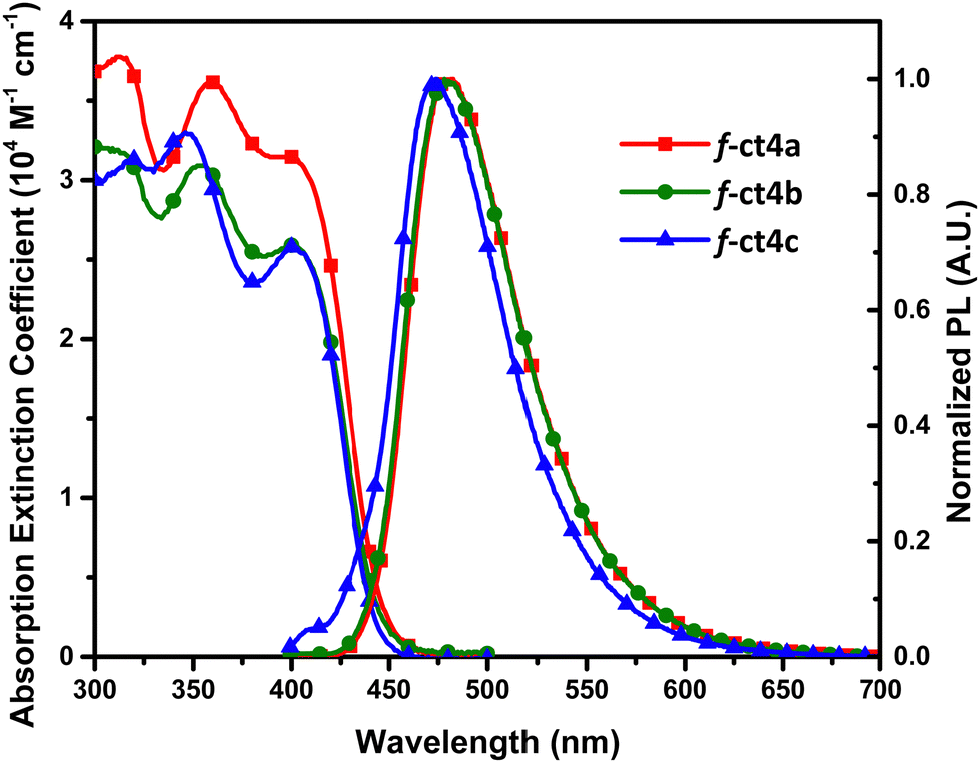 | ||
| Fig. 4 UV-Vis absorption and photoluminescence spectra of all studied tris-bidentate Ir(III) complexes in toluene at RT. | ||
Electrochemistry
The electrochemical data and corresponding HOMO energy levels of f-ct4a, f-ct4b and f-ct4c were investigated using cyclic voltammetry (CV). As depicted in Table S1 and Fig. S1 (ESI†), all complexes presented reversible oxidation and irreversible reduction waves. The oxidation potentials mainly occurred at the Ir(III) metal atom and underwent a progressive anodic shift from 0.57 V, to 0.60 V and then to 0.67 V vs. Fc+/Fc for f-ct4a, f-ct4b and f-ct4c, respectively. This result agrees with the reduction of the total number of p-t-butylphenyl cyclometalate(s) connected to the central Ir(III) metal atom. Therefore, f-ct4c is the Ir(III) complex with the most positive oxidation potential according to our delineation. Meanwhile, the optical energy gaps (2.80–2.94 eV) of these Ir(III) complexes were calculated using the emission onset obtained from solution photoluminescence, while their LUMO energy levels were subsequently calculated from the difference of HOMO and optical energy gap recorded.Thermal stability
Thermal gravimetric data were recorded and are given in Table S1 and Fig. S2 (ESI†), from which it can be observed that all complexes display excellent thermal stability, among which f-ct4c appeared to possess the highest decomposition temperature (Td) at 451 °C. Although f-ct4b exhibits a high Td of 399 °C, it cannot be purified by vacuum sublimation, as some degree of thermal decomposition occurred starting at ∼370 °C and 8.6 × 10⁻⁶ Torr. On the other hand, f-ct4a and f-ct4c presented much improved volatility during sublimation in comparison to that of f-ct4b. This result affirmed the positional effect of the peripheral groups of chelates on the stability and volatility. However, decomposition of f-ct4b disappeared during the fabrication of OLED devices. This could be due to the lowered system pressure in the deposition chamber, which eliminated the necessity in raising the temperature for achieving fast sublimation.Theoretical investigation
The lowest energy singlet (S1) and triplet (T1) excited states of f-ct4a, f-ct4b and f-ct4c were investigated using the time-dependent density functional theory (TD-DFT) method,32 with the aim of understanding the effect of chelate modification on their photophysical properties and making appropriate assignments. Computational details can be found in the Experimental section of the ESI.†The vertical excitation energies of the S0 → S1 transition were calculated to be 423, 428 and 428 nm for f-ct4a, f-ct4b and f-ct4c, respectively (Table 2), which are correlated with their experimental lowest-energy absorption tails around 400 nm (Fig. 4). The respective excitation energies for the S0 → T1 transition, which is usually used to represent the T1 → S0 emission at the equilibrium structure of S0, were 459, 457 and 459 nm for f-ct4a, f-ct4b and f-ct4c, respectively (Table 2), corresponding well to the experimental phosphorescence (PLλmax at 482, 478 and 473 nm; see Fig. 4 and Table 1). The MAD (mean absolute deviation) between the calculated vertical energies of the S0 → T1 transition and the experimental emission wavelengths is about 0.11 eV (2.5 kcal mol−1). Moreover, the calculated adiabatic emission energy (468, 464 and 469 nm, Table 3) is far better than the vertical values, and the MAD is as small as 0.06 eV (or 1.4 kcal mol−1).
| abs λmaxa (nm) | em λmax (nm) | FWHMb (nm) | PLQY (%)c | τ obs (ns) | τ rad (ns) | k r (105 s−1)e | k nr (105 s−1)e | |
|---|---|---|---|---|---|---|---|---|
| a Those were recorded at a conc. of 10−5 M in toluene at RT; extinction coefficient (ε) is given in parentheses with a unit of 104 M−1 cm−1. b Full width at half maximum. c Coumarin 102 (C102) in methanol (PLQY = 87% and λmax = 480 nm) was employed as the standard. d Observed lifetimes were obtained from transient PL measurement. e τ rad = τobs/PLQY, kr = PLQY/τobs and knr = (1 – PLQY)/τobs. | ||||||||
| f-ct4a | 312 (3.8), 360 (3.6), 399 (3.2) | 482 | 65 | 50 | 754 | 1508 | 6.6 | 6.6 |
| f-ct4b | 354 (3.1), 400 (2.6) | 478 | 65 | 66 | 1270 | 1924 | 5.2 | 2.7 |
| f-ct4c | 320 (3.1), 346 (3.3), 401 (2.6) | 473 | 63 | 68 | 1913 | 2813 | 3.5 | 1.7 |
Furthermore, natural transition orbital (NTOs)33 analyses were executed to express the S0 → T1 transition as a single pair of orbitals. The predominant NTO pairs found for the S0 → T1 transition are presented in Fig. 5. As can be seen, the occupied NTOs are delocalized over both the Ir(III) atom and carbene cyclometalates (in π orbitals); while the virtual NTOs are mainly localized over the carbene coordinative fragments (in π* orbitals). Although the NTO analysis is based on the dominant molecular orbital pairs, the contribution of the NTO pairs may not reveal the full properties of S0 → T1 excitation. For example, the calculated eigenvalues for S0 → T1 NTOs of f-ct4a is 0.747 (Fig. 5), implying that 74.7% of S0 → T1 excitation is contributed by the “HOMO → LUMO” transition. There is no obvious difference in the results obtained from NTO analysis from those (70.8%) obtained in the original TD-DFT calculation (Table 2).
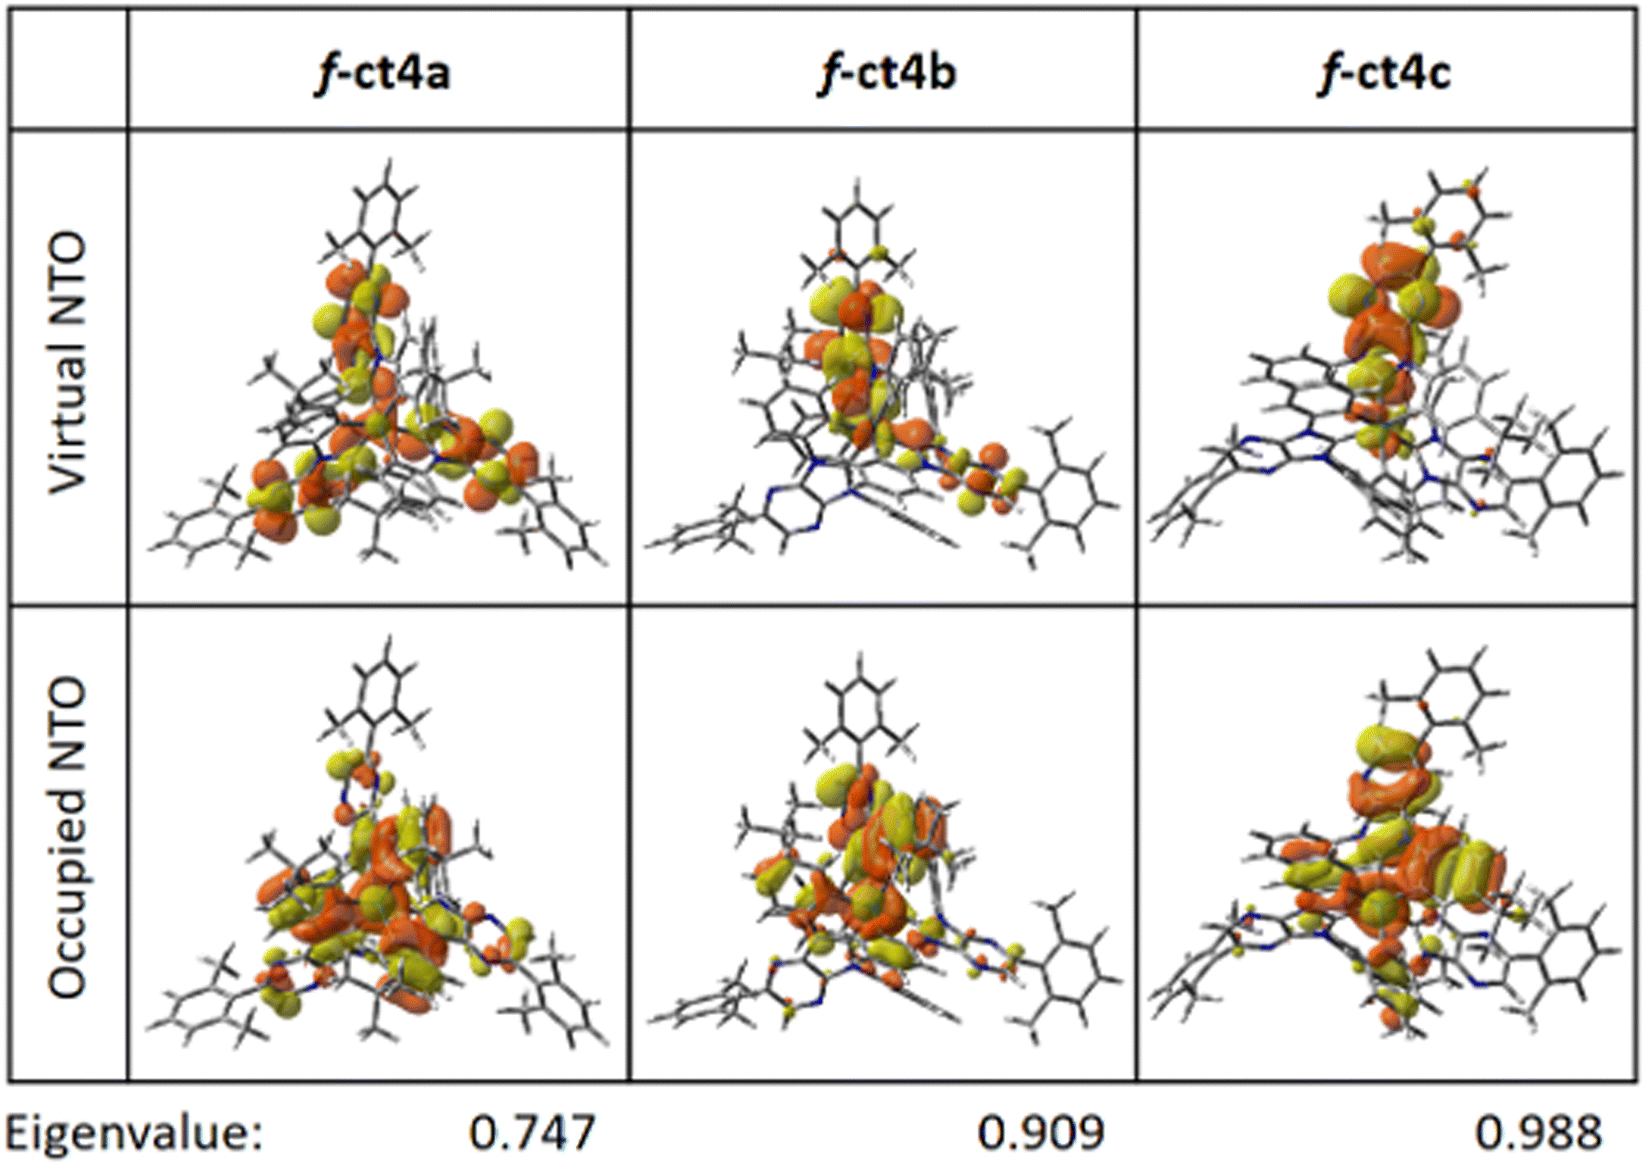 | ||
| Fig. 5 Natural transition orbital (NTO) pairs expressing the S0 →T1 excitation of the studied Ir(III) complexes at their geometrical optimized for the ground state, with the contribution of dominant molecular orbitals (MOs) to NTOs provided. | ||
| E HOMO (eV) | H–L gapa (eV) | Excitation | λ [nm eV−1] | f | MO contribution (>20%)b | Assignmentc | Sum contributiond (%) | |||||
|---|---|---|---|---|---|---|---|---|---|---|---|---|
| MLCT (%) | ILCT (%) | LC (%) | LMCT (%) | MC (%) | ||||||||
| a The EHOMO and H–L gap are computed at optimized S0 structures at the B3LYP-D3(BJ)/def2-SVP level with the polarizable continuum model (PCM) for modelling the toluene solvent. b The results were calculated by TD-DFT using the B3LYP functional with PCM for toluene (cf., the ESI). c The percentage of all characters of S0 → T1 excitation was calculated using the IFCT (Hirshfeld) method. d The sum contribution is: MLCT + ILCT + LC − LMCT. | ||||||||||||
| f-ct4a | −5.41 | 3.48 | S0 → T1 | 459/2.70 | 0 | HOMO → LUMO (70.8%) | 25.8 | 47.2 | 23.4 | 1.0 | 2.9 | 95.4 |
| S0 → S1 | 423/2.93 | 0.0782 | HOMO → LUMO (89.4%) | |||||||||
| f-ct4b | −5.45 | 3.48 | S0 → T1 | 457/2.71 | 0 | HOMO → LUMO (72.4%) | 27.2 | 32.7 | 35.9 | 1.2 | 2.9 | 94.6 |
| S0 → S1 | 428/2.90 | 0.0449 | HOMO → LUMO (89.4%) | |||||||||
| f-ct4c | −5.43 | 3.50 | S0 → T1 | 459/2.70 | 0 | HOMO → LUMO (76.2%) | 27.2 | 22.7 | 45.4 | 1.4 | 3.4 | 93.9 |
| S0 → S1 | 428/2.90 | 0.0780 | HOMO → LUMO (81.1%) | |||||||||
The inter-fragment charge transfer (IFCT) method, which is available from the Multiwfn software package,34 was also employed to quantify the contributions of relevant molecular orbitals (MOs) to the selected electronic transition. This manipulation is aimed to provide a better picture of the S0 → T1 excitation process, and the percentage of MLCT, ILCT, ligand-centered (LC), ligand-to-metal charge transfer (LMCT) and metal-centered (MC) contributions is depicted in Table 2. The variation of krvs. ligand rearrangement may be understood as: reducing the number of p-t-butylphenyl cyclometalate units attached to the metal centre (Ir) would slightly increase the MLCT characters from 25.8% (f-ct4a) to 27.2% (f-ct4b) and to 27.2% (f-ct4c), but greatly reduce the ILCT characters from 47.2% to 32.7% and to 22.7%, respectively. The higher percentage (47.2%) and effective ILCT contribution may be correlated with the 3-fold symmetry of the p-t-butylphenyl cyclometalate ligands in f-ct4a. With the increment in the LC characters (23.4% to 35.9% and to 45.4%, from f-ct4a to f-ct4b and f-ct4c), the IFCT method clearly suggests that the S0 → T1 excitation of all Ir(III) complexes involved mixed MLCT, ILCT and LC transitions. The combined contribution (Table 2) of “MLCT + ILCT + LC–LMCT” of 95.4%, 94.6% and 93.9% for f-ct4a, f-ct4b and f-ct4c correlates well with the measured kr values (in μs−1, Table 1) of 0.66 (f-ct4a), 0.52 (f-ct4b) and 0.35 (f-ct4c) obtained from solution.
Following the IFCT prediction, we performed theoretical calculations of the emission radiative lifetime (τrad) and rate (kr). If the phosphorescence is considered as a long-lived process, the triplet manifold of the studied complexes is expected to have sufficient time to relax into a lower-energy geometry. Thus, the emission energy calculated at the optimized structure (T1) should provide physical insight into the emission properties of Ir(III) complexes. However, it has been pointed out that, although some literature precedents using the optimized structure (T1) can give good prediction to the experimental τrad, other works of τrad using the ground state geometry (S0) also give a better correlation to the experimental data.35 As the “actual” emitting structure is an intermediate between the ground state (S0) and excited state (T1),36 we here apply the spin–orbit coupling (SOC)-TDDFT method to predict τrad and kr using both the optimized S0 and T1 geometries.
Table 3 depicts the calculated emission energies, together with τrad and kr using both the optimized S0 and T1 geometries. For all these complexes, calculations based on both the arithmetic average and Boltzmann average of the SOC substates gave similar results. Thus, only the arithmetic averages are discussed here. For the T1 → S0 emission of f-ct4a, the τrad is predicted to be 0.99 μs (at the S0 geometry) and 2.66 μs (at the T1 geometry). The deviations from experimental τrad (1.508 μs, Table 1) to the τrad obtained at the S0 and T1 geometries are recorded to be +0.51 and −1.15 μs, respectively. It appears that the true emitting intermediate of f-ct4a is closer to the S0. For the f-ct4b, the experimental τrad (1.924 μs) is closer to the calculated value of 1.84 μs (at the T1 geometry) than the value of 0.81 μs (at the S0 geometry), hinting that the true emitting intermediate of f-ct4b lies in the vicinity to the T1 geometry. For the f-ct4c, as there is no obvious difference between the calculated values of 2.79 μs (at the S0 geometry) and 3.25 μs (at the T1 geometry) and the experimental τrad data (2.813 μs), thus the emitting intermediate of f-ct4c is predicted to resemble both the S0 and T1 geometries. It is worth noting here, the uncertainty (∼1.7 μs) of τrad for other Ir(III) complexes predicted with the SOC-TDDFT method is relatively large.37 From the above analysis, it is suggested that the phosphorescence process of f-ct4a with a relatively short τrad happened near the S0 structure, while f-ct4b and f-ct4c with much longer lifetimes may emit near the T1 structure.
| Emission (T1 → S0) | λ [nm eV−1] | λ [nm eV−1] | τ rad (μs) | k r (μs−1) |
|---|---|---|---|---|
| a The adiabatic emission energy obtained from the difference between the optimized structures of T1 and S0 states using the B3LYP functional with the polarizable continuum model (PCM) in toluene for modelling (cf., the ESI). b The vertical emission energy between T1 and S0 states using the SOC-TDDFT method in ORCA at optimized structures of S0 (in normal font) and T1 (in italic and bold font in parentheses). c The τrad and kr are calculated by the arithmetic average/Boltzmann average (at 298 K) of the three SOC substates of T1, at optimized structures of S0 (in normal font) and T1 (in italic and bold font in parentheses). | ||||
| f-ct4a | 468/2.65 | 466/2.66 (540/2.29) | 0.99/1.01 (2.66/2.96) | 1.02/0.99 (0.38/0.34) |
| f-ct4b | 464/2.67 | 464/2.67 (562/2.21) | 0.81/0.92 (1.84/2.10) | 1.23/1.09 (0.54/0.48) |
| f-ct4c | 469/2.64 | 465/2.66 (556/2.23) | 2.79/3.24 (3.25/3.57) | 0.36/0.31 (0.31/0.28) |
Electroluminescence
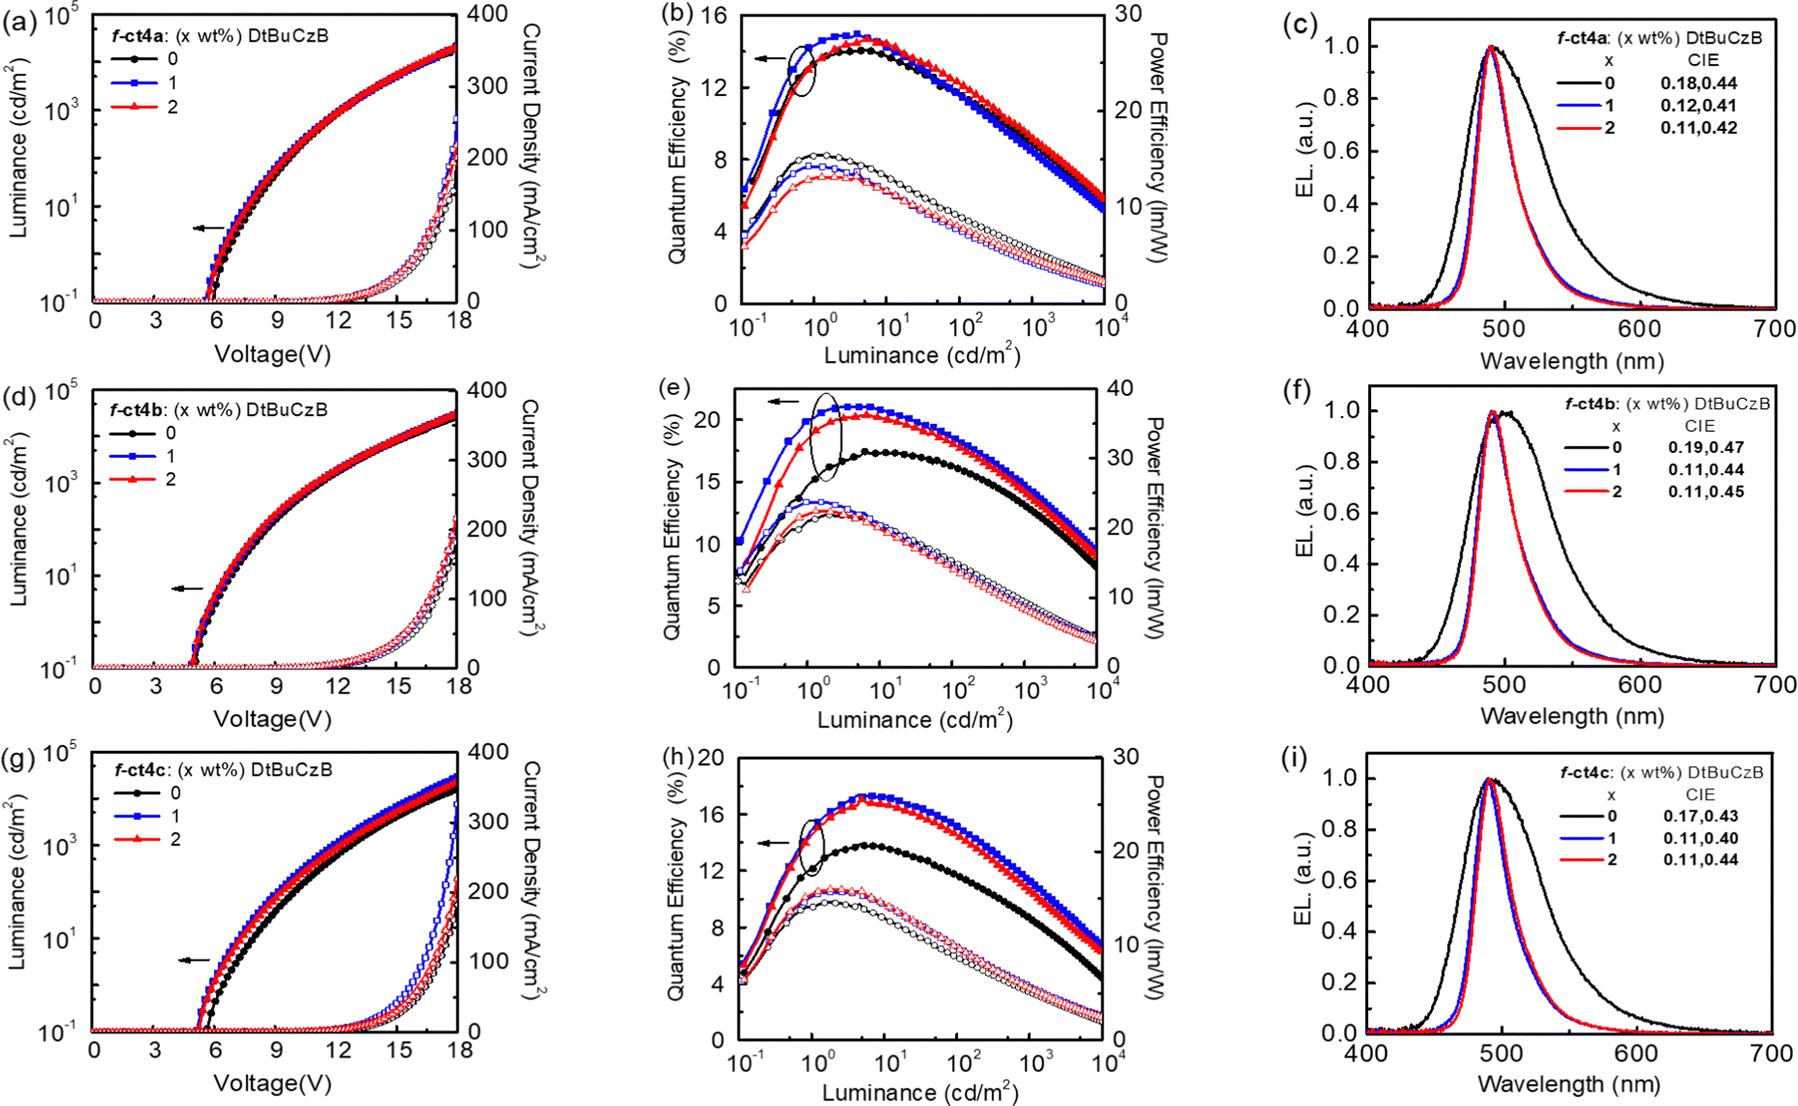
According to their photophysical data, Ir(III) metal phosphors f-ct4a, f-ct4b and f-ct4c show very promising emission properties and, hence, they are selected for the fabrication of OLED devices. These PhOLED devices were constructed using the following configuration: indium tin oxide (ITO)/4 wt% ReO3:mCP (60 nm)/mCP (15 nm)/PPT:20 wt% f-ct4a, f-ct4b, or f-ct4c (20 nm)/PPT/BPhen (40 nm)/Liq (0.5 nm)/Al (100 nm). In this configuration, ITO served as the anode, while Al acted as the cathode. To facilitate the hole and electron injection layer, 4 wt% rhenium oxide (ReO3) doped in N,N-dicarbazolyl-3,5-benzene (mCP) and 8-hydroxyquinolinolatolithium (Liq) were employed as the hole-injecting and electron-injecting materials, respectively. Additionally, mCP and 4,7-diphenyl-1,10-phenanthroline (BPhen) were employed as the hole- and electron-transporting layers, respectively. The 2,8-bis(diphenylphosphoryl)dibenzo[b,d]thiophene (PPT) exhibited a higher triplet energy (ET = 2.9 eV) in reference to that of Ir(III) phosphors or relevant blue emissive TADF emitters. Hence, PPT was employed as both the host and hole-blocking layer,38 which is expected to facilitate the effective confinement of triplet excitons within the emissive layer (EML) (Fig. S3, ESI†).The performance characteristics of these OLED devices are presented in Fig. 6 and Table 4. Notably, the f-ct4b-based device exhibited the most favorable performance among all examined OLED devices, achieving a luminance (L) of 25982 cd m−2 at 18 V (182 mA cm−2), with a peak emission at 498 nm and CIE coordinates of (0.19, 0.47). Additionally, this device demonstrated a maximum external quantum efficiency (EQEmax), current efficiency (CEmax), and power efficiency (PEmax) of 17.4%, 45.0 cd A−1, and 21.9 lm W−1, respectively. In comparison, devices containing 20 wt% of f-ct4a and f-ct4c in PPT displayed lower maximum efficiencies (EQEmax of 14.7% and 14.1%, respectively). The host-dopant energy transfer was further investigated through steady-state and transient photoluminescence (PL) measurements of PPT films doped with 20 wt% of f-ct4a, f-ct4b, and f-ct4c (Fig. S4, ESI†). Moreover, the device performances seem to follow the trend of both the emission lifetimes (τ) and PLQY (ΦPL) of emitters dispersed in the host material, i.e. the higher the device performances, the higher the PLQY and the shorter the observed lifetime τ. The PLQY values of 76%, 81% and 71% as well as the exponential lifetimes τ of 2.20 μs, 2.02 μs and 2.97 μs were recorded for the associated doped thin films, respectively, which is consistent with the overall performances of PhOLED devices.
 | ||
| Fig. 6 Performances of OLED devices fabricated using f-ct4a, f-ct4b and f-ct4c as both the dopant and sensitizer. (a), (d) and (g) J–V–L characteristics. (b), (e) and (h) EQE and PE as a function of luminance. (c), (f) and (i) EL spectra of the respective devices. | ||
| DtBuCzB [wt%] | V on [V] | L/J at 18 Vb [cd m−2/mA cm−2] | EQE/CE/PE at max. [%/cd A−1/lm W−1] | EQE/CE/PE at 103 cd m−2 [%/cd A−1/lm W−1/V] | λ max [nm] | FWHM [nm] | CIE [x,y] | |
|---|---|---|---|---|---|---|---|---|
| a Turn-on voltage at 0.1 cd m−2. b Luminance with the driving current density recorded at 18 V. c λEL: EL emission peak maximum. | ||||||||
| f-ct4a | 0 | 5.9 | 20340/202 |
14.7/35.6/15.4 | 9.0/21.6/5.5/12.3 | 490 | 66 | 0.18,0.44 |
| 1 | 5.6 | 22028/256 |
15.3/30.5/14/3 | 8.5/16.9/4.4/12.2 | 489 | 32 | 0.12,0.41 | |
| 2 | 5.6 | 20605/219 |
15.0/29.9/13.2 | 9.2/18.4/4.7/12.2 | 489 | 31 | 0.11,0.42 | |
| f-ct4b | 0 | 5.0 | 25982/182 |
17.4/45.0/21.9 | 13.1/33.9/9.43/11.3 | 498 | 71 | 0.19,0.47 |
| 1 | 5.0 | 30674/216 |
21.5/45.1/23.7 | 14.7/30.8/8.73/11.1 | 490 | 31 | 0.11,0.44 | |
| 2 | 5.0 | 30153/217 |
20.8/43.4/22.4 | 14.2/29.8/8.51/11.0 | 490 | 31 | 0.11,0.44 | |
| f-ct4c | 0 | 5.7 | 15728/182 |
14.1/34.0/14.6 | 8.7/21.0/5.2/12.7 | 489 | 69 | 0.17,0.43 |
| 1 | 5.3 | 28793/326 |
17.5/33.7/15.8 | 11.3/21.8/5.8/11.9 | 489 | 30 | 0.11,0.40 | |
| 2 | 5.3 | 22486/220 |
17.0/34.6/16.0 | 10.6/21.7/5.6/12.2 | 490 | 30 | 0.11,0.44 | |
Furthermore, Förster Resonance Energy Transfer (FRET) was known to be one practical method in enhancing the performances of phosphorescent OLED devices.39 Encouraged by the recent successes in the fabrication of highly efficient hyper-OLED devices,40 we employed these newly developed Ir(III) based carbene emitters as phosphorescent sensitizers to further explore their potential for such application. As expected, adequate device efficiencies were expected if there existed fast FRET from sensitizers to the terminal emitters. Particularly, MR-TADF terminal emitters are the preferred choice for giving narrowband blue emission.41 With this in mind, we examined hyper-OLEDs by incorporating f-ct4a, f-ct4b, and f-ct4c as sensitizers along with 1–2 wt% of DtBuCzB42 as a blue terminal emitter (Fig. 6 and Table 4). When 1 wt% of DtBuCzB was doped into the device with f-ct4b as the sensitizer, its performance improved significantly, resulting in the best EQEmax of 21.5%, CEmax of 45.1 cd A−1 and PEmax of 23.7 lm W−1, accompanied by a narrowband electroluminescence (EL) profile (CIE = 0.11, 0.44), which is identical to the typical emission profile exhibited by DtBuCzB. However, when the doping concentration was increased to 2 wt%, the EQEmax was found to slightly decrease to 20.8%, which could be attributed to the unwanted Dexter energy transfer and concentration quenching. In contrast, the other hyper-OLED devices utilizing f-ct4a and f-ct4c as sensitizers, in combination with 1 wt% DtBuCzB, exhibited lower EQEmax of 15.3% and 17.5%, respectively.
Hence, our current findings underscore the crucial role of Ir(III) carbene phosphors in controlling the performance of both phosphorescent OLED and hyper-OLED devices. This is particularly important as all studied Ir(III) emitters possess identical core structures, except for the relative disposition of peripheral substituents on surrounding chelates. The optimization of device configurations and the selection of appropriate sensitizer-dopant combinations are pivotal in achieving high-efficiency OLEDs with desirable emission properties. These insights contribute to the ongoing efforts in advancing OLED technology and pave the way for the development of future display and lighting applications.
Conclusion
In this study, a family of three Ir(III) based tris-bidentate carbene cyclometalates were systemically investigated, in which sky-blue emissions with good PLQYs of 50–68% were recorded in degassed toluene. Upon immobilization in the PPT host, both the rotational and vibrational quenching of f-ct1a–c were suppressed, whose PLQYs were effectively ameliorated to 71–87%, affirming the structural design by incorporation of a 2,6-dimethylphenyl substituted 1H-imidazo[4,5-b]pyrazin-2-ylidene entity. Interestingly, in comparison to the general properties of Ir(III) complexes bearing parent 6-(t-butyl)-1H-imidazo[4,5-b]pyrazin-2-ylidene20 and 6-(trifluoromethyl)-2H-imidazo[4,5-b]pyridin-2-ylidene entities,43 we noted (i) a reduction in volatility, (ii) an improvement in thermal stability, (iii) a red shifting in emission peak wavelength in reference to the parent emitters f-ct1a–d, and (iv) an increase in the radiative lifetime for f-ct1a–c as measured in both solution and doped thin film states. These changes are all associated with the inherent properties of the dimethylphenyl substituent; namely, possession of a higher molecular weight, greater steric encumbrance, higher proportion of ligand-centered ππ* transition characteristics at the excited states, and an intermediate electronic effect in comparison to that of t-butyl and CF3 substituents, respectively.Additionally, among three OLED devices bearing distinctive phosphors, f-ct4b based Ph OLED devices exhibited CIEx,y coordinates of 0.19,0.47, an EQEmax of 17.4% and a high luminance of 25982 cd m−2 at 18 V. It served as the champion of these emitters. Moreover, the corresponding hyper-OLED device with f-ct4b as the sensitizer and DtBuCzB as the terminal emitter exhibited narrowband blue emission with CIEx,y coordinates of 0.11,0.44, an EQEmax up to 21.5%, and an impressive luminance of 30674 cd m−2 at 18 V. These results showed the high capability of bulky peripheral substituents around carbene cyclometalates (both t-butyl and 2,6-dimethylphenyl) in the improvement of the final characteristics of OLED devices, which sheds light on the future designs of efficient blue phosphors and respective OLED devices.
Conflicts of interest
There are no conflicts to declare.Acknowledgements
Funding and research grants of this work are provided by the University Grants Council (CityU 11304221 and CityU 11312722) of Hong Kong and the National Science and Technology Council of Taiwan (NSTC 112-2112-M-019-002). The computational studies were carried out using the High-Performance Computing facility, CityU Burgundy at City University of Hong Kong.References
- (a) A. F. Rausch, H. H. H. Homeier and H. Yersin, Top. Organomet. Chem., 2010, 29, 193 CrossRef CAS; (b) G. Baryshnikov, B. Minaev and H. Ågren, Chem. Rev., 2017, 117, 6500–6537 CrossRef CAS PubMed.
- (a) M. Y. Wong and E. Zysman-Colman, Adv. Mater., 2017, 29, 1605444 CrossRef PubMed; (b) X. Cai and S.-J. Su, Adv. Funct. Mater., 2018, 28, 1802558 CrossRef; (c) T. J. Penfold, F. Dias and A. P. Monkman, Chem. Commun., 2018, 54, 3926–3935 RSC.
- (a) H. Yersin, A. F. Rausch, R. Czerwieniec, T. Hofbeck and T. Fischer, Coord. Chem. Rev., 2011, 255, 2622–2652 CrossRef CAS; (b) Z. Xu, B. Z. Tang, Y. Wang and D. Ma, J. Mater. Chem. C, 2020, 8, 2614–2642 RSC.
- (a) K. S. Yook and J. Y. Lee, Adv. Mater., 2012, 24, 3169–3190 CrossRef CAS PubMed; (b) T.-Y. Li, J. Wu, Z.-G. Wu, Y.-X. Zheng, J.-L. Zuo and Y. Pan, Coord. Chem. Rev., 2018, 374, 55–92 CrossRef CAS; (c) J.-H. Lee, C.-H. Chen, P.-H. Lee, H.-Y. Lin, M.-K. Leung, T.-L. Chiu and C.-F. Lin, J. Mater. Chem. C, 2019, 7, 5874–5888 RSC; (d) S. Lee and W.-S. Han, Inorg. Chem. Front., 2020, 7, 2396–2422 RSC.
- (a) C. Murawski, K. Leo and M. C. Gather, Adv. Mater., 2013, 25, 6801–6827 CrossRef CAS PubMed; (b) Y. Im, S. Y. Byun, J. H. Kim, D. R. Lee, C. S. Oh, K. S. Yook and J. Y. Lee, Adv. Funct. Mater., 2017, 27, 1603007 CrossRef; (c) W. Song and J. Y. Lee, Adv. Opt. Mater., 2017, 5, 1600901 CrossRef.
- (a) J. Lee, C. Jeong, T. Batagoda, C. Coburn, M. E. Thompson and S. R. Forrest, Nat. Commun., 2017, 8, 15566 CrossRef CAS PubMed; (b) D. Jacquemin and D. Escudero, Chem. Sci., 2017, 8, 7844–7850 RSC.
- (a) Q. Wei, N. Fei, A. Islam, T. Lei, L. Hong, R. Peng, X. Fan, L. Chen, P. Gao and Z. Ge, Adv. Opt. Mater., 2018, 6, 1800512 CrossRef; (b) G. U. Mahoro, J. Fernandez-Cestau, J.-L. Renaud, P. B. Coto, R. D. Costa and S. Gaillard, Adv. Opt. Mater., 2020, 8, 2000260 CrossRef CAS; (c) G. Hong, X. Gan, C. Leonhardt, Z. Zhang, J. Seibert, J. M. Busch and S. Bräse, Adv. Mater., 2021, 33, 2005630 CrossRef CAS PubMed.
- (a) Y. Chi and P.-T. Chou, Chem. Soc. Rev., 2010, 39, 638–655 RSC; (b) H. Fu, Y.-M. Cheng, P.-T. Chou and Y. Chi, Mater. Today, 2011, 14, 472–479 CrossRef CAS; (c) Y. Chi, T.-K. Chang, P. Ganesan and P. Rajakannu, Coord. Chem. Rev., 2017, 346, 91–100 CrossRef CAS; (d) Y. Chi, S. F. Wang and P. Ganesan, Chem. Rec., 2019, 19, 1644–1666 CrossRef CAS PubMed.
- (a) R. Visbal and M. C. Gimeno, Chem. Soc. Rev., 2014, 43, 3551–3574 RSC; (b) A. Bonfiglio and M. Mauro, Eur. J. Inorg. Chem., 2020, 3427–3442 CrossRef CAS; (c) H. Amouri, Chem. Rev., 2023, 123, 230–270 CrossRef CAS PubMed; (d) G. Ni, J. Yan, Y. Wu, F. Zhou, P.-T. Chou and Y. Chi, Inorg. Chem. Front., 2023, 10, 1395–1401 RSC.
- E. D. Baranoff and B. Curchod, Dalton Trans., 2015, 44, 8318–8329 RSC.
- (a) P. B. Hitchcock, M. F. Lappert and P. Terreros, J. Organomet. Chem., 1982, 239, C26 CrossRef CAS; (b) J.-H. Kim, S.-Y. Kim, S. Choi, H.-J. Son and S. O. Kang, Inorg. Chem., 2021, 60, 246–262 CrossRef CAS PubMed.
- (a) R. J. Holmes, S. R. Forrest, T. Sajoto, A. Tamayo, P. I. Djurovich, M. E. Thompson, J. Brooks, Y.-J. Tung, B. W. D'Andrade, M. S. Weaver, R. C. Kwong and J. J. Brown, Appl. Phys. Lett., 2005, 87, 243507 CrossRef; (b) T. Sajoto, P. I. Djurovich, A. B. Tamayo, J. Oxgaard, W. A. Goddard and M. E. Thompson, J. Am. Chem. Soc., 2009, 131, 9813–9822 CrossRef CAS PubMed.
- R. Kumaresan, H.-Y. Park, A. Maheshwaran, H. Park, Y. Do, M. Song, J. Yoon, S. I. Ahn and S.-H. Jin, Adv. Opt. Mater., 2022, 10, 2101686 CrossRef CAS.
- J. Lee, H.-F. Chen, T. Batagoda, C. Coburn, P. I. Djurovich, M. E. Thompson and S. R. Forrest, Nat. Mater., 2016, 15, 92–98 CrossRef CAS PubMed.
- M. Idris, S. C. Kapper, A. C. Tadle, T. Batagoda, D. S. M. Ravinson, O. Abimbola, P. I. Djurovich, J. Kim, C. Coburn, S. R. Forrest and M. E. Thompson, Adv. Opt. Mater., 2021, 9, 2001994 CrossRef CAS.
- J. Jin, Z. Zhu, J. Yan, X. Zhou, C. Cao, P.-T. Chou, Y.-X. Zhang, Z. Zheng, C.-S. Lee and Y. Chi, Adv. Photon. Res., 2022, 3, 2100381 CrossRef CAS.
- (a) P. Heimel, A. Mondal, F. May, W. Kowalsky, C. Lennartz, D. Andrienko and R. Lovrincic, Nat. Commun., 2018, 9, 4990 CrossRef PubMed; (b) B. Sim, J. S. Kim, H. Bae, S. Nam, E. Kwon, J. W. Kim, H.-Y. Cho, S. Kim and J.-J. Kim, Phys. Rev. Appl., 2020, 14, 024002 CrossRef CAS.
- S. Kim, H. J. Bae, S. Park, W. Kim, J. Kim, J. S. Kim, Y. Jung, S. Sul, S.-G. Ihn, C. Noh, S. Kim and Y. You, Nat. Commun., 2018, 9, 1211 CrossRef PubMed.
- A. Maheshwaran, V. G. Sree, H.-Y. Park, H. Kim, S. H. Han, J. Y. Lee and S.-H. Jin, Adv. Funct. Mater., 2018, 28, 1802945 CrossRef.
- J. Yan, D.-Y. Zhou, L.-S. Liao, M. Kuhn, X. Zhou, S.-M. Yiu and Y. Chi, Nat. Commun., 2024 Search PubMed , submitted.
- (a) V. N. Kozhevnikov, Y. Zheng, M. Clough, H. A. Al-Attar, G. C. Griffiths, K. Abdullah, S. Raisys, V. Jankus, M. R. Bryce and A. P. Monkman, Chem. Mater., 2013, 25, 2352–2358 CrossRef CAS; (b) L.-M. Huang, G.-M. Tu, Y. Chi, W.-Y. Hung, Y.-C. Song, M.-R. Tseng, P.-T. Chou, G.-H. Lee, K.-T. Wong, S.-H. Cheng and W.-S. Tsai, J. Mater. Chem. C, 2013, 1, 7582–7592 RSC; (c) K. Udagawa, H. Sasabe, C. Cai and J. Kido, Adv. Mater., 2014, 26, 5062–5066 CrossRef CAS PubMed; (d) K. P. Klubek, S.-C. Dong, L.-S. Liao, C. W. Tang and L. J. Rothberg, Org. Electron., 2014, 15, 3127–3136 CrossRef CAS; (e) J. Zhuang, W. Li, W. Wu, M. Song, W. Su, M. Zhou and Z. Cui, New J. Chem., 2015, 39, 246–253 RSC; (f) Y. Kwon, S. H. Han, S. Yu, J. Y. Lee and K. M. Lee, J. Mater. Chem. C, 2018, 6, 4565–4572 RSC; (g) W.-C. Chen, C. Sukpattanacharoen, W.-H. Chan, C.-C. Huang, H.-F. Hsu, D. Shen, W.-Y. Hung, N. Kungwan, D. Escudero, C.-S. Lee and Y. Chi, Adv. Funct. Mater., 2020, 30, 2002494 CrossRef CAS; (h) H. Benjamin, Y. Zheng, V. N. Kozhevnikov, J. S. Siddle, L. J. O'Driscoll, M. A. Fox, A. S. Batsanov, G. C. Griffiths, F. B. Dias, A. P. Monkman and M. R. Bryce, Dalton Trans., 2020, 49, 2190–2208 RSC; (i) C. H. Ryu, J. Lim, M. B. Kim, J. H. Lee, H. Hwang, J. Y. Lee and K. M. Lee, Adv. Opt. Mater., 2021, 9, 2001957 CrossRef CAS.
- E. Lizano, J. Grima and M. D. Pujol, Synlett, 2019, 2000–2003 CAS.
- J. Yan, Q. Xue, H. Yang, S.-M. Yiu, Y.-X. Zhang, G. Xie and Y. Chi, Inorg. Chem., 2022, 61, 8797–8805 CrossRef CAS PubMed.
- R. M. Roberts and P. J. Vogt, Org. Synth., 1955, 35, 65–66 CrossRef CAS.
- (a) E. B. Knott and R. A. Jeffreys, J. Org. Chem., 1949, 14, 879–885 CrossRef CAS; (b) A. Binobaid, M. Iglesias, D. J. Beetstra, B. Kariuki, A. Dervisi, I. A. Fallis and K. J. Cavell, Dalton Trans., 2009, 7099–7112 RSC.
- K. Hirano, A. T. Biju and F. Glorius, J. Org. Chem., 2009, 74, 9570–9572 CrossRef CAS PubMed.
- T. Lv, Z. Wang, J. You, J. Lan and G. Gao, J. Org. Chem., 2013, 78, 5723–5730 CrossRef CAS PubMed.
- J.-Y. Hung, C.-H. Lin, Y. Chi, M.-W. Chung, Y.-J. Chen, G.-H. Lee, P.-T. Chou, C.-C. Chen and C.-C. Wu, J. Mater. Chem., 2010, 20, 7682–7693 RSC.
- N. Tamosiunaite, L. C. Logie, S. E. Neale, K. Singh, D. L. Davies and S. A. Macgregor, J. Org. Chem., 2022, 87, 1445–1456 CrossRef CAS PubMed.
- A. Y. Gitlina, F. Fadaei-Tirani and K. Severin, Dalton Trans., 2023, 52, 2833–2837 RSC.
- C. You, X.-Q. Wang, X. Zhou, Y. Yuan, L.-S. Liao, Y.-C. Liao, P.-T. Chou and Y. Chi, ACS Appl. Mater. Interfaces, 2021, 13, 59023–59034 CrossRef CAS PubMed.
- (a) C. Adamo and D. Jacquemin, Chem. Soc. Rev., 2013, 42, 845–856 RSC; (b) A. D. Laurent, C. Adamo and D. Jacquemin, Phys. Chem. Chem. Phys., 2014, 16, 14334–14356 RSC.
- R. L. Martin, J. Chem. Phys., 2003, 118, 4775–4777 CrossRef CAS.
- T. Lu and F. Chen, J. Comput. Chem., 2012, 33, 580–592 CrossRef CAS PubMed.
- (a) J. M. Younker and K. D. Dobbs, J. Phys. Chem. C, 2013, 117, 25714–25723 CrossRef CAS; (b) P. Pander, A. V. Zaytsev, A. Sil, J. A. G. Williams, P.-H. Lanoe, V. N. Kozhevnikov and F. B. Dias, J. Mater. Chem. C, 2021, 9, 10276–10287 RSC; (c) P. Pander, L. Gomes Franca, F. B. Dias and V. N. Kozhevnikov, Inorg. Chem., 2023, 62, 5772–5779 CrossRef CAS PubMed.
- (a) E. Jansson, P. Norman, B. Minaev and H. Ågren, J. Chem. Phys., 2006, 124, 114106 CrossRef PubMed; (b) E. Jansson, B. Minaev, S. Schrader and H. Ågren, Chem. Phys., 2007, 333, 157–167 CrossRef CAS.
- K. Mori, T. P. M. Goumans, E. van Lenthe and F. Wang, Phys. Chem. Chem. Phys., 2014, 16, 14523–14530 RSC.
- (a) S. H. Jeong and J. Y. Lee, J. Mater. Chem., 2011, 21, 14604–14609 RSC; (b) W. Li, Z. Li, C. Si, M. Y. Wong, K. Jinnai, A. K. Gupta, R. Kabe, C. Adachi, W. Huang, E. Zysman-Colman and I. D. W. Samuel, Adv. Mater., 2020, 32, 2003911 CrossRef CAS PubMed; (c) Z.-L. Zhu, P. Gnanasekaran, J. Yan, Z. Zheng, C.-S. Lee, Y. Chi and X. Zhou, Inorg. Chem., 2022, 61, 8898–8908 CrossRef CAS PubMed; (d) X.-Y. Meng, Z.-Q. Feng, Y.-J. Yu, L.-S. Liao and Z.-Q. Jiang, Molecules, 2022, 27, 4048 CrossRef CAS PubMed.
- M. A. Baldo, M. E. Thompson and S. R. Forrest, Nature, 2000, 403, 750–753 CrossRef CAS PubMed.
- (a) T. Wang, X. Yin, X. Cao and C. Yang, Angew. Chem., Int. Ed., 2023, 62, e202301988 CrossRef CAS PubMed; (b) E. Ravindran, H. E. Baek, H. W. Son, J. H. Park, Y.-H. Kim and M. C. Suh, Adv. Funct. Mater., 2023, 2213461 CrossRef; (c) F. Huang, X.-C. Fan, Y.-C. Cheng, Y. Xie, S. Luo, T. Zhang, H. Wu, X. Xiong, J. Yu, D.-D. Zhang, X.-K. Chen, K. Wang and X.-H. Zhang, Adv. Opt. Mater., 2023, 11, 2202950 CrossRef CAS; (d) X. Wang, L. Wang, G. Meng, X. Zeng, D. Zhang and L. Duan, Sci. Adv., 2023, 9, eadh1434 CrossRef CAS PubMed.
- (a) E. Kim, J. Park, M. Jun, H. Shin, J. Baek, T. Kim, S. Kim, J. Lee, H. Ahn, J. Sun, S.-B. Ko, S.-H. Hwang, J. Y. Lee, C. Chu and S. Kim, Sci. Adv., 2022, 8, eabq1641 CrossRef CAS PubMed; (b) K.-W. Lo, G. S. M. Tong, G. Cheng, K.-H. Low and C.-M. Che, Angew. Chem., Int. Ed., 2022, 61, e202115515 CrossRef CAS PubMed; (c) J. Yan, S. F. Wang, C.-H. Hsu, E. H.-C. Shi, C.-C. Wu, P.-T. Chou, S.-M. Yiu, Y. Chi, C. You, I. C. Peng and W.-Y. Hung, ACS Appl. Mater. Interfaces, 2023, 15, 21333–21343 CrossRef CAS PubMed.
- Y. Xu, Z. Cheng, Z. Li, B. Liang, J. Wang, J. Wei, Z. Zhang and Y. Wang, Adv. Opt. Mater., 2020, 8, 1902142 CrossRef CAS.
- J. Yan, Z.-Q. Feng, Y. Wu, D.-Y. Zhou, S.-M. Yiu, C.-Y. Chan, Y. Pan, K. C. Lau, L.-S. Liao and Y. Chi, Adv. Mater., 2024, 36, 2305273 Search PubMed.
Footnotes |
| † Electronic supplementary information (ESI) available: General synthetic procedures of chelates and Ir(III) complexes, structural data for single crystal X-ray diffraction study, original electrochemical data, detailed results of TD-DFT and OLED investigations, and performance characteristics of OLED devices, and original 1H NMR spectra of the studied Ir(III) emitters. CCDC 2247086, 2247203 and 2247210. For ESI and crystallographic data in CIF or other electronic format see DOI: https://doi.org/10.1039/d3tc02398b |
| ‡ J. Y., Y. W., I. P. and Y. P. contributed equally to this work. |
| This journal is © The Royal Society of Chemistry 2023 |