 Open Access Article
Creative Commons Attribution 3.0 Unported Licence
The influence of nitrogen doping of the acceptor in orange-red thermally activated delayed fluorescence emitters and OLEDs†‡
Changfeng
Si§
 a,
Ya-Nan
Hu§
 b,
Dianming
Sun
 a,
Kai
Wang
 b,
Xiao-Hong
Zhang
 *bc and
Eli
Zysman-Colman
 *a
*a
aOrganic Semiconductor Centre, EaStCHEM School of Chemistry, University of St Andrews, St Andrews KY16 9ST, UK. E-mail: eli.zysman-colman@st-andrews.ac.uk
bInstitute of Functional Nano & Soft Materials (FUNSOM), Joint International Research Laboratory of Carbon-Based Functional Materials and Devices, Soochow University, Suzhou, Jiangsu 215123, P. R. China. E-mail: xiaohong_zhang@suda.edu.cn
cJiangsu Key Laboratory of Advanced Negative Carbon Technologies, Soochow University, Suzhou, 215123, Jiangsu, P. R. China
First published on 18th August 2023
Abstract
Nitrogen-containing polycyclic aromatic hydrocarbons (N-PAH) have been widely used as deep lowest unoccupied molecular orbital (LUMO) acceptors in donor–acceptor (D–A) red thermally activated delayed fluorescence (TADF) emitters and in organic light-emitting diodes (OLEDs). However, most of the studies have focused disparately on donor/acceptor combinations to yield efficient emitters, while a methodological study investigating the influence of nitrogen (N) doping ratios on the ground and excited states of PAH acceptors is rare. Here, we report a family of four different N-PAH acceptors containing different numbers of nitrogen atoms within the N-PAH and their use in D–A TADF emitters, DMACBP, DMACPyBP, DMACBPN and DMACPyBPN, when coupled to the same donor, 9,9-dimethyl-9,10-dihydroacridine (DMAC). As the nitrogen content in the acceptor increases the LUMO becomes progressively more stabilized while the singlet–triplet energy gap (ΔEST) decreases and the rate constant for reverse intersystem crossing (kRISC) increases. In particular, introducing nitrogen at the 10-position of dibenzo[a,c]phenazine (BP) leads to a more than ten-fold enhancement in kRISC in DMACPyBP and DMACPyBPN compared to DMACBP and DMACBPN. Among the OLEDs with all four emitters that with DMACBPN demonstrates the highest EQEmax of 19.4% at an emission peak of 588 nm, while the deepest red emitting device employed DMACPyBPN (λEL = 640 nm) with an EQEmax of 5.4%.
Introduction
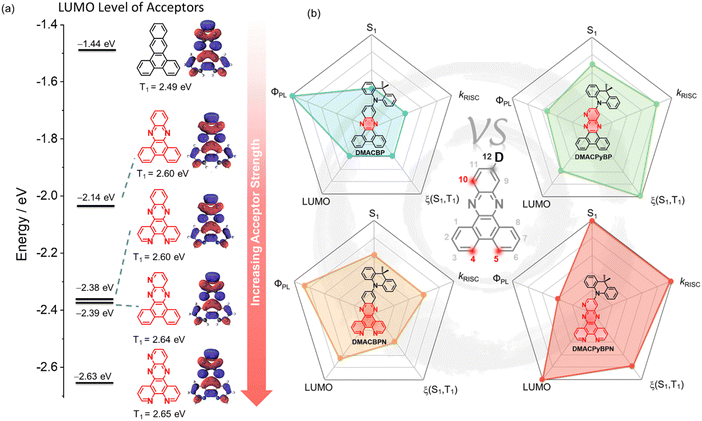
Thermally activated delayed fluorescence (TADF) is a photophysical mechanism that manifests itself in dual emission, a rapid prompt fluorescence from singlet excitons that decay radiatively, and a slow delayed fluorescence that occurs as a result of the thermal up-conversion of triplet excitons into singlets via reverse intersystem crossing (RISC) prior to light generation.1–3 The efficient harvesting of both singlet and triplet excitons to produce light emission makes TADF materials particularly attractive as emitters for electroluminescent devices as, like phosphorescent devices, they can achieve 100% internal quantum efficiency (IQE).4,5 Most of the reported TADF emitters employ a strongly twisted donor (D) and acceptor (A) structure, which leads to localization of the highest occupied molecular orbital (HOMO) and the lowest unoccupied molecular orbital (LUMO) on the D and A, respectively, and thus to a small singlet–triplet energy gap (ΔEST). A sufficiently small ΔEST is necessary to enable endothermic upconversion of triplet excitons to singlets by RISC.6–8 The apparent paradox in TADF emitter design is that the design requirements for efficient RISC are in contrast to those to attain high photoluminescence quantum yield (ΦPL), which require significant orbital overlap to maximize the oscillator strength of the transition.9,10 Balancing these two criteria in the design of high-performance orange-red emitters becomes that much more difficult as radiative decay decreases while non-radiative decay increases due to the energy-gap law.11–13 The general molecular design principles for red/deep red D–A TADF emitters are: (1) use of strong donor and acceptor motifs is a common strategy, affording a shallow HOMO and a deep LUMO for D and A, respectively; and (2) construction of a rigid and typically planar fused ring donor and/or acceptor for the suppression of nonradiative transitions. Within this model, most of the acceptors are derivatives of either acenaphtho[1,2-b]pyrazine-8,9-dicarbonitrile (APDC),14 heterocyclic quinoxaline-6,7-dicarbonitrile (QCN),15 11,12-dicyanodibenzo[a,c]phenazine (CNBPz),16 2,3-dicyanodibenzo[f,h]quinoxaline (CNBQx),17,18 or dibenzo[a,c]-phenazine-3,6-dicarbonitrile (PZCN).19 Nitrogen-doped polycyclic aromatic hydrocarbons (N-PAH), like dibenzo[a,c]phenazine (BP), have proven to be particularly popular as moieties in orange-red TADF emitters (Fig. S1, ESI‡).20–26 Zhao et al. first reported BP-based TADF compounds, containing one-to-three 9,9-dimethyl-9,10-dihydroacridine (DMAC) donor moieties (Fig. S1, ESI‡). The orange-red OLEDs with 3DMAC-BP, an emitter with three DMAC donors situated at the 3-, 6-, and 11-positions of the BP, showed a maximum external quantum efficiency (EQEmax) of 22.0% with an electroluminescence peaking at λEL = 606 nm.23 Yang et al. reported a related compound using the BP acceptor, DMAC-11-DPPZ with the DMAC donor attached at the 11-position of the BP acceptor, which emits at λPL of 576 nm, has a photoluminescence quantum yield, ΦPL, of 57% and a delayed lifetime, τd, of 1.53 μs in 10 wt% doped films in CBP. The optimized OLED with DMAC-11-DPPZ displays an orange emission at 588 nm with an EQEmax of 23.8%.24 Tang et al. introduced one more nitrogen at the 10-position of the BP core to generate a new acceptor unit, BPQ. Star-shaped isomers 3,6,11-triAC-BPQ and 3,6,12-triAC-BPQ contain three DMAC donors at either the 3,6,11-positions or 3,6,12-positions of BPQ. 3,6,12-triAC-BPQ showed a small red-shifted emission at 611 nm in toluene and a slightly shorter τd of 2.25 μs in 15 wt% doped films in mCBP compared to 3DMAC-BP (λPL = 605 nm in toluene, τd = 2.9 μs in 20 wt% doped films in mCBP), which is a compound that does not have an N-atom at the 10-position of the acceptor. In contrast, 3,6,11-triAC-BPQ exhibited a blue-shifted emission at λPL of 565 nm compared to 3,6,12-triAC-BPQ. The devices with 3,6,11-triAC-BPQ and 3,6,12-triAC-BPQ showed an EQEmax of 22.0% [λEL = 581 nm, Commission International de l’Éclairage, CIE, coordinates of (0.51,0.48)] and 16.5% [λEL = 616 nm, CIE coordinates of (0.58,0.39)], respectively.25 The same group reported an orange-yellow TADF material DPPZ-DMAC, where the related DPPZ acceptor contains two additional nitrogen atoms compared to BP. This compound emits at ∼590 nm, has a smaller ΔEST of 0.01 eV, and a higher ΦPL of 91.6% in 6 wt% doped films in CBP, compared to that of DMAC-11-DPPZ, a compound without the two additional nitrogen atoms in the acceptor. The DPPZ-DMAC-based device showed an EQEmax of 27.8% with λEL at 598 nm. Zhang et al. reported a similar emitter SAF-2NP that employs a structurally related 10H-spiro-(acridine-9,9′-fluorene) (SAF) donor instead of DMAC in combination with the same acceptor as DPPZ-DMAC. As excepted, SAF-2NP shows similar photophysics as DPPZ-DMAC but has a slightly blue-shifted emission at lPL of ∼580 nm and a much higher ΦPL of 99%. The SAF-2NP-based OLED demonstrated a very high EQEmax of 32.5% with an λEL at 576 nm, an efficiency linked to the high ΦPL of 99% and horizontally oriented transition dipole (Θ‖) of 85% of the emitter in the host matrix. When DPPZ is coupled with a triphenylamine (TPA) donor, as in oTPA-DPPZ, the emission shifts to the red at 605 nm in the 30 wt% doped films (ΦPL = 75%; ΔEST of 0.07 eV).26 The OLEDs with oTPA-DPPZ showed an EQEmax of 18.5% at λEL of 600 nm. By adjusting the position of the TPA groups, a “T-shape” deep-red TADF emitter, pTPA-DPPZ, was obtained.26 Compared to oTPA-DPPZ, the rational spatial arrangement of D and A groups in pTPA-DPPZ accelerated radiative decay from the singlet state by 90-fold, giving rise to a ΦPL of 87% in the neat film. The corresponding OLEDs, having a simplified bilayer non-doped structure, showed an EQEmax of 12.3% at λEL of 652 nm.Examples of D–A TADF emitters have illustrated that the use of N-PAHs like BP or DPPZ accesses orange-to-red emission. Although numerous molecules have been reported, to the best of our knowledge, there is no one study that has been conducted to correlate the number of nitrogen atoms in the N-PAH acceptor (Fig. 1(a)) to the photophysical properties of the emitter. To address this question, we designed and synthesized four DMAC-containing TADF emitters containing different numbers of nitrogen atoms in the N-PAH acceptor: 11-(9,9-dimethylacridin-10(9H)-yl)dibenzo[a,c]phenazine (DMACBP) (2 nitrogen atoms), 12-(9,9-dimethylacridin-10(9H)-yl)dibenzo[f,h]pyrido[2,3-b]quinoxaline (DMACPyBP) (3 nitrogen atoms), 11-(9,9-dimethylacridin-10(9H)-yl)dipyrido[3,2-a:2′,3′-c]phenazine (DMACBPN) (4 nitrogen atoms) and 12-(9,9-dimethylacridin-10(9H)-yl)pyrido[2′,3′:5,6]pyrazino[2,3-f][1,10]phenanthroline (DMACPyBPN) (5 nitrogen atoms). The variations in key photophysical properties of these four emitters are summarized in Fig. 1(b). It becomes clear that the rate of reverse intersystem crossing, kRISC, can be enhanced when the BP acceptor is modified to contain an additional nitrogen atom at the 10-position. The OLEDs with DMACBPN demonstrated an EQEmax of 19.4% at λEL of 588 nm. The EL spectra shift to red when there is an increasing nitrogen content in the acceptor, with the reddest device using DMACPyBPN emitting at 640 nm.
Results and discussion
Synthesis and characterization
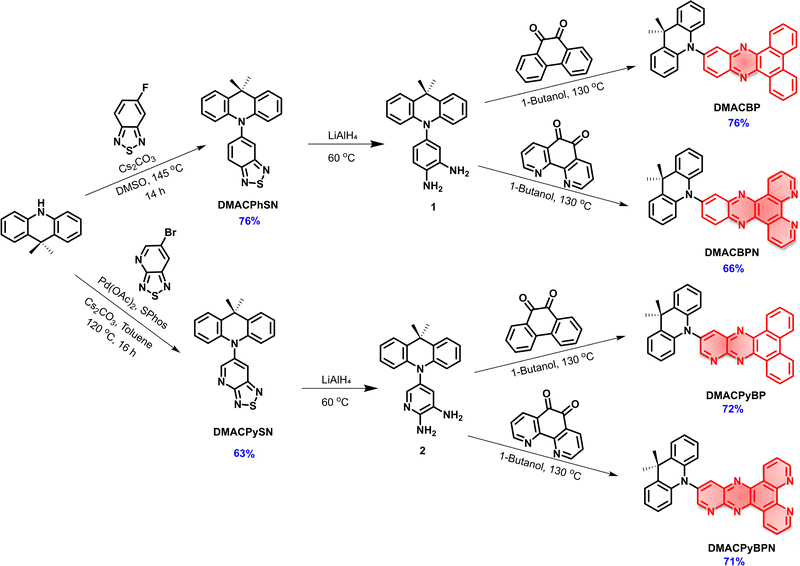
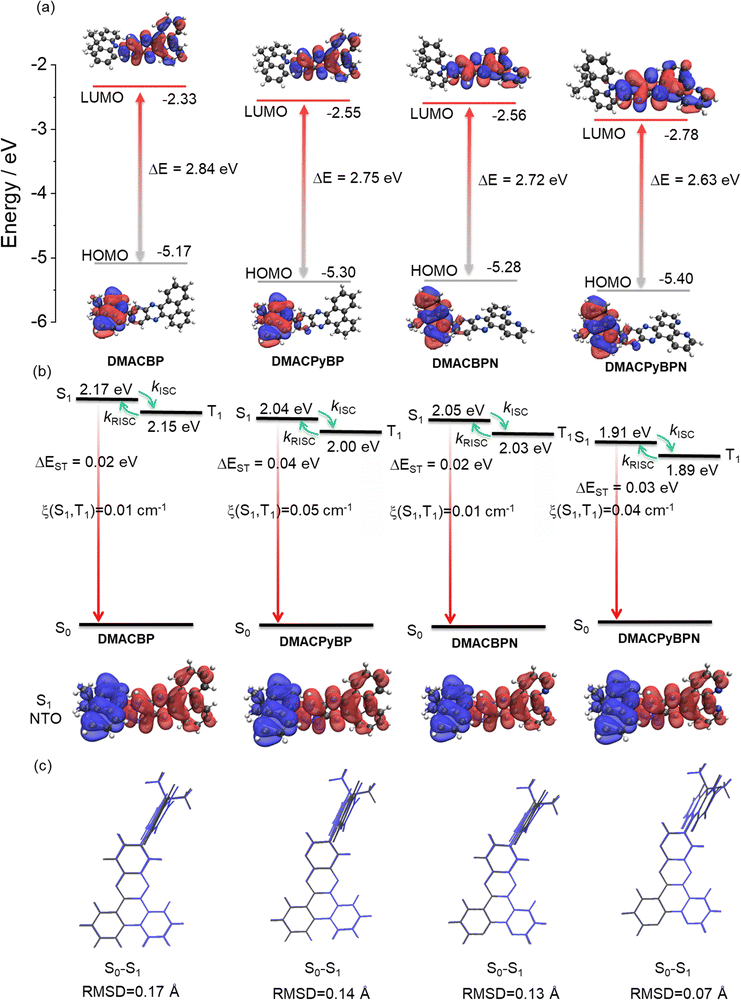
The synthesis of DMACBP, DMACPyBP, DMACBPN and DMACPyBPN is outlined in Scheme 1. The intermediates DMACPhSN and DMACPySN were obtained by a nucleophilic substitution reaction between 5-fluorobenzo[c][1,2,5]thiadiazole and 9,9-dimethyl-9,10-dihydroacridine (DMAC), and Buchwald–Hartwig coupling between 6-bromo-[1,2,5]thiadiazolo[3,4-b]pyridine and DMAC, respectively, followed by ring-opening of the benzothiadiazole (BTD) with lithium aluminum hydride (LiAlH4). Intermediate 1 was then reacted with phenanthrene-9,10-dione and 1,10-phenanthroline-5,6-dione in 1-butanol to afford DMACBP and DMACBPN, respectively, in good yield. DMACPyBP and DMACPyBPN were obtained from the reaction of 2 with phenanthrene-9,10-dione and 1,10-phenanthroline-5,6-dione in 1-butanol, respectively. The structural identity and purity of the four emitters were verified by 1H and 13C nuclear magnetic resonance (NMR) spectroscopy, melting point determination, high-resolution mass spectrometry, elemental analysis, and high-performance liquid chromatography (HPLC) (Fig. S2–S24, ESI‡).To predict their optoelectronic properties, we first modelled the ground-state structure of the four emitters in the gas phase using density functional theory (DFT) at the PBE0/6-31G(d,p) level of theory (Fig. 2). The calculated energy levels of the highest occupied molecular orbital (HOMO) and the lowest unoccupied molecular orbital (LUMO) are shown in Fig. 2(a) and Fig. S25 (ESI‡). As expected, the HOMO is localized on the DMAC donor while the LUMO is localized on the nitrogen-rich electron acceptors. The gradually stabilized LUMO from DMACBP to DMACPyBP, DMACBPN and DMACPyBPN originates from the enhanced electron-withdrawing strength of the acceptor with increasing nitrogen content. However, due to the enhanced electronic coupling between the donor and the acceptor, the HOMO levels of DMACPyBP and DMACPyBPN are more stabilized as these are delocalized over both DMAC and the pyridine (Py) rings, as compared to the DMAC-localized orbitals in DMACBP and DMACBPN (Fig. 2(a)). The HOMO–LUMO gap, ΔEHOMO–LUMO, decreases from 2.84 eV for DMACBP, to 2.75 eV for DMACPyBP, 2.72 eV for DMACBPN and 2.63 eV for DMACPyBPN, following a trend similar to that observed for the LUMO and governed by the strength of the electron-acceptor moiety.
The excited-state properties were then calculated using the time-dependent DFT (TD-DFT) within the Tamm–Dancoff approximation (TDA) based on the optimized ground-state geometry.27 The S1 energies are 2.17 eV for DMACBP, 2.04 eV for DMACPyBP, 2.05 eV for DMACBPN and 1.91 eV for DMACPyBPN, while the T1 energies likewise decrease from 2.15 eV, to 2.00 eV, 2.03 eV and 1.89 eV, respectively, following a trend of increasingly stabilized excited states with increasing N atom content in the acceptor, although DMACPyBP and DMACBPN are close in energy. The corresponding ΔEST values are all relatively small at 0.02, 0.04, 0.02 and 0.03 eV, due to the large dihedral angles between the DMAC and the acceptor that effectively minimize the electronic coupling [DMACBP (82.2°), DMACPyBP (82.7°), DMACBPN (83.8°) and DMACPyBPN (86.1°) based on the optimized S0 geometries] (Fig. S26, ESI‡). To gain insight into the photophysical properties of the S1 excited states, we performed natural transition orbital (NTO) analyses at the S0 geometry (Fig. 2(b)). The S1 state of each of the compounds possesses an evident intramolecular charge transfer (ICT) character. Hole and electron distributions mirror HOMO/LUMO localization, respectively. Root-mean-square displacements (RMSDs) between S0, S1 and T1 were calculated (Fig. 2(c) and Fig. S27, ESI‡) using the VMD program to evaluate the structural changes that occur upon excitation and intersystem crossing.28 The RMSD values of DMACBP, DMACPyBP, DMACBPN and DMACPyBPN between S0 and S1 were simulated to be 0.17, 0.14, 0.13 and 0.07 Å, respectively. The smaller RMSD of DMACPyBPN indicates that the introduction of N at the 10-position or 4/5-position reduces the magnitude of structural relaxation. In the relaxed S1 geometry, there is a larger S1–T1 spin–orbit coupling (SOC) matrix element of 0.05 cm−1 in DMACPyBP and of 0.04 cm−1 in DMACPyBPN than that in DMACBP (0.01 cm−1) and DMACBPN (0.01 cm−1) (Fig. 2(b)), indicating that the rate constants of intersystem crossing (kISC) in DMACPyBP and DMACPyBPN will be faster than in the latter two compounds. As shown in the electrostatic potential maps (Fig. S38, ESI‡), the nitrogen-rich components have a more negative electrostatic potential while the other parts have a neutral and a positive potential, which correlates with the trend in increasing electron-withdrawing ability of the acceptor with the inclusion of an increasing number of nitrogen atoms within the acceptor moiety.
Photophyiscal investigations
The energies of the frontier molecular orbitals (FMOs) were inferred from the electrochemical behavior of DMACBP, DMACPyBP, DMACBPN and DMACPyBPN by cyclic voltammetry (CV) and differential pulse voltammetry (DPV) in degassed dichloromethane (DCM) with tetra-n-butylammonium hexafluorophosphate ([nBu4N]PF6) as the supporting electrolyte (Fig. 3(a)). Electrochemical potentials are reported versus a saturated calomel electrode. The reduction potentials (Ered), determined from the DPV peak values, are −1.39 V (DMACBP), −1.22 V (DMACPyBP), −1.33 V (DMACBPN) and −1.11 V (DMACPyBPN), respectively, reflecting the expected anodic shift associated with increasing acceptor strength that is mirrored in the trend of the calculated LUMO levels from BP < BPN < PyBP < PyBPN (Fig. 1(a)). The calculated LUMO energies are –2.94 eV, −3.12 eV, −3.00 eV and −3.20 eV for DMACBP, DMACPyBP, DMACBPN and DMACPyBPN, respectively. DMACPyBP (1.04 V) and DMACPyBPN (1.04 V) have more positive oxidation potentials than those of DMACBP (1.00 V) and DMACBPN (0.98 V), in line with the DFT calculations. The HOMO levels of DMACBP, DMACPyBP, DMACBPN and DMACPyBPN are −5.34, −5.39, −5.33 and −5.39 eV, respectively. The HOMO–LUMO gaps for DMACBP, DMACBPN and DMACPyBPN are 2.40, 2.33 and 2.19 eV, respectively, which mirror the trend in the DFT calculated values of 2.84, 2.72, and 2.63 eV; however, DMACPyBP exhibits a much smaller HOMO–LUMO gap (2.27 V) inferred from its electrochemistry than DMACBPN (2.33 V), which is opposite to the DFT calculated results in the gas phase. However, the inferred LUMO energies obtained from CV exactly mirror the trend from the DFT calculated LUMO of the acceptors as shown in Fig. 1(a). The inconsistency of the data for DMACPyBP to its corresponding acceptor likely indicates a deviation of the D–A dihedral angles between the DFT calculated structure in the gas phase and that exists in solution during the CV acquisition.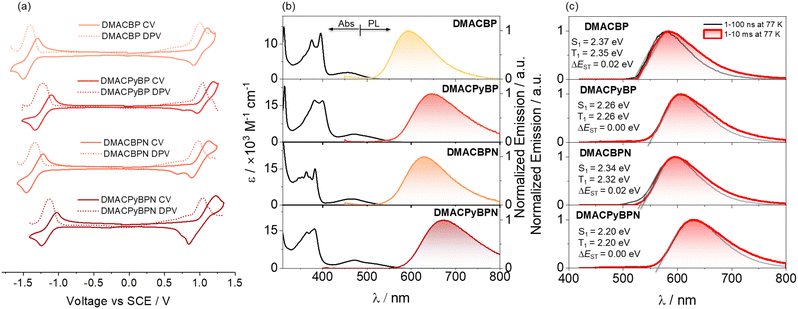 | ||
| Fig. 3 (a) Cyclic and differential pulse voltammograms measured in degassed DCM with 0.1 M [nBu4N]PF6 as the supporting electrolyte and Fc/Fc+ as the internal reference (0.46 V vs. SCE).29 Scan rate = 100 mV s−1. (b) UV-vis absorption and steady-state photoluminescence (SSPL) spectra of DMACBP, DMACPyBP, DMACBPN and DMACPyBPN recorded in toluene at room temperature (λexc = 375 nm). (c) Prompt fluorescence (1–100 ns) and phosphorescence spectra (1–10 ms) in 2-MeTHF at 77 K of DMACBP, DMACPyBP, DMACBPN and DMACPyBPN (λexc = 375 nm). | ||
The UV-Vis absorption spectra of the four emitters in dilute toluene are shown in Fig. 3(b). The spectra show two prominent spectral features, with two intense bands centered at ∼390 nm and a hypochromic broadband at ∼470 nm, which are assigned to locally excited (LE) π–π* transitions of the donor and acceptor moieties,30,31 and intramolecular charge transfer (ICT) transitions of the DMAC donor to the acceptor moiety, respectively.24,30 The ICT band expectedly shifts to lower energies with the introduction of an increasing number of N atoms at positions 4/5 of the acceptor; for instance, the ICT band at 465 nm of DMACBPN (ε = 2.5 × 10³ M−1 cm−1) is red-shifted compared to that of DMACBP (λabs = 458 nm, ε = 1.8 × 10³ M−1 cm−1) while those of DMACPyBP and DMACPyBPN absorb at essentially the same energy at 474 and 475 nm (ε = 3.2 × 10³ M−1 cm−1 for both), which match well with the TD-DFT calculated S1 energies (Fig. 2(b)). Positive photoluminescence (PL) solvatochromism is observed for all compounds (Fig. S29 and Table S1, ESI‡), which is consistent with the ICT nature of the emissive excited state.
The steady-state photoluminescence (SSPL) spectra in toluene gradually red-shift from DMACBP (λPL = 595 nm) to DMACBPN (λPL = 630 nm) and DMACPyBPN (λPL = 672 nm), which coincides with an increasing number of nitrogen atoms in the acceptors (Fig. 3(b)). However, DMACPyBP (λPL = 645 nm) containing three nitrogen atoms within the acceptor exhibits a slightly red-shifted emission than DMACBPN (λPL = 630 nm), which contains four nitrogen atoms within the acceptor. This behavior correlates with the calculated S1 energies (Fig. 2(b))and demonstrated that acceptor PyBP with 10-position N showed stronger electron-withdrawing abilities than BPN acceptor with two N in [1,10] phenanthroline, following the trend of acceptor strength as shown in Fig. 1(a). The corresponding optical bandgaps, determined from the intersection point of the normalized absorption and emission spectra,32–34 for DMACBP, DMACPyBP, DMACBPN and DMACPyBPN are 2.37 eV, 2.20 eV, 2.31 eV and 2.12 eV, respectively (Fig. S30, ESI‡), which is consistent with the trend in emission energies (Fig. S31, ESI‡ and Table 1). The photoluminescence quantum yields (ΦPL) for DMACBP, DMACPyBP, DMACBPN and DMACPyBPN in degassed toluene solution are 35%, 20%, 38% and 6%, respectively. When exposed to oxygen, these values significantly decrease to 9%, 7%, 8%, and 3% respectively. The energies of the onset of the prompt fluorescence and phosphorescence spectra in 2-MeTHF glass at 77 K were used to determine the S1 and T1 energies (Fig. 3(c)). The S1 energies are 2.37, 2.26, 2.34 and 2.20 eV, while the T1 energies are 2.35, 2.26, 2.32 and 2.20 eV, for DMACBP, DMACPyBP, DMACBPN and DMACPyBPN, respectively. As both the prompt fluorescence and phosphorescence spectra are structureless, it is reasonable to assign both the S1 and T1 states as possessing significant CT character. The corresponding ΔEST values for DMACBP, DMACPyBP, DMACBPN and DMACPyBPN are then 0.02 eV, 0.00 eV, 0.02 eV and 0.00 eV, respectively, which align with the TDA-DFT calculated results (Fig. 2(b)).
| Molecule | λ abs/(ε/× 103 M−1 cm−1) /nma | λ PL /nm | τ p/nsa | τ d/μsa | λ PL /nm | Φ PL /% | S1/T1c/eV | ΔEST /eV | τ p/nsd | τ d/μsd | k ISC /×107 s−1 | k RISC /×104 s−1 | E HOMO /eV | E LUMO /eV | E g /eV |
|---|---|---|---|---|---|---|---|---|---|---|---|---|---|---|---|
| a In PhMe at 298 K (λexc = 340 nm). b Spin-coated 2 wt% emitters doped in CBP films and ΦPL values were determined using an integrating sphere (λexc = 340 nm). Values quoted are under N2. Values in parentheses are in air. c S1 was obtained from the onset of the prompt emission (time-gated window: 1–100 ns) ms measured in doped film at 77 K and T1 was obtained from the onset of the phosphorescence spectrum (time-gated window: 1–10 ms) measured in doped film at 77 K. d PL lifetime. e k ISC = intersystem crossing rate constant from S1 to T1 states; kRISC = reverse intersystem crossing rate constant. f In DCM with 0.1 M [nBu4N]PF6 as the supporting electrolyte and Fc/Fc+ as the internal reference (0.46 V vs. SCE).29 The HOMO and LUMO energies were determined using EHOMO/LUMO = −(Eox/Ered + 4.8) eV, where Eox and Ered are anodic and cathodic peak potentials, respectively, obtained from the DPV versus Fc/Fc+.29 g E g = |EHOMO − ELUMO|. | |||||||||||||||
| DMACBP | 395 (13), 458(1.8) | 595 | 18 | 146 | 568 | 75(56) | 2.33/2.31 | 0.02 | 15.3 | 130.3 | 1.7 | 1.0 | −5.34 | −2.94 | 2.40 |
| DMACPyBP | 400 (17), 474(3.2) | 645 | 20 | 3.5 | 601 | 47(41) | 2.32/2.31 | 0.01 | 21.1 | 5.9 | 0.6 | 19.4 | −5.39 | −3.12 | 2.27 |
| DMACBPN | 383 (15), 465(2.5) | 630 | 27 | 19.7 | 586 | 71(52) | 2.26/2.25 | 0.01 | 22.4 | 47.2 | 1.2 | 2.9 | −5.33 | −3.00 | 2.33 |
| DMACPyBPN | 382 (16), 475(3.2) | 672 | 10 | 2.3 | 606 | 37(30) | 2.32/2.31 | 0.01 | 23.2 | 2.9 | 0.8 | 42.6 | −5.39 | −3.20 | 2.19 |
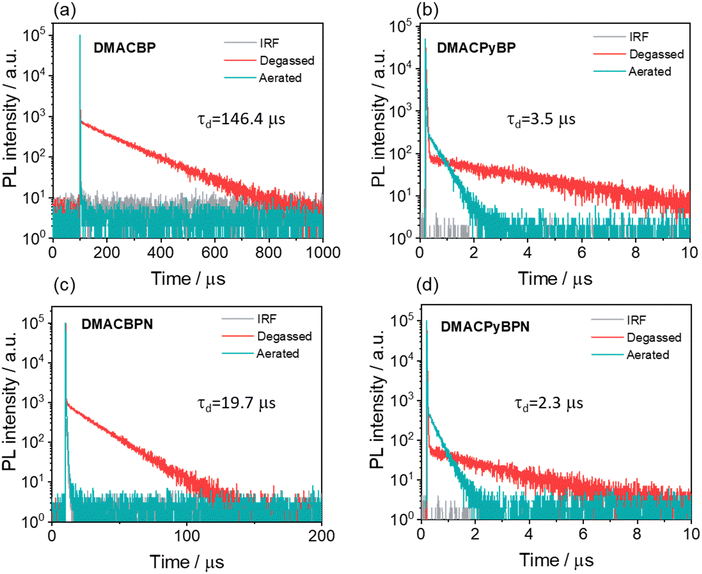
From the difference in transient PL decay behavior under aerated and degassed conditions in toluene, it is clear that the delayed emission is significantly quenched by the presence of oxygen (Fig. 4); interestingly, the quenching of the PL in DMACBP and DMACBPN is more significant than in DMACPyBP and DMACPyBPN, the latter two of which contain an additional pyridine ring fused to the pyrazine in the acceptor. The increased quenching of the PL of the former two compounds may be due to their longer delayed lifetimes. The emission intensity is likewise strongly affected by the presence of oxygen, especially for DMACBP and DMACBPN, while for DMACPyBP and DMACPyBPN, the enhancement in intensity upon oxygen removal was much smaller (Fig. S32, ESI‡). The PL decays with biexponential kinetics, with prompt fluorescence lifetimes, τp, of 18 ns, 21 ns, 27 ns and 10 ns (Fig. S33, ESI‡), and delayed fluorescence lifetimes, τd, of 146.4 μs, 3.5 μs, 19.7 μs and 2.3 μs, respectively, for DMACBP, DMACPyBP, DMACBPN and DMACPyBPN. The corresponding rate constants of intersystem crossing (kISC) for DMACBP, DMACPyBP, DMACBPN and DMACPyBPN are 4.1 × 10⁷ s−1, 3.3 × 10⁷ s−1, 2.9 × 10⁷ s−1 and 5.0 × 10⁷ s−1, respectively, while the rate constants for reverse intersystem crossing (kRISC) for DMACPyBP (81.6 × 10⁴ s−1) and DMACPyBPN (87.0 × 10⁴ s−1) are much faster than those of DMACBP (2.7 × 10⁴ s−1) and DMACBPN (24.1 × 10⁴ s−1), due in part to the smaller ΔEST in the former two that is correlated to the introduction of a nitrogen atom at the 10-position in DMACPyBP and DMACPyBPN.
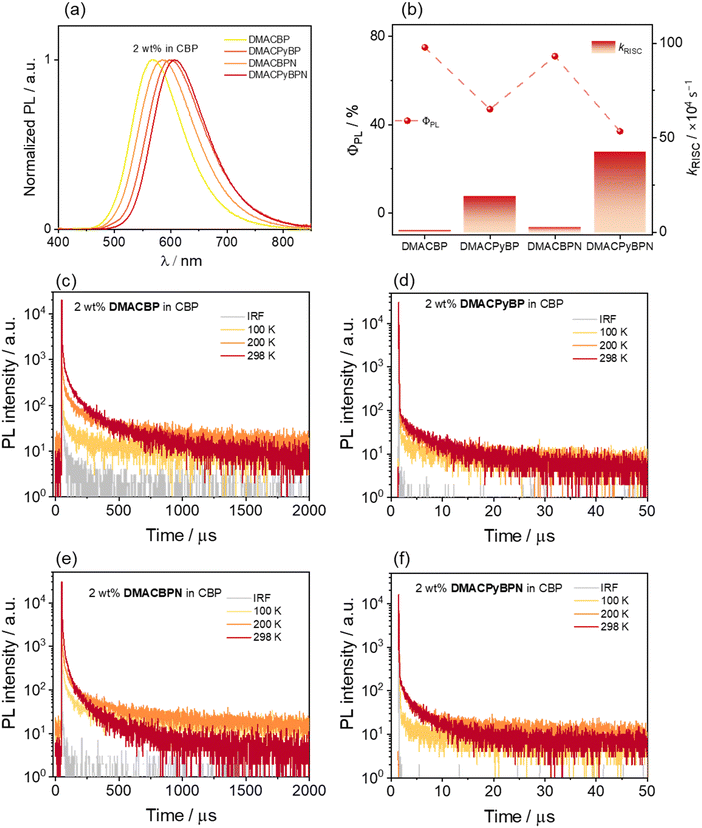
We next investigated the photophysical properties of the four emitters in an OLED-relevant host, 4,4′-N,N′-dicarbazolebiphenyl (CBP), as this host matrix has sufficiently high triplet energy (T1 = 2.56 eV) to confine the excitons onto the emitter.35,36 The PL of the doped films of varying dopant concentrations from 2–10 wt% of emitters was first investigated (Fig. S36, ESI‡) and the corresponding ΦPL values are summarized in Table S2 (ESI‡). As the doping concentration is increased, the emission of all of the compounds is red-shifted from yellow to red (Fig. S34, ESI‡), and the highest ΦPL values are at a doping concentration of 2 wt%. The SSPL spectra of DMACBP, DMACPyBP, DMACBPN and DMACPyBPN at a doping concentration of 2 wt% exhibit broad and unstructured emission with λPL at 568, 601, 586, and 606 nm, respectively (Fig. 5(a)). The trend in λPL mirrors those in toluene (Fig. 3(b)). The ΦPL values of these films of DMACBP, DMACPyBP, DMACBPN and DMACPyBPN are 75, 47, 71 and 37%, respectively, under a N2 atmosphere (Fig. 5(b) and Table 1). The decrease in ΦPL for DMACPyBP/DMACPyBPN can be ascribed to their smaller energy gaps, thus leading to increased non-radiative decay.37 However, the difference in the distribution of N atoms in the BP and BPN (two additional nitrogen atoms on the 4- and 5-position) acceptors has only a relatively small impact on the acceptor strength, with a small red shift in the emission from 568 nm for DMACBP to 586 nm for DMACBPN; as well, there is only a negligible decrease in ΦPL between DMACBP and DMACBPN (Table 1 and Fig. 5(b)).38 The ΦPL values of DMACBP and DMACBPN exhibited a larger decrease in the presence of air at 56 and 52%, respectively, compared to 41% for DMACPyBP and 30% for DMACPyBPN, indicating a greater proportion of triplet excitons in DMACBP and DMACBPN. As shown in Fig. 5, all four compounds showed multiexponential decay kinetics, with average prompt fluorescence lifetimes, average τp, of 15.3, 21.1, 22.4, and 23.2 ns (Fig. S35, ESI‡) and average delayed emission lifetimes, average τd, of 130.3, 5.9, 47.2, and 2.9 μs at room temperature for DMACBP, DMACPyBP, DMACBPN and DMACPyBPN, respectively. The corresponding kISC values for DMACBP, DMACPyBP, DMACBPN and DMACPyBPN in the 2 wt% doped films in CBP are 1.7 × 10⁷ s−1, 0.6 × 10⁷ s−1, 1.2 × 10⁷ s−1 and 0.8 × 10⁷ s−1, respectively, while kRISC for DMACPyBP and DMACPyBPN reached 1.94 × 10⁵ s−1 and 4.26 × 10⁵ s−1, more than ten times higher than those of DMACBP at 0.10 × 10⁵ s−1 and DMACBPN at 0.29 × 10⁵ s−1 (Fig. 5(b)), following a similar trend to that observed for toluene. The introduction of a nitrogen atom at the 10-position in DMACPyBP and DMACPyBPN leads to a much stronger CT and faster kRISC. Temperature-dependent time-resolved PL (TRPL) analysis shows that the intensity of the delayed emission increases with increasing temperatures for all 4 compounds, confirming that these compounds emit via TADF (Fig. 5(c) and (d)). The energy levels of the S1 and T1 states were estimated from the onset of the corresponding prompt fluorescence and phosphorescence spectra of the 2 wt% doped films in CBP at 77 K (Fig. S36, ESI‡). As expected, DMACBP, DMACPyBP, DMACBPN and DMACPyBPN have, respectively, small ΔEST values of 0.02, 0.01, 0.01 and 0.01 eV, values consistent with those in 2-MeTHF glass.
Device characterization
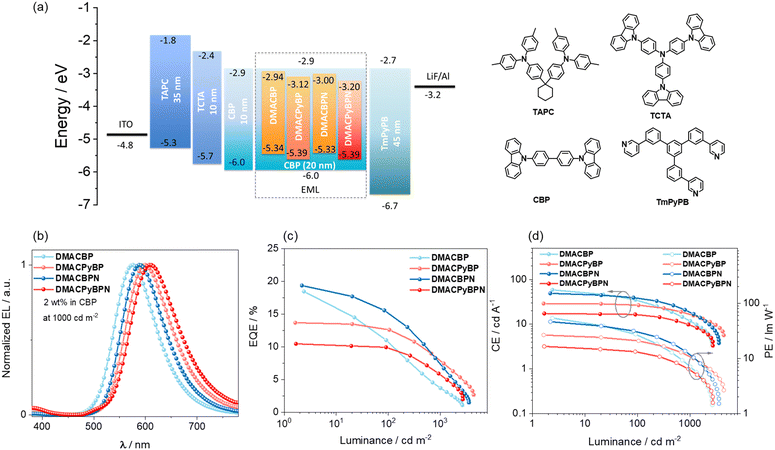
To evaluate the electroluminescence (EL) performance of these emitters, OLEDs employing different doping concentration emitters (2, 5, 8 and 11 wt%, the data for 5 and 8 wt% can be found in Fig. S38 and Table S3, ESI‡) doped in CBP films as the emissive layer (EML) was fabricated. The OLEDs have the following configuration: ITO (indium tin oxide)/TAPC (4,4′-(cyclohexane-1,1-diyl)bis(N,N-di-p-tolylaniline)) (40 nm)/TCTA (tris(4-(9H-carbazol-9-yl)phenyl)amine) (10 nm)/CBP (10 nm)/CBP:x wt% dopants (20 nm)/TmPyPB (3,3′-(5′-(3-(pyridin-3-yl)phenyl)-[1,1′:3′,1′′-terphenyl]-3,3′′-diyl)dipyridine) (45 nm)/LiF (1 nm)/Al (Fig. 6(a)). ITO and Al serve as the anode and the cathode, respectively, while TAPC, TCTA and TmPyPB are, respectively, used as the hole-transporting layer, the electron-blocking layer, and the electron-transporting layer.As shown in Fig. 6(b), the OLEDs with DMACBP, DMACPyBP, DMACBPN and DMACPyBPN at a doping concentration of 2 wt% in the CBP host exhibit yellow-to-red EL with the peak emission, λEL, at 576, 600, 588 and 608 nm, respectively, which match the PL in CBP very well (Fig. 5(a)). The corresponding CIE coordinates are (0.48, 0.50), (0.56, 0.44), (0.53, 0.46) and (0.57, 0.42). The devices with DMACBP, DMACPyBP, DMACBPN, and DMACPyBPN showed EQEmax of 18.5, 13.7, 19.4 and 10.5%, respectively, reflecting the variations in their intrinsic ΦPL (Fig. 6(c) and Table 2). The maximum current efficiency (CEmax) and power efficiency (PEmax) values are 58.7 cd A−1 and 54.2 lm W−1 for the devices with DMACBP, 28.9 cd A−1 and 26.7 lm W−1 for the devices with DMACPyBP, 48.9 cd A−1 and 46.5 lm W−1 for the devices with DMACBPN, and 17.4 cd A−1 and 16.6 lm W−1 for the devices with DMACPyBPN (Fig. 6(d)), respectively. The efficiency roll-off behavior is noticeably different between the four devices. At a luminance of 100 cd m−2, a large efficiency roll-off of 40.5% and 24.7% was observed in the devices with DMACBP and DMACBPN, respectively, which decreased considerably to 8.0% and 4.7% for the devices with DMACPyBP and DMACPyBPN, respectively. The EQE decreased to 3.7% at a luminance of 1000 cd m−2 for the device with DMACBP; however, for the device with DMACPyBP, the EQE1000 was 7.5%. Similarly, at the same current density of 1 mA cm−2, the devices with DMACBP and DMACBPN exhibit much larger efficiency roll-off of 58% and 36%, respectively, than the devices with DMACPyBP (16%) and DMACPyBPN (14%) (as shown in Fig. S37, ESI‡). A plausible explanation for this difference in efficiency roll-off behavior is due to the faster kRISC and shorter τd in DMACPyBP and DMACPyBPN, thus leading to smaller triplet exciton populations at high current densities in the devices with these two emitters. The DMACPyBP-based OLEDs showed remarkably low-efficiency roll-off, especially compared to other DMAC-containing orange-red TADF OLEDs (Fig. S1, ESI‡).23,24,30 Increasing the doping concentration to 5 wt%, 8 wt% or even to 11 wt% does not lead to a further improvement in performance and the EL spectra red-shifted progressively (Fig. S38 and Table S3, ESI‡). At 11 wt% doping, the OLEDs emit in the range of 600–640 nm and showed an EQEmax of 5.5–15.9% (Table S3, ESI‡).
| Emitter | Concentration/wt% | V on /V | CEmaxb/cd A−1 | PEmaxc/lm W−1 | EQEmax/100/1000d/% | Efficiency roll-off 100/1000e/% | L max /cd m−2 | λ EL /nm | CIEh (x, y) |
|---|---|---|---|---|---|---|---|---|---|
| a Voltage at 1 cd m−2. b Maximum current efficiency. c Maximum power efficiency. d Maximum external quantum efficiency at 100 cd m−2/at 1000 cd m−2. e EQE roll off at 100 cd m−2/at 1000 cd m−2. f Maximum luminance. g EL emission peak at 1000 cd m−2. h Commission Internationale de L’Éclairage coordinates. | |||||||||
| DMACBP | 2.0% | 3.4 | 58.7 | 54.2 | 18.5/11.0/3.7 | 40/80 | 2665 | 576 | 0.48, 0.50 |
| 11.0% | 3.5 | 38.1 | 34.2 | 14.6/12.0/5.6 | 18/62 | 4332 | 584 | 0.52, 0.47 | |
| DMACPyBP | 2.0% | 3.4 | 28.9 | 26.7 | 13.7/12.6/7.5 | 8/45 | 4346 | 600 | 0.56, 0.44 |
| 11.0% | 3.4 | 11.6 | 10.7 | 9.0/8.3/4.7 | 8/47 | 3369 | 620 | 0.61, 0.39 | |
| DMACBPN | 2.0% | 3.3 | 48.9 | 46.5 | 19.4/14.6/6.7 | 25/65 | 3551 | 588 | 0.53, 0.46 |
| 11.0% | 3.1 | 31.9 | 32.3 | 15.9/13.4/7.5 | 16/53 | 4315 | 600 | 0.57, 0.43 | |
| DMACPyBPN | 2% | 3.3 | 17.4 | 16.6 | 10.5/10.0/5.0 | 5/52 | 2723 | 608 | 0.57, 0.42 |
| 11% | 3.2 | 4.1 | 4.0 | 5.4/5.1/2.0 | 5/63 | 1428 | 640 | 0.63, 0.37 | |
Conclusion
We have developed a family of four orange-to-red TADF compounds whose structures differ in the number of nitrogen atoms contained within the conjugated acceptor core. The structure–property relationship among the four compounds has been systematically investigated using DFT calculations and a combination of photophysical and electrochemical studies; OLEDs were also fabricated using these materials as emitters. It was found that increasing the nitrogen atom content in the acceptor (BP) of the D–A type compounds results in a more stabilized LUMO, a smaller ΔEST and a faster kRISC. In particular, the presence of nitrogen at the 10-position of BP notably enhances kRISC, as demonstrated in DMACPyBP and DMACPyBPN compared to DMACBP and DMACBPN, despite the small decrease in ΦPL. OLEDs with DMACBPN showed a maximum EQE of 19.4% and an electroluminescence maximum of 588 nm. As the N/C ratio increased, the EL spectra of the corresponding devices progressively red-shifted, with the reddest-emitting device (λEL = 640 nm) employing DMACPyBPN. Furthermore, the DMACPyBP/DMACPyBPN-based OLEDs showed a remarkably low-efficiency roll-off of only 8 and 5%, compared to 40 and 25% at 100 cd m−2 for the devices with DMACBP/DMACBPN, respectively.Conflicts of interest
There are no conflict to declare.Acknowledgements
C. Si thanks the China Scholarship Council (201806890001). D. Sun acknowledges support from the Royal Academy of Engineering Enterprise Fellowship (EF2122-13106). The St Andrews team thanks EPSRC for financial support (EP/P010482/1). X.-H. Zhang acknowledges support from the National Natural Science Foundation of China (grant no. 52130304, 51821002), Suzhou Key Laboratory of Functional Nano & Soft Materials, Collaborative Innovation Center of Suzhou Nano Science & Technology, and the 111 Project.References
- D. Sun, C. Si, T. Wang and E. Zysman-Colman, Adv. Photonics Res., 2022, 2200203 CrossRef CAS.
- M. Y. Wong and E. Zysman-Colman, Adv. Mater., 2017, 29, 1605444 CrossRef PubMed.
- H. Uoyama, K. Goushi, K. Shizu, H. Nomura and C. Adachi, Nature, 2012, 492, 234–238 CrossRef CAS PubMed.
- G. Hong, X. Gan, C. Leonhardt, Z. Zhang, J. Seibert, J. M. Busch and S. Bräse, Adv. Mater., 2021, 33, 2005630 CrossRef CAS PubMed.
- Y.-J. Yu, X.-Q. Wang, J.-F. Liu, Z.-Q. Jiang and L.-S. Liao, iScience, 2021, 24, 102123 CrossRef CAS PubMed.
- Y. Liu, C. Li, Z. Ren, S. Yan and M. R. Bryce, Nat. Rev. Mater., 2018, 3, 18020 CrossRef CAS.
- J. H. Kim, J. H. Yun and J. Y. Lee, Adv. Opt. Mater., 2018, 6, 1800255 CrossRef.
- Z. Yang, Z. Mao, Z. Xie, Y. Zhang, S. Liu, J. Zhao, J. Xu, Z. Chi and M. P. Aldred, Chem. Soc. Rev., 2017, 46, 915–1016 RSC.
- Y. Xiao, H. Wang, Z. Xie, M. Shen, R. Huang, Y. Miao, G. Liu, T. Yu and W. Huang, Chem. Sci., 2022, 13, 8906–8923 RSC.
- S. Sharma and A. K. Pal, J. Mater. Chem. C, 2022, 10, 15681–15707 RSC.
- J. S. Wilson, N. Chawdhury, M. R. A. Al-Mandhary, M. Younus, M. S. Khan, P. R. Raithby, A. Köhler and R. H. Friend, J. Am. Chem. Soc., 2001, 123, 9412–9417 CrossRef CAS PubMed.
- J. V. Caspar, E. M. Kober, B. P. Sullivan and T. J. Meyer, J. Am. Chem. Soc., 1982, 104, 630–632 CrossRef CAS.
- Y. J. Yu, Y. Hu, S. Y. Yang, W. Luo, Y. Yuan, C. C. Peng, J. F. Liu, A. Khan, Z. Q. Jiang and L. S. Liao, Angew. Chem., Int. Ed., 2020, 59, 21578–21584 CrossRef CAS PubMed.
- Y. Yuan, Y. Hu, Y. X. Zhang, J. D. Lin, Y. K. Wang, Z. Q. Jiang, L. S. Liao and S. T. Lee, Adv. Funct. Mater., 2017, 27, 1–5 Search PubMed.
- C. Li, R. Duan, B. Liang, G. Han, S. Wang, K. Ye, Y. Liu, Y. Yi and Y. Wang, Angew. Chem., Int. Ed., 2017, 56, 11525–11529 CrossRef CAS PubMed.
- R. Furue, K. Matsuo, Y. Ashikari, H. Ooka, N. Amanokura and T. Yasuda, Adv. Opt. Mater., 2018, 6, 1–9 Search PubMed.
- S. Wang, X. Yan, Z. Cheng, H. Zhang, Y. Liu and Y. Wang, Angew. Chem., Int. Ed., 2015, 54, 13068–13072 CrossRef CAS PubMed.
- S. Wang, Z. Cheng, X. Song, X. Yan, K. Ye, Y. Liu, G. Yang and Y. Wang, ACS Appl. Mater. Interfaces, 2017, 9, 9892–9901 CrossRef CAS PubMed.
- Y. L. Zhang, Q. Ran, Q. Wang, Y. Liu, C. Hänisch, S. Reineke, J. Fan and L. S. Liao, Adv. Mater., 2019, 31, 1–7 CAS.
- S. Kothavale, W. J. Chung and J. Y. Lee, J. Mater. Chem. C, 2020, 8, 7059–7066 RSC.
- S. Kothavale, W. J. Chung and J. Y. Lee, J. Mater. Chem. C, 2022, 10, 6043–6049 RSC.
- S. Kothavale, J. Lim and J. Yeob Lee, Chem. Eng. J., 2022, 431, 134216 CrossRef CAS.
- F. M. Xie, H. Z. Li, G. L. Dai, Y. Q. Li, T. Cheng, M. Xie, J. X. Tang and X. Zhao, ACS Appl. Mater. Interfaces, 2019, 11, 26144–26151 CrossRef CAS PubMed.
- C. Zhou, W. C. Chen, H. Liu, X. Cao, N. Li, Y. Zhang, C. S. Lee and C. Yang, J. Mater. Chem. C, 2020, 8, 9639–9645 RSC.
- F. M. Xie, X. Y. Zeng, J. X. Zhou, Z. D. An, W. Wang, Y. Q. Li, X. H. Zhang and J. X. Tang, J. Mater. Chem. C, 2020, 8, 15728–15734 RSC.
- H. Wang, B. Zhao, P. Ma, Z. Li, X. Wang, C. Zhao, X. Fan, L. Tao, C. Duan, J. Zhang, C. Han, G. Chen and H. Xu, J. Mater. Chem. C, 2019, 7, 7525–7530 RSC.
- S. Hirata and M. Head-Gordon, Chem. Phys. Lett., 1999, 314, 291–299 CrossRef CAS.
- W. Humphrey, A. Dalke and K. Schulten, J. Mol. Graphics, 1996, 14, 33–38 CrossRef CAS PubMed.
- N. G. Connelly and W. E. Geiger, Chem. Rev., 1996, 96, 877–910 CrossRef CAS PubMed.
- X. Y. Zeng, J. X. Zhou, S. J. Zou, Y. Q. Tang, H. Z. Li, Y. H. He, Y. Q. Li, W. J. Wang and J. X. Tang, Adv. Opt. Mater., 2022, 10, 1–9 Search PubMed.
- U. Balijapalli, Y. T. Lee, B. S. B. Karunathilaka, G. Tumen-Ulzii, M. Auffray, Y. Tsuchiya, H. Nakanotani and C. Adachi, Angew. Chem., Int. Ed., 2021, 0395, 19364–19373 CrossRef PubMed.
- Y. U. Peter and M. Cardona, Fundamentals of semiconductors: physics and materials properties, Springer Science & Business Media, 2010 Search PubMed.
- T. C. Parker and S. R. Marder, Synthetic methods in organic electronic and photonic materials: A practical guide, Royal Society of Chemistry, 2015 Search PubMed.
- S. Karuthedath, J. Gorenflot, Y. Firdaus, N. Chaturvedi, C. S. P. De Castro, G. T. Harrison, J. I. Khan, A. Markina, A. H. Balawi, T. A. Dela Peña, W. Liu, R. Z. Liang, A. Sharma, S. H. K. Paleti, W. Zhang, Y. Lin, E. Alarousu, D. H. Anjum, P. M. Beaujuge, S. De Wolf, I. McCulloch, T. D. Anthopoulos, D. Baran, D. Andrienko and F. Laquai, Nat. Mater., 2021, 20, 378–384 CrossRef CAS PubMed.
- A. Endo and C. Adachi, Chem. Phys. Lett., 2009, 483, 224–226 CrossRef CAS.
- C. Adachi, R. C. Kwong, P. Djurovich, V. Adamovich, M. A. Baldo, M. E. Thompson and S. R. Forrest, Appl. Phys. Lett., 2001, 79, 2082–2084 CrossRef CAS.
- M. Albota, D. Beljonne, J. L. Brédas, J. E. Ehrlich, J. Y. Fu, A. A. Heikal, S. E. Hess, T. Kogej, M. D. Levin, S. R. Marder, D. McCord-Maughon, J. W. Perry, H. Röckel, M. Rumi, G. Subramaniam, W. W. Webb, X. L. Wu and C. Xu, Science, 1998, 281, 1653–1656 CrossRef CAS PubMed.
- A. Hirono, H. Sakai, S. Kochi, T. Sato and T. Hasobe, J. Phys. Chem. B, 2020, 124, 9921–9930 CrossRef PubMed.
Footnotes |
| † The research data supporting this publication can be accessed at https://doi.org/10.17630/ccda8f8c-932f-498a-83e5-a2f95bcebf85 |
| ‡ Electronic supplementary information (ESI) available: 1H and 13C NMR spectra, HRMS and EA of all target compounds; supplementary computational data; supplementary photophysical data. See DOI: https://doi.org/10.1039/d3tc02352d |
| § Equal contribution. |
| This journal is © The Royal Society of Chemistry 2023 |

