
 Open Access Article
 This Open Access Article is licensed under a Creative Commons Attribution-Non Commercial 3.0 Unported Licence
Synthesis of highly ordered L10 MPt alloys (M = Fe, Co, Ni) from crystalline salts: an in situ study of the pre-ordered precursor reduction strategy†
S.
Laureti
 *a,
F.
D’Acapito
b,
P.
Imperatori
a,
E.
Patrizi
a,
G.
Varvaro
a,
A.
Puri
b,
C.
Cannas
c and
A.
Capobianchi
*a
*a,
F.
D’Acapito
b,
P.
Imperatori
a,
E.
Patrizi
a,
G.
Varvaro
a,
A.
Puri
b,
C.
Cannas
c and
A.
Capobianchi
*a
aIstituto di Struttura della Materia, CNR, nM2-Lab, Monterotondo Scalo (Roma), 00015, Italy. E-mail: sara.laureti@ism.cnr.it; aldo.capobianchi@ism.cnr.it
bIstituto Officina dei Materiali -OGG, CNR c/o ESRF, LISA CRG, F-38043 Grenoble, France
cDepartment of Chemical and Geological Sciences, University of Cagliari, 09042 Monserrato, Italy
First published on 22nd November 2023
Abstract
The synthesis of highly ordered magnetic L10 alloys by means of the so-called pre-ordered precursor reduction (PPR) approach is deeply investigated by in situ X-ray absorption spectroscopy experiments. By following the chemical and structural evolution of the M(H2O)6PtCl6 (M = Fe, Co, Ni) precursor salts during hydrogen-assisted thermal reduction, it was possible to shed light on the key role of the crystalline initial compound whose intrinsic atomic order serves as a driving force to kinetically favor the formation of highly ordered FePt, CoPt and NiPt L10 alloys under milder conditions with respect to ordinary thermal treatments. The results confirm the potentiality of the PPR synthesis approach that can be suitably extended, by properly choosing the precursor salt, for the synthesis of other binary and ternary alloys where the chemical order represents a key property of the material, with a potential strong impact on several technological applications.
1. Introduction
Whether in the form of bulk,1–5 thin films6–9 or nanoparticles,10–13 magnetic alloys play a fundamental role in many fields of application, such as data storage/processing, sensors, energy and catalysis,14–18 being also of potential interest in other research areas, such as biomedicine and environment remediation,19–21 where magnetic oxides are more commonly used.19,20,22–24 Among the family members, chemically ordered binary alloys are of significant interest due to their peculiar atomic arrangement, which results in unique and sometimes remarkable magnetic properties along with excellent chemical stability.25 Paramount examples of chemically ordered compounds include: (i) Fe(Co)–Pt and Fe(Co)–Pd ferromagnetic alloys for data storage/processing and catalysis, which feature a huge uniaxial magnetic anisotropy (K = 0.5–1 × 10⁷ J m−3)26 that can be intrinsically obtained without resorting to complex multilayered structures;27–29 (ii) high-anisotropy Mn–Al and Fe–Ni alloys (K = 1–2 × 10⁶ J m−3)30 that are cost-effective alternatives to materials containing critical elements for the development of sustainable permanent magnets and electronics; and (iii) antiferromagnetic alloys (e.g., Mn–Pt and Mn–Ni) for spintronic devices.31 According to the bulk equilibrium phase diagram,32–35 around the equiatomic composition, the chemically ordered L10 phase, consisting of planes of pure atoms alternating along the c-axis of the face-centered tetragonal (fct) unit cell (ESI,† Fig. S1), is stable below the order/disorder transition temperature TO–D, which is characteristic of each system. In many binary alloys, other ordered phases can form, such as the cubic L12 structure around the 1![[thin space (1/6-em)]](https://www.rsc.org/images/entities/char_2009.gif) :3 and 3:1 stoichiometric composition, where one atomic species occupies the vertices of the cube and the other atoms occupy its face centers. Above TO–D, chemically disordered face-centered cubic (fcc) A1 phases, which show significantly different chemical/physical properties compared to the corresponding ordered phase, are thermodynamically stable (Fig. S1a–c, ESI†). Although the chemically ordered phases are thermodynamically stable at room temperature, thermal processes up to 600–800 °C are usually required to overcome the energy barrier for atomic diffusion, which enables chemical arrangement and subsequent ordering formation.18,32,36 Among the different strategies proposed to promote the ordering process,37–40 the use of pre-ordered structures has been demonstrated to be highly efficient, being however mainly limited to thin film systems, where the kinetics of formation is enhanced by alternating deposition of monoatomic layers of the two elements.41–44
:3 and 3:1 stoichiometric composition, where one atomic species occupies the vertices of the cube and the other atoms occupy its face centers. Above TO–D, chemically disordered face-centered cubic (fcc) A1 phases, which show significantly different chemical/physical properties compared to the corresponding ordered phase, are thermodynamically stable (Fig. S1a–c, ESI†). Although the chemically ordered phases are thermodynamically stable at room temperature, thermal processes up to 600–800 °C are usually required to overcome the energy barrier for atomic diffusion, which enables chemical arrangement and subsequent ordering formation.18,32,36 Among the different strategies proposed to promote the ordering process,37–40 the use of pre-ordered structures has been demonstrated to be highly efficient, being however mainly limited to thin film systems, where the kinetics of formation is enhanced by alternating deposition of monoatomic layers of the two elements.41–44
Following this concept, the authors of the present paper have recently developed an effective, single-step, easily scaled-up synthesis route, called pre-ordered precursor reduction (PPR),45,46 which exploits the intrinsic order of crystalline precursor salts mimicking the alternate structure of the ordered alloy,11,47–49 to synthesize highly-ordered L10 binary alloys by simple thermal treatment in the reductive atmosphere. Starting from M(H2O)6PtCl6 precursor salts (M = Fe, Co, Ni), a systematic work, by means of X-ray diffraction, transmission electron microscopy and magnetometry, was performed to study the PPR synthesis of highly ordered FePt, CoPt and NiPt nanoparticle alloys, the latter being extremely challenging due to their low TO–D (TO–D,FePt ≈ 1300 °C, TO–D,CoPt ≈ 825 °C, TO–D,NiPt ≈ 655 °C)45 which results in a smaller driving force for ordering. The peculiar atomic arrangement in the crystalline structure of the precursor salts represents an additional driving force for the direct formation of the fct MPt alloy during the heating process, which occurs under milder conditions (in terms of processing temperature and reaction time) with respect to ordinary thermal treatments. Despite the isostructural character of the initial and final compounds, significant differences in the process, evidenced by a different number of steps in the thermogravimetric curves, and time/temperature dependence of the ordering degree have been observed in the Fe-, Co- and Ni-based compounds.45 The occurrence of two main mechanisms, i.e., a gas–solid reaction and an L10 ordering process, the latter being driven by the thermally assisted diffusion of the atoms within the structure, as well as by a different reduction potential of cations Fe++, Co++ and Ni++ (E0(Fe++/Fe0) = −044 V; E0(Co++/Co0) = −0277 V; E0(Ni++/Ni0) = −0257 V)50,51 were considered as the basis of the observed differences, although it was not possible to fully disclose the underlying mechanism.
In the present work, in situ X-ray absorption spectroscopy (XAS) experiments were carried out to investigate the structural evolution from the M(H2O)6PtCl6 precursor salts to the MPt L10 alloys during the thermal treatment. Extended X-ray absorption spectroscopy (EXAFS) represents an effective tool to probe the chemical environment around an absorber element and to obtain information about the average structural features of a material, being thus complementary to conventional X-ray diffraction (XRD) techniques.52 Its main strength resides in the fact that, being a local probe, it does not depend on long-range order thus permitting studying the formation of new phases even at their first stages. Due to its peculiar characteristics, i.e., selectivity and high sensitivity, EXAFS analysis represents the leading technique to investigate the local properties of a broad range of materials whose behavior is strongly affected by the atomic arrangement, as in the case of L10 or L12 chemically ordered alloys.53–58 Combining EXAFS measurements and thermal analyses allowed elucidation of the mechanism at the basis of the PPR process thus paving the way for the application of such an effective synthesis approach to the preparation of many other binary and ternary alloys (e.g., FeNi, MnAl, MnFePt, etc.), by properly selecting the starting salts, as recently proved by the authors of the present paper for the L10-FeNi alloy.59
2. Experimental
Powders of crystalline M(H2O)6PtCl6 (M = Fe, Co, Ni) precursor salts were synthesized from a 0.5 M aqueous solution containing equal atomic concentrations of H2PtCl6*H2O and MCl2*H2O (all reagents were purchased from Aldrich). The reaction begins immediately after mixing the reactants with the production of HCl gas according to the reaction:| H2PtCl6·6H2O + MCl2·6H2O → M(H2O)6·PtCl6↓ + 2HCl↑ + 6H2O |
As H2PtCl6·H2O and M(H2O)6·PtCl6 are both thermolabile compounds, the temperature was kept below 50 °C to avoid the reduction of Pt. After slow solvent evaporation at room temperature, hexagonal crystals precipitated; they were collected and purified by re-crystallization in ethylic alcohol.45
EXAFS characterization was carried out by collecting data at the Fe, Co, Ni, and Pt absorption edges on the “LISA” CRG beamline (BM-08)60 at the European Synchrotron Radiation Facility (ESRF, Grenoble – France). The samples were measured using a pair of Si (111) flat monochromatic crystals and Si-coated mirrors (Ecutoff 15 keV) for the rejection of higher harmonics. Data were collected in transmission mode in a position out of the mirror focus to obtain a homogeneous beam with large dimensions (about 2 × 2 mm2). The samples of M(H2O)6PtCl6/BN pellets (∼2 mm thick) were placed into a heating cell (Microtomo) designed for in situ X-ray absorption experiments at high temperature and in a reactive atmosphere.61 Based on the typical process temperatures observed in the previous study,45 the annealing was performed in the EXAFS experimental chamber by heating the samples up to a final temperature between 500 °C and 600 °C (depending on the system)45 with a rate of 5 °C min−1, under an H2/Ar reductive atmosphere. Before the in situ experiment, the process reproducibility was tested by comparing the EXAFS spectra of the sample after treatment with the ex situ spectra of an L10 FePt sample obtained from the home furnace (Fig. S2, ESI†). Quick-EXAFS spectra were collected at the M-K and Pt-LIII edges in the transmission mode during two separate processes for each system, to follow the chemical/structural evolution around the two elements during the treatment. The monochromator was run in ‘channel-cut’ mode with a continuous scan of the Bragg angle during data acquisition. Spectra of 20s each were collected every 50 °C of the heating process. The same apparatus was also used to carry out static EXAFS experiments at room temperature before and after the treatments by using the conventional ‘fixed exit’ and ‘step-scan’ modes. XAS data extraction and fitting were carried out with the ATHENA and ARTEMIS codes;62 model atomic clusters centered on the absorber atom were obtained using ATOMS,63 while quantitative modelling was based on simulated EXAFS signals using the FEFF8.1 code.64
Powder X-ray diffraction (XRD) measurements were performed using a Seifert 3003 TT diffractometer equipped with a secondary graphite monochromator, using Cu Kα radiation (λ = 1.5418 Å). The data were collected in the 10°–90° 2θ range with a step-size of 0.02°, counting 2 s per step. Full profile refinements of the experimental data were performed using MAUD software.65
The selected samples were dispersed in hexane and sonicated, and the obtained suspensions were then dropped on carbon-coated copper grids for TEM observation. TEM/HRTEM images were obtained using a JEM 2010 UHR equipped with a Gatan Imaging Filter (GIF) with a 15 eV window and a 794 slow scan CCD camera.
For magnetic characterization, the samples have been immobilized and fixed with glue into the sample-holder gelatine capsules. The room temperature magnetization M vs. magnetic field H (M–H) loops were measured by using a vibrating sample magnetometer (VSM, Microsense, Model 10) with a maximum applied field of 2 T and a Quantum Design superconducting quantum interference device (SQUID) with a maximum applied field of 5 T.
3. Results and discussion
EXAFS measurements of the precursor salts and the L10 alloys obtained after thermal treatment give evidence of the strong isostructural character of the initial and final compounds in the three systems (Fig. 1), according to what was already observed by the XRD analysis, discussed in detail in ref. 45. As previously reported in ref. 47, the initial precursor crystal consists of octahedral [M(H2O)6]2+ cations and [PtCl6]2− anions held together by an extensive system of hydrogen bonds involving water molecules and chlorine atoms resulting in two families of alternate monoatomic planes (Fig. 1a).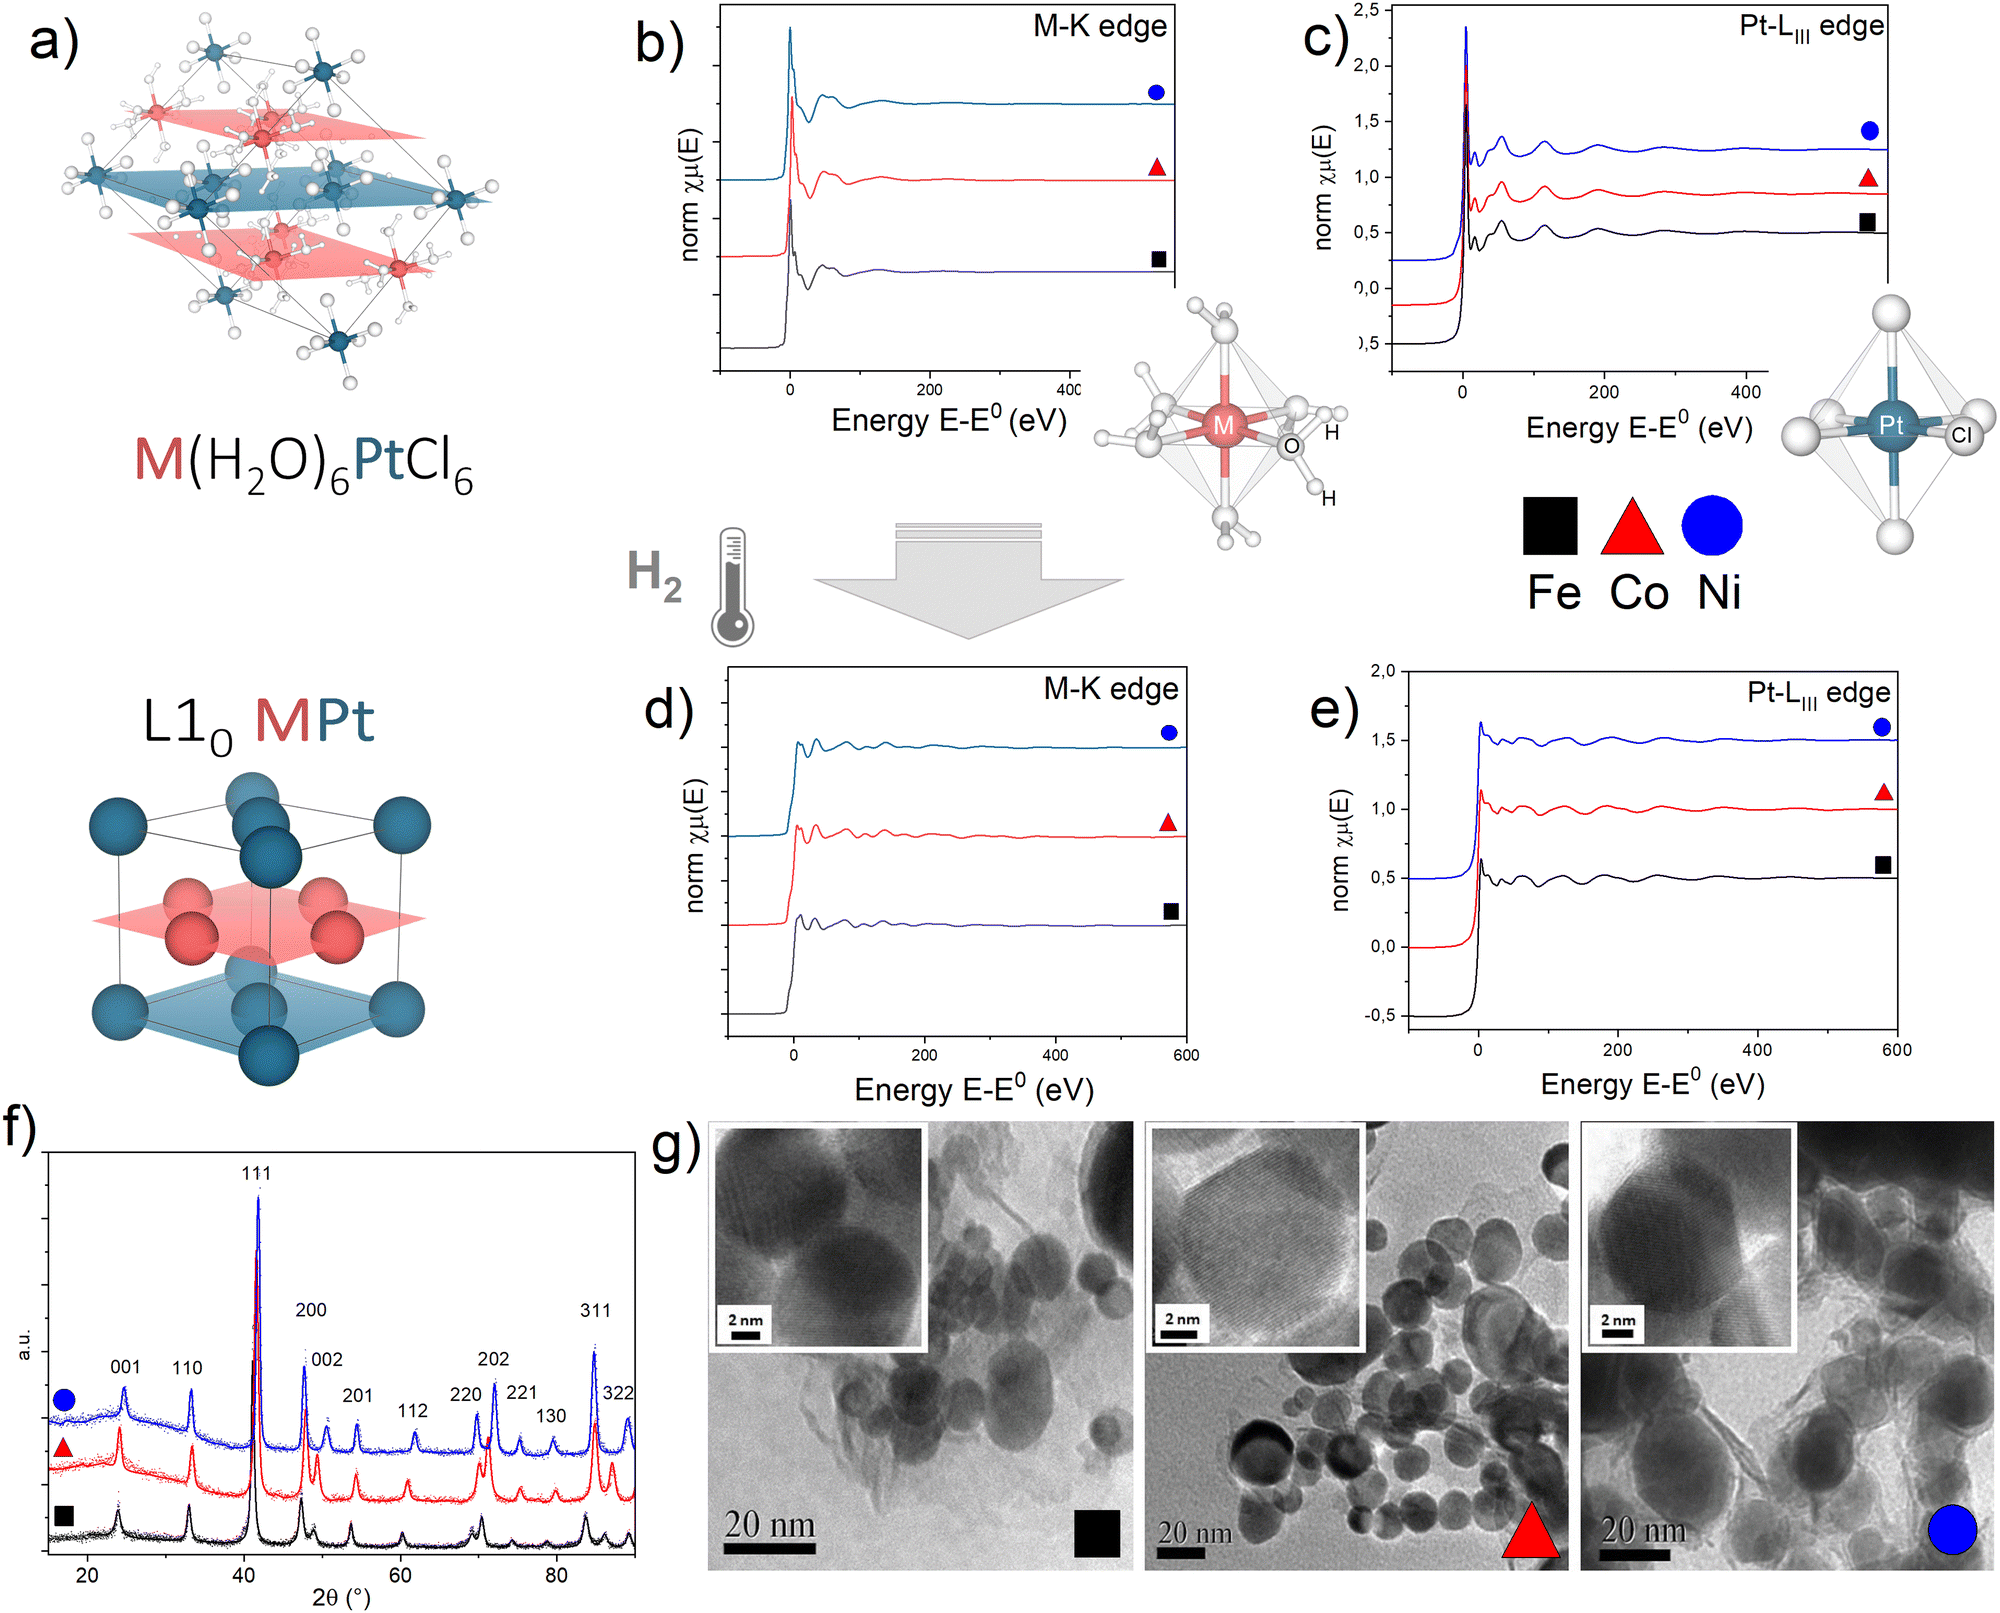 | ||
| Fig. 1 (a) Crystallographic structure of the M(H2O)6PtCl6 precursor salt and the L10 MPt alloy obtained by thermal reduction in H2 (M = Fe, Co, Ni); M and Pt atoms lie on alternating planes highlighted in red (M) and blue (Pt) resembling the atomic arrangement of the L10 MPt. (b)–(e) Normalized absorption spectra at the (b) and (d) M-K edge and (c) and (e) Pt-LIII edge for the initial (a) and (b) and final (d) and (e) compounds. To allow evidence of the isostructural character of the three initial and final compounds, the spectra of the Fe-based (black squares), Co-based (red triangles) and Ni-based (blue circles) compounds are reported on the same plots. The sketches in figures (b) and (c) represent the first coordination shell of the M (b) and Pt (c) atoms in the precursor compounds. (f) Typical XRD pattern of the L10 phases obtained in the best PPR conditions for each compound;45 calculated values of the long range order parameters (S), according to the equation presented in ref. 45 are 0.96 (FePt), 0.94 (CoPt, NiPt). (g) Representative TEM and HR-TEM images (insets) of the L10 nanoparticles. Detailed XRD and TEM analyses are available in previous reports.11,45,46 | ||
For each system, optimized time and temperature conditions allowed the synthesis of highly ordered FePt, CoPt and NiPt alloy nanoparticles with a particle size in the 5–50 nm range and with a statistical average diameter of ∼20 nm, as evidenced by the TEM images at low magnification (Fig. 1g) and in high-resolution mode (HR-TEM) (Fig. 1g, insets) reported as an example. High-resolution TEM images indicate the high degree of crystallinity of the nanoparticles and show the lattice fringes of about 2.2 Å, typical for the most intense XRD peak (not reported). The high long range order parameter (S > 0.9), calculated from the tetragonality ratio (c/a) derived from the XRD data (Fig. 1f) resulted, for example, in large coercivity values (up to μ0Hc ∼ 1.5 T) for the FePt system (Fig. S3, ESI†); a detailed correlation between the PPR conditions and the resulting magnetic and structural properties is reported elsewhere.45
A quantitative determination of the structural parameters in the initial and final compounds was carried out by analysing the ex situ absorption spectra at the M-K edges (Fig. 1b and d) and Pt-LIII edges (Fig. 1c and e) for all the systems. The analysis of the first shell neighbours was performed in the Fourier-transformed space (R space) in the range R = [1.7–3.5] Å, for the k2-weighted EXAFS data [k = 2–13 Å−1] using Hanning windows with apodization parameter dk = 1 Å−1. The free fitting parameters used in the analysis are the Pt–Cl and M–O distances (for the precursor salt), the Pt–Pt and Pt–M distances (for the L10 phase), the amplitude reduction factor S02, the shift of the energy origin ΔE0, and the Debye–Waller Factor (DWF) σ2. To minimize the number of free parameters, the DWF was calculated using a correlated Debye model66 with a single temperature value (defined as the CDMT parameter, in Table 1), accounting for the DWF of Pt–Pt and Pt–M distances in the alloy. In Fig. 2, the EXAFS signals at the Pt-LIII and M-K edges and the relative Fourier Transform (FT) are reported for the FePt L10 system as a representative example (all spectra and relative fittings are reported in Fig. S4 and S5, ESI†). It is worth noting that, for the analysis of the L10 alloys, the high quality of the EXAFS data in a wide k-range up to 14 Å−1 for the M-K edge and 20 Å−1 for the Pt-LIII edge allowed simultaneously fitting the main FT peaks of the two data sets, which represent the first coordination shell around the absorber atoms. According to the fct ordered structure, the fitting model was based on Fe–Pt, Fe–Fe and Pt–Pt scattering paths calculated on the basis of the structural parameters obtained by the previous XRD analysis.45
| Precursor salt | L10-alloy | ||||||
|---|---|---|---|---|---|---|---|
| r Pt–Cl (Å) (ref: 2.3254 Å) | r M–O (Å) (ref: 2.132 Å) | σ 2 (10−3 Å2) | r Pt–Pt (Å) (ref: 2.698–2.758 Å) | r M–Pt (Å) (ref: 2.667–2.695 Å) | CDMT (K) | ||
| FePtCl6 | 2.32 ± 0.01 | 2.10 ± 0.01 | 4 ± 1 (Fe) | FePt | 2.722 ± 0.006 | 2.667 ± 0.004 | 340 ± 20 |
| 2 ± 1 (Pt) | |||||||
| CoPtCl6 | 2.27 ± 0.01 | 2 × 2.13 ± 0.01 | 3 ± 1 (Co) | CoPt | 2.687 ± 0.005 | 2.643 ± 0.004 | 340 ± 10 |
| 2.35 ± 0.01 | 4 × 1.99 ± 0.01 | 1 ± 1 (Pt) | |||||
| NiPtCl6 | 2.26 ± 0.01 | 2.13 ± 0.01 | 4 ± 1 (Ni) | NiPt | 2.686 ± 0.005 | 2.619 ± 0.005 | 280 ± 10 |
| 2.35 ± 0.01 | 1 ± 1 (Pt) | ||||||
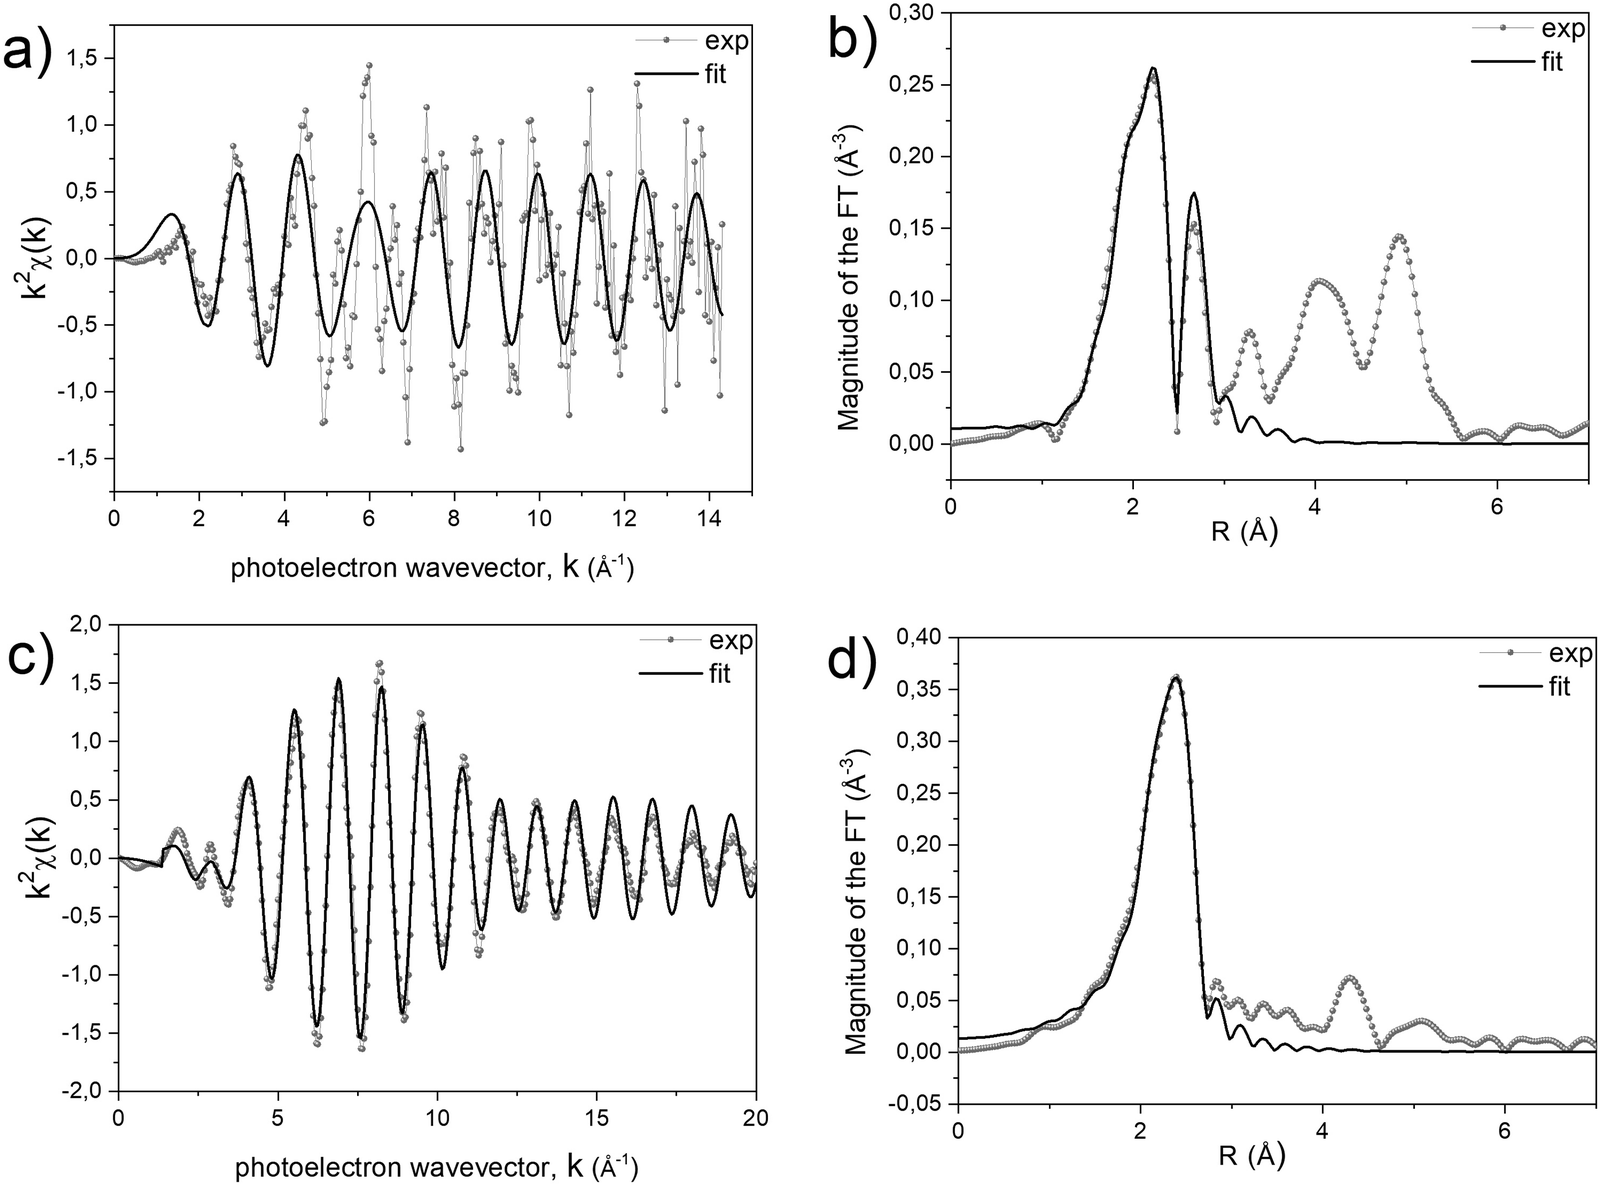 | ||
| Fig. 2 (a) and (c) Experimental and fitted EXAFS signals and (b) and (d) corresponding Fourier transforms at the Fe-K (a) and (b) and Pt-LIII edges (c) and (d) of the L10 FePt alloy obtained after the treatment at 600 °C in the EXAFS chamber. | ||
The results of the analysis, summarized in Table 1, confirm the isostructural characteristics of the compounds and their independence from the chemical nature of the 3d element. Indeed, by suitably choosing the initial salt, the PPR strategy allows obtaining chemically ordered tetragonal structures (L10) where each Pt atom is surrounded by 12 neighbors (4 in-plane Pt atoms and 8 out-of-plane M atoms) and vice versa.
With the aim of fully elucidating the mechanism at the basis of the PPR reaction, two different in situ experiments were carried out for each system to collect two sets of data for both metals. In Fig. 3, we present an illustrative representation of the data obtained at the Pt-LIII edge (Fig. 3a and c) and the Fe-K edge (Fig. 3b and d) during the in situ processes, focusing on the Fe-based compound.
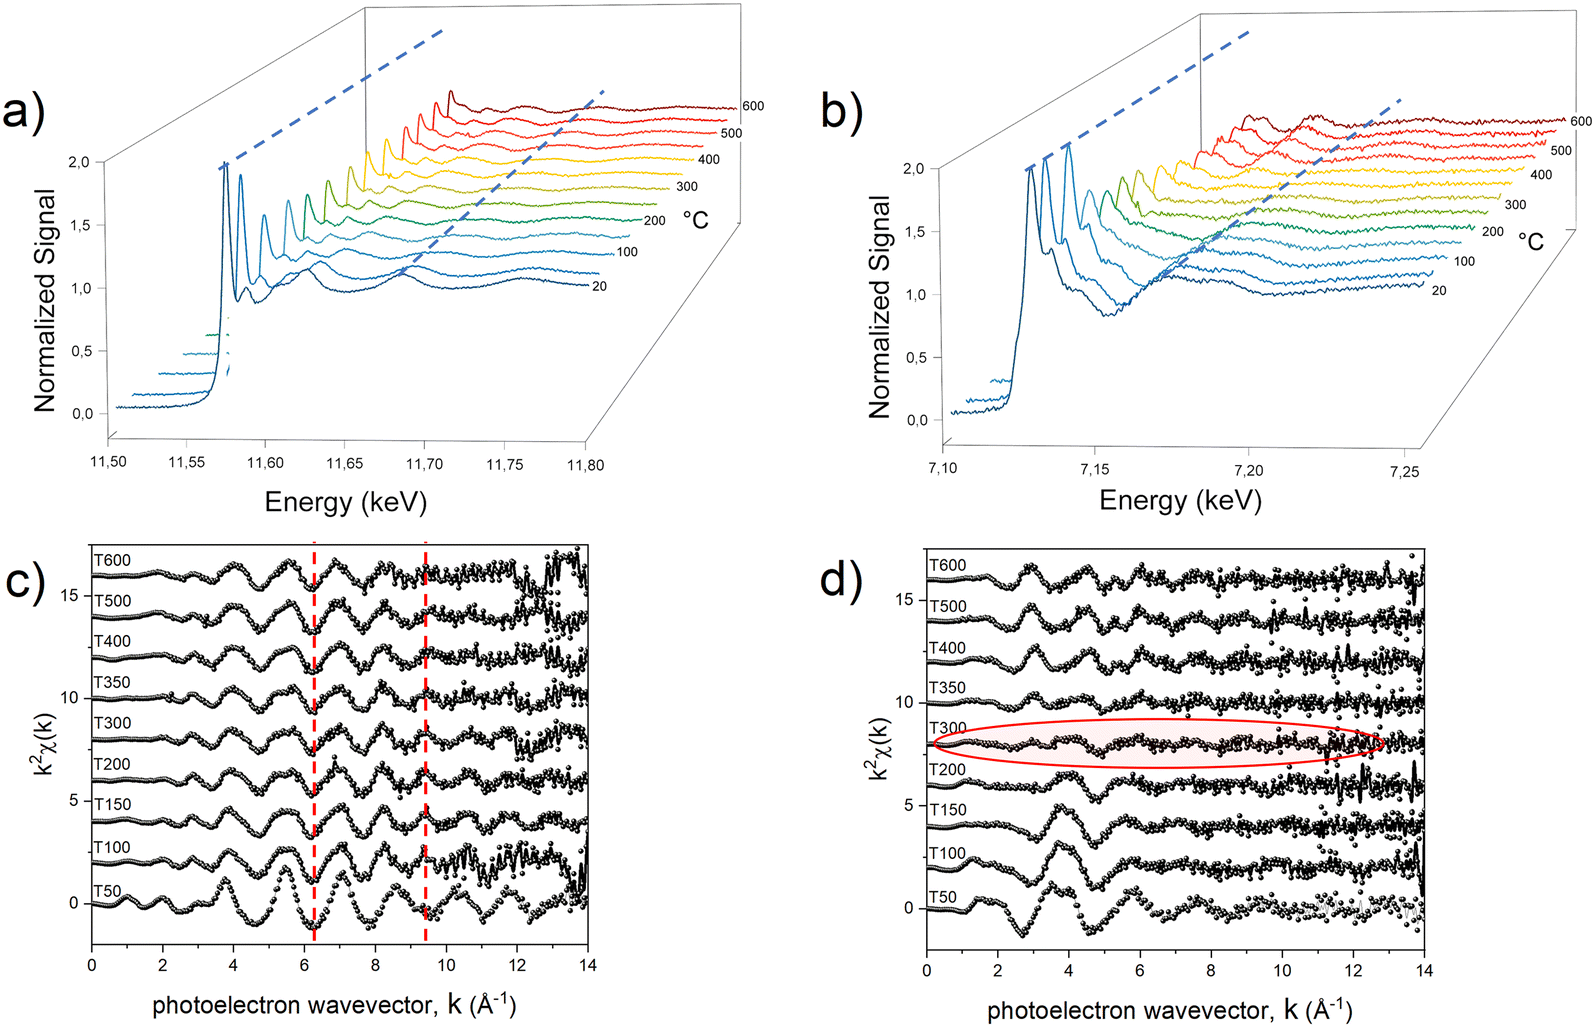 | ||
| Fig. 3 Temperature dependence of the in situ normalized absorption spectra at the Pt-LIII (a) and Fe-K (b) edges. Selected EXAFS oscillations at the Pt-LIII (c) and Fe-K edges (d). The dotted lines guide the eye in visualizing the variation of absorption spectra (blue, panel a) and EXAFS oscillation (red, panel c) during the treatment. The red shadow in panel (d) highlights the almost flat EXAFS signal arising from the counterbalance between the Fe–O and Fe–Pt scattering paths. | ||
The comparison in terms of main oscillations related to the first shell scattering contributions is useful in revealing the critical temperature associated with the change in the chemical environment and electronic state of the absorber metals. The qualitative observation of the temperature-dependent absorption spectra indicates that two separate reduction processes occurred within the compound during the heating treatment, with the most evident change (indicating strong chemical/structural variation) occurring in different temperature ranges for the two metals. At approximately 100 °C, a notable transformation becomes evident around the Pt absorber (Fig. 3a), as clearly visible by the change of the LIII absorption edge peak (white line), whose intensity provides information on the occupation of the 5d orbitals; a higher occupation results in a less intense white line, indicating a lower oxidation state (reduction).67 This variation is reflected in a noticeable change in the frequency of oscillations in k-space (Fig. 3c).
On the other hand, the Fe signal retains its primary characteristics (i.e. an octahedral arrangement involving six oxygen atoms, as indicated by the structure sketch in Fig. 1b) up to around 200 °C (Fig. 3b and d). Beyond this temperature threshold, the oscillations associated with oxygen ions surrounding the 3d metal diminish and are offset by the emergence of oscillations associated with the Fe–Pt scattering paths (Fig. S6, ESI†).
To investigate in more detail the structural evolution as a function of temperature, the EXAFS signal for each absorption spectrum was extracted and the data were fitted at the Pt-LIII edge, which is characterized by a higher resolution (Fig. S7, ESI†), with a combination of the scattering paths of the initial and the final compounds (i.e., Pt–Cl; Pt–M, Pt–Pt). The amplitude of each path, corresponding to the number of scattering elements in the first shell, was kept as a free-fitting parameter. In Fig. 4, the results in terms of salt fraction (represented by the Pt–Cl paths) and Pt–Fe paths are reported and compared to the thermogravimetric analysis (TGA) curves discussed in more detail in ref. 45. The decrease in the salt percentage reported in Fig. 4d, e and f well correlates with the TGA weight losses (Fig. 4a–c), showing an almost single step for the Ni-based system and the formation of intermediate compounds for the Fe- and Co-based systems. The in situ EXAFS analysis of the Fe-based system shows that in the first stage of the heating treatment, the salt percentage (obtained by calculating the contribution of the number of Pt–Cl neighbors to the signal) is strongly reduced, indicating that the process starts with the reduction of the Pt ions, supported by the H2 atmosphere and by the subsequent release of the Cl atoms from the structure. The resulting compound is characterized by the combination of Pt–Cl distances, whose number decreases with temperature, and Pt–Pt and Pt–Fe distances, which appear already at around 100 °C and whose balance remains quite stable up to a temperature of about 300 °C. According to the number of first neighbors, the intermediate alloy characterized by 4 Pt–Fe and 8 Pt–Pt distances is compatible with the presence of regions of the cubic FePt3 phase. However, the EXAFS technique does not allow distinguishing between the chemically ordered cubic L12 and the disordered fcc A1 FePt3 structures due to the same lattice geometry, the quite similar elemental distribution of the first shell neighbors (the Pt neighbors around each Pt atom are 3 in the disordered state and 4 in the ordered one), as well as for the random distribution of the crystallites in the powder sample. Nevertheless, according to the thermodynamic phase diagram and considering the high degree of chemical order that is intrinsically present in the initial crystal and observed in the final alloy, it may be assumed that during the Cl loss, nucleation of a Pt-rich chemically ordered FePt3 (L12) structure occurs and, above 300 °C (i.e., as long and the Fe reduction is concluded), it further evolves toward the FePt (L10) phase, whose chemical order results in 4 Pt–Pt and 8 Pt–Fe distances. However, a small fraction of disorder cannot be excluded a priori, since the hydrogen-assisted reduction implies several reaction steps, typical of the gas–solid reactions, which are expected to break the initial symmetry of the crystal thus reducing the perfect layered atomic order of the precursor salt. The occurrence of a small fraction of disordered regions at the end of the PPR was clearly evidenced by previous XRD studies.45
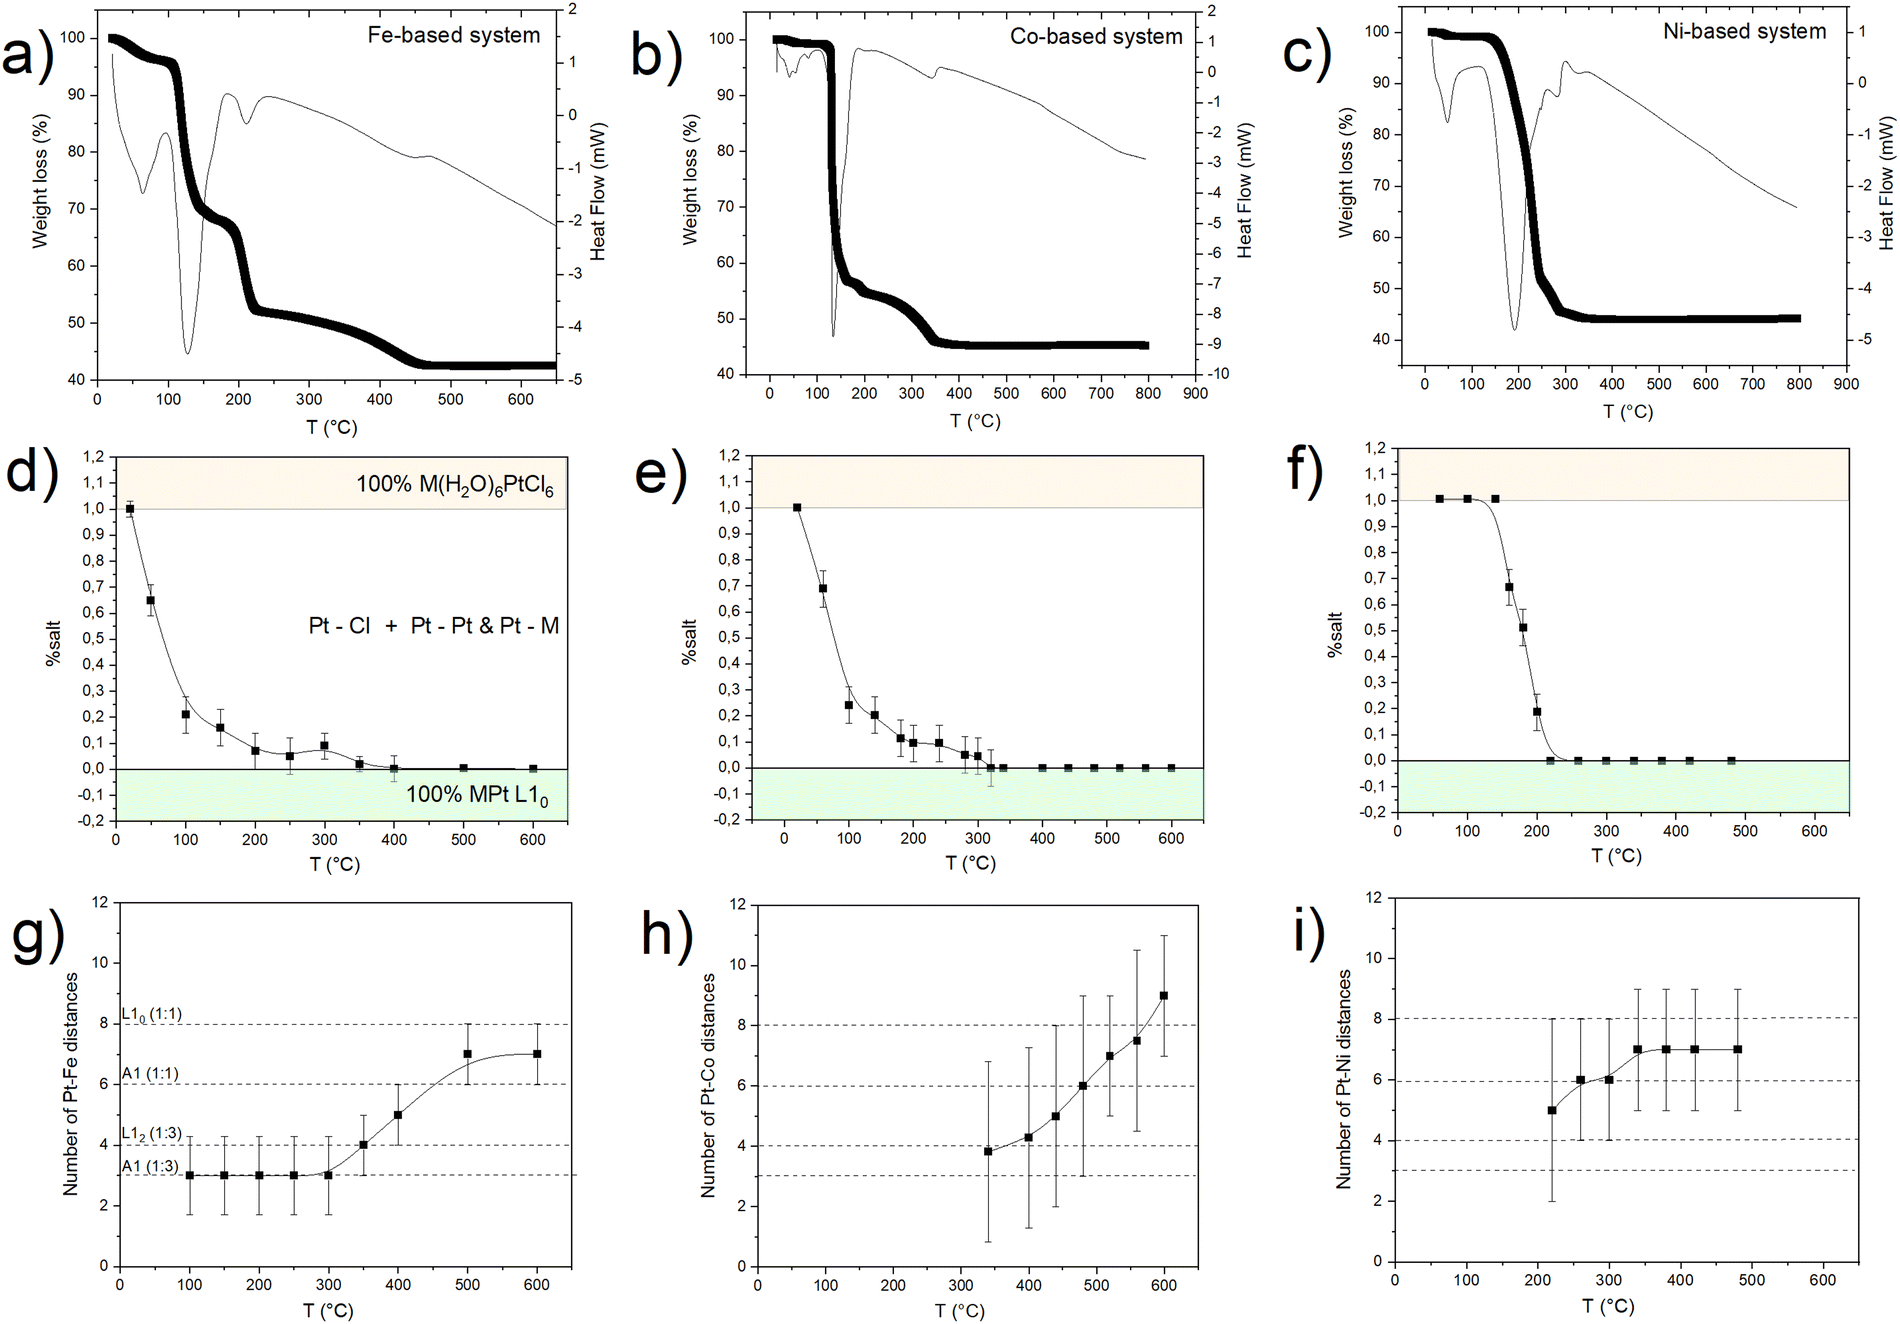 | ||
| Fig. 4 Comparison between the thermogravimetric analysis plots (TGA-DSC) (a)–(c) and the corresponding result of the in situ EXAFS analysis carried out at the Pt-LIII edge, in terms of salt fraction (d)–(f) and number of Pt–Fe distances (g)–(i) for the Fe(H2O)6PtCl6 (a), (d) and (g), Co(H2O)6PtCl6 (b), (e) and (h), and Ni(H2O)6PtCl6 (c), (f) and (i) compounds. | ||
The assumptions derived by the analysis at the Pt-LIII edge are confirmed by the investigation of the temperature-dependent spectra at the Fe-K edges (Fig. S8, ESI†). The analysis gives evidence of an evolution characterized by a slow release of oxygen atoms around the 3d metal, as demonstrated by the Fe–O signal that is visible up to around 350 °C. Such oscillation is counterbalanced by the effect of the Fe–Pt scattering paths, whose contribution increases with temperature, being responsible for the quasi-cancellation of the EXAFS signal, as shown in Fig. 3d and, with better detail, in Fig. S6 (ESI†). In the intermediate range of temperature, i.e., between 250 °C and 350 °C, there is no evidence of Fe–Fe contributions, which start affecting the Fe-K edge signal after 350 °C. At this point, we hypothesize that with the last reduction of the Fe++ cations, the L12 phase evolves towards a transient ordered arrangement where the atoms are at the positions of a face-centered cubic lattice before collapsing into the L10 equiatomic tetragonal phase. The absence of Fe–Fe paths in the fitting of the intermediate phases confirms the assumption of the initial formation of FePt3 clusters in its chemically ordered cubic structure (L12), thus supporting the results obtained at the Pt-edge. In other words, the combination of the analysis carried out at the two edges gives clear evidence of a structural evolution that depends on the different reducing temperatures of the two metals in the salt. However, the chemical order naturally occurring in the initial crystal is mostly retained along the whole process and may be responsible for the high degree of order obtained in the final compound by this method, which exploits milder conditions with respect to the high temperature/long time treatments that are required in conventional processes based on the disordered–ordered transition.
A similar behavior was observed for the Co-based compound, with a trend in the Pt–Cl scattering contribution which resembles that of the Fe-based system (Fig. 4e). However, from the analysis of the number of Pt–Co distances (despite the large error bars) there is no evidence of a Pt-rich, stable intermediate alloy until a temperature of 350 °C, where Cl− oxidation is complete and the elemental balance in the first shell neighbors is fully compatible with the CoPt3 alloy. At this stage, as in the previous case, the Co-K edge analysis gives evidence of Co–Pt and Co–O distances, thus confirming the coexistence of oxidized and metallic phases. Once formed, by further increasing the temperature, the reduction ends, and the system rapidly transforms into the L10 CoPt alloy.
By applying the same in situ analysis to the Ni(H2O)6PtCl6 system, a different behavior is observed. The abrupt reductive process, evidenced by both the weight loss in the TGA (Fig. 4c) and by the rapid decrease of the Pt–Cl contribution to the EXAFS signal (Fig. 4f), does not give indication of the formation of a NiPt3 intermediate structure in the whole temperature range. Indeed, as soon as the Pt–Ni scattering signal appears, the high number of first shell neighbors is already compatible with a 50:50 composition, with 6 Pt–Ni distances that well-match with a disordered A1 structure. This result is consistent with the previous XRD and TGA studies presented in ref. 45 where the growth of distinguished grains of fully ordered (L10) and disordered (A1) phases, typical of an inhomogeneous system with the coexistence of two phases (more details in the ESI,† Fig. S1),25 was assumed to occur during the process. Despite the absence of an intermediate ordered NiPt3 phase and the disordering induced by the fast process, the ordered arrangement of Ni and Pt atoms in the precursor salt results in a key factor in obtaining the L10 NiPt fct alloy. We assume that the initial crystalline order favors the nucleation of L10 grains and facilitates the complete A1-L10 transformation although the TO–D value of the NiPt alloy is the lowest among the three systems. The simplified sketch reported in Fig. 5 represents a summary of the results obtained by the chemical and structural analysis carried out in the present and previous study of the PPR process (i.e., combining EXAFS and XRD results). In particular, the main differences between the Fe/Co- and the Ni-based systems are compared through the panels representing the possible compositions occurring during the PPR process for the three systems. In the initial stage of the process, the different reduction of the two metals induces a stoichiometric imbalance in the Fe-based and Co-based systems, with the consequent formation of a Pt-enriched alloy. Due to the naturally high ordering degree of the initial precursors, it is assumed that the systems evolve towards the thermodynamical stable L12 Fe(Co)Pt3 phase, albeit in slightly different temperature ranges for the two systems. On the other hand, the abrupt reduction of the Ni-based precursor directly leads to the NiPt alloy, which forms in both disordered and ordered phases, with no evidence of intermediate compounds. According to the phase diagrams, the thermodynamic stability of the L12 phases, which are different in the three systems, may be considered as a key factor in determining the PPR mechanism and, consequently, the differences in the temperature dependence of the chemical order degree evidenced in ref. 45. Similar to the MPt 1:1 case, the order–disorder transition temperature in correspondence of the 1:3 composition is higher for the FePt3 system (TO–D-FePt3 ∼ 1350 °C; TO–D-CoPt3 ∼ 850 °C; TO–D-NiPt3 ∼ 500 °C).33 This corresponds to a higher driving force and, consequently, to a higher stability of the intermediate FePt3 compound that forms as soon as the process starts and gradually evolves, by further reducing the compound, towards a highly ordered 1:1 FePt alloy. The lower driving force for CoPt3 formation, together with the higher reduction potential of Co++ with respect to the Fe++, implies a shorter temperature range in which different intermediate phases can coexist and this is further confirmed in the case of the Ni-based compound, where the formation of the chemically ordered NiPt3 phase is complicated by unfavorable thermodynamic constraints, thus explaining the single-step behavior observed in such a system. It is worthwhile evidencing that the evolution towards an L12-ordered phase does not represent a necessary condition to obtain the L10 phase in the PPR strategy; indeed, the Ni-based systems clearly demonstrate that the essential prerequisite is the atomic ordering of the initial precursor, which represents the necessary driving force to overcome the thermodynamic and kinetic limitations occurring in a typical disordered–ordered process. In Fig. S9 (ESI†) further evidence of the assumed differences between the processes is provided by the comparison of the EXAFS signals of the three compounds at the same intermediate temperature.
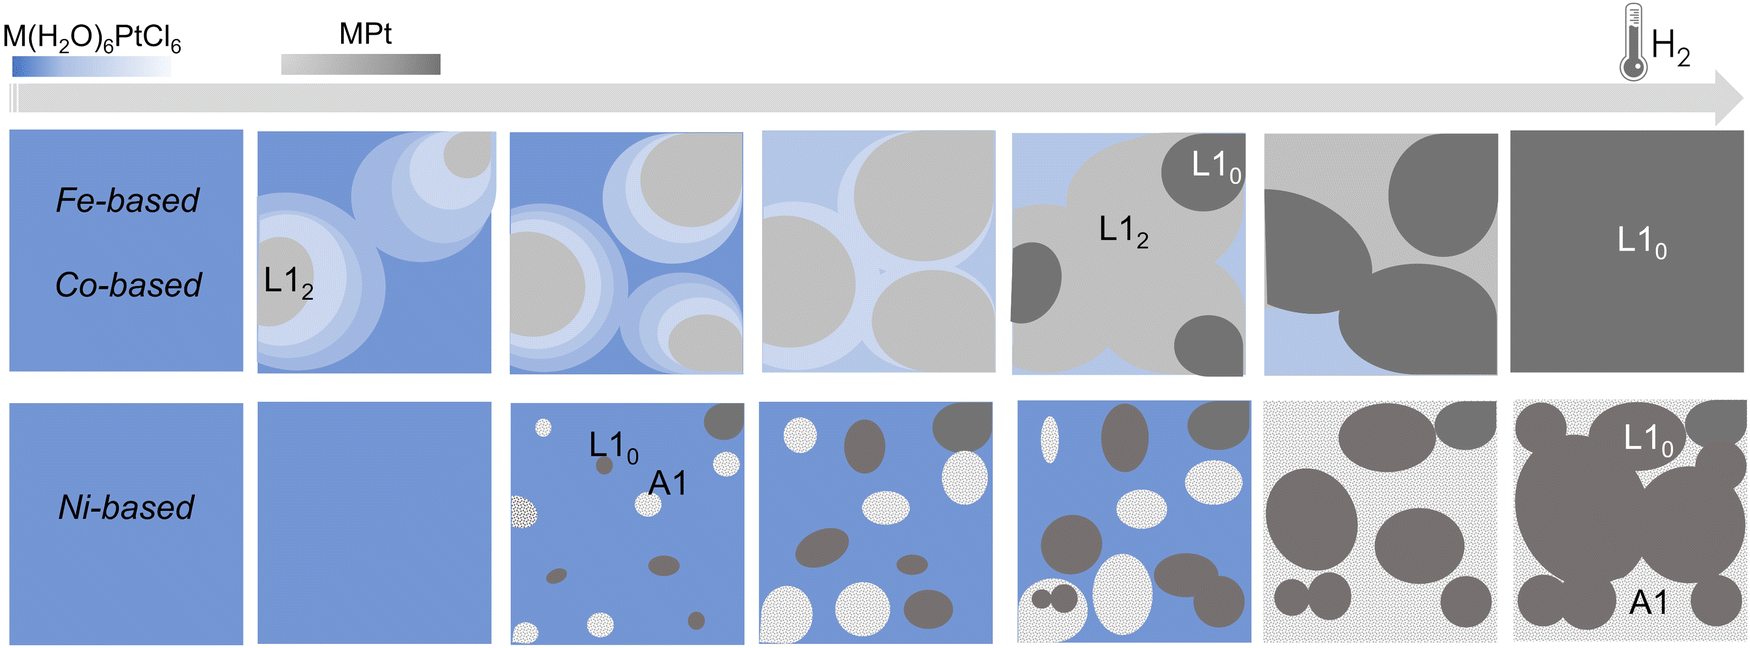 | ||
| Fig. 5 Simplified sketch of the structural and compositional evolution during the PPR processes for the three systems. In the Fe- and Co-based systems, the different reduction temperature of the two metals in the precursor leads to an unbalanced stoichiometry where a Pt-enriched intermediate alloys, corresponding to the chemically ordered L12 fcc phase, forms.25 For the Ni-based compound, the reduction leads to the nucleation of ordered (L10) and disordered (A1) grains, typical of an inhomogeneous system, consistently with the XRD results.45 The color gradients represent the expected compositional variation. | ||
To further support the validity of the prevsssious hypotheses, a suitable PPR treatment up to 300 °C was performed on the Fe-based system, i.e., on the system where the intermediate step of the TGA curve is appreciably in a large temperature range. The PPR transformation was stopped at the intermediate temperature, the sample was maintained at the final temperature for 2 hours and a full ex situ characterization of the final compound was performed. In Fig. 6, both the structural and the magnetic properties are fully compatible with the L12 FePt3 phase. The EXAFS spectra (Fig. 6a and b) acquired on both the metal edges were fitted with the theoretical scattering path generated by the L12 structure, where each Pt atom is surrounded by 4 Fe and 8 Pt neighbors while the first shell around Fe consists of 12 Pt neighbors. However, the Fe-K edge results are still affected by Fe–O scattering paths, responsible for the oscillation around k = 4, consistent with the in situ experiment. The room temperature magnetization loop shown in Fig. 6c is consistent with that of a system dominated by a paramagnetic contribution, as it would be expected from the L12 ordered phase, which is known to be paramagnetic at room temperature and shows two coexisting antiferromagnetic phases at Néel temperatures TN1 ∼ 160 K and TN2 ∼ 120 K.68,69 The deviation from purely paramagnetic behavior may be associated with the presence of small nuclei of the ferromagnetic FePt phase in the initial stage. The occurrence of an intermediate ordered structure was also confirmed by ex situ XRD measurements performed on a powder sample obtained, reproducing the same experimental conditions, in a larger amount and without the BN pellet that hides the signal of the alloy. The XRD pattern (Fig. 6d) shows the presence of superlattice reflections and was indexed according to the ordered cubic L12 structure (JCPDS card no. 29-716). The Rietveld fit of XRD data was performed refining background and scale parameters, the lattice parameter a, and microstructural and isotropic thermal parameters, leading to final Rw = 14.6% and χ2 = 1.01 (red curve in Fig. 6d). The lattice parameter a = 3.8683(4) Å obtained from the fit is in good agreement with the value of the L12 phase with 1:3 stoichiometry. The intermediate ex situ characterization confirmed the tendency of the PPR process to preserve the initial order of the precursor salt, by evolving towards chemically ordered intermediate phases, where allowed by thermodynamical and kinetic constraints (as for the Fe-based compound).
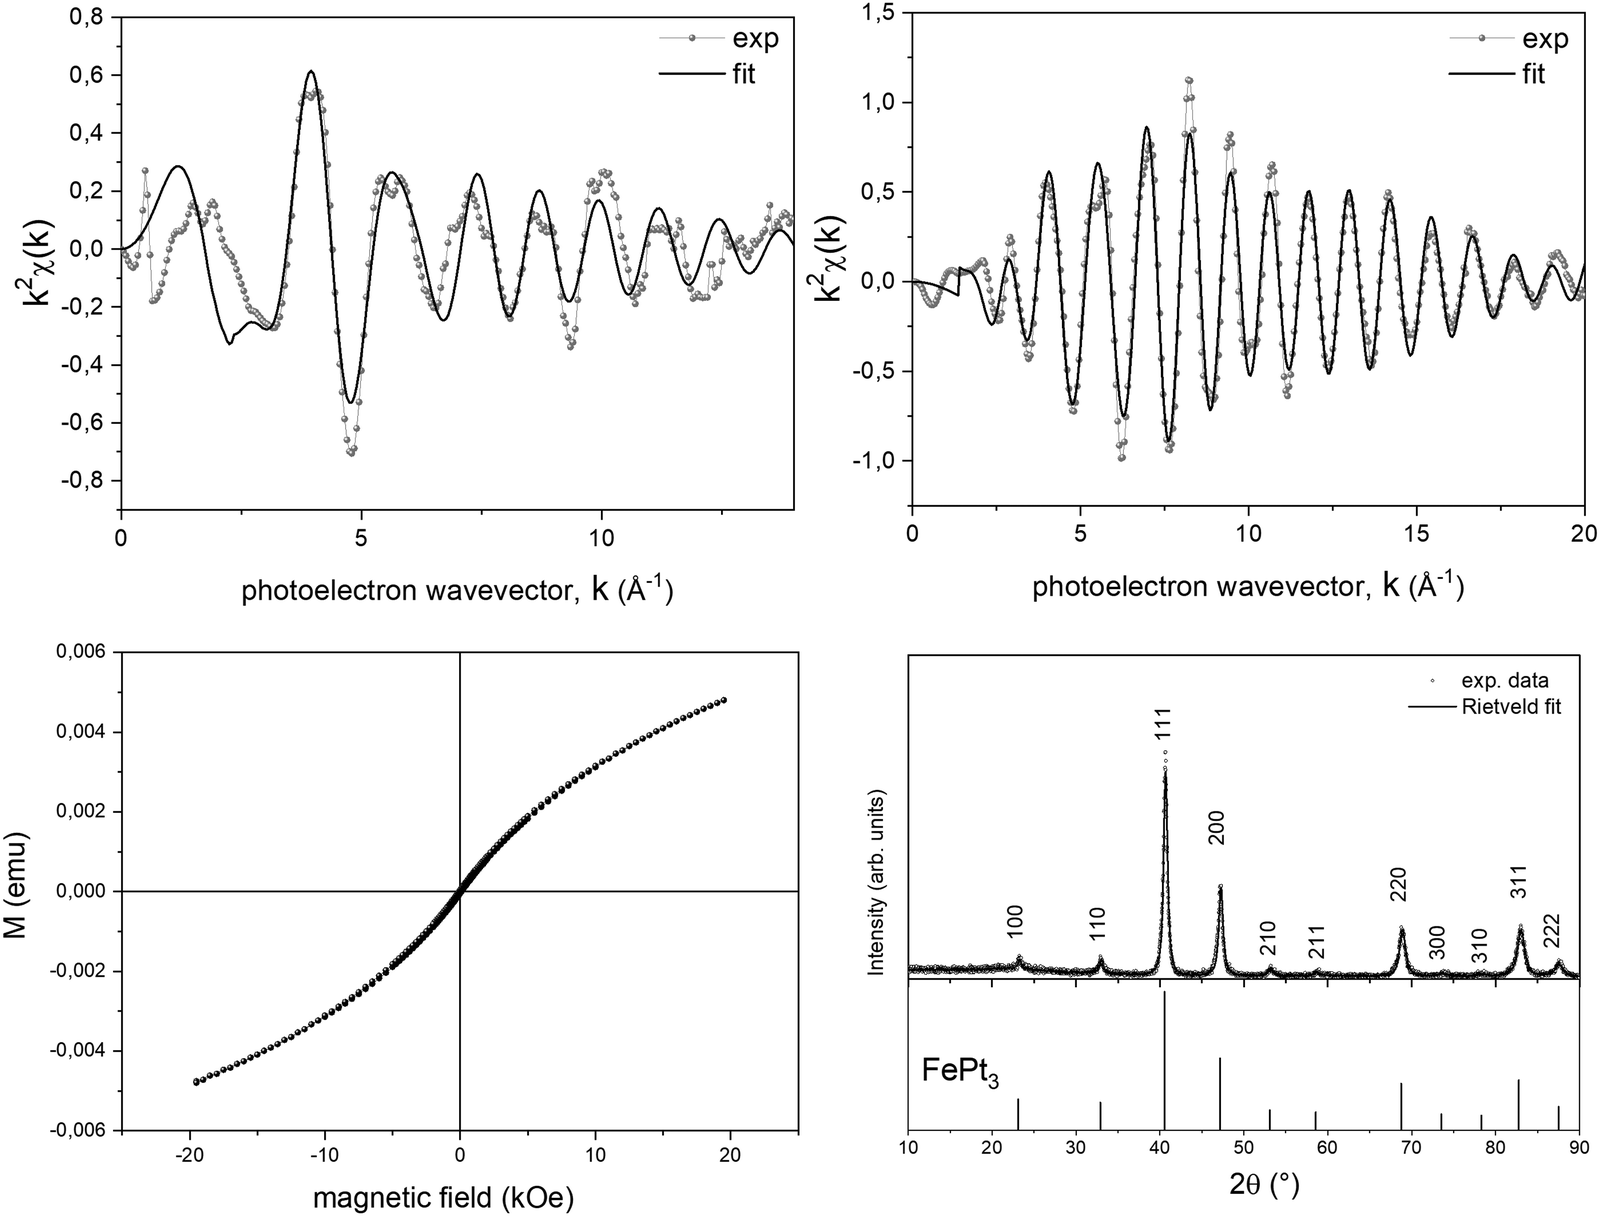 | ||
| Fig. 6 Ex situ structural and magnetic characterization of the Fe-based compound (FePt3) at the intermediate stage of the process (i.e., 300 °C): EXAFS oscillations at the Fe-K edge (a) and Pt-LIII edge (b); room temperature hysteresis loop (c) and X-ray diffraction pattern (d). Bragg positions of reference ordered FePt3 (JCPDS card no. 29-716) are reported. | ||
4. Conclusions
A comprehensive in situ and ex situ EXAFS analysis has been applied to elucidate the pre-ordered precursor reduction process, highlighting the elemental and structural evolution during the treatment of three different precursor salts with the same structure but different 3d metals M (Fe, Co, and Ni). The high atomic order naturally occurring in the initial precursor salt, although not fully retained for all systems, is considered as a fundamental driving force to kinetically favor the formation of the ordered phase. As a proof, the PPR applied to the Fe-based system provides clear evidence of the tendency of this process in retaining the initial order, through the formation of the chemically ordered L12-FePt3 intermediate alloy favored by the lower reducing temperature of Pt with respect to the Fe ions. In other words, although the L12 phase does not represent the final target product of the PPR approach, its occurrence as a reaction intermediate compound represents a significant clue for the comprehension of the synthesis mechanism. Indeed, wherever possible, the atomic order, characteristic of all the stable phases of the compounds involved in the process, allows counterbalancing the expected disorder provided by the complex reaction, which consists of a salt thermal treatment with hydrogen-assisted reduction. In any case, a lower driving force for the formation of ordered intermediate phases does not hinder the formation of the final ordered alloy, as in the case of the Co- and Ni-based compounds.The choice of a suitable crystalline precursor with the desired stoichiometry for obtaining highly ordered metallic alloys represents the key factor of the PPR methods and an innovative and valid alternative to the typical approaches where the order (i.e., L10 or L12 phases) is obtained by thermal activation of a diffusive process on a starting disordered alloy. For this reason, the PPR method is a potential synthesis approach that can be further extended, by properly selecting the precursor salt, for the synthesis under milder conditions than traditional thermal treatments of many other binary and ternary alloys, where the chemical order represents an indispensable property of the materials, as in the case of the L10-FeNi,59 L10-MnAl and L10-MnPt magnetic systems, which are of great interest for many applications including permanent magnets and spintronic devices.
Conflicts of interest
There are no conflicts to declare.Acknowledgements
G. V., S. L. and A. C. acknowledge the support from the Italian Ministry Research (MUR) under the PRIN program, project No. 2020PY8KTC (understanding and controlling magnetic inertia: towards terahertz spin-based technologies).References
- P. Tozman, Y. Takahashi, M. Venkatesan, L. Monzon, M. Coey and O. Kamer, Cryst. Res. Technol., 2022, 2200117, 1–6 Search PubMed.
- A. B. Kustas, D. F. Susan and T. Monson, JOM, 2022, 74, 1306–1328 CrossRef.
- Q. F. Xiao, E. Brück, Z. D. Zhang, F. R. de Boer and K. H. J. Buschow, J. Alloys Compd., 2004, 364, 64–71 CrossRef CAS.
- M. Gjoka, G. Sempros, S. Giaremis, J. Kioseoglou and C. Sarafidis, Materials, 2023, 16, 547 CrossRef CAS PubMed.
- W. Tang, G. Ouyang, X. Liu, J. Wang, B. Cui and J. Cui, J. Magn. Magn. Mater., 2022, 563, 169912 CrossRef CAS.
- G. Varvaro, A. M. Testa, E. Agostinelli, D. Fiorani, S. Laureti, F. Springer, C. Brombacher, M. Albrecht, L. Del Bianco, G. Barucca, P. Mengucci and D. Rinaldi, Mater. Chem. Phys., 2013, 141, 790–796 CrossRef CAS.
- S. Laureti, L. Del Bianco, B. Detlefs, E. Agostinelli, V. Foglietti, D. Peddis, A. M. Testa, G. Varvaro and D. Fiorani, Thin Solid Films, 2013, 543, 162–166 CrossRef CAS.
- S. Bae and N. Thiyagarajah, in Magnetic Thin Films: Properties, Performance and Applications, ed. J. P. Volkerts, Nova Science Publisher, Inc., 2011, pp. 1–409 Search PubMed.
- I. Fina and J. Fontcuberta, J. Phys. Appl. Phys., 2020, 53, 023002 CrossRef CAS.
- S. Sun, Adv. Mater., 2006, 18, 393–403 CrossRef CAS.
- X. C. Hu, E. Agostinelli, C. Ni, G. C. Hadjipanayis and A. Capobianchi, Green Chem., 2014, 16, 2292–2297 RSC.
- N. Chavan, D. Dharmaraj, S. Sarap and C. Surve, J. Drug Delivery Sci. Technol., 2022, 77, 103899 CrossRef CAS.
- B. Shen and S. Sun, Chem. – Eur. J., 2020, 26, 6757–6766 CrossRef CAS PubMed.
- Ultra-High-Density Magnetic Recording: Storage Materials and Media Designs, ed. G. Varvaro and F. Casoli, Pan Stanford Publishing, 2016 Search PubMed.
- P. Kumari, A. K. Gupta, R. K. Mishra, M. S. Ahmad and R. R. Shahi, J. Magn. Magn. Mater., 2022, 554, 169142 CrossRef CAS.
- A. Hirohata, K. Yamada, Y. Nakatani, L. Prejbeanu, B. Diény, P. Pirro and B. Hillebrands, J. Magn. Magn. Mater., 2020, 509, 166711 CrossRef CAS.
- A. Ghotbi Varzaneh, P. Kameli, F. Karimzadeh, B. Aslibeiki, G. Varvaro and H. Salamati, J. Alloys Compd., 2014, 598, 6–10 CrossRef CAS.
- J. Li, S. Sharma, X. Liu, Y. T. Pan, J. S. Spendelow, M. Chi, Y. Jia, P. Zhang, D. A. Cullen, Z. Xi, H. Lin, Z. Yin, B. Shen, M. Muzzio, C. Yu, Y. S. Kim, A. A. Peterson, K. L. More, H. Zhu and S. Sun, Joule, 2019, 3, 124–135 CrossRef CAS.
- M. Mandal, A. Das and D. De, J. Magn. Magn. Mater., 2019, 475, 93–97 CrossRef.
- N. Qin, Y. Zhang, H. Zhou, Z. Geng, G. Liu, Y. Zhang, H. Zhao and G. Wang, J. Colloid Interface Sci., 2016, 472, 8–15 CrossRef CAS PubMed.
- Y. Pan, X. Du, F. Zhao and B. Xu, Chem. Soc. Rev., 2012, 41, 2912 RSC.
- P. P. Falciglia, E. Gagliano, P. Scandura, C. Bianco, T. Tosco, R. Sethi, G. Varvaro, E. Agostinelli, C. Bongiorno, A. Russo, S. Romano, G. Malandrino, P. Roccaro and F. G. A. Vagliasindi, Sep. Purif. Technol., 2022, 296, 121342 CrossRef CAS.
- T. Rasheed, J. Cleaner Prod., 2022, 362, 132338 CrossRef CAS.
- New trends in nanoparticles magnetism , ed. D. Peddis, S. Laureti and D. Fiorani, Springer International Publishing, 2021, vol. 308 Search PubMed.
- A. Cebollada, R. F. C. Farrow and M. F. Toney, Magnetic Nanostructures, American Scientific Publishers, Stevenson Ranch, 2002, ch. 3, p. 93 Search PubMed.
- D. Weller, O. Mosendz, G. Parker, S. Pisana and T. S. Santos, Phys. Status Solidi A, 2013, 1260, 1245–1260 CrossRef.
- M. T. Johnson, P. J. H. Bloemen, F. J. A. den Broeder and J. J. de Vries, Rep. Prog. Phys., 1996, 59, 1409–1458 CrossRef CAS.
- A. Verna, P. Alippi, F. Offi, G. Barucca, G. Varvaro, E. Agostinelli, M. Albrecht, B. Rutkowski, A. Ruocco, D. Paoloni, M. Valvidares and S. Laureti, ACS Appl. Mater. Interfaces, 2022, 14, 12766–12776 CrossRef CAS PubMed.
- M. Hassan, S. Laureti, C. Rinaldi, F. Fagiani, S. Varotto, G. Barucca, N. Y. Schmidt, G. Varvaro and M. Albrecht, Nanoscale Adv., 2021, 3, 3076–3084 RSC.
- J. Cui, M. Kramer, L. Zhou, F. Liu, A. Gabay, G. Hadjipanayis, B. Balasubramanian and D. Sellmyer, Acta Mater., 2018, 158, 118–137 CrossRef CAS.
- V. Baltz, A. Manchon, M. Tsoi, T. Moriyama, T. Ono and Y. Tserkovnyak, Rev. Mod. Phys., 2018, 90(015005), 1–57 Search PubMed.
- S. H. Whang, Q. Feng and Y. Gao, Acta Mater., 1998, 46, 6485–6495 CrossRef CAS.
- M. Fèvre, J. M. Sanchez, J. R. Stewart, J. S. Mérot, F. Fossard, Y. Le Bouar, K. Tanaka, H. Numakura, G. Schmerber and V. Pierron-Bohnes, Phys. Rev. B, 2020, 102, 1–13 CrossRef.
- M. F. Singleton, Bull. Alloy Phase Diagrams, 1989, 10, 258–262 CrossRef.
- A. A. Popov, A. D. Varygin, P. E. Plyusnin, M. R. Sharafutdinov, S. V. Korenev, A. N. Serkova and Y. V. Shubin, J. Alloys Compd., 2021, 891, 161974 CrossRef.
- U. Kumar, P. K. Mukhopadhyay, B. Sanyal, O. Eriksson and P. Nordblad, Phys. Rev. B: Condens. Matter Mater. Phys., 2006, 74, 064401 CrossRef.
- W. Lei, J. Xu, Y. Yu, W. Yang, Y. Hou and D. Chen, Nano Lett., 2018, 18, 7839 CrossRef CAS PubMed.
- X. Zhang, F. Zhang, Y. Zhang, Q. Kou, Y. Liu, L. Chen, Y. Wang and Y. Zhang, J. Supercond. Novel Magn., 2018, 31, 2553–2557 CrossRef CAS.
- D. Alloyeau, C. Ricolleau, C. Mottet, T. Oikawa, C. Langlois, Y. Le Bouar, N. Braidy and A. Loiseau, Nat. Mater., 2009, 8, 940 CrossRef CAS PubMed.
- C. Brombacher, H. Schletter, M. Daniel, P. Matthes, N. Jöhrmann, M. Maret, D. Makarov, M. Hietschold and M. Albrecht, J. Appl. Phys., 2012, 112, 073912 CrossRef.
- C. Huang, A. Sun, H. Wu, F. Yuan, J. Hsu, S. Hsiao, H. Lee, H. Lu, S. Wang and P. Sharma, IEEE Trans. Magn., 2014, 50, 3201804 Search PubMed.
- C. Lee, Y. Chen, L. Liu and J. C. A. Huang, Thin Solid Films, 2014, 570, 288–292 CrossRef CAS.
- S. Kumar, V. Srihari, G. Sharma, A. Gupta, V. R. Reddy, M. Gupta, A. Gome and K. Sharma, J. Magn. Magn. Mater., 2023, 567, 170327 CrossRef CAS.
- Y. Endo, K. Oikawa, T. Miyazaki, O. Kitakami and Y. Shimada, J. Appl. Phys., 2003, 94, 7222 CrossRef CAS.
- G. Varvaro, P. Imperatori, S. Laureti, C. Cannas, A. Ardu, P. Plescia and A. Capobianchi, J. Alloys Compd., 2020, 846, 156156 CrossRef CAS.
- A. Capobianchi, M. Colapietro, D. Fiorani, S. Foglia, P. Imperatori, S. Laureti and E. Palange, Chem. Mater., 2009, 21, 2007–2009 CrossRef CAS.
- A. Capobianchi, G. Campi, M. Camalli and C. Veroli, Z. Für Krist., 2009, 224, 384–388 CrossRef CAS.
- A. Capobianchi, S. Laureti, D. Fiorani, S. Foglia and E. Palange, J. Phys. Appl. Phys., 2010, 43, 474013 CrossRef.
- A. Capobianchi, M. Colapietro, D. Fiorani, S. Foglia, P. Imperatori, S. Laureti and E. Palange, Chem. Mater., 2009, 21, 2007–2009 CrossRef CAS.
- Standard Potentials in Aqueous Solution, ed. A. J. Bard, B. Parsons and J. Jordon, Dekker, New York, 1985 Search PubMed.
- ed. G. Milazzo, S. Caroli and V. K. Sharma, Tables of Standard Electrode Potentials, Wiley, Lodon, 1978 Search PubMed.
- G. Srajer, L. H. Lewis, S. D. Bader, A. J. Epstein, C. S. Fadley, E. E. Fullerton, H. Hoffmann, J. B. Kortright, Kannan M. Krishnanh, S. A. Majetich, T. S. Rahman, C. A. Ross, M. B. Salamon, I. K. Schuller, T. C. Schulthess and J. Z. Sun, J. Magn. Magn. Mater., 2006, 307, 1–31 CrossRef CAS.
- C. Meneghini, M. Maret, V. Parasote, M. C. Cadeville, J. L. Hazemann, R. Cortes and S. Colonna, Strain, 1999, 357, 347–357 Search PubMed.
- M. Krupinski, M. Perzanowski, A. Polit, Y. Zabila, A. Zarzycki, A. Dobrowolska and M. Marszalek, J. Appl. Phys., 2011, 109, 064306 CrossRef.
- N. Blanc, L. E. Díaz-Sánchez, A. Y. Ramos, F. Tournus, H. C. N. Tolentino, M. De Santis, O. Proux, A. Tamion, J. Tuaillon-Combes, L. Bardotti, O. Boisron, G. M. Pastor and V. Dupuis, Phys. Rev. B: Condens. Matter Mater. Phys., 2013, 87, 155412 CrossRef.
- F. Liscio, D. Makarov, M. Maret, H. Roussel and M. Albrecht, Nanotechnology, 2010, 21, 065602 CrossRef CAS PubMed.
- S. Laureti, C. Brombacher, D. Makarov, M. Albrecht, D. Peddis, G. Varvaro and F. D’Acapito, J. Appl. Crystallogr., 2014, 47, 1722–1728 CrossRef CAS.
- N. Y. Schmidt, S. Laureti, F. Radu, H. Ryll, C. Luo, F. Acapito, S. Tripathi, E. Goering, D. Weller and M. Albrecht, Phys. Rev. B, 2019, 100, 64428 CrossRef CAS.
- G. Varvaro, P. Imperatori, S. Laureti, D. Peddis, F. Locardi, M. Ferretti, C. Cannas, M. S. Angotzi, N. Yaacoub and A. Capobianchi, Scr. Mater., 2024, 238, 115754 CrossRef CAS.
- F. D’Acapito, G. O. Lepore, A. Puri, A. Laloni, F. La Manna, E. Dettona, A. De Luisa and A. Martin, J. Synchrotron Radiat., 2019, 26, 551–558 CrossRef PubMed.
- ESRF Microtomo Furnace, https://www.esrf.fr/cms/live/live/en/sites/www/home/UsersAndScience/support-and-infrastructure/support-labs/SampleEnvironment/sample-environments-available-on-our-beamlines/sample-environments-on-id19/micro-tomo-furnace.html.
- B. Ravel and M. Newville, Phys. Scr., T, 2005, T115, 1007–1010 CrossRef CAS.
- B. Ravel, J. Synchrotron Radiat., 2001, 8, 314–316 CrossRef CAS PubMed.
- A. L. Ankudinov, B. Ravel, J. J. Rehr and S. D. Conradson, Phys. Rev. B: Condens. Matter Mater. Phys., 1998, 58, 7565–7576 CrossRef CAS.
- L. Lutterotti, Nucl. Instrum. Methods Phys. Res., Sect. B, 2010, 268, 334–340 CrossRef CAS.
- S. I. Zabinsky, J. J. Rehr, A. Ankudinov, R. C. Albers and M. J. Eller, Phys. Rev. B: Condens. Matter Mater. Phys., 1995, 52, 2995 CrossRef CAS PubMed.
- D. J. Morris and P. Zhang, Chem.: Methods, 2021, 1, 162–172 CAS.
- V. Deepchand, V. Tzitzios and G. C. Hadjipanayis, AIP Adv., 2021, 11, 015312 CrossRef CAS.
- D. Kim and J. Hong, J. Magnesium, 2011, 16, 197–200 Search PubMed.
Footnote |
| † Electronic supplementary information (ESI) available. See DOI: https://doi.org/10.1039/d3tc02262e |
| This journal is © The Royal Society of Chemistry 2023 |