
 Open Access Article
 This Open Access Article is licensed under a Creative Commons Attribution-Non Commercial 3.0 Unported Licence
Towards a fast machine-learning-assisted prediction of the mechanoelectric response in organic crystals†
Daniele
Padula
 *a,
Leonardo
Barneschi
a,
Andrea
Peluso
b,
Tommaso
Cinaglia
a and
Alessandro
Landi
*b
*a,
Leonardo
Barneschi
a,
Andrea
Peluso
b,
Tommaso
Cinaglia
a and
Alessandro
Landi
*b
aDipartimento di Biotecnologie, Chimica e Farmacia, Università di Siena, Via A. Moro 2, 53100 Siena, Italy. E-mail: daniele.padula@unisi.it
bDipartimento di Chimica e Biologia Adolfo Zambelli, Università di Salerno, Via Giovanni Paolo II, I-84084 Fisciano, SA, Italy. E-mail: alelandi1@unisa.it
First published on 21st August 2023
Abstract
Organic semiconductors can improve the performance of wearable electronics, e-skins, and pressure sensors by exploiting their mechanoelectric response. However, identifying new materials for these applications is challenging due to the lack of fast and reliable computational protocols, whose major limitation is the computational burden required to evaluate the relevant figures of merit from first principles. To overcome this challenge, we present a new protocol that combines molecular dynamics, density functional theory, machine learning, and kinetic Monte Carlo simulations. The fast machine learning model enables the evaluation of millions of specific electronic interactions between molecules and their thermal fluctuations, which play a key role in modulating charge transport. We use this protocol to study the dependence of charge mobility on mechanical deformations for C10-DNBDT-NW. Several analyses are performed to rationalise and predict the impact of strain on the material in a reduced amount of time. The predictions are consistent with experimental measurements, indicating its potential for screening the mechanoelectric response to identify materials with the desired properties. This new protocol presents an effective approach to predict the performance of organic semiconductors under external mechanical strain, which could lead to the discovery of new materials for advanced technologies.
One of the most praised advantages regarding the adoption of organic semiconductors (OSCs) is their flexibility.1 This property, a consequence of the fact that aggregates of organic molecules are held together by weak van der Waals interactions, enables a range of applications that are not possible with other types of substrates, ranging from already commercial devices, such as flexible OLED displays,2–4 to more specialized applications,5–7 such as skin-wearable solar cells,8 biosensors,9 stretchable transistors,10–12 flexible actuators,13 which are still under study. Apart from specific applications where flexibility is required, mechanical strain can also be used as an ingenious way to modify the electronic properties of a material: examples of performance increase upon mechanical deformation are well known and commercially practicable for silicon-based devices,14 where increases of electron and hole mobilities up to 100% have been achieved.15
The understanding of the interplay between mechanical and electronic properties of OSCs is fundamental for many reasons: first of all, it is desirable to not deteriorate the performance of the OSC upon deformation. Additionally, a molecular understanding of the structural parameters regulating such interplay is crucial to design new materials with better performances. Some indications that the variation of transfer integrals may have a stronger impact than phonon modes on the performances was recently obtained,16 but its magnitude may strongly depend on the molecule of interest. On the other side, several studies have highlighted the importance of dynamic disorder17,18 and how a single vibrational “killer mode” can be identified as responsible for limiting transport,19,20 with mechanical perturbations as a tool to limit such vibrations.11
Seminal studies investigating mechanoelectric properties of organic compounds focused on polycrystalline semiconductors,21–23 which, however, do not allow to investigate the intrinsic behaviour of the material, since electrical properties are mainly dominated by extrinsic effects like grain size and defects. For this reason, in the last years, experimental and theoretical research focused on highly purified single crystals, which represent the ideal system to isolate the intrinsic relationship between charge transport and mechanical strain. Several organic semiconductors have been investigated, such as tetracene,24 pentacene,23,25,26 TIPS-pentacene,27–30 C10-DNBDT-NW,11 and in particular rubrene,31–36 which has emerged as the material of election in light of its attractive properties, such as high hole mobility (exceeding 15 cm2 V−1 s−1 have been reported),37,38 ease of obtaining large high-purity crystals and quite good flexibility. Among the molecules that have been studied, up to 70% hole mobility increase upon mechanical strain of 3% was reported for a single crystal of an organic material, C10-DNBDT-NW.11 This molecule was originally designed for applications in OFETs39 and, while the unsubstituted π-conjugated core yielded satisfactory performances, modifying the crystal packing by adding alkyl substituents to the core resulted in a high mobility two-dimensional transport material. The experimental finding of increased hole mobility upon compression was justified in ref. 11 through the aid of first principles methods, with a suppression of molecular vibrations induced by the mechanical deformation.
These studies indicate that inducing mechanical perturbations on already known molecules could lead to an improvement in their charge carrier mobility. This represents an alternative path for the development of more performing devices to the much more popular approach of identifying novel materials with higher mobility. This last approach has been largely based on empirical intuition and on trial and error research,39 although several systematic theoretical studies were recently carried out,40–44 showing the importance of computational studies for the identification of new organic semiconductors with enhanced performances in reduced amount of time.40,41 Seminal computational studies have been also performed concerning the impact of strain on the mobility of organic materials.30,33,45–47 However, the vast majority of these works focused on 1–2 molecules at most in light of the high computational cost of computing phonons for crystals with hundreds of atoms in the unit cell.47,48
To solve this drawback, recently, some of us developed a fast computational protocol capable to quantitatively predict the mobility variations induced in organic crystals by directional mechanical strain, reproducing the experimental trends for rubrene and TIPS-pentacene at a significantly reduced computational cost.16 This approach allowed to study the impact of deformations on 3 molecules in a reasonable amount of time. Nevertheless, to study the effect of strain on a wide database of organic molecules, it is necessary to further lower the computational time. With this goal in mind, in this work we combine state-of-the-art approaches, i.e. Molecular dynamics (MD), density functional theory (DFT), Fermi's Golden Rule (FGR), Machine Learning (ML), graph theory, and kinetic Monte Carlo (kMC) simulations to develop such a protocol. We apply it to the case of C10-DNBDT-NW, showing how it leads to charge mobility predictions in line with experimental findings, indicating the suitability of this protocol for the screening of the mechanoelectric response of organic semiconductors.
Charge transfer pathways in the crystal
We start by characterising charge transfer pathways in the crystal.49,50 This was achieved by identifying all non-equivalent homodimers formed by a given molecule with its nearest neighbours and computing the corresponding electronic couplings. The C10-DNBDT-NW crystal (see Fig. 1) shows the typical herringbone structure of polycyclic aromatic hydrocarbons, where each molecule is surrounded by six nearest neighbours. Symmetry reduces the non-equivalent dimers to two pairs, associated to the two possible charge transfer pathways, one directed along the crystallographic c axis (J1), and the other with components along both the crystallographic b and c axes (J2, see Fig. 1).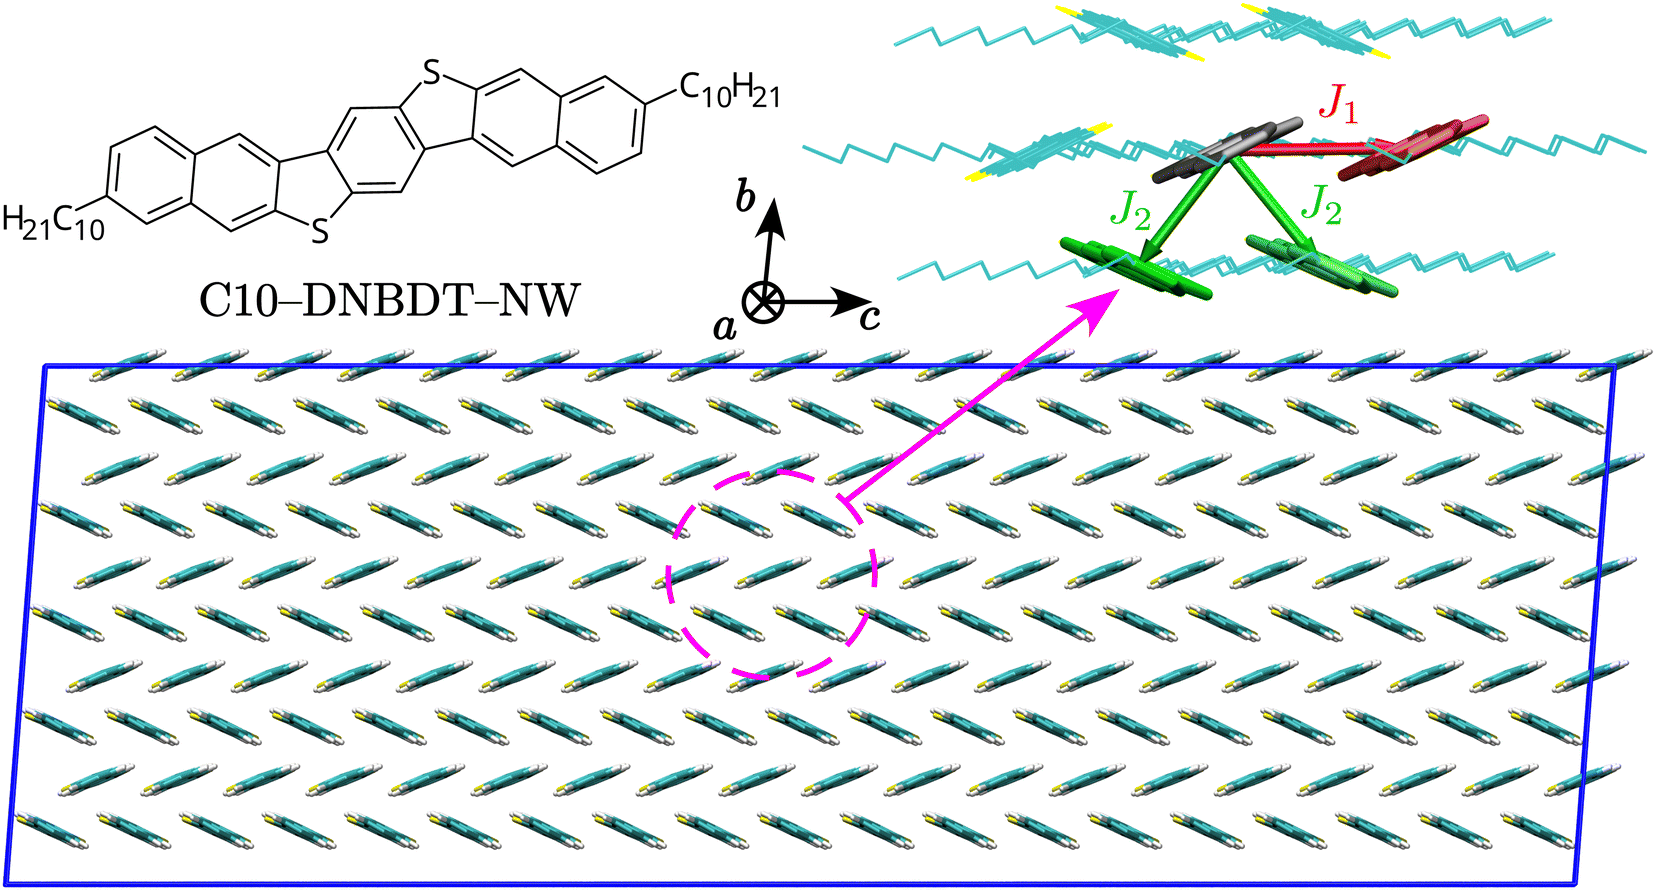 | ||
| Fig. 1 Top left: Structure of C10-DNBDT-NW. Top right: Unique charge transfer pathways and associated transfer integrals J identified in the crystal structure. Bottom: View of the 1 × 5 × 19 supercell used for MD simulations in this study (side chains omitted), along with a sketch of the crystallographic axes. | ||
We computed transfer integrals between frontier orbitals as Jij = 〈ϕi|![[F with combining circumflex]](https://www.rsc.org/images/entities/i_char_0046_0302.gif) |ϕj〉, where ϕi and ϕj are the unperturbed HOMO orbitals of the isolated monomers, respectively, and is the Fock operator of the dimer.40,50–52 In qualitative agreement with previous studies,39 we find that the two pathways have similar transfer integral values, resulting in a two-dimensional transport for C10-DNBDT-NW in the (b, c) plane, while along the a axis aromatic cores are isolated by alkyl side chains: this is a common feature of acenes, which in most instances have a crystal structure with a high-mobility plane, while the charge mobility perpendicular to this plane is 1–2 orders of magnitude smaller.53,54 From the quantitative point of view, the computed values of J1 and J2 (≈75 and ≈60 meV, respectively) are slightly higher with respect to what found in the past, which could be a consequence of the geometries used (optimised rather than experimental), of the chosen computational method, of the different strategy in cropping (or not) alkyl side chains, or a combination of those. With available transfer integrals values, together with additional geometry optimisation and frequency calculations, it is possible to obtain hole transfer rates according to Fermi's Golden Rule (FGR),
|ϕj〉, where ϕi and ϕj are the unperturbed HOMO orbitals of the isolated monomers, respectively, and is the Fock operator of the dimer.40,50–52 In qualitative agreement with previous studies,39 we find that the two pathways have similar transfer integral values, resulting in a two-dimensional transport for C10-DNBDT-NW in the (b, c) plane, while along the a axis aromatic cores are isolated by alkyl side chains: this is a common feature of acenes, which in most instances have a crystal structure with a high-mobility plane, while the charge mobility perpendicular to this plane is 1–2 orders of magnitude smaller.53,54 From the quantitative point of view, the computed values of J1 and J2 (≈75 and ≈60 meV, respectively) are slightly higher with respect to what found in the past, which could be a consequence of the geometries used (optimised rather than experimental), of the chosen computational method, of the different strategy in cropping (or not) alkyl side chains, or a combination of those. With available transfer integrals values, together with additional geometry optimisation and frequency calculations, it is possible to obtain hole transfer rates according to Fermi's Golden Rule (FGR),
 | (1) |
Predicted charge transfer rates were used to estimate the drift mobility of holes μ according to Einstein–Smoluchowski's relation
 | (2) |
 where n is the spatial dimensionality, ri is the distance between centres of mass of the interacting molecules, ki is the hole hopping rate,
  is the probability of the hop along the i-th pathway, and the summation runs over the two charge transfer pathways. The results of these calculations, reported in Table 1, are in good agreement with experiments.11 It should be noted that eqn (2) implies the adoption of a hopping transport mechanism, whose applicability to organic crystals where J ≈ λ is highly debated.61–65 However, hopping models are known to give quantitatively comparable results to more physically plausible mechanisms,43,63 such as Transient Localisation Theory (TLT, see Section S1.6.2 in the ESI†). Indeed, we also computed hole mobilities resorting to TLT,66 obtaining quantitatively comparable results, as shown in Table 1.
| Path | λ (meV) | r (Å) | J (meV) | k FGR (s−1) | μ FGR (cm2 V−1 s−1) | LL2 (Å2) | μ TLT (cm2 V−1 s−1) | μ (cm2 V−1 s−1) |
|---|---|---|---|---|---|---|---|---|
| J 1 | 93.9 | 6.13 | 75.34 | 3.56 × 10¹⁴ | 5.85 | 529 | 7.87 | 9.711 |
| J 2 | 4.92 | 61.41 | 2.36 × 10¹⁴ |
At first sight, the good agreement between FGR and TLT may appear surprising, since these two theories have been developed in quite different regimes (localised vs. partially delocalised picture). Nevertheless, as remarked in some works,67,68 in spite of its limitations, the hopping model leads to mobilities in very good agreement with experimental ones and with the ones obtained with more rigorous approaches, at least at room temperature, to which our discussion is limited. Moreover, both localised (Marcus) and semiclassical dynamics models predict similar mobilities, even if charge delocalisation at room temperature is considered.69 As a side note, it has been pointed out that the inclusion of quantum mechanical effects in the hopping rates (such as in the case of FGR) does not lead to thermally activated mobilities.59,70 That is an important point, since the hopping mechanism cannot be ruled out only on the basis of the observed decreasing of the mobility with temperature. This ensures the adequacy of FGR for the system under study, a fundamental point since we plan to evaluate the rates along MD trajectories for subsequent kMC calculation (vide infra), where TLT is not applicable.
Finally, we notice that both FGR and TLT mobilities are smaller than the experimental one, even though the opposite is usually expected, since even the best materials are subject to extrinsic disorder and the measured mobility is commonly smaller than computed ones. This difference is probably due to the fact that the experimental crystal structure used in our simulations has been measured at 240 K (see ESI†). The low temperature probably results in shorter intermolecular distances, which have a trivial impact on the computed diffusion coefficient and in turn on the mobility. Indeed, kMC calculations on MD snapshots (i.e. after relaxing the structure at room temperature), lead to values slightly higher than the experimental mobility, as expected.
Effect of mechanical strain
There are several strategies to evaluate the effect of mechanical strain on charge transfer. A first possibility entails first-principles optimisation of the unit cell, artificially varying the size of the simulation box, before recomputing electronic interactions.16,47 However, the calculation of electron–phonon couplings can be computationally expensive in this case. Another strategy is based on MD methods, either DFT-based Born–Oppenheimer MD (BO-MD)45 or classical MD,33 where an MD trajectory is computed at each value of strain, obtained by artificially varying the simulation box, or through an external force.To develop a protocol with the lowest possible computational cost, we decided to resort to classical MD with a quantum-mechanically derived force field (QMD-FF),50,71 which leads to an accurate description of the dynamics of the chromophore at a much lower cost than BO-MD. We parameterised quantum-mechanically derived force fields (QMD-FFs) with the Joyce software,72–74 see Section S1.2 in the ESI,† for information on the parameterisation procedure and the validation.
Simulations were run for 20 ns for each value of strain (see Fig. 2). We used the last 10 ns of each simulation to evaluate transfer integrals J1 (for one dimer) and J2 (for one dimer) and their fluctuations, extracting snapshots every 50 ps, cropping side chains after the first carbon atom, so as to leave the DNBDT core substituted with methyl groups, in analogy to our previous works50,75 and to what similarly done by others,76–78 before running DFT computations of transfer integrals. This results in 200 evaluations of each transfer integral, at each strain.
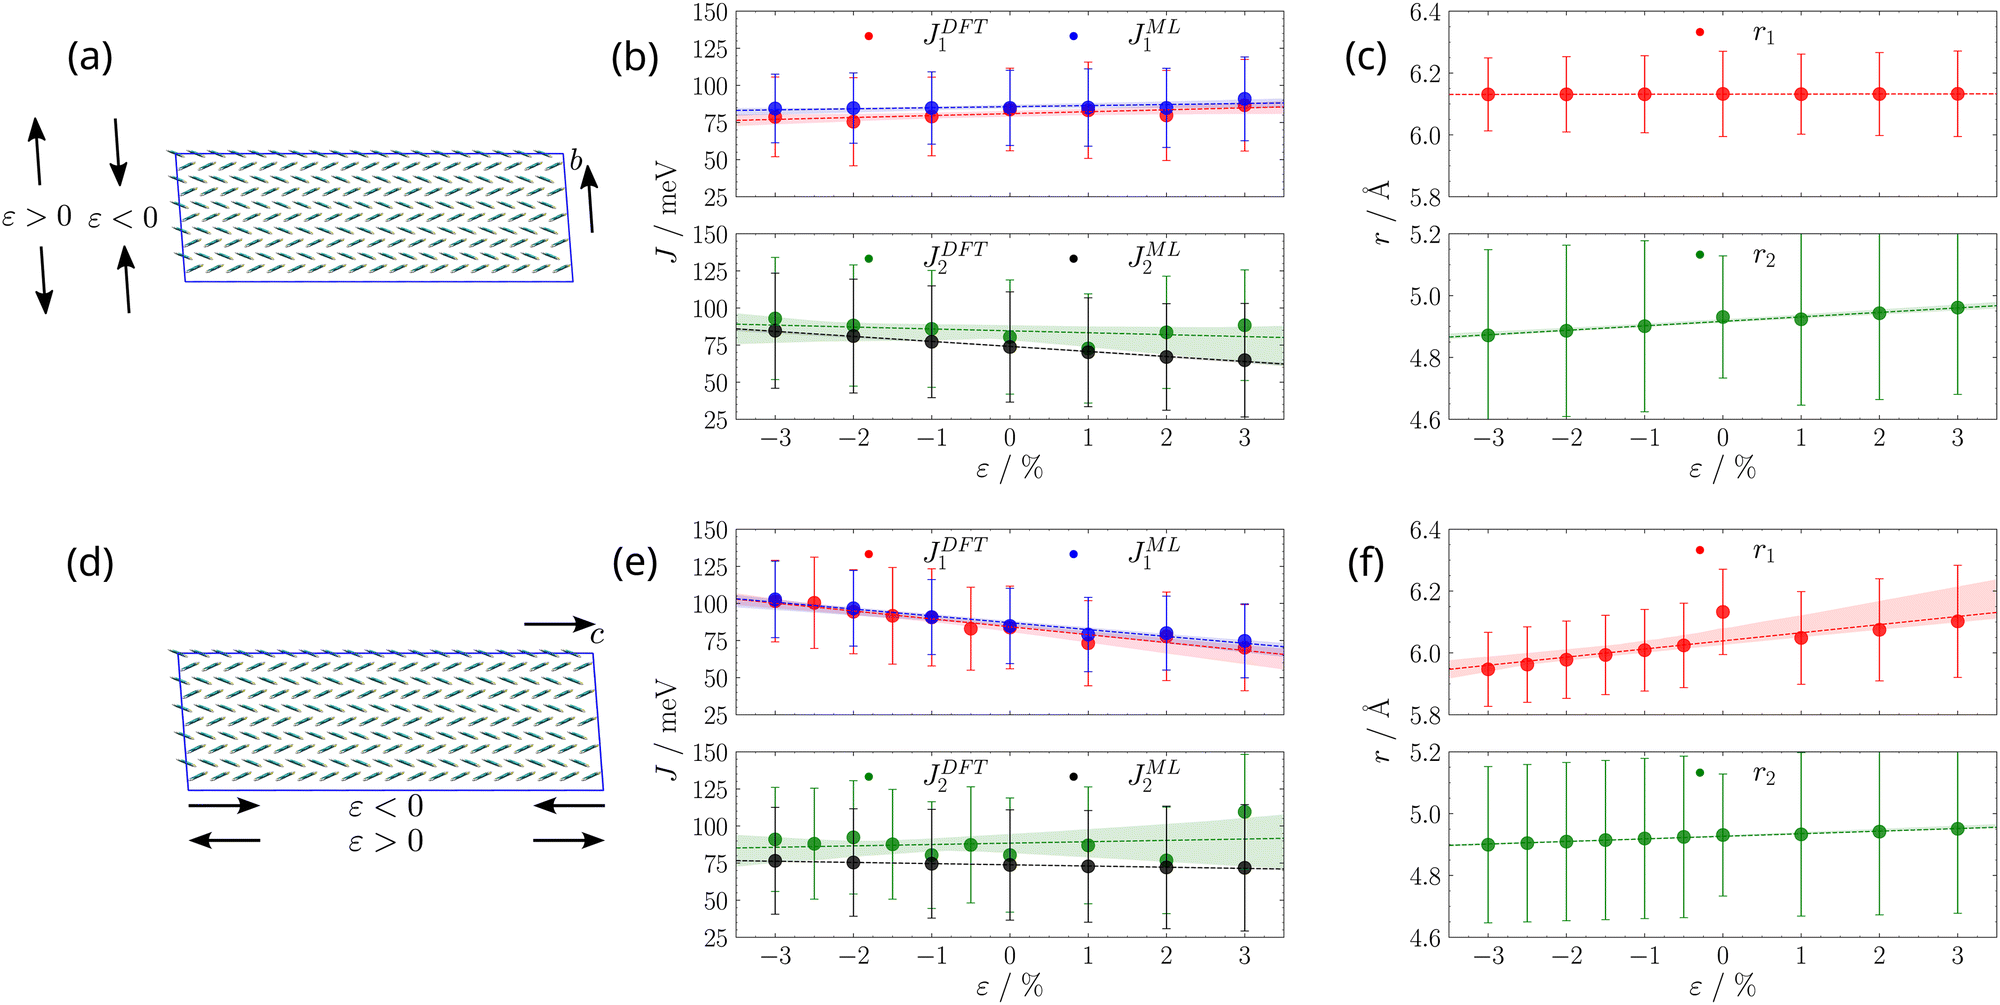 | ||
| Fig. 2 (a) and (d): pictorial representation of positive (elongation) and negative (compression) strain (ε) along the two crystallographic axes (b on the top, c on the bottom). (b) and (e): dependence of the two types of transfer integrals J1 and J2 on the strain ε along the two crystallographic axes (b on the top, c on the bottom). DFT transfer integrals were computed only for one pair of molecules, while ML transfer integrals were averaged over all pairs of the same type in the simulation box. Dashed lines and shaded areas represent the best line fit, along with its 95% confidence interval. (c) and (f): dependence of the distance between centres of mass of monomers involved in the two types of transfer integrals on the strain ε along the two crystallographic axes (b on the top, c on the bottom), averaged over all pairs of the same type in the simulation box. Dashed lines and shaded areas represent the best line fit, along with its 95% confidence interval. | ||
Furthermore, for each snapshot, we evaluate intermolecular distances r1 and r2 associated to transfer integrals, for all pairs of first neighbour dimers of either type. The values of transfer integrals J1 and J2 (for one specific pair of molecules each) and of associated intermolecular distances r1 and r2 (for all pairs of molecules of the same type), along with their fluctuations, as a function of strain are reported in Fig. 2, where the amount of percentage strain induced along the crystal axis j is defined as
 | (3) |
On the basis of the directionality of charge transfer paths (see Fig. 1), one would expect that applying a compression along the c axis (Fig. 2d and e) results in a significant increase of J1, and a modest increase of J2, while the opposite would occur for elongation. On the other side, applying strain along the b axis (see Fig. 2a and b) should not significantly affect J1, while we expect a noticeable increase (decrease) of J2 upon compression (elongation). However, inspection of Fig. 2 shows that, while DFT calculations of J1 along the MD trajectories at various values of strain ε agree with expectations, as well as intermolecular distances r1 and r2, the hole transfer integral J2 is characterised by significant deviations from what we expected. For example, elongation along the c axis results in an increase of J2, while applying strain along the b axis overall has a negligible effect.
This observation could be related to the fact that transfer integral variations due to strains along different crystallographic directions are sensitive not only to variations in the intermolecular distance between adjacent monomers but can also depend on variations in their relative orientation.33,46 A detailed analysis of relative orientations along the trajectories highlighted a significant change in the pitch angle between the monomers involved in hole transfer integral J2 (see Section S2 in the ESI†). However, this change is registered only for the specific pair of monomers that we picked to compute at DFT level transfer integral J2, and does not reflect a collective behaviour of the aggregate, at least from a geometrical point of view (see Section S2 in the ESI†). Thus, to significantly expand the statistics for transfer integrals, we resorted to a Machine Learning (ML) model, as outlined in the next section.
Machine learning model
We developed a machine learning (ML) model starting from a Coulomb matrix representation of dimer geometries,81 providing a rotationally and translationally invariant representation of molecules that requires as input the same data used for typical quantum chemical calculations,82i.e. atomic numbers and coordinates. In particular, since it is well known that transfer integrals are mostly affected by inter-molecular motions,83 to reduce the number of points in the training set and the parameters of the ML model to avoid overfitting, it is possible to use as input to the ML model only one of the two equivalent off-diagonal inter-molecular blocks of the Coulomb matrix (see Section S3 in the ESI†), as shown in the literature, obtaining great performances in terms of errors and speed in the calculation of transfer integrals for case-study molecules.84–86 We highlight that, since Coulomb matrix elements depend on pairwise distances between atoms, this particular choice of input makes the model sensitive to tilt angles between monomers in a much more sensitive way than describing rigid monomers through their principal axes of inertia as initially done by others,87 as shown by Wang.84,85Adopting these ideas and using the ≈10![[thin space (1/6-em)]](https://www.rsc.org/images/entities/char_2009.gif) 000 DFT calculations of J1 and J2 reported in Fig. 2 as training set for an ML protocol described in detail in Section S3 (ESI†), we identified a stacked estimator88 combining predictions from a Random Forest and a Kernel Ridge Regression model,89,90 with an overall performance comparable both in terms of speed and accuracy to other computational procedures devised to speed up charge transfer integrals evaluation.91,92 Moreover, we point out that the only input required for the ML algorithm is the geometry of the dimer, while other fast methods reported in the literature need Kohn–Sham orbitals,18,63 whose computation time should be considered in the total effort required to obtain the transfer integral.
000 DFT calculations of J1 and J2 reported in Fig. 2 as training set for an ML protocol described in detail in Section S3 (ESI†), we identified a stacked estimator88 combining predictions from a Random Forest and a Kernel Ridge Regression model,89,90 with an overall performance comparable both in terms of speed and accuracy to other computational procedures devised to speed up charge transfer integrals evaluation.91,92 Moreover, we point out that the only input required for the ML algorithm is the geometry of the dimer, while other fast methods reported in the literature need Kohn–Sham orbitals,18,63 whose computation time should be considered in the total effort required to obtain the transfer integral.
On the other side, ML models require ad hoc procedures to check the consistency of the sign of the coupling,75,84 a built-in feature of other methods.91,92 As suggested by Wang,84 our ML model was trained on the absolute value of transfer integrals |J|, and the signs were kept consistent with the ones computed in the crystal from first principles. However, it should be noted that, while a correct prediction of the sign is important to generalise the applicability of ML-computed transfer integrals to approaches such as TLT or band transport, in the FGR model used here the sign of transfer integrals is not important as the rate depends on J2 (eqn (1)). Using ML instead of DFT leads to significant saving in computational time: in our case, DFT calculations for each transfer integral require ≈1.5 CPU hours, while a single ML evaluation requires ≈30 ms, a speed-up of five orders of magnitude, with a mean absolute error (≈5 meV) that is much lower than the fluctuation of the transfer integrals along an MD trajectory, and comparable to other literature methods,85,87,91–94 showing errors in the range ≈5–15 meV. The main limitation in the adoption of an ML model lies in the fact that, any time a new material has to be studied, one has to build a data set to train the model, which should be larger the more atoms the new molecule has. This limitation might be overcome once a large enough data set has been built to train a more general or transferable model,95 for which data availability in the community is critical. The accuracy and speed of our ML model allowed us to evaluate the transfer integrals for all pairs of nearest neighbours for all the snapshots of our MD simulations performed so far, a total of ≈1.5 million calculations, with an estimated computational effort, had we adopted DFT, amounting to ≈2.25 × 10⁶ CPU hours, a task clearly unfeasible for quantum chemical calculations.
The results for all pairs of first neighbours were grouped by type of interaction and are reported in Fig. 2, labelled as JML1 and JML2. The trends obtained for JML1 and JML2 upon applying strain along the b and c axes are now perfectly in line with expected trends discussed in the previous paragraph, i.e. J2 increases upon compression both along c and along b, the latter being bigger than when applying strain along c, because J2 is mainly directed along b. Apart from obtaining more reasonable trends, resorting to a faster ML approach enables a plethora of additional analyses, which require a high amount of data and can shed light on additional details of the transport mechanism, as we will discuss in the next sections.
Electron–phonon coupling
The overall sensitivity of transfer integrals to nuclear motions (i.e. electron–phonon coupling) can be evaluated from the fluctuations of transfer integrals themselves. However, much more information can be extracted from the Fourier Transform (FT) of the autocorrelation function R(t) of transfer integrals,45,96i.e. its spectral density S(ω), defined as97 | (4) |
We computed average autocorrelation functions R(t) either for all transfer integrals, or grouping them by type (J1 or J2), reporting the corresponding S(ω) in Fig. 3 (further details can be found in Section S5 in the ESI†).
 | ||
| Fig. 3 Spectral densities computed from the average autocorrelation function for all transfer integrals (Total), or grouping them by type (either J1 or J2) for strain applied along the b (left top) or c (left bottom) crystallographic axes, and selected normal modes obtained from a 1 × 2 × 2 supercell optimisation at DFTB level98,99 (see Section S1.5 ESI†) at ≈150 cm−1 and ≈220 cm−1. | ||
Inspection of Fig. 3 shows the physical soundness of the outputs of our ML model, since no vibration above 700 cm−1 is responsible for variations in the transfer integrals. Additionally, we see that, as compression increases, coupling with vibrations at ≈150 cm−1, ≈220 cm−1, ≈400 cm−1, and ≈600 cm−1 shifts at slightly higher frequencies (by ≈10 cm−1), for both J1 and J2, regardless of the axis along which strain is applied. This is compatible with the observations reported in the experimental study of mechanical perturbations applied to this material:11 calculations of specific intermolecular motions as a function of mechanical strain showed a narrower potential energy surface at higher values of strain, i.e. a higher frequency of the specific motion investigated. Nevertheless, the changes observed in the spectral density are too small to be responsible for a significant increase in hole mobility upon strain. In agreement with recent findings,16 we speculate that the increased hole mobility can be ascribed to enhanced transfer integrals, rather than to a decrease in dynamic disorder, as will be further analysed in the next section.
Interaction networks
Some years ago Savoie100 proposed a new point of view on charge transport in terms of graph descriptors,101 formulating a numerical index (the Kirchoff Transport index KT) in qualitative agreement with experimental mobilities to compare different materials. The evaluation of KT requires all electronic interactions between nearest neighbours in the aggregate, a computationally intensive task usually performed by Extended Hückel Theory. However, our ML algorithm allows the same analysis with a much greater accuracy (see Fig. S5 in the ESI†) and comparable (or possibly superior) speed.We computed the electronic interaction network along the trajectories, and the graph obtained averaging over time is reported in Fig. 4. In particular, we report the largest subgraph identified for various thresholds JT (i.e. all the sites connected by |J| > JT) as a function of mechanical strain ε. This representation allows to gain insights into the properties of charge transport when mechanical perturbations are applied: from Fig. 4 it is evident that either elongation along b or compression along c leads to a network of strong transfer integrals along the c axis. Furthermore, the largest subgraph of molecules connected by |J| > JT gets larger with compression, indicating a better charge transport. Network analyses have also been used to study π-stacking patterns in amorphous aggregates of polymers,102 where the size of the largest cluster was suggested as a target descriptor to drive molecular design.
 | ||
| Fig. 4 Left panel: Effect of mechanical strain along crystallographic axes b (top) and c (bottom) on the largest network of electronic interactions (blue surface). Right panel: relative variation of the Kirchoff Index on the mechanical strain along crystallographic axes b (top) and c (bottom). | ||
Concerning the Kirchoff Transport Index (KT), a figure of merit related to the description of the aggregate as a graph (see Section S6 in the ESI†), a higher value of KT is correlated with better transport properties for both amorphous and crystalline materials, as demonstrated in the past for a series of electron acceptors ranked according to their electron transport capability.101 The description of the aggregate interaction networks can be analysed in terms of overall transport properties of the material from the trend of the relative variation of  with respect to the strain ε.
A careful inspection of Fig. 4 allows to appreciate the influence of strain on the direction of the charge transport. Elongation along the b axis (ε > 0), results in an essentially unaffected transport due to J1 while transport due to J2 strongly decreases (
 decreases to −15%). On the contrary, compression along b (ε < 0) results is a network of strong transfer integrals along the b axis. This results in transport due to J1 unchanged
  while transport due to J2 increases strongly (
 increases to 15%).
When we compress along the c axis (ε < 0), the result is a strong network of transfer integrals along the c axis: transport due to both J1 and J2 increases, although the former is much more affected ( increases to 25%,
  to 5%). Finally, elongation along c (ε > 0) leads to a network of strong transfer integrals with components along both b and c crystallographic axes: the result is an overall decrease of transport due to both J1 and J2, although the former is much more reduced (
 decreases to −15%,
  to −5%). This analysis suggests the possibility of controlling in a precise manner the charge migration direction in the material through application of strain, and confirms the recent assignment of a stronger sensitivity of the mechanoelectric response to transfer integrals rather than dynamic disorder.16
Kinetic Monte Carlo charge mobility
Finally, we focus on the computation of charge mobility μ through a kinetic Monte Carlo approach. Although kMC in its simplest flavour implies the adoption of a hopping model,49,87 more advanced implementations of this computational approach have been recently introduced to deal with delocalised charge carriers typical of organic materials.103,104 However, due to the reasonable agreement shown in Table 1 between charge mobilities obtained in a hopping and a partially delocalised framework, we opted to adopt kMC in its simplest hopping variant, similarly to other works.49,87 The computation of μ and its agreement with experimental findings allows to check the reliability of our whole procedure, ensuring that it can be used for the search of novel materials with the desired properties, incorporating it in screening or optimisation frameworks.40,105,106We carried out kMC simulations at each value of strain on snapshots extracted from classical MD trajectories at that value of strain. Since boxes from classical MD simulations are too small to perform statistically meaningful simulations, we combined 200 snapshots extracted from classical MD trajectories as described in ref. 87 (see Section S1.6.3 in the ESI†), to obtain a larger system (38000 sites, in a ≈2400 × ≈400 Å lattice). For each snapshot our ML-computed transfer integrals allowed to evaluate on-the-fly the corresponding hopping rates between nearest neighbours sites according to FGR (eqn (1)). The kMC trajectories are stopped after 0.1 ps, and we compute the diffusion coefficient D of the charge as
 | (5) |
000 independent kMC trajectories. The diffusion coefficient D is then used to compute the hole mobility μ according to eqn (2). We notice that eqn (5), when applied on the perfect crystal arrangement, leads to a value of mobility (μ ≈ 8.1 cm2 V−1 s−1) in good agreement with data in Table 1, ensuring the consistency of the approaches used in this work.
The results in Fig. 5 show that strain applied along the c axis results in a monotonic increase of mobility with compression and a monotonic decrease with elongation, while deformation along b results in a non-monotonic milder variation. This difference is probably related to the fact that, while strain applied along c axis results in both transfer integrals J1 and J2 varying in the same direction (they increase with compression and decrease with elongation, see Fig. 2), strain along b axis induces opposite variation for J1 and J2.
 | ||
| Fig. 5 Variation of hole mobilities computed through kMC as a function of mechanical strain applied along crystallographic axes b (green) and c (red). | ||
This study allows to check the accuracy of all our methodology: we can compare our results for compression along the c axis with the experimental values reported in ref. 11. Our simulations predict a 37% relative increase in charge mobility  for an ε = −3% compression along c, in good agreement with ref. 11, where a relative increase in the mobility ranging from 43% to 70% was reported, thus indicating the reliability of our approach for the study of mechanoelectric response in organic crystals.
Conclusions
In this work, we present a novel computational protocol that combines a series of state-of-the-art techniques, i.e. molecular dynamics, DFT, machine learning, Fermi's Golden Rule, and kinetic Monte Carlo. The final goal is to develop a fast and reliable protocol to predict the impact of deformations applied along different crystallographic axes in organic semiconductors, and to obtain quantitative estimation of charge carrier mobilities.The integration of a fast machine learning model allowed us to evaluate millions of specific electronic interactions between molecules, a task otherwise unfeasible with quantum chemical methods. This capability enabled us to consider thermal fluctuations of transfer integrals, a critical factor in determining charge transport at intermediate regimes, in a highly specific manner. These data can be combined with various theoretical frameworks to predict charge carrier mobility.66,103
Furthermore, our methodology provides a large number of specific electronic interactions that allow for improved characterisation of charge transport features, such as spatial directionality or electron–phonon couplings. The main improvements over existing literature are (i) the application of ML predictions of transfer integrals to a qualitative (interaction networks) and quantitative (kMC) evaluation of charge transport dependent on mechanical deformations, rather than to model systems aimed at verifying its scope;84–87,94 (ii) the aggregate analyses of electron–phonon couplings through millions of transfer integral evaluations enabled the ML model. These novelties will be further exploited through development of transferable95 and differentiable107 ML models in future work. Our approach yields good agreement with available experimental results for a typical organic semiconductor, as demonstrated by a kMC scheme. Eventually, it will be possible to adopt kMC flavours more in line with the physical mechanism underpinning charge transport in the intermediate regime.103,104
The protocol is both fast and reliable, although it requires parameterisation of a QMD-FF and training an ML model, steps that apparently prevent its transferability to new materials. We are currently working on the automatic parameterisation of QMD-FFs108 and on the development of transferable and differentiable ML models,95,107 which will allow overcoming these limitations. This is a significant step towards fully exploiting the inherent flexibility of organic materials in cutting-edge technologies requiring either preservation of material properties under deformation, such as wearable electronics and flexible solar cells, or conversely a strong response to external pressure, such as tactile sensors or e-skins.
Conflicts of interest
There are no conflicts to declare.Acknowledgements
We are grateful to Dr Giacomo Prampolini (ICCOM-CNR, Pisa) and Dr José Guilherme Vilhena (Universidad Autónoma de Madrid) for useful discussions on QMD-FFs parameterisation and MD simulations under mechanical strain, to Dr Micaela Matta (King's College London) and Dr Richard J. Gowers (Open Molecular Software Foundation) for fruitful discussions on electronic interaction networks. D. P. gratefully acknowledges funding from the Italian Ministry of University and Research (MUR, Rita Levi Montalcini grant PGR18PJMBW) and Università di Siena (F-CUR research support contribution), and computational resources kindly provided by CINECA (ISCRA C HP10CA066O and HP10CJR0ZF) and Università di Siena (hpc@dbcf).References
- S. E. Root, S. Savagatrup, A. D. Printz, D. Rodriquez and D. J. Lipomi, Chem. Rev., 2017, 117, 6467–6499 CrossRef CAS PubMed.
- G. Gustafsson, Y. Cao, G. M. Treacy, F. Klavetter, N. Colaneri and A. J. Heeger, Nature, 1992, 357, 477–479 CrossRef CAS.
- G. Gu, P. E. Burrows, S. Venkatesh, S. R. Forrest and M. E. Thompson, Opt. Lett., 1997, 22, 172 CrossRef CAS PubMed.
- G. Hong, X. Gan, C. Leonhardt, Z. Zhang, J. Seibert, J. M. Busch and S. Bräse, Adv. Mater., 2021, 33, 2005630 CrossRef CAS PubMed.
- B. D. Paulsen, K. Tybrandt, E. Stavrinidou and J. Rivnay, Nat. Mater., 2020, 19, 13–26 CrossRef CAS PubMed.
- A. Landi, M. Reisjalali, J. D. Elliott, M. Matta, P. Carbone and A. Troisi, J. Mater. Chem. C, 2023, 11, 8062–8073 RSC.
- S. T. M. Tan, A. Gumyusenge, T. J. Quill, G. S. LeCroy, G. E. Bonacchini, I. Denti and A. Salleo, Adv. Mater., 2022, 34, 2110406 CrossRef CAS PubMed.
- T. F. O'Connor, A. V. Zaretski, S. Savagatrup, A. D. Printz, C. D. Wilkes, M. I. Diaz, E. J. Sawyer and D. J. Lipomi, Sol. Energy Mater. Sol. Cells, 2016, 144, 438–444 CrossRef.
- A. Yang and F. Yan, ACS Appl. Electron. Mater., 2020, 3, 53–67 CrossRef.
- A. Chortos, J. Lim, J. W. F. To, M. Vosgueritchian, T. J. Dusseault, T.-H. Kim, S. Hwang and Z. Bao, Adv. Mater., 2014, 26, 4253–4259 CrossRef CAS PubMed.
- T. Kubo, R. Häusermann, J. Tsurumi, J. Soeda, Y. Okada, Y. Yamashita, N. Akamatsu, A. Shishido, C. Mitsui, T. Okamoto, S. Yanagisawa, H. Matsui and J. Takeya, Nat. Commun., 2016, 7, 11156 CrossRef CAS PubMed.
- K. Liu, B. Ouyang, X. Guo, Y. Guo and Y. Liu, npj Flex. Electron., 2022, 6, 1 CrossRef CAS.
- J. Ahn, J. Gu, J. Choi, C. Han, Y. Jeong, J. Park, S. Cho, Y. S. Oh, J.-H. Jeong, M. Amjadi and I. Park, Adv. Mater. Technol., 2022, 7, 2200041 CrossRef CAS.
- T. Vogelsang and K. Hofmann, IEEE Trans. Electron Devices, 1992, 39, 2641–2642 CrossRef.
- S. Bedell, A. Khakifirooz and D. Sadana, MRS Bull., 2014, 39, 131–137 CrossRef CAS.
- A. Landi, A. Peluso and A. Troisi, Adv. Mater., 2021, 33, 2008049 CrossRef CAS PubMed.
- S. Fratini, S. Ciuchi, D. Mayou, G. T. de Laissardière and A. Troisi, Nat. Mater., 2017, 16, 998–1002 CrossRef CAS PubMed.
- S. Giannini, W.-T. Peng, L. Cupellini, D. Padula, A. Carof and J. Blumberger, Nat. Commun., 2022, 13, 2755 CrossRef CAS PubMed.
- G. Schweicher, G. DAvino, M. T. Ruggiero, D. J. Harkin, K. Broch, D. Venkateshvaran, G. Liu, A. Richard, C. Ruzié, J. Armstrong, A. R. Kennedy, K. Shankland, K. Takimiya, Y. H. Geerts, J. A. Zeitler, S. Fratini and H. Sirringhaus, Adv. Mater., 2019, 31, 1902407 CrossRef CAS PubMed.
- M. A. Dettmann, L. S. R. Cavalcante, C. A. Magdaleno and A. J. Moulé, Adv Funct. Mater., 2023, 33, 2213370 CrossRef CAS.
- T. Sekitani, Y. Kato, S. Iba, H. Shinaoka, T. Someya, T. Sakurai and S. Takagi, Appl. Phys. Lett., 2005, 86, 073511 CrossRef.
- A. N. Sokolov, Y. Cao, O. B. Johnson and Z. Bao, Adv. Funct. Mater., 2012, 22, 175–183 CrossRef CAS.
- P. Cosseddu, G. Tiddia, S. Milita and A. Bonfiglio, Org. Electron., 2013, 14, 206–211 CrossRef CAS.
- Z. Zhang, G. Yu, J. Garcia-Barriocanal, Z. Xie and C. D. Frisbie, ACS Appl. Mater. Interfaces, 2020, 12, 40607–40612 CrossRef CAS PubMed.
- V. Scenev, P. Cosseddu, A. Bonfiglio, I. Salzmann, N. Severin, M. Oehzelt, N. Koch and J. P. Rabe, Org. Electron., 2013, 14, 1323–1329 CrossRef CAS.
- Y.-J. Lin, H.-C. Chang and D.-S. Liu, Appl. Phys. A: Mater. Sci. Process., 2015, 118, 1205–1210 CrossRef CAS.
- G. Giri, E. Verploegen, S. C. B. Mannsfeld, S. Atahan-Evrenk, D. H. Kim, S. Y. Lee, H. A. Becerril, A. Aspuru-Guzik, M. F. Toney and Z. Bao, Nature, 2011, 480, 504–508 CrossRef CAS PubMed.
- Y. Diao, B. C.-K. Tee, G. Giri, J. Xu, D. H. Kim, H. A. Becerril, R. M. Stoltenberg, T. H. Lee, G. Xue, S. C. B. Mannsfeld and Z. Bao, Nat. Mater., 2013, 12, 665–671 CrossRef CAS PubMed.
- Y. Park, K. S. Park, B. Jun, Y.-E. K. Lee, S. U. Lee and M. M. Sung, Chem. Mater., 2017, 29, 4072–4079 CrossRef CAS.
- X. Zheng, H. Geng, Y. Yi, Q. Li, Y. Jiang, D. Wang and Z. Shuai, Adv. Funct. Mater., 2014, 24, 5531–5540 CrossRef CAS.
- Y. Wu, A. R. Chew, G. A. Rojas, G. Sini, G. Haugstad, A. Belianinov, S. V. Kalinin, H. Li, C. Risko, J.-L. Brédas, A. Salleo and C. D. Frisbie, Nat. Commun., 2016, 7, 10270 CrossRef CAS PubMed.
- T. Morf, T. Mathis and B. Batlogg, Unusual Anisotropic Response of the Charge Carrier Mobility to Uniaxial Mechanical Strain in Rubrene Crystals, 2016, arXiv:1606.06875v2.
- M. Matta, M. J. Pereira, S. M. Gali, D. Thuau, Y. Olivier, A. Briseno, I. Dufour, C. Ayela, G. Wantz and L. Muccioli, Mater. Horiz., 2018, 5, 41–50 RSC.
- H. H. Choi, H. T. Yi, J. Tsurumi, J. J. Kim, A. L. Briseno, S. Watanabe, J. Takeya, K. Cho and V. Podzorov, Adv. Sci., 2019, 7, 1901824 CrossRef PubMed.
- M. A. Reyes-Martinez, A. J. Crosby and A. L. Briseno, Nat. Commun., 2015, 6, 6948 CrossRef CAS PubMed.
- H. Wang, L. Deng, Q. Tang, Y. Tong and Y. Liu, IEEE Electron Device Lett., 2017, 38, 1598–1601 CAS.
- C. Reese, W.-J. Chung, M.-M. Ling, M. Roberts and Z. Bao, Appl. Phys. Lett., 2006, 89, 202108 CrossRef.
- X. Ren, M. J. Bruzek, D. A. Hanifi, A. Schulzetenberg, Y. Wu, C.-H. Kim, Z. Zhang, J. E. Johns, A. Salleo, S. Fratini, A. Troisi, C. J. Douglas and C. D. Frisbie, Adv. Electron. Mater., 2017, 3, 1700018 CrossRef.
- C. Mitsui, T. Okamoto, M. Yamagishi, J. Tsurumi, K. Yoshimoto, K. Nakahara, J. Soeda, Y. Hirose, H. Sato, A. Yamano, T. Uemura and J. Takeya, Adv. Mater., 2014, 26, 4546–4551 CrossRef CAS PubMed.
- T. Nematiaram, D. Padula, A. Landi and A. Troisi, Adv. Funct. Mater., 2020, 30, 2001906 CrossRef CAS.
- C. Schober, K. Reuter and H. Oberhofer, J. Phys. Chem. Lett., 2016, 7, 3973–3977 CrossRef CAS PubMed.
- A. Landi and A. Troisi, J. Phys. Chem. C, 2018, 122, 18336–18345 CrossRef CAS.
- A. Landi, J. Phys. Chem. C, 2019, 123, 18804–18812 CrossRef CAS.
- A. Landi, A. Landi, A. Velardo and A. Peluso, ACS Appl. Energy Mater., 2022, 5, 10815–10824 CrossRef CAS.
- J. Elsner, S. Giannini and J. Blumberger, J. Phys. Chem. Lett., 2021, 12, 5857–5863 CrossRef CAS PubMed.
- S. M. Gali, C. Quarti, Y. Olivier, J. Cornil, L. Truflandier, F. Castet, L. Muccioli and D. Beljonne, J. Mater. Chem. C, 2019, 7, 4382–4391 RSC.
- M. T. Ruggiero, S. Ciuchi, S. Fratini and G. D'Avino, J. Phys. Chem. C, 2019, 123, 15897–15907 CrossRef CAS.
- T. F. Harrelson, V. Dantanarayana, X. Xie, C. Koshnick, D. Nai, R. Fair, S. A. Nuñez, A. K. Thomas, T. L. Murrey, M. A. Hickner, J. K. Grey, J. E. Anthony, E. D. Gomez, A. Troisi, R. Faller and A. J. Moulé, Mater. Horiz., 2019, 6, 182–191 RSC.
- G. Ricci, S. Canola, Y. Dai, D. Fazzi and F. Negri, Molecules, 2021, 26, 4119 CrossRef CAS PubMed.
- A. Landi and D. Padula, J. Mater. Chem. A, 2021, 9, 24849–24856 RSC.
- A. Troisi and G. Orlandi, Chem. Phys. Lett., 2001, 344, 509–518 CrossRef CAS.
- A. Landi, A. Capobianco and A. Peluso, J. Phys. Chem. Lett., 2020, 11, 7769–7775 CrossRef CAS PubMed.
- S. Fratini, S. Ciuchi, D. Mayou, G. T. De Laissardière and A. Troisi, Nat. Mater., 2017, 16, 998–1002 CrossRef CAS PubMed.
- B. Blülle, A. Troisi, R. Häusermann and B. Batlogg, Phys. Rev. B, 2016, 93, 035205 CrossRef.
- R. Kubo and Y. Toyozawa, Prog. Theor. Phys., 1955, 13, 160–182 CrossRef.
- M. Lax, J. Chem. Phys., 1952, 20, 1752–1760 CrossRef CAS.
- A. Landi, R. Borrelli, A. Capobianco, A. Velardo and A. Peluso, J. Chem. Theory Comput., 2018, 14, 1594–1601 CrossRef CAS PubMed.
- R. Borrelli and A. Peluso, Wiley Interdiscip. Rev.: Comput. Mol. Sci., 2013, 3, 542–559 CAS.
- L. Wang, G. Nan, X. Yang, Q. Peng, Q. Li and Z. Shuai, Chem. Soc. Rev., 2010, 39, 423–434 RSC.
- A. Velardo, R. Borrelli, A. Capobianco, A. Landi and A. Peluso, J. Phys. Chem. C, 2019, 123, 14173–14179 CrossRef CAS.
- S. Fratini, D. Mayou and S. Ciuchi, Adv. Funct. Mater., 2016, 26, 2292–2315 CrossRef CAS.
- F. Ortmann, K. S. Radke, A. Günther, D. Kasemann, K. Leo and G. Cuniberti, Adv. Funct. Mater., 2014, 25, 1933–1954 CrossRef.
- S. Giannini, A. Carof, M. Ellis, H. Yang, O. G. Ziogos, S. Ghosh and J. Blumberger, Nat. Commun., 2019, 10, 3843 CrossRef PubMed.
- A. Troisi and G. Orlandi, Phys. Rev. Lett., 2006, 96, 086601 CrossRef PubMed.
- A. Troisi, Chem. Soc. Rev., 2011, 40, 2347 RSC.
- T. Nematiaram, S. Ciuchi, X. Xie, S. Fratini and A. Troisi, J. Phys. Chem. C, 2019, 123, 6989–6997 CrossRef CAS.
- T. Nematiaram and A. Troisi, J. Chem. Phys., 2020, 152, 190902 CrossRef CAS PubMed.
- F. Ortmann, F. Bechstedt and K. Hannewald, Phys. Status Solidi B, 2011, 248, 511–525 CrossRef CAS.
- T. Vehoff, B. Baumeier, A. Troisi and D. Andrienko, J. Am. Chem. Soc., 2010, 132, 11702–11708 CrossRef CAS PubMed.
- G. Nan, X. Yang, L. Wang, Z. Shuai and Y. Zhao, Phys. Rev. B, 2009, 79, 115203 CrossRef.
- L. Greff da Silveira, P. R. Livotto, D. Padula, J. G. Vilhena and G. Prampolini, J. Chem. Theory Comput., 2022, 18, 6905–6919 CrossRef CAS PubMed.
- J. Cerezo, G. Prampolini and I. Cacelli, Theor. Chem. Acc., 2018, 137, 80 Search PubMed.
- V. Barone, I. Cacelli, N. De Mitri, D. Licari, S. Monti and G. Prampolini, Phys. Chem. Chem. Phys., 2013, 15, 3736–3751 RSC.
- I. Cacelli and G. Prampolini, J. Chem. Theory Comput., 2007, 3, 1803–1817 CrossRef CAS PubMed.
- D. Padula, A. Landi and G. Prampolini, Energy Advances, 2023, 2, 1215–1224 RSC.
- Z.-W. Zhao, Ö. H. Omar, D. Padula, Y. Geng and A. Troisi, J. Phys. Chem. Lett., 2021, 12, 5009–5015 CrossRef CAS PubMed.
- G. Zhang, X.-K. Chen, J. Xiao, P. C. Y. Chow, M. Ren, G. Kupgan, X. Jiao, C. C. S. Chan, X. Du, R. Xia, Z. Chen, J. Yuan, Y. Zhang, S. Zhang, Y. Liu, Y. Zou, H. Yan, K. S. Wong, V. Coropceanu, N. Li, C. J. Brabec, J.-L. Bredas, H.-L. Yip and Y. Cao, Nat. Commun., 2020, 11, 3943 CrossRef CAS PubMed.
- A. S. Gertsen, M. K. Sørensen and J. W. Andreasen, Phys. Rev. Mater., 2020, 4, 075405 CrossRef CAS.
- M. Ortega, J. G. Vilhena and R. Pérez, Adv. Mater. Interfaces, 2022, 9, 2201272 CrossRef CAS.
- P. Chen, Y. Ogawa, Y. Nishiyama, A. E. Ismail and K. Mazeau, Phys. Chem. Chem. Phys., 2016, 18, 19880–19887 RSC.
- M. Rupp, A. Tkatchenko, K.-R. Müller and O. A. von Lilienfeld, Phys. Rev. Lett., 2012, 108, 058301 CrossRef PubMed.
- M. Krämer, P. M. Dohmen, W. Xie, D. Holub, A. S. Christensen and M. Elstner, J. Chem. Theory Comput., 2020, 16, 4061–4070 CrossRef PubMed.
- V. Coropceanu, J. Cornil, D. A. da Silva Filho, Y. Olivier, R. Silbey and J.-L. Brédas, Chem. Rev., 2007, 107, 926–952 CrossRef CAS PubMed.
- C.-I. Wang, M. K. E. Braza, G. C. Claudio, R. B. Nellas and C.-P. Hsu, J. Phys. Chem. A, 2019, 123, 7792–7802 CrossRef CAS PubMed.
- M. Rinderle, W. Kaiser, A. Mattoni and A. Gagliardi, J. Phys. Chem. C, 2020, 124, 17733–17743 CrossRef CAS.
- C.-I. Wang, I. Joanito, C.-F. Lan and C.-P. Hsu, J. Chem. Phys., 2020, 153, 214113 CrossRef CAS PubMed.
- J. Lederer, W. Kaiser, A. Mattoni and A. Gagliardi, Adv. Theory Simul., 2019, 2, 1800136 CrossRef.
- C.-W. Ju, E. J. French, N. Geva, A. W. Kohn and Z. Lin, J. Phys. Chem. Lett., 2021, 12, 9516–9524 CrossRef CAS PubMed.
- D. Padula, J. D. Simpson and A. Troisi, Mater. Horiz., 2019, 6, 343–349 RSC.
- D. Padula and A. Troisi, Adv. Energy Mater., 2019, 9, 1902463 CrossRef CAS.
- F. Gajdos, S. Valner, F. Hoffmann, J. Spencer, M. Breuer, A. Kubas, M. Dupuis and J. Blumberger, J. Chem. Theory Comput., 2014, 10, 4653–4660 CrossRef CAS PubMed.
- O. G. Ziogos and J. Blumberger, J. Chem. Phys., 2021, 155, 244110 CrossRef CAS PubMed.
- E. D. Miller, M. L. Jones, M. M. Henry, B. Stanfill and E. Jankowski, AIChE J., 2019, 65, e16760 CrossRef CAS.
- T. Tan and D. Wang, J. Chem. Phys., 2023, 158, 094102 CrossRef CAS PubMed.
- V. Bhat, B. Ganapathysubramanian and C. Risko, ChemRxiv, 2023 DOI:10.26434/chemrxiv-2023-rvzmv.
- J. Aragó and A. Troisi, Phys. Rev. Lett., 2015, 114, 026402 CrossRef PubMed.
- A. M. Rosnik and C. Curutchet, J. Chem. Theory Comput., 2015, 11, 5826–5837 CrossRef CAS PubMed.
- B. Hourahine, B. Aradi, V. Blum, F. Bonafé, A. Buccheri, C. Camacho, C. Cevallos, M. Y. Deshaye, T. Dumitrica, A. Dominguez, S. Ehlert, M. Elstner, T. van der Heide, J. Hermann, S. Irle, J. J. Kranz, C. Köhler, T. Kowalczyk, T. Kubar, I. S. Lee, V. Lutsker, R. J. Maurer, S. K. Min, I. Mitchell, C. Negre, T. A. Niehaus, A. M. N. Niklasson, A. J. Page, A. Pecchia, G. Penazzi, M. P. Persson, J. Rezác, C. G. Sánchez, M. Sternberg, M. Stöhr, F. Stuckenberg, A. Tkatchenko, V. W.-Z. Yu and T. Frauenheim, J. Chem. Phys., 2020, 152, 124101 CrossRef CAS PubMed.
- M. Elstner, D. Porezag, G. Jungnickel, J. Elsner, M. Haugk, T. Frauenheim, S. Suhai and G. Seifert, Phys. Rev. B: Condens. Matter Mater. Phys., 1998, 58, 7260–7268 CrossRef CAS.
- B. M. Savoie, K. L. Kohlstedt, N. E. Jackson, L. X. Chen, M. O. de la Cruz, G. C. Schatz, T. J. Marks and M. A. Ratner, Proc. Natl. Acad. Sci. U. S. A., 2014, 111, 10055–10060 CrossRef CAS PubMed.
- N. E. Jackson, B. M. Savoie, L. X. Chen and M. A. Ratner, J. Phys. Chem. Lett., 2015, 6, 1018–1021 CrossRef CAS PubMed.
- R. M. Ziolek, A. Santana-Bonilla, R. L.-R. de Castro, R. Kühn, M. Green and C. D. Lorenz, ACS Nano, 2022, 16, 14432–14442 CrossRef CAS PubMed.
- D. Balzer, T. J. A. M. Smolders, D. Blyth, S. N. Hood and I. Kassal, Chem. Sci., 2021, 12, 2276–2285 RSC.
- D. Balzer and I. Kassal, J. Phys. Chem. Lett., 2023, 2155–2162 CrossRef CAS PubMed.
- A. Landi and D. Padula, J. Mater. Chem. C, 2022, 10, 10699–10707 RSC.
- Ömer H. Omar, T. Nematiaram, A. Troisi and D. Padula, Sci Data, 2022, 9, 54 CrossRef PubMed.
- A. S. Christensen and O. A. von Lilienfeld, Mach. Learn.: Sci. Technol, 2020, 1, 045018 Search PubMed.
- S. Sami, M. F. Menger, S. Faraji, R. Broer and R. W. A. Havenith, J. Chem. Theory Comput., 2021, 17, 4946–4960 CrossRef CAS PubMed.
Footnote |
| † Electronic supplementary information (ESI) available: Parameters for the QMD-FF derived for C10-DNBDT-NW, further details for simulations, geometries and transfer integral used to train ML models, description of ML models with hyperparameter tuning, performance on the test set, and learning curves, details on the calculation of spectral densities, details and results on kMC simulations. Electronic versions of data are available at this public GitHub repository https://github.com/dpadula85/OFET_strain. See DOI: https://doi.org/10.1039/d3tc02235h |
| This journal is © The Royal Society of Chemistry 2023 |