
 Open Access Article
 This Open Access Article is licensed under a Creative Commons Attribution-Non Commercial 3.0 Unported Licence
Unlocking the sensing potential of phenyl-substituted perylene diimides under extreme conditions†
Paulina
Ratajczyk
 a,
Szymon
Sobczak
*a,
Przemysław
Woźny
a,
Angelika
Wcisło
a,
Tomasz
Poręba
b and
Andrzej
Katrusiak
*a
a,
Szymon
Sobczak
*a,
Przemysław
Woźny
a,
Angelika
Wcisło
a,
Tomasz
Poręba
b and
Andrzej
Katrusiak
*a
aFaculty of Chemistry, Adam Mickiewicz University, Uniwersytetu Poznańskiego 8, 61-614 Poznań, Poland. E-mail: szymon.sobczak@amu.edu.pl; katran@amu.edu.pl
bEuropean Synchrotron Radiation Facility, 71 Avenue des Martyrs, 38000 Grenoble, France
First published on 28th July 2023
Abstract
Phenyl-substituted perylene diimide (PTCDI-Ph) derivatives are prospective organic, electronic and optoelectronic materials. In this study, the effects of modified intermolecular interactions and molecular conformations on the energy gap and the optical properties of PTCDI-Ph were explored at high pressure and various temperatures by calorimetry, X-ray diffraction, UV-vis absorption, and photoluminescence spectroscopy. Below 498 K, PTCDI-Ph transforms from phase I to phase II, which is stable down to 93 K at least. Above 3.0 GPa, phase II transforms into phase III. The compressed intermolecular distance between perylene cores linearly narrows the band gap, due to the intensified π–π stacking. The negative linear compressibility of the crystal along [100] coincides with the negative thermal expansion in this direction. Owing to the strong pressure and temperature dependence of the luminescence spectrum, the PTCDI-Ph derivatives constitute a promising class of highly stimuli-responsive elastic organic materials with broad potential for tailoring their optoelectronic properties through physical and chemical modifications.
 Szymon Sobczak | Dr. Szymon Sobczak, an adjunct at Adam Mickiewicz University, devotes his efforts to understanding pressure-induced transformations across a range of materials, from molecular crystals to MOFs and perovskites. His current research centers on the correlation between structural deformations and changes in physicochemical properties of materials, highlighting the significant role of pressure and varied-temperature conditions. His contributions to the field are marked by innovative approaches, such as developing a sustainable method for disulfide exchange replacing the conventional catalyst with pressure, and protocol for obtaining kinetic polymorphs recoverable at ambient conditions. His investigations of the mechanical behavior of coordination polymers provides a new dimension to the design of flexible and transformable frameworks. |
Introduction
Owing to their low cost, low molecular weight, high electron mobility, and excellent chemical and thermal stability, perylene-3,4,9,10-tetracarboxylic acid diimide derivatives, often referred to as perylene diimides (PDIs), are intensely studied for use in electronic devices, such as organic field-effect transistors (OFETs),1–5 organic light-emitting diodes (OLEDs),6,7 organic photovoltaics (OPVs),8–11 and dye-sensitized solar cells (DSSCs).12,13 An important advantage of PDIs over traditional photovoltaic materials is the possibility of modifying their physical, optical, electronic, and aggregation properties by chemical functionalization at the imide, ortho, and bay core positions (Fig. S1 in the ESI†).13 The introduction of different substituents at the imide position strongly affects the solubility and aggregation of PDIs, but less so for their absorption and emission. Modification of HOMO and LUMO orbital energy levels, and thus the band gap energy, plays a crucial role in determining the power-conversion efficiency (PCE) of PDIs, and can be achieved by introducing an electron-donating substituent at the bay core position. Different electron-donor or -acceptor groups at the bay positions of the perylene core were shown to modulate the electronic and optical properties.14 Halogen substituents improve their solubility, facilitating PDI processing and making them suitable for solar-cell applications. For example, 1,(6)7-dibromo-N,N′-diacetyl PDI is well soluble in organic solvents, while its analogue without Br is not.15 The solubility of PDIs in halogenated solvents, commonly used to prepare the active layer in bulk-heterojunction (BHJ) solar cells,16 can be improved by introducing long alkyl or aryl substituents at the imide and bay core positions,9 while the incorporation of the hydrophilic moieties at the imide positions yields water-soluble PDIs.17,18 The π–π stacking of the perylene cores (Fig. 1), which governs the crystal packing and electron mobility, can also be altered by introducing appropriate steric hindrance between the bulky substituents.9 All these factors can be employed to design the PDI structure, optimized for its physical, chemical, and optoelectronic properties, which are necessary to maximize the high PCE.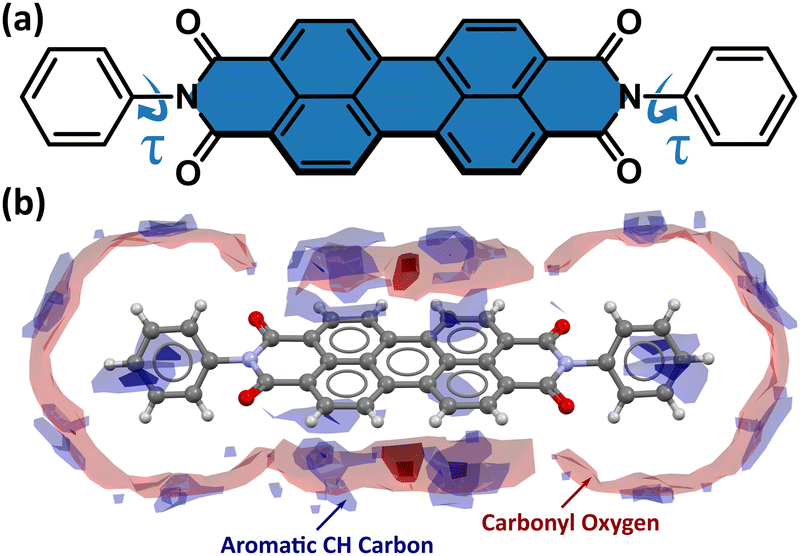 | ||
| Fig. 1 Molecular structure of N,N′-diphenyl-3,4,9,10-perylenedicarboximide (PTCDI-Ph) (a) with the perylene core coloured in blue and with an indicated soft C11–N1–C13–C18 torsion angle (τ); and (b) the closest interaction map indicating the strongest intermolecular interactions types formed at 0.1 MPa/296 K. | ||
A significant challenge in the development of novel organic semiconductors is their polymorphism, illustrating the effect of aggregation and interactions on the properties of compounds; hence the recent research in the field of perylenediimide-based organic semiconductors (PDIs-OSCs) has explored the mechanisms of molecular aggregation not only in terms of chemical derivatives,4,19–21 but also by temperature changes.22,23 It is well known that mechanical impact on soft organic materials, particularly in the form of thin films, can strain the PDI-OSC structure and affect its quantum efficiency. The associated structural changes (molecular conformation, π–π stacking, etc.) can distort the n-type semiconducting properties. Thus, the understanding of structure–property relationships is vital for developing next-generation electronic devices.
In recent years, techniques employing high-pressure and various temperatures have been successfully used to investigate and model strain-induced changes in inorganic and hybrid perovskites.24–26 However, organic photovoltaic materials were only sporadically studied under extreme conditions.27–29 To the best of our knowledge, few studies have focused on specific aspects of semiconducting perylene diimide derivatives, such as their structural or optical response to pressure and temperature changes.22,23,30,31 These scarce comprehensive studies significantly increased the understanding of the structure–property relationships as a function of temperature and pressure. In our present study, we employed the varying-temperature and high-pressure synchrotron and in-lab X-ray diffraction techniques, alongside differential scanning calorimetry (DSC), UV-vis absorption, and photoluminescence (PL) spectroscopy to explore the effects of structural deformations under external stimuli on the optoelectronic properties of a chemically and thermally stable phenyl-substituted PDI derivative, N,N′-diphenyl-3,4,9,10-perylenedicarboximide (PTCDI-Ph). In light of our results, PTCDI-Ph is a promising material for highly efficient organic electronic and optoelectronic devices.32–34
Results and discussion
Under room conditions (296 K/0.1 MPa), PTCDI-Ph crystallizes in monoclinic phase II, space group P21/c, with the molecule located on the inversion centre (Z′ = 0.5). The perylene-diimide skeleton of PTCDI-Ph is flat, but the terminal phenyl rings are rotated off the plane by 58.5°: this rotation is measured by the torsion angle C11–N1–C13–C18, denoted τ (Fig. 1a). The rotation of phenyl substituents is crucial for π-electron coupling in the alternative systems of conjugated bonds. Several examples in the literature demonstrate that flattening of conjugated systems increases π-electron coupling, whereas the off-plane rotations of substituents hamper the electron mobility.35–37 Furthermore, the τ angle reflects the intermolecular interactions within the structure, specifically the stacking distance (dπ–π) and stacking displacements (αagg and βagg), which are key factors for the charge-transfer characteristics. In phase II, the PTCDI-Ph molecules are π–stacked into columns along the crystal [010] direction, as shown in Fig. 2 (cf. S3 in the ESI†). Hydrogen bonds CH⋯O dominate the interactions between the neighbouring columns (Fig. 2). This type of aggregation stabilizes the structure of phase II in a remarkable temperature range from 490 K down to 93 K at least,38 as well as at a high pressure to 2.85 GPa (Fig. 3). We have corroborated different structural and physicochemical properties within its phase-stability region using various techniques, including the effects of temperature (490 K to 130 K), and high-pressure probed by in-house and synchrotron X-ray diffraction (up to 3.55 GPa), differential scanning calorimetry (from 200 to 573 K), photoluminescence (293 to 573 K and up to 6.44 GPa), and UV-vis spectra (up to 4.99 GPa). The results are presented in the following paragraphs.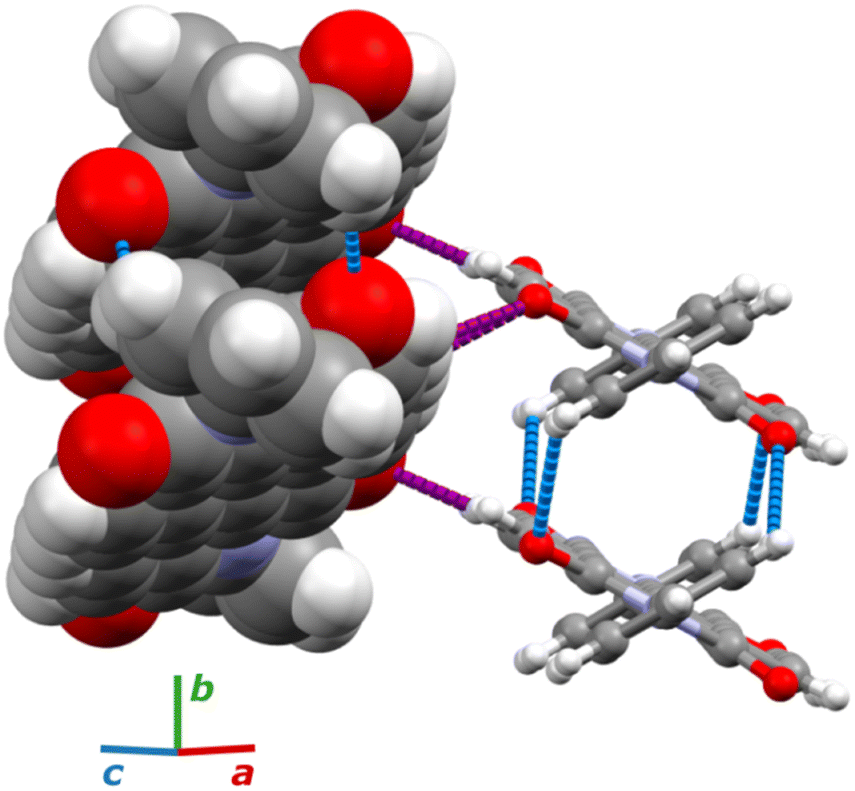 | ||
| Fig. 2 Aggregation of molecules in PTCDI-Ph phase II: one column is drawn in the space-filling style and the other as balls-and-sticks. The CH⋯O contacts between π-stacked molecules are blue and those between adjacent columns are purple. | ||
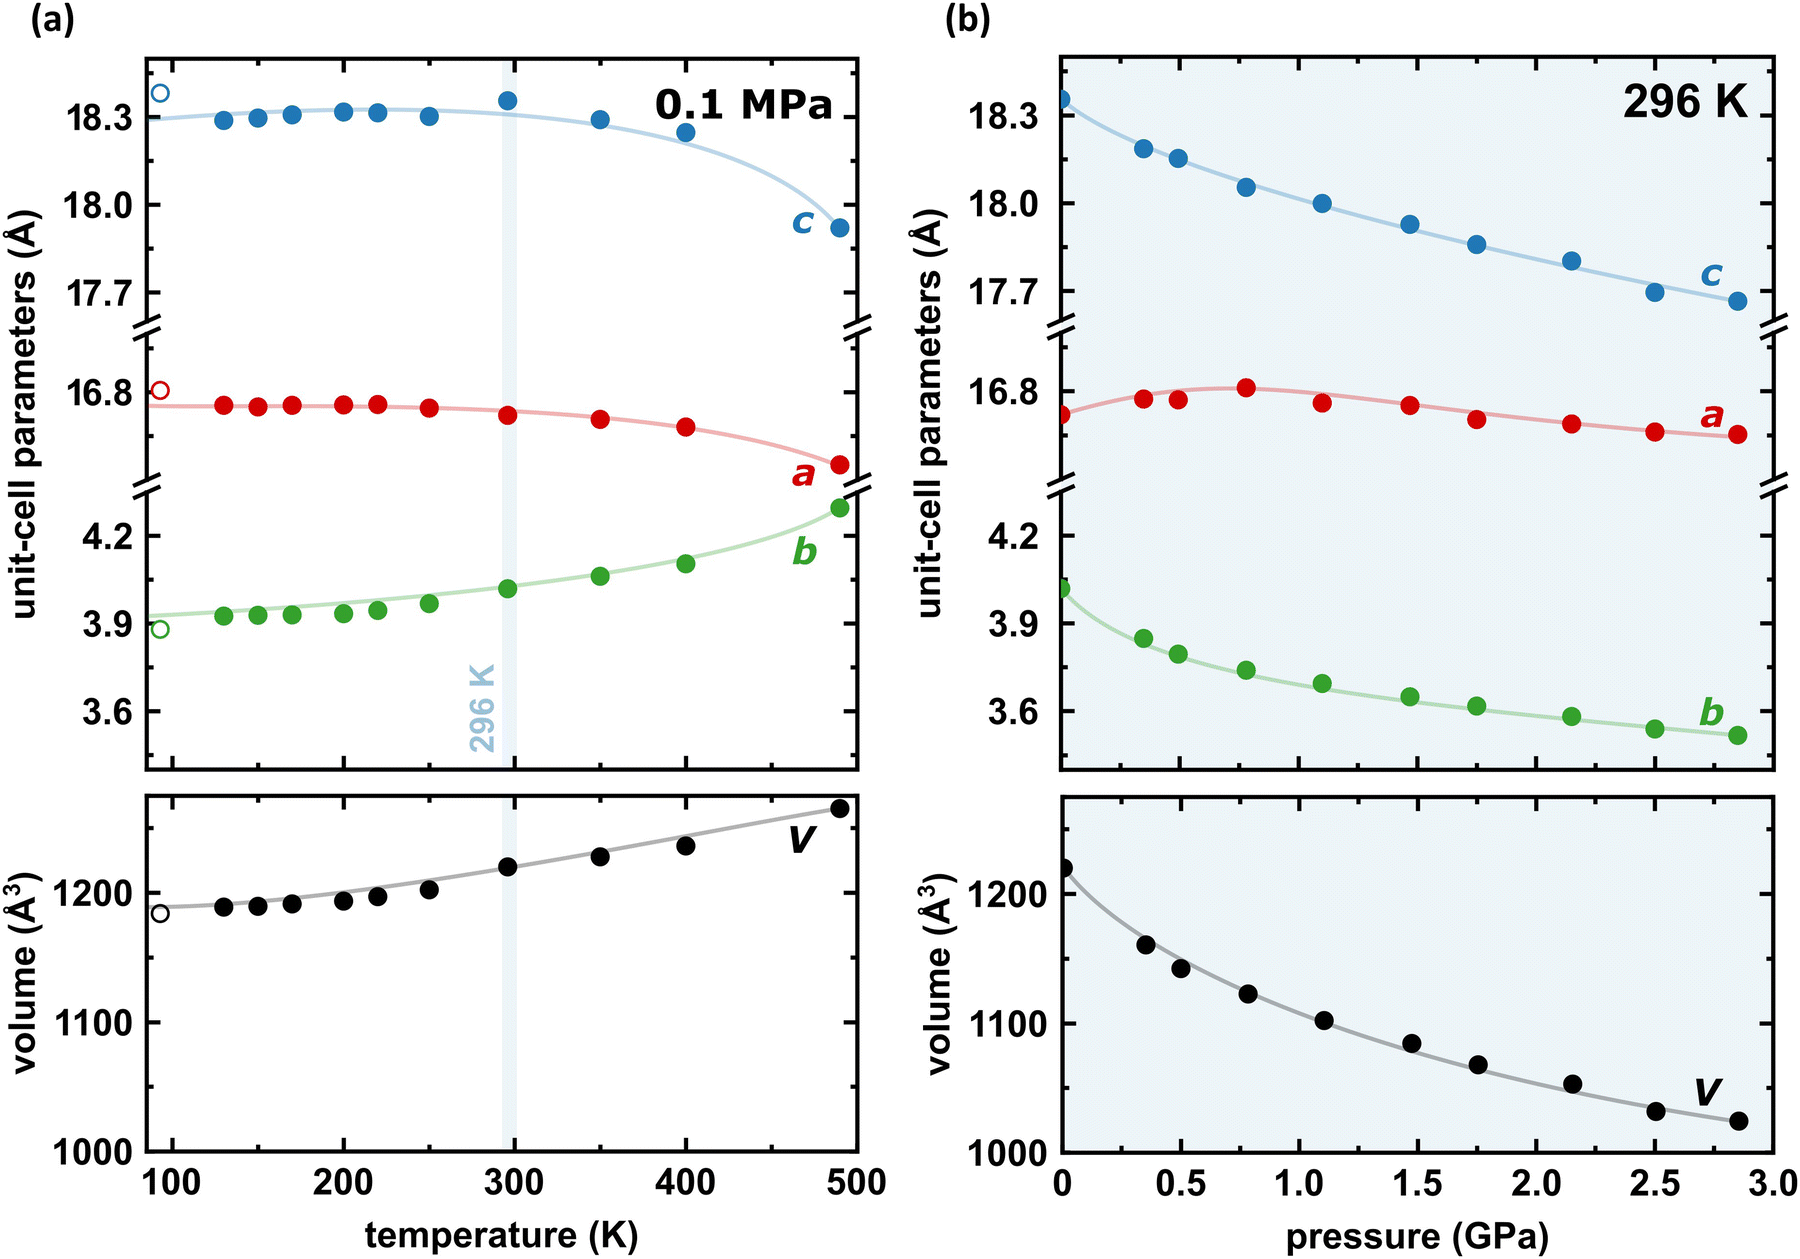 | ||
| Fig. 3 Temperature (a) and pressure (b) dependence of the unit-cell dimensions a, b, c (top) and its volume (bottom) for PTCDI-Ph phase II. Open symbols mark the data previously reported by Sato and Mizuguchi.38 The estimated standard deviations (ESDs) are smaller than plotted symbols. The blue highlight indicate the data measured at 296 K. The changes in monoclinic angle β are shown in Fig. S5 in the ESI.† | ||
Thermal expansion
The result of our systematic study on the temperature dependence of PTCDI-Ph is consistent with the previously reported single-point structure determination at 93 K/0.1 MPa.38 Notably, the PTCDI-Ph phase II crystals exhibit unusual changes in the sign of thermal expansion upon cooling: above room temperature, the crystal shrinks in directions [100] and [001], and the expected elongation with an increase in temperature is observed only along direction [010], as shown in Fig. 3. However, the thermal expansion is strongly non-linear, and below room temperature, the linear thermal expansions become positive in all directions (Fig. S7a, ESI†). The observed changes in the thermal expansion of the crystal can be connected with its strongly anisotropic structure. The CH⋯O contacts; CH2⋯O1 and CH3⋯O1 (Fig. S2 in the ESI†), on the H-donor site formed in the plane of the perylene–imide skeleton with adjacent molecules, effectively support the structure perpendicular to direction [010] (Fig. 2). At low temperatures, the N-substituted phenyl group rotates to a lower τ angle from τ = 58.5(7)° at 296 K to 55.7(3)° at 93 K (Fig. 4a), which coincides with the negative thermal expansion along direction [100]: from 130 to 296 K, the lattice parameter a shrinks by −0.035 Å (cf. Table S1, ESI†). The packing of PTCDI-Ph phase II correlates with the phenyl position, the most non-planar molecular fragment (Fig. 4a), and in fact, the calculated intermolecular potentials39,40 indicate a reduction in total packing energy from −294 kJ mol−1 at 296 K/0.1 MPa to −295.5 kJ mol−1 at 130 K. This modifies the PTCDI-Ph optoelectronic properties, as described by Kasha's theory,41–43 further extended by Spano explicitly for PDI dimers.23 The main contribution to the cohesion forces comes from the π–π stacking (−170 kJ mol−1 at 296 K/0.1 MPa) and H-bonds (about 10% for the carbonyl O1 atom and 5% for the O2 of the total energy). Thus hydrogen bonds CH⋯O account for over 15% of the crystal cohesion forces (cf. Fig. S4, ESI†).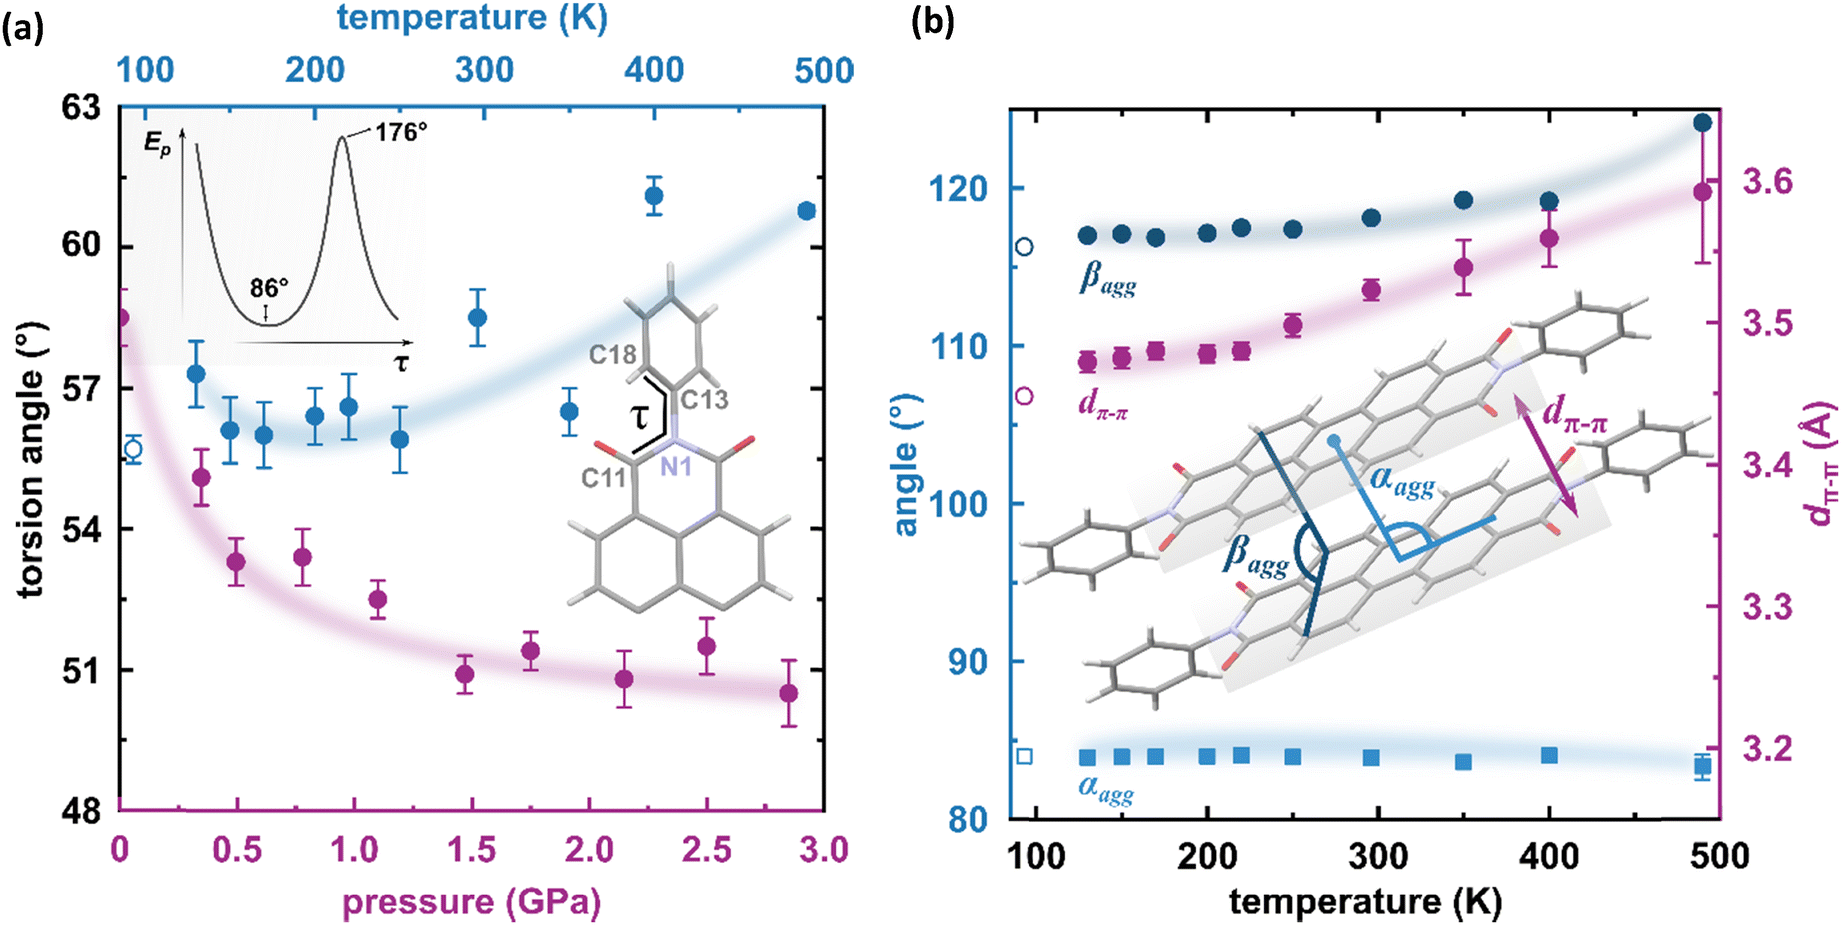 | ||
| Fig. 4 (a) Change of the torsion angle τ (C11–N1–C13–C18) as a function of temperature (blue symbols), and pressure (purple symbols) in the PTCDI-Ph molecule. An open symbol refers to the previously reported structure by Sato and Mizuguchi.31 Inset: Potential energy of the isolated PTCDI-Ph molecule with rotation around one torsion angle (another τ was fixed at 55.92° as derived from the X-ray measurement). (b) Packing arrangements in PTCDI-Ph phase II at varying temperatures: purple circles mark the distance between π-stacked molecules (dπ–π) and blue symbols represent the packing angles (αagg and βagg). The αagg denotes the angle formed by the imide N-atom, perylene core centroid, and the centroid of the closest molecule from the same stack, and the βagg is the angle between two C-atoms (C3 and C9) of one perylene core and a carbon atom (C9) of the neighbouring molecule. | ||
According to Kasha,42 a blue-shifted absorption maximum and suppressed radiative decay rate occur for molecular dimers stacked face-to-face or in a card-pack arrangement, while those stacked head-to-tail exhibit a red-shifted absorption maximum and enhanced radiative decay rate. These dimers are known as H-aggregates and J-aggregates, respectively. The arrangements of the interacting molecules in the linear chain can be differentiated by the packing angle describing the shift between molecules, and thus for the H-aggregates αagg approximates 90° and for J-aggregates αagg = 0°.44 However, in certain packing arrangements, such as in π-stacks, the distance between the rigid backbone of the molecules is close enough (when dπ–π < 3.5 Å) to allow for significant wave-function overlap and the emergence of short-range interactions.45 In such stacks, the exciton bandwidth and curvature at the band centre are determined by interference between short-range coupling, due to the wave-function overlap and long-range Coulomb coupling arising from transition dipole–dipole interactions.23,44 This, sometimes unfavoured interference, can result in an unusual situation where the chromophore aggregate displays monomer-like properties (null aggregates).23,44 This situation was described as a characteristic of PDIs, where the positive long-range coupling may induce H-aggregate behaviour, whereas counteracting short-range coupling can induce J-aggregate behaviour, combining into so-called HJ-aggregate properties.23
To correlate the changes in the optoelectronic properties of PTCDI-Ph with the inclination from an ideal π-stack in our solid-state structures, we adopted the descriptors αagg and βagg analogous to the pitch and roll angles developed by Curtis et al. (cf. Tables S6 and S7 in the ESI†).46 The αagg inclination translates adjacent stacked molecules relative to one another in the direction of the long molecular axis while βagg inclination translates the molecules along the short molecular axis (Fig. 4b). Our analysis of the temperature-induced changes in the aggregation of PTCDI-Ph molecules revealed that below room temperature (296 K), the π-stacking geometry is hardly affected: αagg increases by 0.09°, while βagg decreases by 1.57° in the 296–93 K range; the distance between molecules decreases quite significantly, from 3.523(7) Å at 296 K to 3.448(2) Å at 93 K. According to our calculations, this process is connected to the phenyl rotation, influencing the potential energy, Ep (Fig. 4a and Fig. S10, ESI†).
Above 300 K, adjacent π-stacked molecules significantly shift as the thermal motions build up progressively. This process is clearly visible as the elongation of the unit-cell direction b, directly related to the stacking distance. Although the expansion of the unit-cell increases above 350 K, the intermolecular CH⋯O distances hardly change, confirming their important role in the stability of phase II (Fig. S2, ESI†). The thermally-induced strain is compensated by the rotation of the terminal phenyl ring towards the lower-energy conformation (Fig. 4a and Fig. S10, ESI†). This conformational alteration elongates the dπ–π distance, which at 490 K is 3.59(5) Å. Simultaneously, αagg decreases while βagg increases, which may be interpreted as the packing adjustment towards the J-aggregate.
The considerable interest in developing materials with tunable luminescence susceptible to physical parameter changes, such as temperature and pressure,47–51 inspired us to measure the photoluminescence of PTCDI-Ph crystals subjected to varying thermodynamic conditions. The PL spectrum of PTCDI-Ph in phase II consists of two distinguishable emission bands: an intense band A at λ ≈ 680 nm and a lower intensity band B at λ ≈ 737 nm (Fig. 5). When the system is heated, the overall luminescence intensity of both bands decreases by 53% (at 473 K), but the relative intensity of band B compared to A evolves monotonically.52 This observation is consistent with the previous investigation by Spano et al.23 Above 350 K, the emission band starts to broaden and at 490 K, its full width at half maximum (FWHM) doubles, compared to the room temperature. Above this point, the discontinuous change in the PL spectrum shape marks a phase transition to high-temperature phase I. This phase transformation, additionally confirmed by our powder diffraction data (Fig. 12), is reversible upon cooling. The absence of hysteresis and the DSC peak shape (Fig. 6) indicate a second-order character of this phase transition.
 | ||
| Fig. 5 Normalized emission spectra of the PTCDI-Ph heating cycle up to 573 K after excitation at λ = 411 nm. Inset: Changes of the full-width at half maximum (FWHM) upon phase transition at high temperature. | ||
 | ||
| Fig. 6 Differential scanning calorimetry (DSC) thermogram of PTCDI-Ph in the heating and cooling cycles. | ||
As the temperature continues to increase up to 523 K, the emission intensities of overlapped bands with a maximum at λ ≈ 692 nm increase, which can be linked to the change from an oblique head-to-tail structure to the head-to-tail card-pack aggregation, which involves a change in the π–π intermolecular stacking. In phase I at 523 K, thermal quenching is observed again and continues up to 573 K. The hypsochromic shift of the emission bands at higher temperatures confirms intensified head-to-tail stacking in phase I.53
The observed changes in luminescence, such as the increased emission intensity and the generation of one broadband, may be attributed to the changes in the excited energy levels and the occurrence of phosphorescence (T → S0) at the expense of fluorescence (S1 → S0) due to the altered packing and defects appearing when the crystal transforms to phase I.53
High-pressure behaviour
The X-ray diffraction data collected up to 3.55 GPa at room temperature (Table 2) show that phase II can be compressed to about 2.85 GPa without any signs of phase transition. However, the measurement at 3.20 GPa revealed a symmetry change: the unit-cell angles α and γ deviate from 90°, indicating a transition to the triclinic system (phase III). Due to this symmetry reduction, single crystals were twinned and broken, which hampered the structural analysis above 2.85 GPa and allowed only for the collection of the powder diffraction pattern of phase III (Fig. 11).The molecular volume of a PTCDI-Ph crystal compressed to 2.85 GPa decreases by about −16% (the compressibility and Birch–Murnaghan coefficients are provided in the ESI†). Over this pressure range, the unit-cell parameters are compressed: a by −0.4%, b by −12.5% and c by −3.8% (Fig. 3b). The strongest compressibility in the [010] direction correlates with a decrease in the distance between weakly-bonded π-stacked perylene cores. The dπ–π distance changes from 3.523(7) Å at 0.1 MPa to 3.183(3) Å at 2.85 GPa. Interestingly, below 0.78 GPa, the crystal exhibits negative linear compressibility (NLC) along [100]. Negative compressibility is an unusual elastic response when the crystal becomes longer in one direction, despite increased hydrostatic pressure.54–56 In PTCDI-Ph, NLC exists only up to 0.78 GPa, above which it reverses to the positive linear compressibility along the [100] direction. This phenomenon can be rationalized by the presence of a wine-rack motif of CH⋯O bonded PTCDI-Ph molecules.55,56 Such a mechanism arises from the soft CH9⋯O2 bond formed between stacked molecules, parallel to the [010] direction, and the much stronger CH2⋯O1 bond, linking the molecules from adjacent columns. Furthermore, compression reduces the τ angle to 50.5° at 2.85 GPa, as the PTCDI-Ph molecule becomes flatter (Fig. 4a). The PTCDI-Ph molecules tied by the intramolecular interactions are forced to reduce the dπ–π distance (Fig. 7). Also, the H-aggregating properties are enhanced when the material is compressed as αagg increases to 86° at 2.85 GPa. Such structural changes are mirrored in the absorption-band shifts observed at high pressure. By measuring the UV-vis spectra of the PTCDI-Ph crystals compressed in the DAC chamber, we determined the pressure dependence of the absorption edge (Fig. 8a). At 0.03 GPa the absorption edge of PTCDI-Ph at about 629 nm corresponds to the energy band gap of around 1.97 eV, which is comparable with the results reported by Ichikawa and co-workers.57 Up to 4.99 GPa, a strong bathochromic shift is approximately 33 nm GPa−1 in the 630–793 nm range. As the pressure increases, the crystal visibly changes its colour from red to black (Fig. 8b). This change is fully reversible, and after reducing the pressure, the original colour returns. The determined optical energy gap (Eg), plotted as a function of pressure in Fig. 8b, shows that the bandgap narrows linearly, from 1.97 eV at 0.03 GPa to 1.56 eV at 4.99 GPa. After releasing pressure, the absorption-edge values are very close to the initial ones. Importantly, we do not observe significant changes in the absorption-edge shift above the phase transition; the bandgap continues to narrow linearly.
 | ||
| Fig. 7 Changes in the packing of PTCDI-Ph phase II under compression (b): purple circles mark the distance between π-stacked molecules (dπ–π) and blue symbols represent the packing angles αagg and βagg (cf.Fig. 4). | ||
 | ||
| Fig. 8 Pressure evolution of the (a) absorption spectra and (b) optical band gap; closed and open symbols correspond to the compression and decompression runs, respectively. The inserted photos show the PTCDI-Ph film prepared for measurements of UV-vis spectra at 0.03, 1.31, 3.43 and 4.99 GPa, showing the darkening of the sample as the pressure increases. | ||
The photoluminescence properties of PTCDI-Ph crystals at high pressure were investigated using excitation at λ = 411 nm, which correlates with the broad absorption band at 400–600 nm (Fig. 9). The resulting emission spectra show a broad band in the range of 600–950 nm with the peak maximum at λ ≈ 679 nm (band A) and at λ ≈ 750 nm (band B), with a total FWHM of approximately 57.44 nm at 0.01 GPa. A gradual bathochromic shift of the PTCDI-Ph emission band was observed during the compression cycle. The band centroid of PTCDI-Ph phase II bands A and B shifts almost linearly with a rate of 6.26 nm GPa−1 up to 3 GPa (Fig. S8a in the ESI†). However, above the transition from phase II to phase III, the bathochromic shift drastically decreases and above 3.2 GPa, bands A and B change with a rate of 2.09 nm GPa−1. Within phase III the bandwidth further broadens with a rate of 0.20 nm GPa−1, to 65.17 nm at 6.5 GPa, compared to the maximum FWHM value of 64.11 nm in phase II just before the transition.
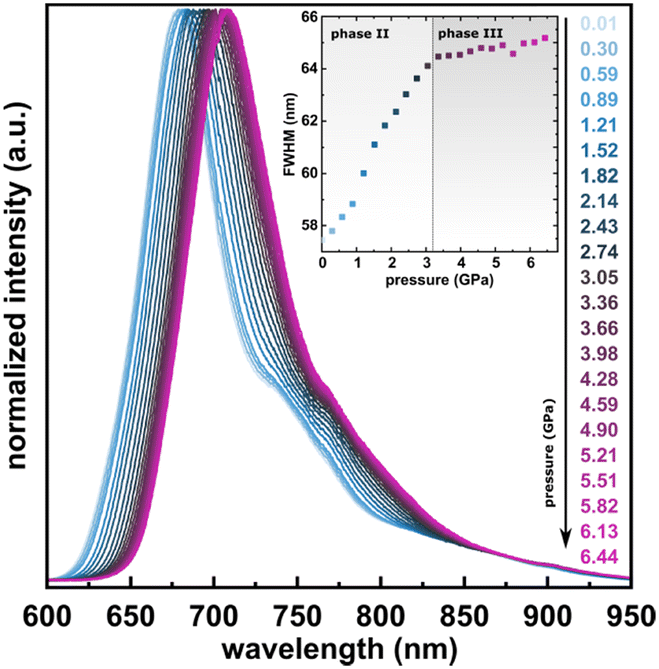 | ||
| Fig. 9 Normalized emission spectra of PTCDI-Ph in the compression cycle up to 6.44 GPa after excitation at λ = 410 nm. Inset: Changes in the full-width at half maximum (FWHM) of the band. | ||
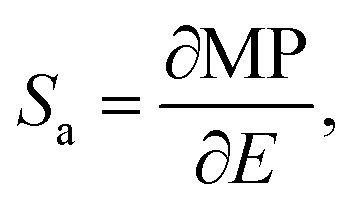
Pressure and temperature sensing
The astonishing optoelectronic properties and excellent chemical and thermal stability are the prerequisites desired for the potential application of PTCDI-Ph as an extreme condition sensor (cf. Experimental section). To investigate the sensing performance of PTCDI-Ph, we have calculated the absolute sensitivity (Sa) parameter separately for high pressure up to 6.44 GPa (Fig. 10a) and for high temperature up to 450 K (Fig. 10a). We fitted the experimentally assigned shift of the band A centroid (MP) as a function of the stimuli (E) using empirical polynomial functions (cf. Fig. S8 and S9 in the ESI†) and calculated the sensitivity response to external stimuli using the following equation:for which we found a high degree of correlation in both ranges: for high pressure R2 > 0.99 and for elevated temperatures R2 > 0.98.
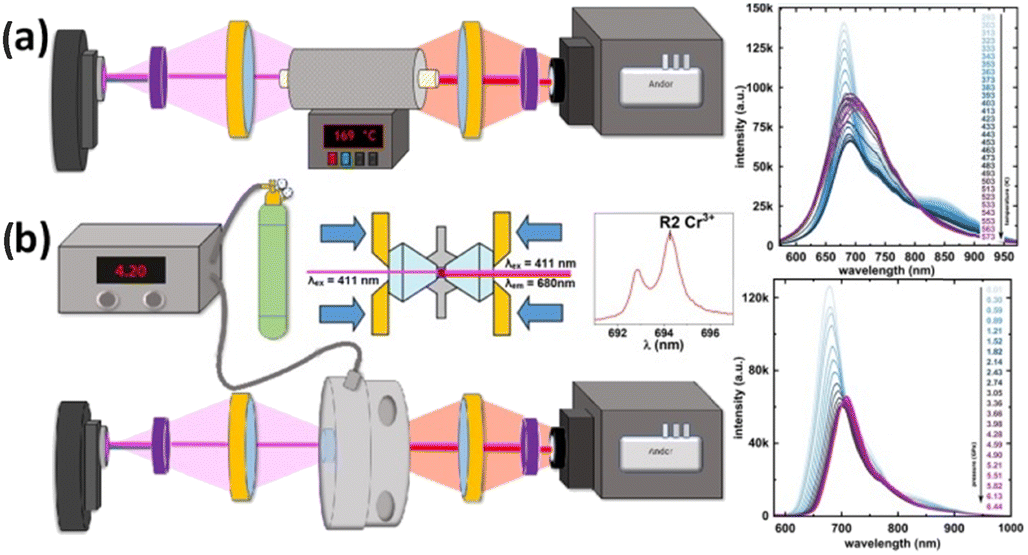 | ||
| Fig. 10 Schematic drawings of experimental setups with PTCDI-Ph crystals applied as (a) high-temperature and (b) high-pressure sensors. The accompanying plots illustrate the shifts in the respective luminescence spectra (cf.Fig. 5 and 9). | ||
Up to this point, the most extensively investigated group for high potential as temperature and pressure sensors were inorganic materials containing rare earth ions.58–67 However, due to the high cost of rare-earth elements, other less expensive, safe, and stable carbon-based alternatives that can act as high-performance contactless sensors are intensively sought. For comparison, the Sa values obtained for PTCDI-Ph are considerably higher than those reported for other luminescence-based temperature sensors in the literature (Table 1 and Table S8 in the ESI†). PTCDI-Ph exhibits a remarkable sensitivity to temperature up to 370 K, where the Sa parameter reaches 0.068 nm K−1. Above this temperature, the sensitivity gradually decreases, through the values of 0.065, 0.055, and 0.045 nm K−1 observed for 380, 400, and 420 K, respectively. While there is a limited number of reports68 on contactless thermometers based on the band shift at varying temperatures, our study highlights the broad operating temperature range of PTCDI-Ph (up to 450 K), low-temperature quenching, high signal stability, and its satisfactory sensitivity and repeatability.
| Host/emitting ion | Sensitivity line shift, Sa | Ref. | |
|---|---|---|---|
| nm K−1 | nm GPa−1 | ||
| PTCDI-Ph | 6.8 × 10⁻² | 8.33 | This work |
| YVO4/Er3+ | 5.16 × 10⁻³ | 1.766 | 58 |
| SrFCl/Sm2+ | 2.36 × 10⁻³ | 1.11 | 59 |
| BaLi2Al2Si2N6/Eu2+ | — | 1.58 | 60 |
| Y2SiO5/Pr3+ | — | 1.04 | 61 |
| Y2Ge0.10Si0.90O5/Pr3+ | — | 1.28 | 61 |
| YAlO3/Cr3+ | 7.6 × 10⁻³ | 0.70 | 62 |
| NaBiF4/Er3+ | — | 0.8 | 63 |
| Bi2MoO6/Er3+, Tm3+, Yb3+ | 8.5 × 10⁻³ | — | 64 |
| SrB4O7/Eu2+ | 4.8 × 10⁻⁴ | 0.17 | 65 |
| SrB4O7/Sm2+ | 1 × 10⁻⁴ | 0.255 | 69–71 |
| YPO4/Tm3+ | — | 0.8 | 66 |
| Al2O3/Cr3+ | 6.2 × 10⁻³ | 0.365 | 72 |
Similarly high performance was observed at high pressure, where the Sa parameter of PTCDI-Ph increases dramatically from ambient conditions, for which Sa = 1.34 nm GPa−1, to 1.76 GPa where it reaches a maximum value of 8.33 nm GPa−1. Within this range (up to 1.76 GPa), the sensing performance of PTCDI-Ph significantly exceeds most of the described inorganic sensors, for which the pressure sensitivity is not higher than 3 nm GPa−1.73,74 Although the structural changes related to the phase transition decrease above 3.2 GPa, the Sa value at 5.19 GPa (Sa = 1.88 nm GPa−1) is still much higher than the sensitivity reported for most of the inorganic sensors. In the pressure range between 5.19 and 6.44 GPa, the high Sa value is restored, increasing to 5.43 nm GPa−1.
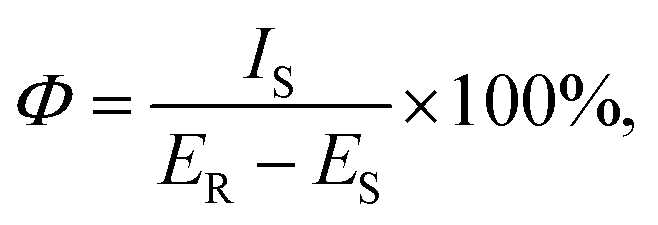
The photoluminescence quantum yield (Φ) is a crucial factor in determining the performance of luminescent materials. We calculated the quantum yield using the following equation:
Conclusions
Our study shows that PTCDI-Ph is a highly stable n-type semiconductor with impressive phase stability, attributed to the strong π–π interactions between the perylene cores and CH⋯O bonds that further stabilize the crystal structure. Phase II is stable in a wide range of temperatures up to 490 K and compression up to 3.0 GPa. We also characterized two distinct phases above this range: phase I stable above 493 K, and phase III stable above 3.0 GPa. These findings provide new insights into the behaviour of PTCDI-Ph under extreme conditions, highlighting the potential of PTCDI-Ph as a stable optoelectronic stimuli-responsive organic luminophore, whose properties can be tailored through chemical modifications and physical stimuli. For the PTCDI-Ph phase II crystals subjected to the temperature and pressure stimuli, the observed energy gap and luminescence clearly show the importance of the π-stacking distance, prevailing over other structural transformations. Consequently, the pitch-and-roll model46 has been extended to the pitch–roll–squeeze model, which stresses the importance of intermolecular π–π and p–p orbital overlaps.79Due to the specific pattern of the H-bonds between the π-stacked columns, the crystals of PTCDI-Ph exhibit the negative linear compressibility and negative thermal expansion, both in the same direction [100]. The high rigidity in the direction perpendicular to soft π-stacks sustains the non-radiative pathways upon application of external stimuli (high pressure/temperature). The significant structural changes impacting the molecular aggregation have been correlated with its luminescence as a function of temperature and pressure. The properties of PTCDI-Ph and its chemical inertness are ideal for multimodal-sensor applications. In particular, its sensitivity in the range of up to 1.76 GPa, where Sa = 1.34 nm GPa−1, and temperatures up to 350 K, for which Sa is 0.068 nm K−1, significantly outperforms those of most of the previously described inorganic sensors.
Experimental methods
Materials
N,N′-Diphenyl-3,4,9,10-perylenedicarboximide of 98% purity was purchased from Merck and further purified by sublimation at 650 K in a sealed glass tube (cf. Section S1 in the ESI†). The attempts to recrystallize PTCDI-Ph in various solvents, including methanol, ethanol, chloroform, dimethylformamide (DMF), dimethyl sulfoxide (DMSO), hexane, ethyl acetate, and dichloromethane, using moderate heating (up to 100 °C) and stirring did not succeed due to insufficient dissolution.High-pressure X-ray diffraction
High-pressure X-ray diffraction measurements were performed in a membrane-driven diamond-anvil cell (DAC). A single crystal of PTCDI-Ph together with a small ruby, used as a pressure calibrant,80,81 were mounted inside a 0.3 mm hole in a steel gasket. The remaining volume was filled with a mixture of methanol:ethanol (4![[thin space (1/6-em)]](https://www.rsc.org/images/entities/char_2009.gif) :1), used as the pressure-transmitting medium.82 The single crystal of PTCDI-Ph was isothermally compressed up to 3.78 GPa. The in-situ high-pressure synchrotron X-ray diffraction data were measured at the ID15B beamline at the European Synchrotron Radiation Facility in Grenoble.83 A monochromatic X-ray beam with a wavelength of 0.4099 Å was used, and a single ω-scan ±32° strategy was applied. Unfortunately, the phase transition between phases II and III led to the destruction and partial amorphization of the single crystal, and above 3.5 GPa we were able to collect only powder diffraction patterns (Fig. 11).
:1), used as the pressure-transmitting medium.82 The single crystal of PTCDI-Ph was isothermally compressed up to 3.78 GPa. The in-situ high-pressure synchrotron X-ray diffraction data were measured at the ID15B beamline at the European Synchrotron Radiation Facility in Grenoble.83 A monochromatic X-ray beam with a wavelength of 0.4099 Å was used, and a single ω-scan ±32° strategy was applied. Unfortunately, the phase transition between phases II and III led to the destruction and partial amorphization of the single crystal, and above 3.5 GPa we were able to collect only powder diffraction patterns (Fig. 11).
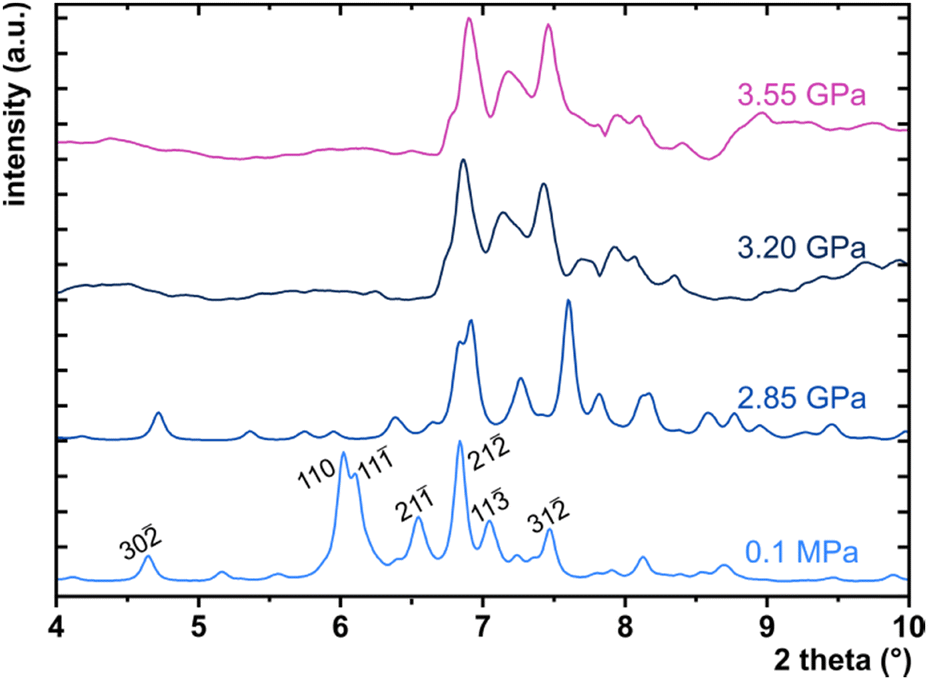 | ||
| Fig. 11 PXRD collected for PTCDI-Ph phase II at 0.1 MPa, 2.85 and 3.20 GPa as well as phase III at 3.55 GPa. The measurements were performed using synchrotron X-ray diffraction (λ = 0.4099 Å). Patterns for 0.1 MPa and 2.85 GPa are the calculated diffractograms from single-crystal measurements. | ||
In this case, the collected diffraction images have been summed up using PyMCA, and subsequently integrated into powder diffraction patterns with Dioptas software. The CrysAlisPro software was used for data collection and reduction.84 The crystal structures were solved and refined with SHELX software implemented in Olex2.85,86 The crystallographic data and experimental details are summarized in Table 2 and Table S12 in the ESI† and have been deposited in CIF format in the Cambridge Crystallographic Database with numbers CCDC 2253183–2253192.† Structural illustrations were prepared using the program Mercury 2021.3.0.87
| p/T | Unit cell | V (Å3) | D x (g cm−3) | |||
|---|---|---|---|---|---|---|
| a (Å) | b (Å) | c (Å) | β (°) | |||
| 0.1 MPa/130 K | 16.755(5) | 3.9243(13) | 18.288(4) | 98.69(2) | 1188.7(6) | 1.516 |
| 0.1 MPa/296 K | 16.72(4) | 4.0187(8) | 18.355(3) | 98.55(6) | 1220(3) | 1.477 |
| 0.1 MPa/490 K | 16.52(3) | 4.344(4) | 17.92(4) | 97.10(19) | 1276(4) | 1.411 |
| 0.35 GPa/296 K | 16.773(19) | 3.8482(6) | 18.186(3) | 98.64(6) | 1160.5(14) | 1.553 |
| 2.85 GPa/296 K | 16.644(13) | 3.5187(2) | 17.670(3) | 98.14(4) | 1024.4(8) | 1.759 |
Varied-temperature X-ray diffraction
The low- and high-temperature single-crystal measurements were performed on SuperNova and Xcalibur diffractometers, respectively, with a microfocus source (CuKα = 1.54178 Å) and an Oxford CryojetHT (allowing for measurements in the range of 90–490 K). A series of six measurements for the cooled and three for the heated sample between 130 and 490 K were collected. The resulting data were then processed as described above for the high-pressure experiments. The final crystal data are summarized in Table 2 and Table S11 in the ESI† and have been deposited in the CCDC with numbers 2253193–2253201.† As the phase transformation between phases II and I occurs slightly above the capabilities of the Cryojet, we could only collect a powder diffractogram of phase I at 493 K (Fig. 12).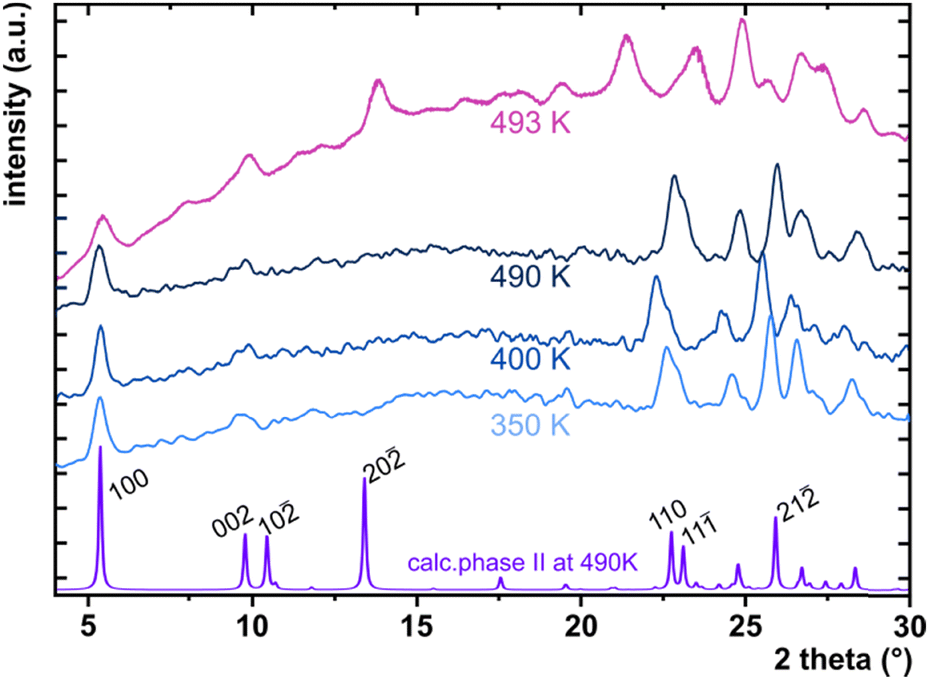 | ||
| Fig. 12 High-temperature PXRD of PTCDI-Ph (phase II at 350, 400 and 490 K and phase I at 493 K) measured with Cu Kα, and the pattern at the bottom with indicated hkl planes is the calculated diffractogram from the single-crystal measurements collected at 490 K. | ||
High-pressure optical absorption
The ultraviolet-visible (UV-vis) spectra of the solid-state PTCDI-Ph layer were recorded using a Merrill-Bassett diamond-anvil cell equipped with diamond IIA anvils. The diamond culets were 0.8 mm in diameter. The gasket was made of 0.1 mm thick tungsten foil with a sparked-eroded hole 0.45 mm in diameter. The PTCDI-Ph layer was prepared on the diamond culet: a small amount of the sample was strongly pressed by a thick glass plate until it smashed into a uniform layer. Daphne Oil 7575 was used as the pressure-transmitting medium. The UV-vis spectra of PTCDI-Ph at high pressure were recorded with a Jasco V-770 spectrophotometer adapted for use with a DAC. The absorbance was measured at a scan speed of 200 nm min−1 in the 400–900 nm range.High-temperature and high-pressure photoluminescence
The photoluminescence properties (i.e., emission spectra, PL) of the PTCDI-Ph powder were measured by exciting the samples with a 411 nm LED light with the use of an Andor Shamrock 500 spectrometer coupled with a silicon CCD detector (Fig. 10). For high-temperature measurements, the sample was placed in a tube-furnace. The high-pressure measurements were performed in a membrane diamond-anvil cell equipped with diamond IIA anvils. Daphne Oil 7575 assured the hydrostatic pressure up to 4.78 GPa.88,89 All photoluminescence data were corrected for the apparatus response, i.e., the emission spectrum of the SLS201L light source provided by the manufacturer, and the emission spectrum of the SLS201L light source measured on the CCD detector. Photoluminescence quantum yield was measured using an integrating sphere, λLED = 411 nm, as an excitation source, and an Andor spectrometer as the detector.Differential scanning calorimetry
The PTCDI-Ph was characterized by differential scanning calorimetry (DSC) using Thass DSC XP-10 apparatus. The measurement in a heating (from ambient temperature to 573 K) and cooling (from 573 K to 200 K) cycle at a rate of 5 K min−1 was carried out under a N2 atmosphere.Ab initio calculations
The potential energy (Ep) of the isolated PTCDI-Ph molecule depending on rotation about one torsion angle was calculated using the Gaussian 16 program, Revision C.0190 by applying the B3LYP basis set 6-311++g(2d,2p). Atomic positions were first retrieved from the CIF file for the measurement collected at 296 K/0.1 MPa and optimized with one of the torsion angles fixed at τ = 55.92°. All H-atoms were renormalized. The energy values in hartee were converted to kJ mol−1 (1 hartee is 2625 kJ mol−1). All HOMO and LUMO energy levels (Tables S9 and S10 in the ESI†) were calculated using MOPAC 2016 and the PM6 method.91Author contributions
Methodology: P. R., S. S., P. W., T. P., and A. K.; investigation: P. R., S. S., P. W., A. W., and T. P.; resources: P. W., T. P., and A. K.; data curation and formal analysis: P. R., S. S., P. W., and T. P.; conceptualization: S. S.; supervision and validation: S. S. and A. K.; visualization: P. R.; funding acquisition: P. R. and A. K.; original draft preparation: P. R., S. S., and A. K.; and review and editing: all authors. All the authors have given their approval to the final version of the manuscript.Conflicts of interest
There are no conflicts of interest to declare.Acknowledgements
The authors acknowledge the European Synchrotron Radiation Facility (ESRF) for the provision of synchrotron radiation facilities. P. R. is a recipient of the Adam Mickiewicz University Foundation scholarship for the 2022/2023 academic year and is grateful to the Polish Ministry of Education and Science (Diamentowy Grant DI2019/0160/49) for their financial support.Notes and references
- F. Würthner, Angew. Chem., Int. Ed., 2001, 40, 1037–1039 CrossRef.
- B. A. Jones, M. J. Ahrens, M. H. Yoon, A. Facchetti, T. J. Marks and M. R. Wasielewski, Angew. Chem., Int. Ed., 2004, 43, 6363–6366 CrossRef CAS PubMed.
- B. J. Jung, N. J. Tremblay, M. L. Yeh and H. E. Katz, Chem. Mater., 2011, 23, 568–582 CrossRef CAS.
- X. Zhan, A. Facchetti, S. Barlow, T. J. Marks, M. A. Ratner, M. R. Wasielewski and S. R. Marder, Adv. Mater., 2011, 23, 268–284 CrossRef CAS PubMed.
- A. S. Molinari, H. Alves, Z. Chen, A. Facchetti and A. F. Morpurgo, J. Am. Chem. Soc., 2009, 131, 2462–2463 CrossRef CAS.
- P. Ranke, I. Bleyl, J. Simmerer, D. Haarer, A. Bacher and H. W. Schmidt, Appl. Phys. Lett., 1997, 71, 1332–1334 CrossRef CAS.
- M. A. Angadi, D. Gosztola and M. R. Wasielewski, Mater. Sci. Eng., B, 1999, 63, 191–194 CrossRef.
- Z. Liu, Y. Wu, Q. Zhang and X. Gao, J. Mater. Chem. A, 2016, 4, 17604–17622 RSC.
- E. Kozma and M. Catellani, Dyes Pigm., 2013, 98, 160–179 CrossRef CAS.
- A. J. Breeze, A. Salomon, D. S. Ginley, B. A. Gregg, H. Tillmann and H. H. Hörhold, Appl. Phys. Lett., 2002, 81, 3085–3087 CrossRef CAS.
- L. Schmidt-Mende, A. Fechtenkötter, K. Müllen, E. Moons, R. H. Friend and J. D. MacKenzie, Science, 2001, 293, 1119–1122 CrossRef CAS PubMed.
- C. Li and H. Wonneberger, Adv. Mater., 2012, 24, 613–636 CrossRef CAS PubMed.
- G. Zhang, J. Zhao, P. C. Y. Chow, K. Jiang, J. Zhang, Z. Zhu, J. Zhang, F. Huang and H. Yan, Chem. Rev., 2018, 118, 3447–3507 CrossRef CAS PubMed.
- F. Würthner, V. Stepanenko, Z. Chen, C. R. Saha-Möller, N. Kocher and D. Stalke, J. Org. Chem., 2004, 69, 7933–7939 CrossRef.
- C. Huang, S. Barlow and S. R. Marder, J. Org. Chem., 2011, 76, 2386–2407 CrossRef.
- A. Sharenko, C. M. Proctor, T. S. Van Der Poll, Z. B. Henson, T. Q. Nguyen and G. C. Bazan, Adv. Mater., 2013, 25, 4403–4406 CrossRef CAS PubMed.
- Y. Liu, K. R. Wang, D. S. Cuo and B. P. Jiang, Adv. Funct. Mater., 2009, 19, 2230–2235 CrossRef CAS.
- H. Li and O. S. Wenger, Angew. Chem., 2022, 134, e202110491 Search PubMed.
- R. M. Pinto, E. M. S. Maçôas, A. I. S. Neves, S. Raja, C. Baleizão, I. C. Santos and H. Alves, J. Am. Chem. Soc., 2015, 137, 7104–7110 CrossRef CAS.
- M. Gsänger, J. H. Oh, M. Könemann, H. W. Höffken, A. M. Krause, Z. Bao and F. Würthner, Angew. Chem., Int. Ed., 2010, 49, 740–743 CrossRef.
- B. A. Jones, A. Facchetti, M. R. Wasielewski and T. J. Marks, J. Am. Chem. Soc., 2007, 129, 15259–15278 CrossRef CAS PubMed.
- F. Marin, S. Tombolesi, T. Salzillo, O. Yaffe and L. Maini, J. Mater. Chem. C, 2022, 10, 8089–8100 RSC.
- A. Oleson, T. Zhu, I. S. Dunn, D. Bialas, Y. Bai, W. Zhang, M. Dai, D. R. Reichman, R. Tempelaar, L. Huang and F. C. Spano, J. Phys. Chem. C, 2019, 123, 20567–20578 CrossRef CAS.
- M. Szafrański and A. Katrusiak, J. Phys. Chem. Lett., 2016, 7, 3458–3466 CrossRef PubMed.
- F. Capitani, C. Marini, S. Caramazza, P. Postorino, G. Garbarino, M. Hanfland, A. Pisanu, P. Quadrelli and L. Malavasi, J. Appl. Phys., 2016, 119, 185901 CrossRef.
- M. Mączka, S. Sobczak, P. Ratajczyk, F. F. Leite, W. Paraguassu, F. Dybała, A. P. Herman, R. Kudrawiec and A. Katrusiak, Chem. Mater., 2022, 34, 7867–7877 CrossRef.
- P. Ratajczyk, A. Katrusiak, K. A. Bogdanowicz, W. Przybył, P. Krysiak, A. Kwak and A. Iwan, Mater. Adv., 2022, 3, 2697–2705 RSC.
- S. Bergantin, M. Moret, G. Buth and F. P. A. Fabbiani, J. Phys. Chem. C, 2014, 118, 13476–13483 CrossRef CAS.
- M. Knaapila and S. Guha, Rep. Prog. Phys., 2016, 79, 066601 CrossRef.
- R. Li, M. Wang, H. Zhao, Z. Bian, X. Wang, Y. Cheng and W. Huang, J. Phys. Chem. Lett., 2020, 11, 5896–5901 CrossRef CAS.
- H. Zhao, Y. Zhao, Y. Song, M. Zhou, W. Lv, L. Tao, Y. Feng, B. Song, Y. Ma, J. Zhang, J. Xiao, Y. Wang, D. H. Lien, M. Amani, H. Kim, X. Chen, Z. Wu, Z. Ni, P. Wang, Y. Shi, H. Ma, X. Zhang, J. Bin Xu, A. Troisi, A. Javey and X. Wang, Nat. Commun., 2019, 10, 5589 CrossRef CAS.
- L. Huang, F. Zhu, C. Liu, H. Wang, Y. Geng and D. Yan, Org. Electron., 2010, 11, 195–201 CrossRef CAS.
- A. S. Komolov, E. F. Lazneva, N. B. Gerasimova, Y. A. Panina, A. V. Baramygin and S. A. Pshenichnyuk, Phys. Solid State, 2016, 58, 1901–1905 CrossRef CAS.
- J. Yang, D. Yan and T. S. Jones, Chem. Rev., 2015, 115, 5570–5603 CrossRef CAS.
- S. R. Byrn, D. Y. Curtin and I. C. Paul, J. Am. Chem. Soc., 1972, 94, 890–898 CrossRef CAS.
- N. Casati, A. Kleppe, A. P. Jephcoat and P. Macchi, Nat. Commun., 2016, 7, 1–8 Search PubMed.
- M. Anioła and A. Katrusiak, Cryst. Growth Des., 2015, 15, 764–770 CrossRef.
- K. Sato and J. Mizuguchi, Acta Crystallogr., Sect. E: Struct. Rep. Online, 2006, 62, 5008–5009 CrossRef.
- A. Gavezzotti, Acc. Chem. Res., 1994, 27, 309–314 CrossRef CAS.
- A. Gavezzotti and G. Filippini, J. Phys. Chem., 1994, 98, 4831–4837 CrossRef CAS.
- E. G. Mcrae and M. Kasha, J. Chem. Phys., 1958, 28, 721–722 CrossRef CAS.
- M. Kasha, Radiat. Res., 1963, 20, 55–70 CrossRef CAS.
- M. Kasha, H. R. Rawls and M. A. El-Bayoumi, Pure Appl. Chem., 1965, 11, 371–392 CAS.
- N. J. Hestand and F. C. Spano, Chem. Rev., 2018, 118, 7069–7163 CrossRef CAS PubMed.
- N. J. Hestand and F. C. Spano, Acc. Chem. Res., 2017, 50, 341–350 CrossRef CAS.
- M. D. Curtis, J. Cao and J. W. Kampf, J. Am. Chem. Soc., 2004, 126, 4318–4328 CrossRef CAS.
- T. Chen, Y.-J. Ma and D. Yan, Adv. Funct. Mater., 2023, 33, 2214962 CrossRef CAS.
- S. Liu, Y. Lin and D. Yan, Sci. Bull., 2022, 67, 2076–2084 CrossRef CAS.
- F. Nie, K. Z. Wang and D. Yan, Nat. Commun., 2023, 14, 1654 CrossRef CAS PubMed.
- B. Lu, Y. Zhang, X. Yang, K. Wang, B. Zou and D. Yan, J. Mater. Chem. C, 2018, 6, 9660–9666 RSC.
- Y. Yang, X. Yang, X. Fang, K. Z. Wang and D. Yan, Adv. Sci., 2018, 5, 1–8 Search PubMed.
- F. C. Spano, Acc. Chem. Res., 2010, 43, 429–439 CrossRef CAS PubMed.
- P. O. J. Scherer and S. F. Fischer, Chem. Phys., 1984, 86, 269–283 CrossRef CAS.
- A. B. Cairns and A. L. Goodwin, Phys. Chem. Chem. Phys., 2015, 17, 20449–20465 RSC.
- M. Anioła, A. Katrusiak and R. Kia, CrystEngComm, 2012, 14, 6424–6427 RSC.
- J. Marciniak and A. Katrusiak, J. Phys. Chem. C, 2017, 121, 22303–22309 CrossRef CAS.
- M. Ichikawa, S. Deguchi, T. Onoguchi, H. G. Jeon and G. D. R. Banoukepa, Org. Electron., 2013, 14, 464–468 CrossRef CAS.
- M. Runowski, T. Zheng, P. Woźny and P. Du, Dalton Trans., 2021, 50, 14864–14871 RSC.
- B. Lorenz, Y. R. Shen and W. B. Holzapfel, High Pressure Res., 1994, 12, 91–99 CrossRef.
- Y. Wang, T. Seto, K. Ishigaki, Y. Uwatoko, G. Xiao, B. Zou, G. Li, Z. Tang, Z. Li and Y. Wang, Adv. Funct. Mater., 2020, 30, 2001384 CrossRef CAS.
- M. Sójka, M. Runowski, P. Woźny, L. D. Carlos, E. Zych and S. Lis, J. Mater. Chem. C, 2021, 9, 13818–13831 RSC.
- J. D. Barnett, S. Block and G. J. Piermarini, Rev. Sci. Instrum., 1973, 44, 1–9 CrossRef.
- M. A. Antoniak, S. J. Zelewski, R. Oliva, A. Żak, R. Kudrawiec and M. Nyk, ACS Appl. Nano Mater., 2020, 3, 4209–4217 CrossRef CAS.
- T. Zheng, M. Runowski, N. Stopikowska, M. Skwierczyńska, S. Lis, P. Du and L. Luo, J. Alloys Compd., 2022, 890, 161830 CrossRef CAS.
- T. Zheng, M. Runowski, P. Rodríguez-Hernández, A. Muñoz, F. J. Manjón, M. Sójka, M. Suta, E. Zych, S. Lis and V. Lavín, Acta Mater., 2022, 231, 117886 CrossRef CAS.
- M. Runowski, A. Shyichuk, A. Tymiński, T. Grzyb, V. Lavín and S. Lis, ACS Appl. Mater. Interfaces, 2018, 10, 17269–17279 CrossRef CAS PubMed.
- M. Runowski, P. Woźny, N. Stopikowska, Q. Guo and S. Lis, ACS Appl. Mater. Interfaces, 2019, 11, 4131–4138 CrossRef CAS.
- P. Woźny, K. Soler-Carracedo, N. Stopikowska, I. R. Martín and M. Runowski, J. Mater. Chem. C, 2023, 11, 4792–4807 RSC.
- F. Datchi, R. Letoullec and P. Loubeyre, J. Appl. Phys., 1997, 81, 3333–3339 CrossRef CAS.
- A. Lacam, High Pressure Res., 1990, 5, 782–784 Search PubMed.
- A. You, M. Be and I. In, J. Appl. Phys., 1989, 66, 366–372 CrossRef.
- A. Katrusiak, Int. Tables Crystallogr., 2018, 156–173 Search PubMed.
- T. Zheng, L. Luo, P. Du, S. Lis, U. R. Rodríguez-Mendoza, V. Lavín, I. R. Martín and M. Runowski, Chem. Eng. J., 2022, 443, 136414 CrossRef CAS.
- T. Zheng, M. Sójka, P. Woźny, I. R. Martín, V. Lavín, E. Zych, S. Lis, P. Du, L. Luo and M. Runowski, Adv. Opt. Mater., 2022, 10, 2201055 CrossRef CAS.
- N. Tang, J. Zhou, L. Wang, M. Stolte, G. Xie, X. Wen, L. Liu, F. Würthner, J. Gierschner and Z. Xie, Nat. Commun., 2023, 14, 1922 CrossRef CAS PubMed.
- X. Xu, A. Austin, S. E. Mylon, J. Plenge and J. M. Szarko, ChemPhysChem, 2017, 18, 2430–2441 CrossRef CAS.
- N. I. Georgiev, A. I. Said, R. A. Toshkova, R. D. Tzoneva and V. B. Bojinov, Dyes Pigm., 2019, 160, 28–36 CrossRef CAS.
- K. Nagarajan, A. R. Mallia, V. S. Reddy and M. Hariharan, J. Phys. Chem. C, 2016, 120, 8443–8450 CrossRef CAS.
- H. Q. Le, M. Rusek and A. Katrusiak, J. Phys. Chem. C, 2023, 127, 4310–4318 CrossRef CAS.
- G. J. Piermarini, S. Block, J. D. Barnett and R. A. Forman, J. Appl. Phys., 1975, 46, 2774–2780 CrossRef CAS.
- H. K. Mao, J. Xu and P. M. Bell, J. Geophys. Res., 1986, 91, 4673 CrossRef CAS.
- R. J. Angel, M. Bujak, J. Zhao and G. Diego, J. Appl. Crystallogr., 2007, 40, 26–32 CrossRef CAS.
- T. Poręba, D. Comboni, M. Mezouar, G. Garbarino and M. Hanfland, J. Phys.: Condens. Matter, 2022, 35, 054001 CrossRef.
- Agilent, CrysAlis PRO, Agilent Technologies Ltd, Yarnton, Oxfordshire, England, 2014 Search PubMed.
- G. M. Sheldrick, Acta Crystallogr., Sect. A: Found. Crystallogr., 2008, 64, 112–122 CrossRef CAS.
- O. V. Dolomanov, L. J. Bourhis, R. J. Gildea, J. A. K. Howard and H. Puschmann, J. Appl. Crystallogr., 2009, 42, 339–341 CrossRef CAS.
- C. F. Macrae, P. R. Edgington, P. McCabe, E. Pidcock, G. P. Shields, R. Taylor, M. Towler and J. Van De Streek, J. Appl. Crystallogr., 2006, 39, 453–457 CrossRef CAS.
- D. Staško, J. Prchal, M. Klicpera, S. Aoki and K. Murata, High Pressure Res., 2020, 40, 525–536 CrossRef.
- K. Murata and S. Aoki, Rev. High Pressure Sci. Technol., 2016, 26, 3–7 CrossRef CAS.
- M. J. Frisch, G. W. Trucks, H. B. Schlegel, G. E. Scuseria, M. A. Robb, J. R. Cheeseman, G. Scalmani, V. Barone, G. A. Petersson, H. Nakatsuji, X. Li, M. Caricato, A. V. Marenich, J. Bloino, B. G. Janesko, R. Gomperts, B. Mennucci, H. P. Hratchian, J. V. Ortiz, A. F. Izmaylov, J. L. Sonnenberg, D. Williams-Young, F. Ding, F. Lipparini, F. Egidi, J. Goings, B. Peng, A. Petrone, T. Henderson, D. Ranasinghe, V. G. Zakrzewski, J. Gao, N. Rega, G. Zheng, W. Liang, M. Hada, M. Ehara, K. Toyota, R. Fukuda, J. Hasegawa, M. Ishida, T. Nakajima, Y. Honda, O. Kitao, H. Nakai, T. Vreven, K. Throssell, J. A. Montgomery, Jr., J. E. Peralta, F. Ogliaro, M. J. Bearpark, J. J. Heyd, E. N. Brothers, K. N. Kudin, V. N. Staroverov, T. A. Keith, R. Kobayashi, J. Normand, K. Raghavachari, A. P. Rendell, J. C. Burant, S. S. Iyengar, J. Tomasi, M. Cossi, J. M. Millam, M. Klene, C. Adamo, R. Cammi, J. W. Ochterski, R. L. Martin, K. Morokuma, O. Farkas, J. B. Foresman and D. J. Fox, Gaussian 16 (Revision C.01), Gaussian, Inc., Wallingford CT, 2016 Search PubMed.
- J. J. P. Stewart, MOPAC2016, Stewart Computational Chemistry, Colorado Springs, CO, 2016 Search PubMed.
Footnote |
| † Electronic supplementary information (ESI) available. CCDC 2253183–2253201. For ESI and crystallographic data in CIF or other electronic format see DOI: https://doi.org/10.1039/d3tc01146a |
| This journal is © The Royal Society of Chemistry 2023 |