 Open Access Article
Creative Commons Attribution 3.0 Unported Licence
The effect of ammonolysis conditions on the structural properties and oxidation kinetics of cubic niobium oxynitride†
Vanessa C. D.
Graça
 *ab,
Laura I. V.
Holz
 ab,
Francisco J. A.
Loureiro
 ab,
Glenn C.
Mather
 c and
Duncan P.
Fagg
*ab
aTEMA – Centre for Mechanical Technology and Automation, Department of Mechanical Engineering, University of Aveiro, 3810-193 Aveiro, Portugal. E-mail: duncan@ua.pt
bLASI – Intelligent Systems Associate Laboratory, Portugal
cInstituto de Cerámica y Vidrio (CSIC), Calle Kelsen 5, 28049 Madrid, Spain
First published on 29th June 2023
Abstract
In recent years, transition metal oxynitrides have gained increasing attention due to offering attractive properties, such as high electronic and thermal conductivity, high melting points and hardness, as well as high catalytic activity. Niobium oxynitrides, especially, have been suggested for a diverse range of applications, including potential electrocatalysts (e.g., water splitting, nitrogen reduction, etc.), antibacterial agents, superconducting materials, and coatings, among others. One of the most promising ways to synthesize these materials is by ammonolysis. However, by this route the final composition can be heavily dependent on the ammonolysis conditions, with this factor currently understudied in the available literature. Thus, in this work, we carefully explore the impact of ammonolysis conditions on the crystalline phase formation of niobium oxynitride compounds. Several techniques were used to fully characterize the materials, including XRD, SEM-EDS, TGA/DSC, XPS, and chemical analysis. Depending on the ammonolysis temperature and time, different composition-dependent changes in crystallographic structure can be induced across δ-NbNxOy (cubic) → Nb4(N,O)5 (tetragonal) → ε-NbN (hexagonal) phases. Potential defect-chemistry models were proposed to support measured compositional variations. A detailed kinetic analysis was then performed on the cubic materials to understand how composition can influence the thermal oxidation behaviour within this structure-type. An Fn-type reaction was used to fit the experimental and calculated data. The selection of the Avrami model, which describes the crystallization kinetics, was supported by the identification of amorphous-crystalline phase transformations during thermal oxidation. This work demonstrates that samples with higher N-content are more resistive to oxidation and shows that the anion composition, cation/anion ratio, and the crystallographic structure can be tailored by careful control of ammonolysis conditions.
1. Introduction
Transition metal nitrides (TMNs) are very interesting materials exhibiting a combination of outstanding properties. They have exceptional mechanical properties, high melting points, high electrical conductivity, refractory character, and chemical stability in hostile environments.1 For this reason, they have recently received increasing interest for use in a wide variety of applications, with great potential shown in electrochemical energy conversion, storage, and in heterogeneous catalysis fields.2,3Both niobium nitride (NbN) and its oxynitride Nb(N,O)x have been explored for use as catalysts in a wide range of different electrochemical and photochemical processes, such as the oxygen reduction reaction (ORR),4 water splitting reaction5,6 and the nitrogen reduction reaction (NRR).7–9 They have also been suggested as photocatalytic materials, due to their narrow band gaps and high light absorption,10,11 energy storage-applications, such as supercapacitors,12–14 and anode materials for rechargeable lithium-ion batteries,15 as well as potential superconductors.16–18 A recent computer modelling study by Abghoui et al.,7 for example, highlighted niobium nitride to be among the most promising candidates for the nitrogen reduction reaction (NRR), due to a predicted high catalytic activity for NRR, as well as a good resilience to the production of hydrogen. It was emphasized that nitride materials were highly suited to suppress the H2 evolution reaction (HER), an essential electrocatalytic criterion for a good NRR,19 thereby avoiding the main limitation of typical noble metal catalysts.3,7 Despite this predominance, it has not yet been clarified in the literature why specific niobium nitride or oxynitride compositions are targeted for each of the aforementioned applications, and how such compositional control could be potentially provided by modifications in their synthesis route.3–11
The Nb–N phase diagram20 is a complex system, and different phases can be formed depending on the nitrogen–niobium atomic ratio, NbNx, permitting a wide range of potential cation/anion stoichiometries that extend from under- to over-stoichiometric21,22 and with a critical influence of composition reported on subsequent structure–property relations.23–25 The base nitride materials can also incorporate oxygen in their anionic sublattice to form oxynitrides, giving rise to an additional dimension in which to tailor their properties for potential applications,26 whilst further extending their compositional complexity.
Niobium oxynitrides can be readily produced by the ammonolysis route, which can be described as the thermal treatment of metal-based precursors (i.e., Nb2O5, NbCl5) at high temperatures under a flow of ammonia (NH3).27 As documented for other transition-metal oxynitrides, the experimental parameters utilized during this synthesis route can have great impact on the final oxynitride composition.11,15,28,29 Among these experimental variables, temperature, dwell time, heating/cooling rates and flow rate of NH3 are reported to be key parameters that can introduce significant variations in the final stoichiometry.30 From a thermodynamic point of view, ammonia decomposition to nitrogen and hydrogen is predicted to start at low temperatures (∼200 °C), Fig. 1(a). However, from a kinetic viewpoint, ammonia dissociation only becomes significant at temperatures higher than 550 °C, being more extensive at lower flow rates, as shown in Fig. 1(b),31 due to increased residence times. Thus, changes in the stoichiometry of the oxynitride material may also be intimately linked to changes in the actual gas phase composition of the ammonia reactant, which is expected to alter as a function of the synthesis conditions.
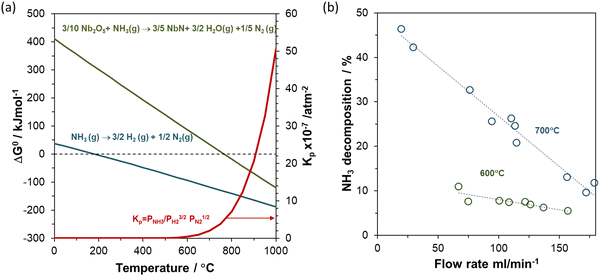 | ||
| Fig. 1 (a) Gibbs free energy change (ΔG) and equilibrium constant (Kp) as a function of temperature for ammonia decomposition and ammonolysis reaction of niobium pentoxide, calculated using HSC chemistry (b) ammonia decomposition as a function of flow rate at 600 °C and 700 °C. Data extracted from ref. 31. | ||
This is important, as high control of the stoichiometry of the oxynitride material is required to tailor the resultant physical and chemical properties to specific applications, a factor previously underscored for the superconducting behavior of niobium–nitride-based films,32 the catalytic behavior of niobium oxynitride towards NRR9 or ORR,33 and the effectiveness of this system for water splitting.11 Despite this, the literature shows distinct divergences in the stoichiometry of niobium oxynitride materials formed by the ammonolysis procedure,15,26,29 with very limited data currently available to understand the impact of ammonolysis conditions on their resultant composition. Under ammonolysis of a Nb2O5 precursor in dry ammonia, niobium oxynitride is reported to crystallize in the face-centered cubic rock-salt type δ-NbN-based structure at lower temperatures, 600–900 °C (Fig. 2(a)), converting to the hexagonal ε-NbN-based structure-type at higher temperatures ≥900 °C.26,34,35 In these previous studies, the impact of dry ammonia gas, the crystallographic structure of the precursor oxide, and the use of promoter additives on ammonolysis were assessed, while the impact of dwell time was not reported. All prior reports showed the resultant compositions to contain cation/anion ratios that were significantly lower than unity, giving rise to a general formula denoted as NbNxOy by these authors. Conversely, for niobium oxynitrides formed by ammonolysis using amorphous precursors, in wet ammonia atmospheres at 850 °C, a different structure type with tetragonal symmetry was observed, which is derived from the cubic rock salt δ-NbN, with a fifth of the niobium sites vacant to give the general formula Nb4(N,O)5.36 In dry ammonia–oxygen mixtures, a further structure type, based on monoclinic baddeleyite, is obtained, designated as NbNO.5 One should note that the average oxidation state of niobium decreases from 5+ in NbNO towards ≤ 3.75+ in Nb4(N,O)5, as the NbNO, NbNxOy and Nb4(N,O)5 structure types are descended. The respective crystallographic structures of the parent δ-NbN cubic phase, the Nb4N5 (tetragonal phase), and the ε-NbN hexagonal phase are shown in Fig. 2(a)–(c), respectively.
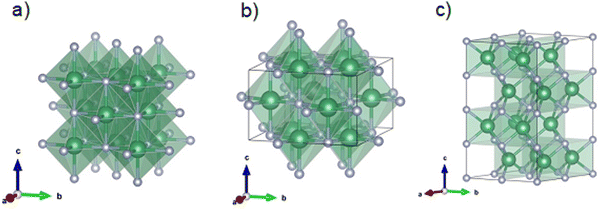 | ||
Fig. 2 Crystal structure visualized by Vesta37 of the (a) δ-NbN cubic (Fm![[3 with combining macron]](https://www.rsc.org/images/entities/char_0033_0304.gif) m) (b) tetragonal Nb4N5 phase and (c) hexagonal ε-NbN (P63/mmc) phases. The large green and the small blue spheres represent the Nb and the N atoms, respectively. m) (b) tetragonal Nb4N5 phase and (c) hexagonal ε-NbN (P63/mmc) phases. The large green and the small blue spheres represent the Nb and the N atoms, respectively. | ||
In this work, we aim to study the influence of temperature and time during ammonolysis on the resultant stoichiometry of the niobium oxynitride materials, as well as to identify the most probable mechanism for oxygen and nitrogen incorporation. Subsequently, we correlate this knowledge by a study of the kinetic mechanism of their oxidation, for samples of the cubic structure. This kinetic study is of major importance in, for example, the heterogenous catalysis field, were tuning the stability of oxynitride catalysts to resist nitrogen loss or oxygen uptake has been shown to strongly influence their catalytic activity.9 In the current work, this study also serves to demonstrate how important properties, such as oxidation resistance, can be tailored by control of ammonolysis conditions and, thus, composition, even for oxynitride materials within a single structure type. In order to attain this goal, a wide range of different techniques were used to characterize the final compositions, including X-ray diffraction (XRD), X-ray photoelectron spectroscopy (XPS), thermogravimetry and differential scanning calorimetry (TGA/DSC), elemental analysis, and scanning electron microscopy and energy-X-ray dispersive spectroscopy (SEM/EDS). We aim to provide a detailed correlation between synthesis conditions and composition, as well as to provide one of the first studies dedicated to a detailed kinetic analysis of the oxidation behavior of cubic niobium oxynitride compounds.
2. Experimental procedure
Sample preparation
Niobium pentoxide (Nb2O5, Sigma-Aldrich, 99.9%) was used as a precursor to produce the niobium oxynitride materials. The nitridation of 0.4 g of Nb2O5 was carried out in a tubular furnace using an alumina boat from room temperature to the desired temperature (650–900 °C) at 5 °C min−1 and held for different periods of time (1, 6, 12, and 24 h) under a continuous flow of 50 cm3 min−1 of NH3 (Airliquide, 99.9%; H2O < 400 ppm) gas under atmospheric pressure. After cooling, the obtained product was passivated with a flow of 50 cm3 min−1 of nitrogen for a period of 20 minutes at room temperature.Characterization
X-ray phase analysis was performed using a Rigaku SmartLab diffractometer, 2θ = 20–80°, with a scan rate 3° min−1 (Cu Kα radiation, wavelength of 1.5406 Å, 40 kV, 30 mA). The lattice parameters were determined by the Rietveld refinement method using the Smartlab Studio II software. For this purpose, a pseudo-Voigt peak profile function was used for the profile fitting, and the background was fitted with the B-spline function.XPS spectra were acquired in an Ultra High Vacuum (UHV) system with a base pressure of 2 × 10⁻¹⁰ mbar. The system was equipped with a hemispherical electron energy analyzer (SPECS Phoibos 150), a delay-line detector, and a monochromatic Al Kα (1486.74 eV) X-ray source. High-resolution spectra were recorded at a normal emission take-off angle and with a pass-energy of 20 eV, which provides an overall instrumental peak broadening of 0.5 eV.
The binding energy scale was normalized to the C 1s peak (284.0 eV), which appears in all the samples because of adventitious carbon contamination. Survey spectra and high-resolution Nb (3d), N (1s), and O (1s) were collected. All the spectra were fitted using an XPS peak fitting program (XPSPEAK Version 4.1).
The microstructure of the precursors and the final products obtained were observed by scanning electron microscopy (SEM, Vega 3 TESCAN SEM microscope) coupled with Energy-dispersive X-ray spectroscopy (EDS, Brucker SCU) for analyzing the elemental distribution.
The nitrogen content of nitrides was calculated by elemental analysis using standard combustion analysis (Truspec 630-200-200) detected by the use of a thermal conductivity detector. The oxygen content was determined by thermogravimetry/differential thermal analysis (TGA/DSC; Model STA449/6/G, Netzsch, Jupiter, Germany), by fully oxidizing samples in pure oxygen (O2) at 1000 °C, as follows:
 | (1) |
Nitrogen release was also followed using a QMS 403 Aeolos quadrupole mass spectrometer coupled to the TGA/DSC, STA 449, by means of a heated transfer line.
The solid-state kinetics were studied using the Kinetics Neo software developed by Netzsch. The data were collected at different heating rates (β = 3, 5, 10 and 15 °C min−1) in a 10% O2/N2 atmosphere, at 1000 °C and dwell time of 6 h. Model-free and model-based methods, namely, Kissinger–Akahira–Sunose (KAS), were applied.
The conversion (α) was determined by
 | (2) |
The kinetic triplet (f(α), Ea and A) parameters of a reaction rate (d/dt) can be determined by the following equation:
 | (3) |
The kinetics of reaction by integral isoconversional KAS method can be described as the change of the temperature as a function of different heating rates based on the following equation:
 | (4) |
 versus 1000/T, where the slope is equal to −Eα/R.
The model-based kinetic analysis allows our data to be fitted to multiple reaction models (f(α), g(α),…), where the meaning of these models is described elsewhere.39 From each reaction model, it is possible to determine the kinetic parameters as well as their contribution to each reaction step.
3. Results and discussion
Structural characterization
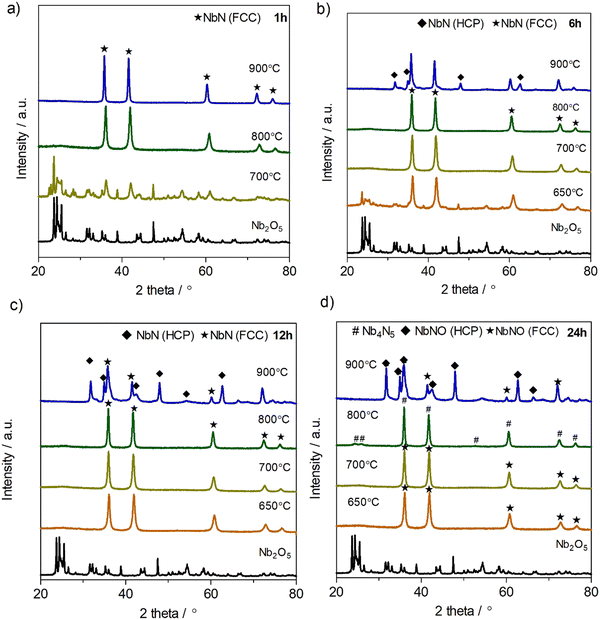
Fig. 3 shows the XRD patterns of the powders obtained at different ammonolysis temperatures and dwell times (1, 6, 12 and 24 h). It can be seen that, by using only 1 hour of dwell time, a single phase, with the cubic rock salt δ-NbN structure15,26(#225, Fm![[3 with combining macron]](https://www.rsc.org/images/entities/char_0033_0304.gif) m), can only be obtained at high temperatures (i.e., 800 and 900 °C). However, when the dwell time is increased, the formation of the pure cubic δ-phase can be extended to lower synthesis temperatures, e.g., 700 °C for 6 h or 650 °C for 12 h, Fig. 3(b) and (c), respectively. The control of ammonolysis dwell time is, therefore, highlighted as a critical parameter to ensure that pure rock-salt oxynitride phases can be formed at lower temperatures. The importance of dwell time is further underscored by observing the XRD pattern recorded for the sample formed at 800 °C for the longest dwell time of 24 h, Fig. 3(d). Under these conditions, supercell reflections are shown to be present, identifying the formation of a pure tetragonal structure, consistent with the reported Nb4(N,O)5 phase (#87, I4/m).36 Finally, at the highest temperature measured, 900 °C, with a dwell time of 6 h (Fig. 3(b)), the formation of a phase mixture is observed, which contains the cubic rock-salt phase together with minor quantities of the hexagonal phase, ε-NbN (#194, P63/mmc).26,40 Regarding these results, it is possible to conclude that the crystalline phase evolution of Nb2O5 during nitridation follows the sequence: Nb2O5 → δ-NbN-based cubic phase structure → Nb4(N,O)5 based-tetragonal phase → cubic δ-NbN-based + ε-NbN-based hexagonal phase mixture. Although the presence of the end members is in good agreement with previous literature,26 the dwell time investigation in the current work additionally reveals that pure tetragonal Nb4(N,O)5,36 can also exist as an intermediate phase. Here, the tetragonal Nb4(N,O)5 phase36 can be prepared by careful control of ammonolysis conditions, at 800 °C for 24 h, even in the pure, dry NH3 atmosphere used in the current work, contrasting with the wet ammonia conditions that had to be used in previous literature.41 Conversely, the reported baddeleyite NbNO phase11 with a Nb5+ oxidation state, is absent under the current, strongly reducing, dry NH3 synthesis conditions.
m), can only be obtained at high temperatures (i.e., 800 and 900 °C). However, when the dwell time is increased, the formation of the pure cubic δ-phase can be extended to lower synthesis temperatures, e.g., 700 °C for 6 h or 650 °C for 12 h, Fig. 3(b) and (c), respectively. The control of ammonolysis dwell time is, therefore, highlighted as a critical parameter to ensure that pure rock-salt oxynitride phases can be formed at lower temperatures. The importance of dwell time is further underscored by observing the XRD pattern recorded for the sample formed at 800 °C for the longest dwell time of 24 h, Fig. 3(d). Under these conditions, supercell reflections are shown to be present, identifying the formation of a pure tetragonal structure, consistent with the reported Nb4(N,O)5 phase (#87, I4/m).36 Finally, at the highest temperature measured, 900 °C, with a dwell time of 6 h (Fig. 3(b)), the formation of a phase mixture is observed, which contains the cubic rock-salt phase together with minor quantities of the hexagonal phase, ε-NbN (#194, P63/mmc).26,40 Regarding these results, it is possible to conclude that the crystalline phase evolution of Nb2O5 during nitridation follows the sequence: Nb2O5 → δ-NbN-based cubic phase structure → Nb4(N,O)5 based-tetragonal phase → cubic δ-NbN-based + ε-NbN-based hexagonal phase mixture. Although the presence of the end members is in good agreement with previous literature,26 the dwell time investigation in the current work additionally reveals that pure tetragonal Nb4(N,O)5,36 can also exist as an intermediate phase. Here, the tetragonal Nb4(N,O)5 phase36 can be prepared by careful control of ammonolysis conditions, at 800 °C for 24 h, even in the pure, dry NH3 atmosphere used in the current work, contrasting with the wet ammonia conditions that had to be used in previous literature.41 Conversely, the reported baddeleyite NbNO phase11 with a Nb5+ oxidation state, is absent under the current, strongly reducing, dry NH3 synthesis conditions.
To understand these observations, the exact stoichiometry of these materials was evaluated using the combination of two further techniques, namely, nitrogen elemental analysis and TGA/DSC (see ESI†). Here, the elemental analysis directly quantifies the amount of nitrogen present in each sample, while the oxygen content is provided by the combination of this information with TGA, where the latter is performed in pure oxygen at 1000 °C for six hours, to allow the full oxidation of the powder to the parent oxide, Nb2O5, as confirmed by XRD. This combination of experiments permits full characterization of the cation/anion and N/O ratios in these materials, as described by eqn (1), and summarized in Table 1.
| Time/h | Temperature/°C | Lattice parameters/Å | Statistical and factors | N content | O content | Niobium oxidation state | |
|---|---|---|---|---|---|---|---|
| R wp (%) | S | ||||||
| a Pseudo-cubic lattice parameter. | |||||||
| 1 | 800 | 4.3018(3) | 3.70 | 1.3564 | 1.02 | 0.66 | 4.41 |
| 900 | 4.3283(9) | 3.16 | 1.5680 | 1.09 | 0.23 | 4.13 | |
| 6 | 700 | 4.3078(0) | 3.78 | 1.5313 | 1.11 | 0.38 | 4.09 |
| 800 | 4.3200(2) | 2.14 | 1.6054 | 1.12 | 0.29 | 4.17 | |
| 900 | — | — | — | 1.05 | 0.1 | 3.35 | |
| 12 | 650 | 4.2996(7) | 3.12 | 1.9316 | 1.11 | 0.54 | 3.96 |
| 700 | 4.307(2) | 2.95 | 1.1853 | 1.13 | 0.39 | 4.38 | |
| 800 | 4.3199(12) | 3.52 | 1.7758 | 1.14 | 0.27 | 3.94 | |
| 900 | — | — | — | 1.03 | 0 | 3.09 | |
| 24 | 650 | 4.3055(3) | 3.40 | 1.8446 | 1.11 | 0.40 | 4.13 |
| 700 | 4.3099(3) | 3.41 | 1.3808 | 1.12 | 0.30 | 3.96 | |
| 800 | 4.3219a | 3.15 | 1.6130 | 1.15 | 0.12 | 3.69 | |
| 900 | — | — | — | 0.98 | 0 | 2.94 | |
Using Rietveld refinement, the lattice parameters for the pure, cubic NbNxOy powders are also obtained and presented in Table 1, together with the pseudo-cubic lattice parameter of the tetragonal sample formed at 800 °C, 24 h, calculated by the following relationship42
 | (5) |
| c = c0 = 4.3088 | (6) |
 .
.
The results show that variations in the synthesis conditions can strongly influence the cell lattice parameter, producing variations in the range of 4.299 to 4.328 Å, in accordance with previous values reported in the literature for this material.20,43 From these data, these tendencies are examined by plotting the O/N ratios, the cation to anion ratios, Nb/(N + O), the lattice parameters, and the stoichiometry-dependent average oxidation state of Nb for these samples as a function of dwell time and sintering temperature (Fig. 4). Fig. 4(a) clearly shows a strong, inverse dependence between O/N ratio and cation/anion ratio, as a function of ammonolysis dwell time or temperature. With increasing dwell times and/or sintering temperature, the oxygen-to-nitrogen ratio decreases, while this is inversely followed by an increase in the cation/anion ratio. Although short dwell times are prohibited at temperatures of 700 °C and below, due to incomplete nitride phase formation, as highlighted in Fig. 3, a more extensive range of dwell times can be assessed for the temperature of 800 °C, spanning from 1 h to 24 h. At this temperature, the O/N and cation/anion compositional ratios are shown to vary rapidly during the initial stages of the dwell, while continuing to gradually change even up to extended dwell times of 24 h. These compositional variations are followed by alterations in the average oxidation state of niobium that is, in general, shown to decrease with increasing dwell time and temperature, Fig. 4(b). Fig. 4(c) further reveals that this initial rapid change in stoichiometry is reflected in an initial increase in lattice parameter, while longer dwell times produce only minor further increases. Conversely, this figure shows a strong positive dependence between ammonolysis temperature and lattice parameter.
The observed increases in the O/N ratio and decreases in the cation/anion ratio with ammonolysis temperature correspond well with those previously noted in the literature,26 while the continued alteration of composition with extended dwell times has not been previously documented. Thus, to provide a further understanding of the potential importance of temperature and dwell time, the current stoichiometry data for dwell times of 12 h and 24 h are replotted in Fig. 5, together with literature data of Kim et al.26 (dwell time, 12 h) as a function of temperature. Fig. 5(a) reinforces the aforementioned strong and inverse temperature dependencies of the O/N and cation/anion ratios, while Fig. 5(b) confirms the negative dependency of average niobium oxidation state on temperature. The good correlation between these stoichiometry dependencies with temperature in the current work and literature data, suggests that these tendencies are reproducible, while the slightly more oxygen-rich compositions in the work of Kim et al.,26 in comparison to the current work, of a similar dwell time, 12 h, possibly reflects a longer ammonia residence time used in the current work, 0.02 cf. 0.003 min ml−1 g−1, respectively. The impact of the more extended dwell time of 24 h in the current work can also be clearly observed in Fig. 5, with the formation of lower O/N ratios for the longer dwell time, with higher cation/anion ratios, Fig. 5(a), lower Nb oxidation states, Fig. 5(b), and higher lattice parameters, Fig. 5(c), which are shown to approach at the highest temperatures.
 | ||
| Fig. 5 (a) O/N (solid symbols) and Nb/(N + O) ratios (open symbols), (b) niobium average oxidation state, and (c) cubic and pseudo-cubic lattice parameters for niobium oxynitride samples prepared for 12 h and 24 h as a function of temperature. Literature data from ref. 26 are included for comparison. | ||
Hence, ammonolysis produces materials with cation/anion ratios below unity for all conditions, in agreement with that of previous literature.21,25,26,34,35,44 Based on this observation, one may suggest potential defect-chemistry mechanisms to form these compounds. The observed low cation/anion ratio has previously been suggested to be related to the formation of cation-deficient compounds,21,25,44 given by the following mechanism using Kröger–Vink notation for oxygen incorporation into the base nitride:
(i) Cation vacancies
 | (7) |
Nevertheless, Fig. 4(b) and 5(b) suggest that the niobium average oxidation state must also change with processing conditions, varying in the broad range, 4.8+ to 3.6+, in line with the measured stoichiometry of these materials, with notable negative dependences of average oxidation state shown on ammonolysis time and temperature. The cation-vacancy mechanism of (eqn 7) cannot fulfill this requirement, as this equation infers a constant cation oxidation state of 3+, with ammonolysis, as recently experimentally shown for vanadium oxynitrides.28 An equivalent case to vanadium oxynitride is not seen in the current work, and, thus, cation vacancies alone cannot explain the measured stoichiometries of the present niobium oxynitride system.
In order to examine the Nb oxidation states present in the current materials, XPS analysis was performed, using a representative composition of high O/N content, NbN1.02O0.66. Fig. 6 illustrates the high-resolution spectra of Nb 3d, N 1s and O 1s obtained for this composition.
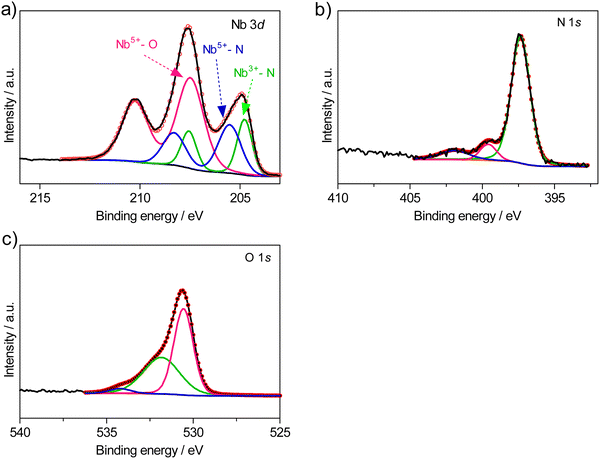 | ||
| Fig. 6 High-resolution XPS spectrum of (a) Nb 3d, (b) N 1s (c) O 1s regions measured in NbN1.02O0.66 composition. | ||
In the Nb 3d spectrum (Fig. 6(a)), three doublets at binding energies (BE) of 207.47 eV, 204.76 eV, and 205.6 eV can be observed. As discussed in prior literature,45 the higher BE can be associated with the binding of niobium to oxygen (Nb5+–O), while the lowest can be ascribed to the binding of niobium to nitrogen (Nb3+–N), where the lower binding energy of Nb–N compared to Nb–O is attributable to the lower electronegativity of nitrogen.45 The intermediate BE shown at 204.76 eV can be associated with the binding of Nb5+–N.46–48 The O 1s high-resolution spectrum shows a strong peak at ∼531.8 eV, which can be assigned to Nb–N–O.46–48 Two weaker peaks are also shown at higher BE that can be related to adsorbed O and OH groups.49 The N 1s high-resolution spectrum shows a characteristic peak associated with Nb–N bonding.50 The remaining peaks at ∼399 eV and ∼401 eV can be associated with N–C and N–O bonding, respectively, which can be related to some impurities on the surface of the powder, as in previous literature.51
Although the XPS technique can measure only the first few nanometers of the materials’ surface chemistry (2–4 nm), the stated results show a good correlation with the compositional data of Table 1. Thus, the oxynitride materials of the present study contain mixtures of Nb5+ and Nb3+, giving rise to the average oxidation states shown in Fig. 4(b) and 5(b). Taking this into consideration, another potential defect mechanism that could lead to cation/anion ratios below unity, on increasing O/N ratio, would be that of the formation of anion interstitials:
(ii) Anion interstitials
 | (8) |
 is an oxygen atom that occupies an interstitial lattice site and where charge balance is given by the formation of
  , which denotes a net doubly positively charged species due to a change in Nb oxidation state from 3+ to 5+. Nonetheless, the potential formation of anion interstitials in niobium nitride materials is controversial in the literature, with recent simulation studies predicting the formation of these defects to be energetically unfavorable under typical synthesis conditions, for example, the work by Balasubramanian et al.21 In contrast, such a situation is suggested by other authors, such as Kalal et al.,52 to become energetically favorable upon the presence of both cation vacancies and anion interstitials, i.e., a combination of (eqn 7 and 8).
Another possibility could be based on the prior existence of Schottky defects, which are predicted by Balasubramanian et al. to be energetically favorable in all conditions in these niobium nitride-based materials,21 followed by partial filling of the nitrogen vacancies by oxygen, as given by the following equations:
 | (9) |
 | (10) |
Both mechanisms, eqns 8, 9 and 10, express an increase in the oxidation state of Nb and decreasing cation/anion ratio with increasing oxygen incorporation, as observed in Fig. 4 and 5. One could predict that the formation of cation vacancies, (eqn 7), would suggest a strong decrease in lattice parameter on increasing oxygen content, as previously seen for the vanadium oxynitride system,28 whilst (eqn 8, 9 and 10), may result in weaker lattice parameter changes, as the expansion of the lattice by oxygen incorporation may be partially offset by the reduction in lattice parameter expected by the oxidation of Nb3+ to Nb5+, for charge compensation. To confirm these hypotheses, further experiments are recommended, which can provide higher sensitivity to the anion lattice, such as that of neutron diffraction.
The observed alterations in the crystallographic structure in the sequence: NbNxOy (δ-NbN-based cubic phase) → Nb4(N,O)5 (tetragonal phase) → ε-NbN hexagonal, on a decreasing O/N ratio and increasing cation/anion ratio with ammonolysis time and temperature, can be evaluated based on these crystallographic changes and the likely defect chemistry. From the discussion above, the composition NbN1.15O0.12, prepared at 800 °C for 24 h, is likely to contain sufficient Nb vacancies in order to form the Nb4(N,O)5 (tetragonal phase).42,53 It should be noted that the ideal tetragonal Nb4N5 structure type contains two distinct octahedral Nb sites, at Wyckoff positions 8h and 2a, where all 2a Nb sites are vacant to give the overall general formula, □2aNb48hN5.53 The cation/anion ratio of the NbN1.15O0.12 composition, prepared at 800 °C for 24 h, is noted to be 0.78, which is very similar to that in Nb4N5, 0.8, underscoring the reasoning for the formation of this structure for this oxynitride composition. The addition of oxygen to this compound, either by eqn 8 or by the combination of (eqn 9) and (eqn 10), leads to disruption of this ordering, resulting in the disordered cubic phase δ-NbNxOy, as observed for the materials prepared at lower temperature or lower dwell times. The δ-NbNxO structure is observed to accommodate considerably larger O/N ratios and low cation/anion ratios, with significant concomitant reductions in observed lattice parameters, Table 1. Conversely, the highest ammonolysis temperatures and times are shown to be capable of stripping virtually all oxygen from the structure, e.g., 900 °C for 12 h (Table 1), where the associated increases in voluminous, Nb3+ content and cation/anion ratio require a structure type that can offer greater Nb–N bond lengths, which is provided by conversion to the ε-NbN hexagonal structure.40
Finally, to evaluate the effect of ammonolysis experimental parameters (time and temperature) on the powder morphology, scanning electron microscopy (SEM) was used. Fig. 7 shows the SEM micrographs of the Nb2O5 precursor as well as niobium oxynitride powders synthesized for 12 h as a function of temperature. From the SEM results, no significant morphological differences were observed, in good agreement with previous literature,54 in which authors reported that the use of ammonolysis does not substantially influence the final morphology of the obtained powders.
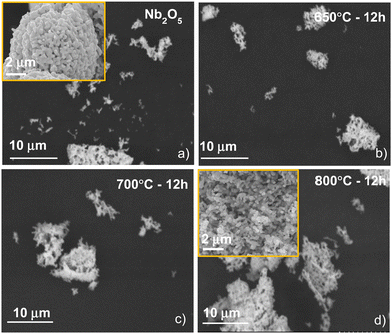 | ||
| Fig. 7 Scanning electron microscopy micrographs of (a) Nb2O5 precursor and NbNxOy powders synthesized at (b) 650 °C, (c) 700 °C, (d) 800 °C for 12 h. Insets show magnification at higher resolution. | ||
Kinetic model
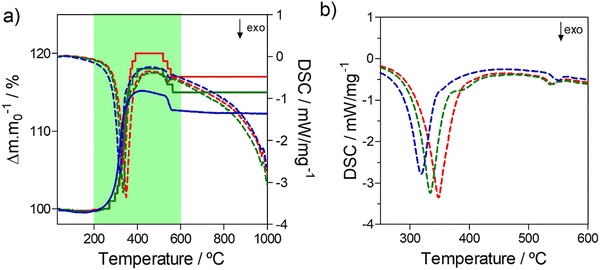
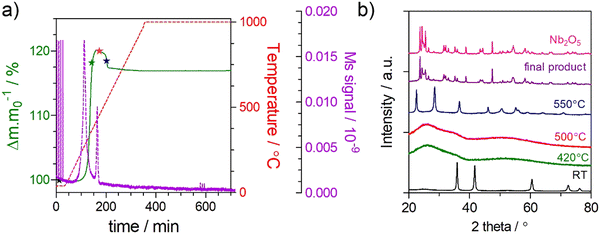
A kinetic analysis was used to explore the effect of the O/N ratio on the thermal oxidation resistance of niobium oxynitrides, for samples of the cubic structure-type. Therefore, TGA/DSC measurements were performed in 10% O2/N2 gas atmosphere using different heating rates (3, 5, 10, and 15 °C min−1)39 as a function of composition. For this analysis, three cubic compositions were selected: NbN1.11O0.54, NbN1.13O0.39, and NbN1.14O0.27. As an example, Fig. 8 depicts the TGA/DSC profile measurements performed at a fixed heating rate of 3 °C min−1 for the measured compositions. All curves show a similar shape while exhibiting different absolute values of weight change. The presence of multiple ‘shoulders’ in DSC on the obtained profiles may indicate that we are in the presence of a multi-step oxidation mechanism.55To support this hypothesis, further TGA/DSC measurements coupled with mass spectrometry (MS) (Fig. 9(a)) were used to monitor the N2 released as a function of weight change, for the example composition NbN1.14O0.27. To understand potential phase changes along the thermal oxidation, quenching experiments were also performed by removing the sample at different temperatures (420 °C, 500 °C, and 550 °C), with subsequent analysis by XRD (Fig. 9(b)). From TGA/DSC coupled with MS one may observe that the onset temperature for oxidation of niobium oxynitride starts at around 300 °C. During thermal oxidation, the TGA shows a characteristic increase in weight, reaching a maximum at 500 °C. During this step, oxygen is taken up by the material, and this is shown to be simultaneously accompanied by the release of N2 by the MS measurement. XRD reveals that this step of combined oxidation of niobium nitride and nitrogen release converts the sample into an amorphous phase.56 After this step, the N2 emission briefly drops to zero as the weight stabilizes. Finally, a sharp decrease in weight, together with a second emission peak of N2, is shown. These results clearly highlight that a significant amount of nitrogen continues to be retained even after the material has become amorphous. This N2 incorporated in the amorphous intermediate is finally released at the highest temperatures, with the crystallization of Nb2O5 formed as a final product, as depicted by XRD (Fig. 9(b)).57 The amount of N2 released (Table 2) in both the first and second steps is shown to be composition dependent and, thus, influenced by the ammonolysis conditions.58
| Sample | Temperature of exothermic peak/°C | Weight change/% | Total N2 release/mol | ||||
|---|---|---|---|---|---|---|---|
| 1 | 2 | Step 1 | Step 2 | 1 | 2 | Total | |
| NbN1.11O0.54 | 318.8 | 551.4 | 15.59 | −3.10 | 0.2557 | 0.055 | 1.0459 |
| NbN1.13O0.39 | 334.3 | 536 | 18.37 | −3.04 | 0.3270 | 0.0631 | 1.4275 |
| NbN1.14O0.27 | 348.2 | 540.6 | 20.34 | −3.22 | 0.3419 | 0.0666 | 1.4947 |
To examine the total oxidation process, which also includes the weight loss, a multi-step model is utilized to simulate the total reaction,55 allowing the determination of a kinetic triplet (Ea, A, and f(α)) that can best fit each reaction step.
The experimental data of all compositions were successfully fitted using two single steps, A → B → C, as presented in Fig. 10. The first step (A → B) was successfully assigned to a Fn-order reaction type, with n ≈ 0.6 showing the highest contribution (∼1.2) to the overall process, with an apparent activation energy of ∼100 kJ mol−1 and log of the pre-exponential factor of ∼4.8 s−1. The consecutive step (B → C) was ascribed to n-dimensional nucleation according to the Avrami-Erofeev (An) equation with a negative contribution (∼−0.2) to the oxidation process. Table 3 shows the kinetic parameters obtained for NbN1.11O0.54, NbN1.13O0.39 and NbN1.14O0.27.
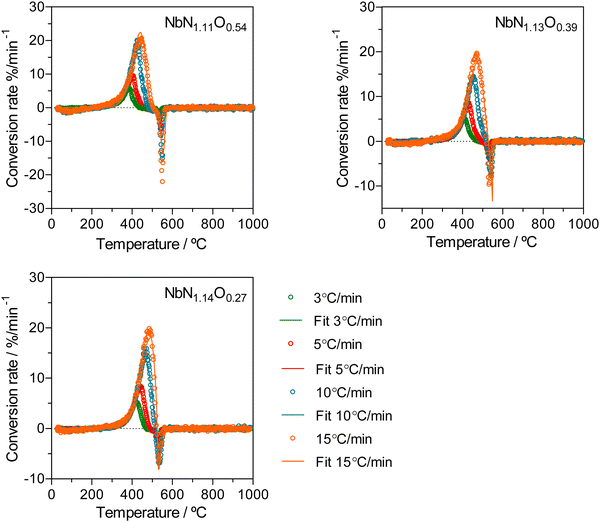 | ||
| Fig. 10 Conversion rate of NbN1.11O0.54, NbN1.13O0.39 and Nb N1.14O0.27 samples for different heating rates (3, 5, 10, and 15 °C min−1). | ||
| NbO0.54N1.11 | NbO0.39N1.13 | NbO0.27N1.14 | |||||
|---|---|---|---|---|---|---|---|
| A → B | B → C | A → B | B → C | A → B | B → C | ||
| Model parameters | Reaction type | Fn | An | Fn | An | Fn | An |
| E a (kJ mol−1) | 97.83 | 532.85 | 98.95 | 939.517 | 104.54 | 1307.27 | |
| log (A) | 4.890 | 32.103 | 4.647 | 59.381 | 4.929 | 83.025 | |
| Dimension (n) | — | 0.965 | — | 0.364 | — | 0.324 | |
| React order (n) | 0.620 | — | 0.790 | — | 0.617 | — | |
| Contribution | 1.226 | −0.226 | 1.183 | −0.183 | 1.194 | −0.194 | |
| Statistics data | R 2 | 0.99801 | 0.99931 | 0.99966 | |||
| Sum of dev. squares | 314.171 | 132.836 | 79.086 | ||||
| F-test | 1.00 | 1.00 | 1.00 | ||||
The first step, A → B, can be assigned to the conversion of niobium oxynitride to an amorphous intermediate, which may be related to a linear law (Fn) equation involving the successive oxidation of the sample.59 The second step, B → C, can be associated with an Avrami model, which specifically describes the kinetics of crystallization.60,61 Namely, the transformation of the amorphous compound to the hexagonal Nb2O5 phase (indexed to ICDD 00-028-0317), a process that follows by continued oxidation of the product and further N2-release. From 600–1000 °C, the weight remains almost constant as the oxynitride is now fully oxidized, with final transformation into the monoclinic Nb2O5 phase.
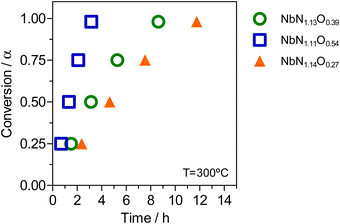
Furthermore, using the established model, it is possible to predict the time necessary for the complete oxidation of these cubic niobium oxynitride samples with different O/N ratios. The results from Fig. 11 show that the sample with a lower O/N ratio (prepared at 800 °C for 12 h), when exposed to oxidizing conditions at 300 °C, needs more than 10 h to be fully oxidized. Conversely, for the other two samples, complete oxidation is reached after only ∼3 h for the high oxygen-containing sample prepared at 650 °C, NbN1.11O0.54, and after ∼8 h for the sample prepared at 700 °C (NbN1.13O0.39). In this way, it is possible to infer that the O/N ratio can influence the resistance of niobium oxynitride to oxidation and, thus, the possibility to tune these oxynitride materials against oxidation by changing their anion stoichiometry.
4. Conclusions
Niobium oxynitride material was successfully produced by the ammonolysis route, crystallizing in different structures depending on the temperature and/or dwell time. It was found that ammonolysis occurs following the structural transformations, Nb2O5 → NbNxOy (δ-NbN-based cubic phase) → Nb4(N,O)5 (tetragonal phase) → ε-NbN hexagonal phase. Moreover, the results of this work demonstrated that the composition of the niobium oxynitride material is strongly influenced by the ammonolysis parameters, with a decreasing O/N ratio, an increasing cation/anion ratio, a decreasing average Nb oxidation state and increasing lattice parameter with increasing ammonolysis temperature or dwell time. In an attempt to explain the resultant compositional variations, the possible defect chemistry mechanisms of a combination of cation vacancies and anion interstitials or the combination of Schottky defects and oxygen incorporation in the anion lattice were described, supported by an XPS analysis to confirm the presence of Nb3+ and Nb5+ oxidation states. To distinguish between these defect possibilities, further techniques are suggested, which offer greater sensitivity to anion locations.Finally, a kinetic analysis was developed for the samples of the cubic structure-type, aiming to understand the mechanism behind the niobium oxynitride oxidation process. For fitting the experimental data, an Fn-type reaction was used followed by an Avrami model. The selection of the Avrami model was supported by the crystallization of an amorphous intermediate phase during the thermal oxidation, as shown by XRD patterns of quenched materials. Importantly, it was found that increasing the ammonolysis temperature and consequently increasing the N/O ratio can improve the resilience of the cubic niobium oxynitride materials towards oxidation.
In conclusion, we found that by tuning the ammonolysis conditions, we are able to tailor both the niobium oxynitride composition and the crystallographic structure. We further demonstrate how this compositional control can have influence on the oxidation behavior of the cubic oxynitride materials, even within this single structure-type. This knowledge has significant impact on the use of these oxynitride compositions for potential applications, such as in energy-related research as well as in heterogenous catalysis fields.
Conflicts of interest
There are no conflicts to declare.Acknowledgements
Vanessa C. D. Graça and Laura I. V. Holz are grateful to the Fundação para a Ciência e Tecnologia (FCT), for their PhD grants, respectively, SFRH/BD/130218/2017 and PD/BDE/142837/2018. Francisco J. A. Loureiro is thankful for the Investigator Grant CEECIND/02797/2020. The authors also acknowledge the projects PTDC/CTM-CTM/2156/2020, PTDC/QUI-ELT/3681/2020, POCI-01-0247-FEDER-039926, 2022.02498.PTDC, 2022.09319.PTDC, UIDB/00481/2020 and UIDP/00481/2020 from FCT, and CENTRO-01-0145-FEDER-181241 and CENTRO-01-0145-FEDER-022083 from Centro Portugal Regional Operational Programme (Centro2020), under the PORTUGAL 2020 Partnership Agreement, through the European Regional Development Fund (ERDF). Glenn C. Mather thanks the MICINN (Spain) for the concession of project PID2021-123308OB-I00.References
- P. Patsalas, N. Kalfagiannis, S. Kassavetis, G. Abadias, D. V. Bellas, C. Lekka and E. Lidorikis, Conductive nitrides: Growth principles, optical and electronic properties, and their perspectives in photonics and plasmonics, Mater. Sci. Eng., R, 2018, 123, 1–55, DOI:10.1016/j.mser.2017.11.001.
- H. Wang, J. Li, K. Li, Y. Lin, J. Chen, L. Gao, V. Nicolosi, X. Xiao and J. M. Lee, Transition metal nitrides for electrochemical energy applications, Chem. Soc. Rev., 2021, 50, 1354–1390, 10.1039/d0cs00415d.
- A. B. Dongil, Recent Progress on Transition Metal Nitrides Nanoparticles as Heterogeneous Catalysts, Nanomaterials, 2019, 9(8), 1111, DOI:10.3390/NANO9081111.
- H. Tang, X. Tian, J. Luo, J. Zeng, Y. Li, H. Song and S. Liao, A Co-doped porous niobium nitride nanogrid as an effective oxygen reduction catalyst, J. Mater. Chem. A, 2017, 5, 14278–14285, 10.1039/C7TA03677A.
- S. Tamura, K. Ueno and K. Hato, Niobium oxynitride prepared by thermal NH3 nitridation as a photoanode material for solar water splitting, Mater. Res. Bull., 2019, 112, 221–225, DOI:10.1016/J.MATERRESBULL.2018.12.001.
- R. Kikuchi, T. Kouzaki, T. Kurabuchi and K. Hato, Characterization of Baddeleyite-structure NbON Films Deposited by RF Reactive Sputtering for Solar Hydrogen Production Devices, Electrochemistry, 2015, 83, 711–714, DOI:10.5796/ELECTROCHEMISTRY.83.711.
- Y. Abghoui, A. L. Garden, V. F. Hlynsson, S. Björgvinsdóttir, H. Ólafsdóttir and E. Skúlason, Enabling electrochemical reduction of nitrogen to ammonia at ambient conditions through rational catalyst design, Phys. Chem. Chem. Phys., 2015, 17, 4909–4918, 10.1039/c4cp04838e.
- Y. Abghoui and E. Skúlason, Onset potentials for different reaction mechanisms of nitrogen activation to ammonia on transition metal nitride electro-catalysts, Catal. Today, 2017, 286, 69–77, DOI:10.1016/j.cattod.2016.11.047.
- F. Hanifpour, C. P. Canales, E. G. Fridriksson, A. Sveinbjörnsson, T. K. Tryggvason, E. Lewin, F. Magnus, Á. S. Ingason, E. Skúlason and H. D. Flosadóttir, Investigation into the mechanism of electrochemical nitrogen reduction reaction to ammonia using niobium oxynitride thin-film catalysts, Electrochim. Acta, 2022, 403, 139551, DOI:10.1016/J.ELECTACTA.2021.139551.
- Q. Luo, C. Lu, L. Liu and M. Zhu, A review on the synthesis of transition metal nitride nanostructures and their energy related applications, Green Energy Environ., 2023, 8, 406–437, DOI:10.1016/j.gee.2022.07.002.
- S. Tamura, K. Ueno and K. Hato, Niobium oxynitride prepared by thermal NH3 nitridation as a photoanode material for solar water splitting, Mater. Res. Bull., 2019, 112, 221–225, DOI:10.1016/J.MATERRESBULL.2018.12.001.
- B. Wei, F. Ming, H. Liang, Z. Qi, W. Hu and Z. Wang, All nitride asymmetric supercapacitors of niobium titanium nitride-vanadium nitride, J. Power Sources, 2021, 481, 228842, DOI:10.1016/j.jpowsour.2020.228842.
- P. Wang, R. Wang, J. Lang, X. Zhang, Z. Chen and X. Yan, Porous niobium nitride as a capacitive anode material for advanced Li-ion hybrid capacitors with superior cycling stability, J. Mater. Chem. A, 2016, 4, 9760–9766, 10.1039/C6TA02971J.
- H. Cui, G. Zhu, X. Liu, F. Liu, Y. Xie, C. Yang, T. Lin, H. Gu and F. Huang, Niobium Nitride Nb4N5 as a New High-Performance Electrode Material for Supercapacitors, Adv. Sci., 2015, 2, 1500126, DOI:10.1002/advs.201500126.
- X. J. Wang, F. Krumeich, M. Wörle, R. Nesper, L. Jantsky and H. Fjellvåg, Niobium(V) Oxynitride: Synthesis, Characterization, and Feasibility as Anode Material for Rechargeable Lithium-Ion Batteries, Chem. – Eur. J., 2012, 18, 5970–5978, DOI:10.1002/CHEM.201102653.
- N. Cucciniello, D. Lee, H. Y. Feng, Z. Yang, H. Zeng, N. Patibandla, M. Zhu and Q. Jia, Superconducting niobium nitride: a perspective from processing, microstructure, and superconducting property for single photon detectors, J. Phys.: Condens. Matter, 2022, 34, 374003, DOI:10.1088/1361-648X/ac7dd6.
- E. J. Cukauskas, W. L. Carter and S. B. Qadri, Superconducting and structure properties of niobium nitride prepared by rf magnetron sputtering, J. Appl. Phys., 1985, 57, 2538–2542, DOI:10.1063/1.335442.
- S. Guo, Q. Chen, D. Pan, Y. Wu, X. Tu, G. He, H. Han, F. Li, X. Jia, Q. Zhao, H. Zhang, X. Bei, J. Xie, L. Zhang, J. Chen, L. Kang and P. Wu, Fabrication of superconducting niobium nitride nanowire with high aspect ratio for X-ray photon detection, Sci. Rep., 2020, 10, 9057, DOI:10.1038/s41598-020-65901-5.
- Y. Abghoui, A. L. Garden, J. G. Howalt, T. Vegge and E. Skúlason, Electroreduction of N2 to Ammonia at Ambient Conditions on Mononitrides of Zr, Nb, Cr, and V: A DFT Guide for Experiments, ACS Catal., 2016, 6, 635–646, DOI:10.1021/acscatal.5b01918.
- G. Brauer, Nitrides, carbonitrides, and oxynitrides of niobium, J. Less-Common Met., 1960, 2, 131–137, DOI:10.1016/0022-5088(60)90008-4.
- K. Balasubramanian, S. V. Khare and D. Gall, Energetics of point defects in rocksalt structure transition metal nitrides: Thermodynamic reasons for deviations from stoichiometry, Acta Mater., 2018, 159, 77–88, DOI:10.1016/J.ACTAMAT.2018.07.074.
- K. Zhang, K. Balasubramanian, B. D. Ozsdolay, C. P. Mulligan, S. V. Khare, W. T. Zheng and D. Gall, Growth and mechanical properties of epitaxial NbN(001) films on MgO(001, Surf. Coat. Technol., 2016, 288, 105–114, DOI:10.1016/J.SURFCOAT.2016.01.009.
- N. Cansever, M. Danişman and K. Kazmanli, The effect of nitrogen pressure on cathodic arc deposited NbN thin films, Surf. Coat. Technol., 2008, 202, 5919–5923, DOI:10.1016/J.SURFCOAT.2008.06.158.
- W. Lengauer, M. Bohn, B. Wollein and K. Lisak, Phase reactions in the Nb–N system below 1400 °C, Acta Mater., 2000, 48, 2633–2638, DOI:10.1016/S1359-6454(00)00056-2.
- G. Brauer, Nitrides, carbonitrides and oxynitrides of niobium, J. Less-Common Met., 1960, 2, 131–137, DOI:10.1016/0022-5088(60)90008-4.
- H. S. Kim, C. H. Shin, G. Bugli, M. Bureau-Tardy and G. Djega-Mariadassou, Catalytic activity of niobium oxynitride and carbide I. Preparation, characterization and thermal stability of finely divided niobium oxynitrides, Appl. Catal., A, 1994, 119, 223–240, DOI:10.1016/0926-860X(94)85193-X.
- R. S. Ningthoujam and N. S. Gajbhiye, Synthesis, electron transport properties of transition metal nitrides and applications, Prog. Mater. Sci., 2015, 70, 50–154, DOI:10.1016/J.PMATSCI.2014.11.004.
- L. I. V. Holz, V. C. D. Graça, F. J. A. Loureiro, S. M. Mikhalev, D. Mendes, A. Mendes and D. P. Fagg, Tailoring the anion stoichiometry and oxidation kinetics of vanadium (oxy)nitride by the control of ammonolysis conditions, J. Mater. Chem. C, 2022, 10, 5608–5620, 10.1039/D2TC00545J.
- V. M. Orlov and R. N. Osaulenko, Properties of Nitrides Prepared by the Ammonolysis of Magnesiothermic Niobium Powders, Inorg. Mater., 2018, 54(7), 639–644, DOI:10.1134/S0020168518070129.
- M. R. Brophy, S. M. Pilgrim and W. A. Schulze, Synthesis of BaTaO2N Powders Utilizing NH3 Decomposition, J. Am. Ceram. Soc., 2011, 94, 4263–4268, DOI:10.1111/J.1551-2916.2011.04826.X.
- A. Fuertes, Metal oxynitrides as emerging materials with photocatalytic and electronic properties, Mater. Horiz., 2015, 2, 453–461, 10.1039/c5mh00046g.
- S. Kalal, M. Gupta and R. Rawat, N concentration effects on structure and superconductivity of NbN thin films, J. Alloys Compd., 2021, 851, 155925, DOI:10.1016/J.JALLCOM.2020.155925.
- H. Tang, X. Tian, J. Luo, J. Zeng, Y. Li, H. Song and S. Liao, A Co-doped porous niobium nitride nanogrid as an effective oxygen reduction catalyst, J. Mater. Chem. A, 2017, 5, 14278–14285, 10.1039/C7TA03677A.
- G. Brauer and J. Jander, Die Nitride des Niobs, Z. Anorg. Allg. Chem., 1952, 270, 160–178, DOI:10.1002/ZAAC.19522700114.
- V. Schwartz and S. T. Oyama, Study of Niobium Oxynitride: Synthesis, Characterization, and Reactivity, Chem. Mater., 1997, 9(12), 3052–3059, DOI:10.1021/CM970393+.
- K. Tateno, Y. Masubuchi and S. Kikkawa, Niobium oxynitrides with defective rock salt-type structures, J. Alloys Compd., 2019, 803, 678–683, DOI:10.1016/J.JALLCOM.2019.06.320.
- K. Momma and F. Izumi, VESTA 3 for three-dimensional visualization of crystal, volumetric and morphology data, J. Appl. Crystallogr., 2011, 44, 1272–1276, DOI:10.1107/S0021889811038970.
- H. E. Kissinger, Reaction Kinetics in Differential Thermal Analysis, Anal. Chem., 1957, 29, 1702–1706, DOI:10.1021/AC60131A045/ASSET/AC60131A045.FP.PNG_V03.
- S. Vyazovkin, A. K. Burnham, J. M. Criado, L. A. Pérez-Maqueda, C. Popescu and N. Sbirrazzuoli, ICTAC Kinetics Committee recommendations for performing kinetic computations on thermal analysis data, Thermochim. Acta, 2011, 520, 1–19, DOI:10.1016/J.TCA.2011.03.034.
- Y. Zou, X. Qi, C. Zhang, S. Ma, W. Zhang, Y. Li, T. Chen, X. Wang, Z. Chen, D. Welch, P. Zhu, B. Liu, Q. Li, T. Cui and B. Li, Discovery of Superconductivity in Hard Hexagonal ε-NbN, Sci. Rep., 2016, 6(1), 1–9, DOI:10.1038/srep22330.
- F. Tessier, R. Assabaa and R. Marchand, Mixed valent niobium nitrides and oxynitrides resulting from ammonolysis of alkaline niobates, J Alloys Compd., 1997, 262–263, 512–515, DOI:10.1016/S0925-8388(97)00365-4.
- G. I. Oya and Y. Onodera, Transition temperatures and crystal structures of single-crystal and polycrystalline NbNx films, J. Appl. Phys., 2003, 45, 1389, DOI:10.1063/1.1663418.
- S. Yamamoto, Y. Ohashi, Y. Masubuchi, T. Takeda, T. Motohashi and S. Kikkawa, Niobium–aluminum oxynitride prepared by ammonolysis of oxide precursor obtained through the citrate route, J. Alloys Compd., 2009, 482, 160–163, DOI:10.1016/J.JALLCOM.2009.03.151.
- D. Choi and P. N. Kumta, Synthesis and Characterization of Nanostructured Niobium and Molybdenum Nitrides by a Two-Step Transition Metal Halide Approach, J. Am. Ceram. Soc., 2011, 94, 2371–2378, DOI:10.1111/J.1551-2916.2011.04412.X.
- A. V. Lubenchenko, A. A. Batrakov, I. V. Shurkaeva, A. B. Pavolotsky, S. Krause, D. A. Ivanov and O. I. Lubenchenko, XPS Study of Niobium and Niobium-Nitride Nanofilms, J. Surf. Invest.: X-Ray, Synchrotron Neutron Tech., 2018, 12(4), 692–700, DOI:10.1134/S1027451018040134.
- A. Darlinski and J. Halbritter, Angle-resolved XPS studies of oxides at NbN, NbC, and Nb surfaces, Surf. Interface Anal., 1987, 10, 223–237, DOI:10.1002/SIA.740100502.
- H. C. Barshilia, B. Deepthi, K. S. Rajam, K. P. Bhatti and S. Chaudhary, Structure and properties of reactive direct current magnetron sputtered niobium aluminum nitride coatings, J. Mater. Res., 2008, 23, 1258–1268, DOI:10.1557/JMR.2008.0168/FIGURES/13.
- H. Tang, X. Tian, J. Luo, J. Zeng, Y. Li, H. Song and S. Liao, A Co-doped porous niobium nitride nanogrid as an effective oxygen reduction catalyst, J. Mater. Chem. A, 2017, 5, 14278–14285, 10.1039/C7TA03677A.
- Z. Li, Y. Cui, Z. Wu, C. Milligan, L. Zhou, G. Mitchell, B. Xu, E. Shi, J. T. Miller, F. H. Ribeiro and Y. Wu, Reactive metal–support interactions at moderate temperature in two-dimensional niobium-carbide-supported platinum catalysts, Nat. Catal., 2018, 1(5), 349–355, DOI:10.1038/s41929-018-0067-8.
- H. Cui, G. Zhu, X. Liu, F. Liu, Y. Xie, C. Yang, T. Lin, H. Gu, F. Huang, H. Cui, G. Zhu, F. Liu, Y. Xie, C. Yang, T. Lin, H. Gu, F. Huang and X. Liu, Niobium Nitride Nb4N5 as a New High-Performance Electrode Material for Supercapacitors, Adv. Sci., 2015, 2, 1500126, DOI:10.1002/ADVS.201500126.
- C. Dong, X. Wang, X. Liu, X. Yuan, W. Dong, H. Cui, Y. Duan and F. Huang, In situ grown Nb4N5 nanocrystal on nitrogen-doped graphene as a novel anode for lithium ion battery, RSC Adv., 2016, 6, 81290–81295, 10.1039/C6RA13647H.
- S. Kalal, S. Nayak, A. Tayal, J. Birch, R. Rawat and M. Gupta, Effect of disorder on superconductivity of NbN thin films studied using x-ray absorption spectroscopy, J. Phys.: Condens. Matter, 2021, 33, 305401, DOI:10.1088/1361-648X/AC00DC.
- A. Tyutyunnik, J. Grins and G. Svensson, Rietveld refinement studies of Nb4N5- and Nb5N6-related phases in the (Mn)–Nb–O–N system, J. Alloys Compd., 1998, 278, 83–91, DOI:10.1016/S0925-8388(97)00496-9.
- L. I. V. Holz, V. C. D. Graça, F. J. A. Loureiro, S. M. Mikhalev, D. Mendes, A. Mendes and D. P. Fagg, Tailoring the anion stoichiometry and oxidation kinetics of vanadium (oxy)nitride by the control of ammonolysis conditions, J. Mater. Chem. C, 2022, 10, 5608–5620, 10.1039/D2TC00545J.
- S. Vyazovkin, A. K. Burnham, J. M. Criado, L. A. Pérez-Maqueda, C. Popescu and N. Sbirrazzuoli, ICTAC Kinetics Committee recommendations for performing kinetic computations on thermal analysis data, Thermochim. Acta, 2011, 520, 1–19, DOI:10.1016/J.TCA.2011.03.034.
- L. Le Gendre, R. Marchand and Y. Laurent, A new class of inorganic compounds containing dinitrogen-metal bonds, J. Eur. Ceram. Soc., 1997, 17, 1813–1818, DOI:10.1016/S0955-2219(97)00064-2.
- J. Ma, M. Wu, Y. Du, S. Chen, W. Jin, L. Fu, Q. Yang and A. Wen, Formation of nanocrystalline niobium carbide (NbC) with a convenient route at low temperature, J. Alloys Compd., 2009, 475, 415–417, DOI:10.1016/J.JALLCOM.2008.07.039.
- A. Rachel, S. G. Ebbinghaus, M. Güngerich, P. J. Klar, J. Hanss, A. Weidenkaff and A. Reller, Tantalum and niobium perovskite oxynitrides: Synthesis and analysis of the thermal behaviour, Thermochim. Acta, 2005, 438, 134–143, DOI:10.1016/J.TCA.2005.08.010.
- P. K. Gallagher and W. R. Sinclair, Oxidation of Polycrystalline Niobium Nitride, Isr. J. Chem., 1982, 22, 222–226, DOI:10.1002/IJCH.198200044.
- A. P. Wilkinson, J. S. Speck, A. K. Cheetham, S. Natarajan and J. M. Thomas, In Situ X-ray Diffraction Study of Crystallization Kinetics in PbZr1−xTixO3, (PZT, x = 0.0, 0.55, 1.0), Chem. Mater., 1994, 6, 750–754, DOI:10.1021/CM00042A009/ASSET/CM00042A009.FP.PNG_V03.
- A. G. Marangoni, On the use and misuse of the avrami equation in characterization of the kinetics of fat crystallization, J. Am. Oil Chem. Soc., 1998, 75(10), 1465–1467, DOI:10.1007/S11746-998-0203-8.
Footnote |
| † Electronic supplementary information (ESI) available. See DOI: https://doi.org/10.1039/d3tc01068f |
| This journal is © The Royal Society of Chemistry 2023 |

