
 Open Access Article
 This Open Access Article is licensed under a
 Creative Commons Attribution 3.0 Unported Licence
Efficient down-shifting and up-conversion emission dual-mode in RE3+-doped NaTbF4-based nano-glass ceramics
Javier
del-Castillo
 ,
Angel Carlos
Yanes
* and
Moisés
Cantón-Jara
,
Angel Carlos
Yanes
* and
Moisés
Cantón-Jara
Departamento de Física, Universidad de La Laguna, 38200 La Laguna, Tenerife, Spain. E-mail: ayanesh@ull.edu.es
First published on 5th May 2023
Abstract
Undoped and RE3+-doped (Eu3+, Yb3+) nano-glass ceramics (nGCs) comprising NaTbF4 nanocrystals (NCs) were obtained by thermal treatment of precursor sol–gel glasses. The structural characterization was carried out by X-ray diffraction, transmission electron microscopy and electron dispersive X-ray spectroscopy, which confirm that spherical cubic phase NaTbF4 NCs were precipitated and uniformly distributed in the silica matrix. Additionally, in order to study the local environment of the dopant RE3+ ions and their distribution in nGCs, Eu3+ ions were considered as a spectroscopic probe. These materials present intense green and red emissions from Tb3+ and Eu3+ ions, respectively, both by down-shifting from UV-blue excitation, as well as cooperative up-conversion from 980 nm NIR excitation processes. In order to quantify the efficiency of all these emissions, the corresponding quantum yields were measured. Very efficient energy migration from Yb3+ to Eu3+ through Tb3+ ions made it possible to obtain long lived UC red emissions from Eu3+ ions, which are very useful in time-gated luminescence techniques. Through time resolved spectra and luminescence decay measurements, the involved energy transfer mechanisms were proposed. All these results allow considering these nGCs as dual-wavelength mode UV/NIR to VIS converter materials, with potential utility in solar cells, w-LEDs and anti-counterfeiting applications.
1 Introduction
Rare-earth (RE3+) based nanostructured materials for photon down-shifting (DS) and up-conversion (UC) processes, from ultraviolet (UV) and near-infrared radiation (NIR), respectively, have been an active field of research in recent years for their diverse and important applications, such as lasers,1–3 solar cells,4–6 w-LEDs,7,8 bio-imaging,9–12 temperature sensing,13,14 anti-counterfeiting,15–19 photocatalysis,20,21 and so on. Among these materials, transparent RE3+-doped nano-glass ceramics (nGCs) comprising fluoride nanocrystals (NCs) in a robust oxide glassy matrix stand out, for they combine the advantages of the thermal, mechanical and chemical properties of oxide glasses with the low phonon energy of crystalline fluoride environments.22 Because RE3+ dopants are mainly confined in crystalline environments, where the non-radiative quenching of emissions is restricted, they present long excited-state lifetimes and large optical absorption cross-sections, therefore yielding higher efficiencies when compared to the remaining ions in the surrounding glass.23Among RE3+ ions, Tb3+ and Eu3+ are very attractive as DS emitting ions because the high quantum efficiencies related to the large energy gap between the emitting states and the low lying 7FJ=0,1,.,7 excited states give place to intense green and red emissions in the visible region. Moreover, Tb3+ ions have also been proven to be one of the most suitable sensitizers for Eu3+ emissions.24,25 However, the use of both ions as upconverters is very limited because of the inefficient absorption of infrared photons. As it is well known, the most efficient UC systems are based on the energy transfer (ET) between Yb3+ and Ho3+, Er3+ or Tm3+ ions, yielding green, red and blue emissions.23,26,27 The Yb3+ ion is used as a suitable sensitizer because it strongly absorbs NIR radiation at around 980 nm and can efficiently transfer it to these RE3+ ions due to their ladder-like energy levels. However, UC from Tb3+ and Eu3+ ions, without intermediate energy levels resonant with Yb3+ ions, is completely different and requires the least efficient cooperative energy transfer (CET) mechanism, where two Yb3+ ions that are excited by NIR radiation simultaneously combine and transfer their energies to one of these ions.28–30 In this regard, it should be noted that Tb3+ ions are more interesting candidates to be excited by a cooperative process from Yb3+ ions, because in this case the energy transfer is resonant.
Among the fluoride NCs, NaTbF4 is a very attractive optical material. However, it has been poorly researched, and no UC luminescent properties have been reported so far.31–33 It presents a very low-phonon energy (∼350 cm−1) and suitable Tb3+ sites that can be easily substituted by other RE3+ ions without additional charge compensation. Thus, besides simultaneously serving as constituents of the crystalline lattice, due to the high content of Tb3+, and as activators,31 Tb3+ ions in NaTbF4 NCs can also easily act as sensitizers, strongly absorbing the incident energy and then transferring it to other RE3+ ions.32,33 They can also act as an excellent energy migrator, favoring the ET processes in NCs through the chain Tb3+ → (Tb3+)n → RE3+, and providing an enhancement of luminescent properties of the activator ions.34
In previous studies, we developed efficient green emitter Yb3+–Tb3+ co-doped up-converting systems based on CET that use KYF4 NCs embedded in silica glasses.35 We have also explored DS ET from Ce3+ to Eu3+ ions in Ce3+–Tb3+–Eu3+ tri-doped KYF4 and LaF3 based nGCs under Ce3+ UV excitation, where Tb3+ ions act as the bridging ion through which the excitation energy was transferred from the Ce3+ sensitizers to the Eu3+ activator ions.7,36 Thus, in NaTbF4 based nGCs, one could expect NIR UC based on Yb3+ → Tb3+ → Eu3+ ET to be more efficient than the direct cooperative sensitization process between Yb3+ and Eu3+ ions. They can also be a good alternative for conventional red emitting Ho3+/Er3+-based UC systems, with the additional merit of their longer lifetime and a potential utility in applications that require the use of a time-gated technique.37
In the present work, we have successfully obtained a series of nGCs based on cubic NaTbF4 NCs undoped and doped with Yb3+ and/or Eu3+ ions via the sol–gel method and subsequent heat treatments, that combine both DS and UC luminescence from identical RE3+ ions. Their morphological and structural characteristics were studied by means of X-ray powder diffraction (XRD), transmission electron microscopy (TEM) and energy dispersive X-ray spectroscopy (EDS) measurements, and also by using the activator Eu3+ ion as an optical probe to study the local environment of the RE3+ dopant ions in the nGCs. Very efficient green or red emissions were obtained through DS and cooperative UC (CUC) mechanisms, where Tb3+ ions acted as the activator, as the sensitizer to Eu3+ emissions, or as the energy migrator transferring the absorbed energy from Yb3+ to Eu3+ ions. The corresponding properties and mechanisms of all emissions were studied and are discussed in detail.
2 Experimental section
2.1 Materials
Materials used, of analytical grade and without further purification, were purchased from Sigma-Aldrich and Merck: TEOS (99.999%), sodium acetate (99.995%), terbium acetate (99.9%), europium acetate (99.9%), ytterbium acetate (99.95%), trifluoracetic acid (>99%), ethanol (>99%, Merck), acetic acid (>99%, Merck), and deionized water (Sigma-Aldrich).2.2 Synthesis
Silica glasses with composition 95SiO2–5NaTb(1−x−y)EuxYbyF4 in mol% (x = 0, 0.02 and y = 0, 0.1 or 0.2) were obtained by a sol–gel method as it was described by J. Méndez-Ramos et al.27 Tetraethyl orthosilicate (TEOS) was used as the source of SiO2 and hydrolyzed for 1 hour at room temperature with a solution of ethanol, deionized H2O and acetic acid as the catalyst. The required quantities of Na(CH3COO), Tb(CH3COO)3xH2O, Eu(CH3COO)3xH2O and Yb(CH3COO)3xH2O, dissolved in a trifluoracetic acid aqueous solution, were slowly added dropwise into the above solution and vigorously stirred for 1 h to obtain a homogeneous solution. The resulting solution, in a sealed container at 35 °C, gave rise to transparent gels after 10 days. Through slow evaporation, these gels were dried for 6 weeks. Finally, these dried gels were thermally treated under an air atmosphere at 650 °C, the optimal temperature to achieve a stiff glass network and the controlled precipitation of NaTbF4 NCs required to produce nGCs without loss of transparency. Silica glass doped with 2 mol% of Eu3+ was obtained using a similar procedure for comparison purposes.2.3. Characterization
The XRD measurements were carried out with a Philips Panalytical X’Pert Pro diffractometer (with a primary monochromator, a CuKα1 radiation source (λ = 1.5406 Å), and an X’Celerator detector). XRD patterns were recorded with a step of 0.016° in the 2θ angular range (15–80°) for 30 min. As an internal standard diffraction pattern, to calibrate the parameters of the instrumental profile, LaB6 was used. Moreover, TEM images and EDS measurements were performed using a transmission electron microscope (JEOL-2100F), with a field emission gun, operating at 200 kV and a point-to-point resolution of 0.24 nm. The analyzed samples were obtained by dispersing fine powder (after grinding the nGCs) in acetone and finally dropping them onto carbon-coated copper grids.Steady state and time-resolved photoluminescence (PL) measurements were carried out with a PTI spectrometer controlled using Felix32 software, which was equipped with a 75 W xenon arc and flash lamps as excitation sources, whose beams passed through an excitation 0.2 m monochromator and was detected with a 0.2 m emission monochromator, and provided with an R928 Hamamatsu PMT. A tunable pulsed laser (EKSPLA-NT342-3-UVE-6 ns-10 Hz) optical parametric oscillator (OPO), pumped by the third harmonic wavelength at 355 nm of a Q-switched YAG:Nd laser, tuned to 483 nm in order to excite the studied samples, was used to measure the emission increase and decay times. Detection was registered by using an R928 photomultiplier and a digital oscilloscope (Keysight DSOX 2024A).
Photoluminescence quantum yield (PLQY) and UC quantum yield (UCQY) were measured with an Edinburgh spectrofluorimeter FLS 1000 equipped with a 15 cm integration sphere SC30, through the expression 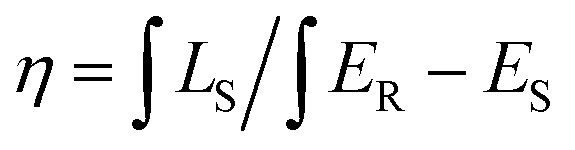 , where LS is the area of the emission spectrum, while ER and ES are the corresponding areas for the excitation light source, without and with the sample, respectively. The excitation wavelength was 351 nm by using a Xe lamp (150 W) and 980 nm using a laser diode with a power density of 100 W cm−2, as excitation sources. The equipment was calibrated with [Eu(phen)(tta)3] with a quantum yield of 69%.
For UC measurements, a 980 nm commercial laser diode with a pump power of up to 300 mW was used, along with a 50 mm focal lens to concentrate the incident radiation onto the nGCs. Detection was carried out with a 0.2 m emission monochromator equipped with an R928 Hamamatsu PMT. The power density can be roughly estimated from the beam diameter (2 mm), the incident laser excitation pump power and the lens focal length. All measurements were taken at room temperature and corrected by the instrumental response of the equipment. Additionally, a CCD digital camera was used to obtain color photographs of transparent nGCs.
3 Results and discussion
3.1 Structural characterization
Fig. 1 shows the XRD patterns of a precursor glass and the nGCs with compositions 95SiO2–5NaTbF4, 95SiO2–5NaTb0.98Eu0.02F4 and 95SiO2–5NaTb0.78Eu0.02Yb0.20F4, heat-treated at 650 °C. In addition, the standard diffraction pattern of cubic NaTbF4 (JCPDS 27-0808) is also included for comparison. On the one hand, the characteristic broad band of SiO2 in the amorphous state at around 20° (see precursor glass pattern) can be clearly observed together with the superimposed diffraction peaks at 27.6°, 31.8°, 46.0°, 54.2°, 67.1° and 75.3°, which correspond to the precipitation of NaTbF4 NCs in the cubic phase (fluorite structure, space group Fm![[3 with combining macron]](https://www.rsc.org/images/entities/char_0033_0304.gif) m).32,34 Moreover, from the diffraction patterns and by using the Scherrer equation, it is possible to determine the size of NCs. Thus, mean sizes of 21.0, 22.2, and 24.4 nm are obtained for the nGCs 95SiO2–5NaTbF4, 95SiO2–5NaTb0.98Eu0.02F4 and 95SiO2–5NaTb0.78Eu0.02Yb0.20F4, respectively, much smaller than those previously obtained by X. Li et. al. (around 71 nm), in melt quenching nGCs comprising NaTbF4 NCs.34
m).32,34 Moreover, from the diffraction patterns and by using the Scherrer equation, it is possible to determine the size of NCs. Thus, mean sizes of 21.0, 22.2, and 24.4 nm are obtained for the nGCs 95SiO2–5NaTbF4, 95SiO2–5NaTb0.98Eu0.02F4 and 95SiO2–5NaTb0.78Eu0.02Yb0.20F4, respectively, much smaller than those previously obtained by X. Li et. al. (around 71 nm), in melt quenching nGCs comprising NaTbF4 NCs.34
 | ||
| Fig. 1 XRD patterns of precursor glass and nGCs with compositions 95SiO2–5NaTbF4, 95SiO2–5NaTb0.98Eu0.02F4 and 95SiO2–5NaTb0.78Eu0.02Yb0.20F4, heat-treated at 650 °C. In addition, the standard diffraction pattern of cubic NaTbF4 is also included for comparison. Magnified XRD peaks in the inset of un-doped and Yb3+–Eu3+ co-doped nGCs show a shift related to the doping level. | ||
It should be noted that 95SiO2–5NaTbF4 and 95SiO2–5NaTb0.98Eu0.02F4 nGCs present similar XRD patterns, due to their similar ionic radii (rTb3+ = 1.040 Å, rEu3+ = 1.066 Å) and a low doping level. However, when doping with high amounts of Yb3+ ions, i.e. nGC with composition 95SiO2–5NaTb0.78Eu0.02Yb0.20F4, lattice constants shrink due to their smaller ionic radii when compared with Tb3+ ions (rYb3+ = 0.985 Å) and a shifting of diffraction peaks towards higher angles is observed (see the inset in Fig. 1), leading to consider that dopant ions have been successfully incorporated into the crystal lattice of the NaTbF4 host substituting the Tb3+ sites.
Additionally, morphological and microstructural information can be obtained from TEM and HRTEM images. In the TEM image of nGC with composition 95SiO2–5NaTb0.78Eu0.02Yb0.20F4 (see Fig. 2(a)), a series of spherical nanoparticles homogeneously dispersed with a size distribution according to histogram included in the inset are observed, associated with the crystalline phase on the glassy background. The average nanoparticle size (around 23 nm) presents a good agreement with that previously obtained from the XRD.
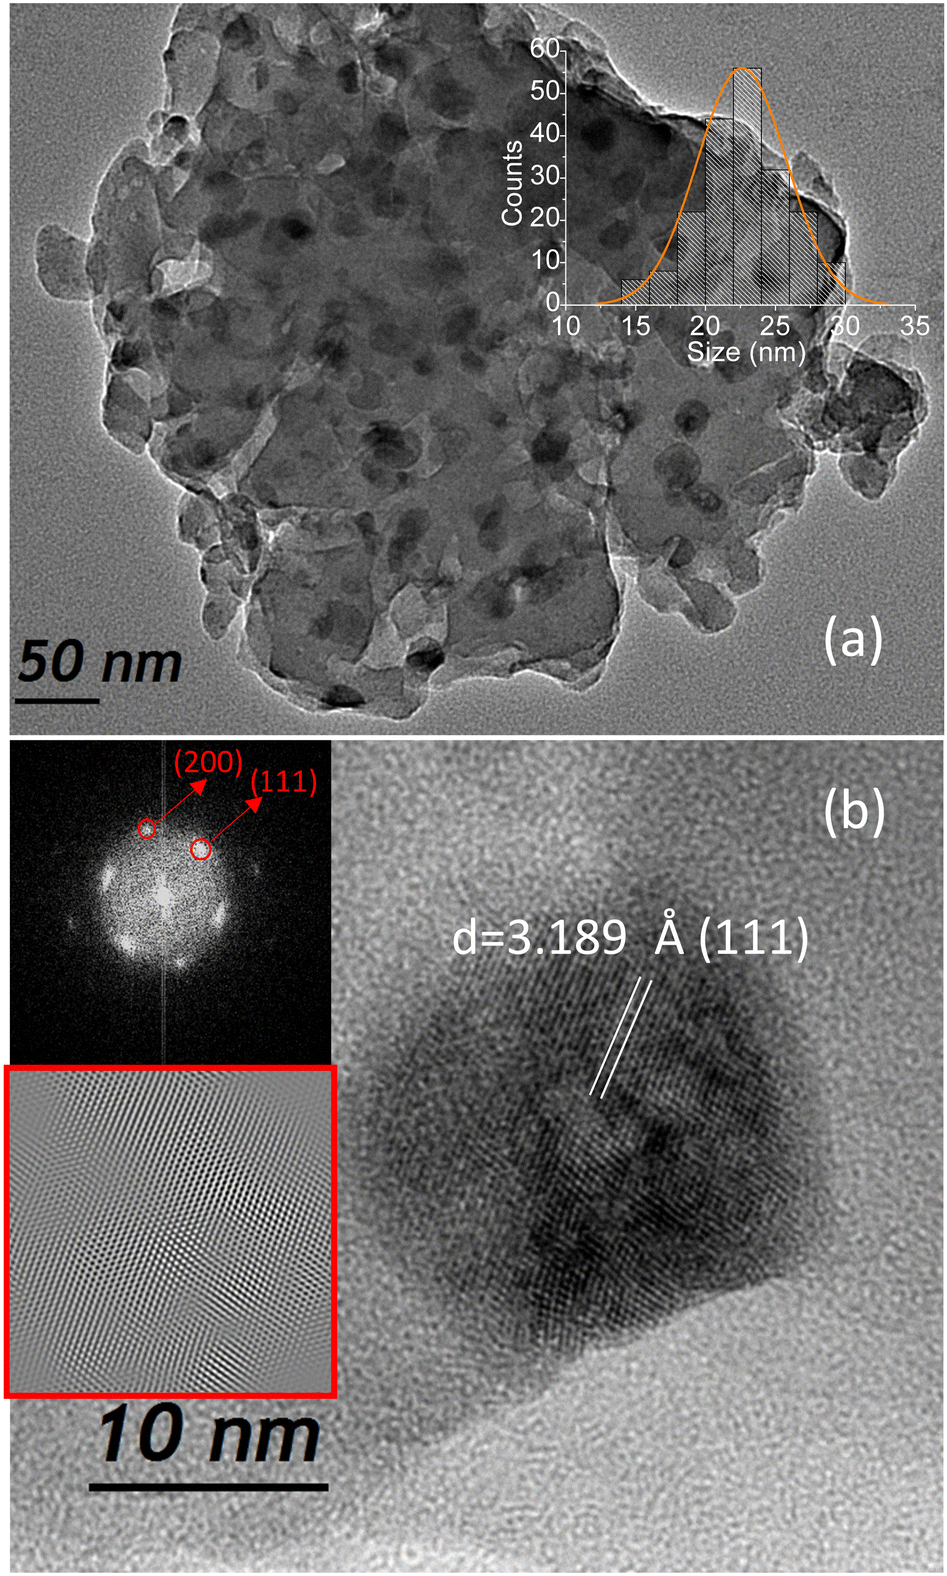 | ||
| Fig. 2 (a) TEM image of nGC with composition 95SiO2–5NaTb0.78Eu0.02Yb0.20F4 and corresponding size distribution. (b) Corresponding HRTEM image with the power spectrum (FFT) pattern and filtered higher-contrasted image of a nanoparticle. | ||
Moreover, the HRTEM image (Fig. 2(b)) shows the detailed lattice structure of precipitated NaTbF4 nanoparticles, which is indicative of the high degree of crystallinity. The atomic planes can be clearly distinguished, with a spacing of 3.189 Å, which is in good agreement with the expected value for the (111) plane of the cubic phase of NaTbF4 using the Bragg equation. The power spectrum, obtained from this nanoparticle using Fourier transform (FFT) also confirms the presence of the cubic (200) and (111) planes. The corresponding filtered image is also included in the inset of Fig. 2(b).
Additionally, in order to evaluate the elemental distribution in the nGC, EDS spectra from a single NC and from the glass matrix were recorded (see Fig. 3). Cu and C peaks (originating from the support grid) were observed in both spectra. The EDS spectrum containing the nanocrystalline domain shows signals from Si and O elements along with Na, Tb, Yb and F, whereas in the EDS spectrum corresponding to the glass matrix, the intensities corresponding to these last elements were much weaker (∼20 times) while the Si and O ones were more intense. The atomic ratios of Na/Tb/Yb/F were 1.04/0.78/0.20/4.03, in good agreement with the theoretical atomic ratio (1![[thin space (1/6-em)]](https://www.rsc.org/images/entities/char_2009.gif) :1:4) in NaTbF4.
:1:4) in NaTbF4.
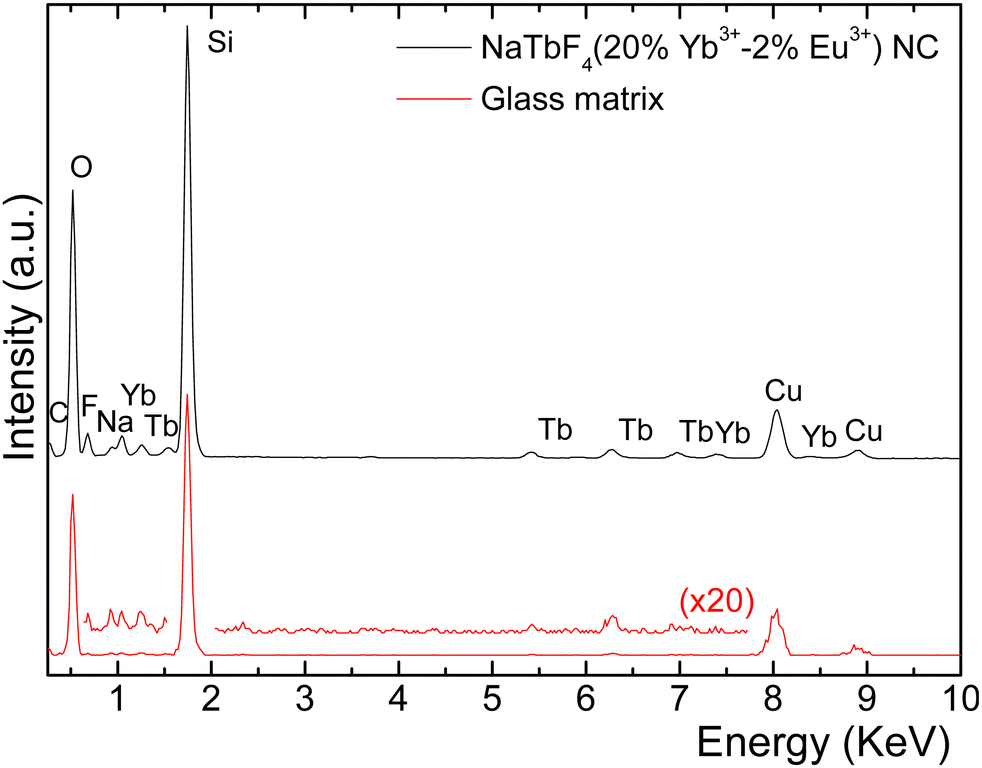 | ||
| Fig. 3 EDS analysis of nGC with composition 95SiO2–5NaTb0.78Yb0.20Eu0.02F4 from a single NC and from an area containing the glass matrix. | ||
3.2 Luminescence
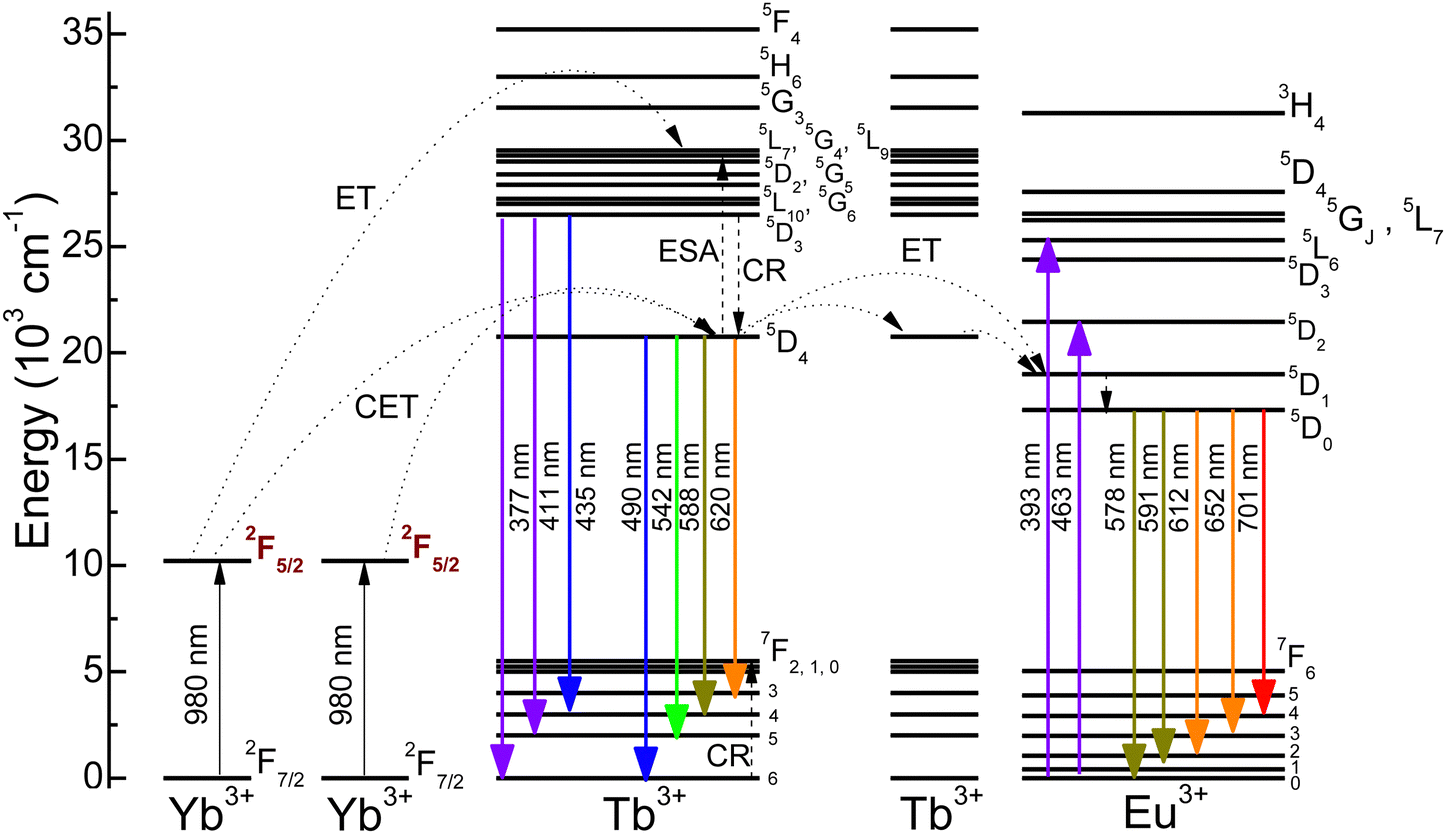
The spectroscopic study is based on excitation and emission spectra, along with time-resolved PL measurements. In this sense, Fig. 4(a) shows the excitation spectrum, detecting Tb3+ ions at 542 nm (5D4 → 7F5 transition) of undoped nGC with composition 95SiO2–5NaTbF4, where a group of narrow and intense peaks characteristic of Tb3+ ions is observed in the UV-violet range between 280 and 375 nm. This is associated with transitions from the fundamental level 7F6 to the indicated excited levels (see the energy level diagram of Tb3+ ions in Fig. 4(b)). In addition, a lower intensity peak associated with the 7F6 → 5D4 transition is also observed, at around 483 nm. | ||
| Fig. 4 (a) Excitation spectrum, detecting at 542 nm (5D4 → 7F5 transition of Tb3+ ions) along with emission spectrum, exciting at 351 nm (7F6 → 5G4 transition of Tb3+ ions) in nGC with composition 95SiO2–5NaTbF4. (b) Energy level diagrams of Tb3+ and Eu3+ ions, along with the energy transfer mechanism. | ||
The corresponding emission spectrum exciting Tb3+ ions at 351 nm (7F6 → 5G4 transition) (see Fig. 4(a)) shows peaks associated with the transitions of Tb3+ ions from the 5D4 to the 7F6,5,4,3 levels, where the transition at 542 nm (5D4 → 7F5) is the most intense, yielding the green color observable with the naked eye (see inset in Fig. 4(a)). No emissions from the 5D3 level of Tb3+ ions are observed, which can be explained by the cross-relaxation processes between the Tb3+ ions through the known 5D3 + 7F6 → 5D4 + 7F0 mechanism (see Fig. 4(b)) due to the high percentage of Tb3+ ions in NaTbF4 NCs.38
In order to obtain Tb3+ sensitized Eu3+ red emissions, nGC with composition 95SiO2–5NaTb0.98Eu0.02F4 was obtained and its luminescence features were studied. Fig. 5(a) shows excitation spectra detecting at 542 and 701 nm, corresponding to transitions 5D4 → 7F5 and 5D0 → 7F4 of Tb3+ and Eu3+ ions, respectively (see energy level diagram in Fig. 4(b)). We can see that the excitation spectrum detecting Tb3+ ions consists of a series of narrow peaks, similar to those observed in the case of undoped nGC (see Fig. 4(a)), but with much less intensity (×7.5). Likewise, it is also observed that the peaks between 325 and 375 nm are relatively less intense (see Fig. 4(a)). All these would indicate that the Tb3+ ions involved in these transitions are located in different environments, as will be discussed later. On the other hand, when detecting Eu3+ ions, in addition to the Eu3+ characteristic excitation peaks due to transitions from the fundamental level 7F0 to the indicated excited levels (see energy level diagram of Eu3+ ions in Fig. 4(b)), much more intense peaks corresponding to Tb3+ ions are also observed (×8), which is indicative of a very efficient ET mechanism from Tb3+ to Eu3+ ions.39,40
 | ||
| Fig. 5 (a). Excitation spectra of the nGC with composition 95SiO2–5NaTb0.98Eu0.02F4, detecting at 542 and 701 nm, corresponding to the 5D4 → 7F5 and 5D0 → 7F4 transitions of Tb3+ and Eu3+ ions, respectively. Spectra have been normalized to the 7F6 → 5D4 transition of Tb3+ ions. (b) Emission spectra exciting at 351 and 393 nm, corresponding to the 7F6 → 5G4 and 7F0 → 5L6 transitions of Tb3+ and Eu3+, respectively. Spectra have been normalized to the 5D0 → 7F1 transition of Eu3+ ions. Right inset shows a digital photograph of the spectra exciting at 351 nm. Left inset shows, emission spectra for nGC exciting Eu3+ ions at 463 nm and for Eu3+-doped glass, exciting at 393 nm. (c) Delayed emission spectra exciting at 351 nm, with indicated delay and integration times, normalized at 5D0 → 7F1 transition of Eu3+ ions. Inset shows long delay asymmetry ratios. (d) Luminescence decay curves of Tb3+ ions in 95SiO2–5NaTbF4 (exciting at 483 nm and detecting at 544 nm) and 95SiO2–5NaTb0.98Eu0.02F4 nGCs (exciting at 483 nm and detecting at 544 and 701 nm). Inset shows a magnification at short decay times. | ||
The corresponding emission spectra are studied by excitation at different wavelengths (see Fig. 5(b)). When exciting Eu3+ ions at 393 nm (7F0 → 5L6 transition), the characteristic emissions of the Eu3+ ions at 591, 612, 652, and 701 nm, assigned to 5D0 → 7FJ=1,2,3,4 transitions are observed according to the energy level diagram shown in Fig. 4(b). On the other hand, when exciting Tb3+ ions at 351 nm, where Eu3+ ions cannot be activated, much more intense overall emission (×8) is observed, where the predominant peaks correspond to Eu3+ ions, see the corresponding photograph in the right inset in Fig. 5(b), while those corresponding to Tb3+ ions practically disappear, confirming the efficient ET from Tb3+ to Eu3+ ions, as shown in the energy level diagrams of Fig. 4(b). The corresponding PLQY (ϕ), both for un-doped and for Eu3+-doped nGCs were recorded by an integrating sphere, giving rise to values of 59.3% and 54.4%, respectively, similar to those obtained in LaF3:Tb3+–Eu3+ co-doped sol–gel nGCs by N. Pawlik et al.41 and in Sr2GdF7:Tb3+-doped nGCs by L. M. Teng et al.42
Next, in order to study the local environment of the Eu3+ ions, their luminescence characteristics as a spectroscopic probe were considered. Thus, the asymmetry ratio R defined as the ratio between the 5D0 → 7F2 and 5D0 → 7F1 transitions43 (very sensitive and insensitive to the symmetry of the local environment of the Eu3+ ions, respectively), presents values of 1.93 and 1.74, when Eu3+ ions are directly excited at 393 or through Tb3+ ions at 351 nm, respectively. When compared to the corresponding value for Eu3+ ions in SiO2 glass (R = 3.66) (see the left inset in Fig. 5(b)), these values suggest that a significant fraction of Eu3+ ions have been incorporated into an environment with inversion symmetry. In addition, it is also observed that when exciting Eu3+ ions at 463 nm (7F0 → 5D2, hypersensitive transition to the local structure around Eu3+ ions and therefore prohibited in environments with inversion symmetry), the emissions are much less intense, seven times, and the corresponding R value is 2.24, suggesting the presence of these Eu3+ on the surface of NaTbF4 NCs or remnants in the glassy environment, see the left inset in Fig. 5(b).
Additionally, in order to further analyse the ET mechanisms from Tb3+ to Eu3+ ions, time-resolved luminescence measurements were carried out. Time-resolved emission spectra exciting Tb3+ ions at 351 nm with different delays up to 16 ms are shown in Fig. 5(c). For different delays, the emission lines are at the same position but present slightly different shapes, suggesting different luminescent sites in the nGCs for both Tb3+ and Eu3+ ions. It can be observed that quenching of Tb3+ emission (due to very efficient ET from Tb3+ to Eu3+ ions) is almost complete when the delay time is only 60 μs. The residual Tb3+ emission is probably due to Tb3+ ions residing on the surface of NCs or remaining in the glassy environment. On the other hand, when the delay is progressively increased, the asymmetry ratio and the sharpness of the 5D0 → 7F2 transition of Eu3+ ions are clearly modified (see inset in Fig. 5(c)), suggesting that for long delays, the contribution of Eu3+ ions hosting in the NaTbF4 nanocrystalline environments become more important.
To support this assumption, measurements of transient evolution of the luminescence corresponding to Tb3+ and Eu3+ ions, exciting 7F6 → 5D4 transition of Tb3+ ions, under 6 ns pulsed 483 nm excitation (OPO) were also carried out (see Fig. 5(d)). All decay curves are not perfectly exponential, which can be associated with different activator sites in the nGCs. Thus, by fitting with biexponential decay functions, the PL lifetimes for the 5D4 level of Tb3+ ions in undoped and Eu3+ doped nGCs were determined to be τ1 = 438 μs, τ2 = 2,9 ms and τ1 = 23 μs, τ2 = 2.2 ms, respectively. The reduction of both lifetimes would indicate that a very fast ET process from Tb3+ to Eu3+ in NaTbF4 NCs and another slower between remnant ions in the glassy environment is taking place in Eu3+ doped nGC. The corresponding transient curve for the 5D0 level of Eu3+ ions shows a buildup at short times, 18 μs rise time (see the inset in Fig. 5(d)), due to an energy migration process from Tb3+ to Eu3+ ions, followed by a biexponential decay. The PL decay lifetimes in this case were τ1 = 6.9 ms and τ2 = 2.7 ms, which correspond to Eu3+ ions in NaTbF4 NCs and those remaining in the surrounding glass, respectively. The energy transfer efficiency in both environments was calculated through the expression ηET = 1 − τs/τs0, where τs and τs0 correspond to Tb3+ decay lifetime in the presence and absence of activator (Eu3+) respectively. The values corresponding to nanocrystalline and glassy environments were 94.7% and 24.1%, respectively.
Taking into account these energy transfer efficiencies, the PLQY (ϕ) can be calculated through the well-known equation ϕ = ηET·ϕf−f where ϕf−f represents the Eu3+ 4f−4f emission quantum yield, estimated by the following equation44
 | (1) |
Once DS emissions have been studied in undoped and Eu3+-doped nGCs, we next study UC emissions of nGCs with compositions 95SiO2–5NaTb0.80Yb0.20F4 and 95SiO2–5NaTb0.90Yb0.10F4, exciting at 980 nm and 300 mW pump power (see Fig. 6). In both spectra, emission peaks associated with the 5D4 → 7FJ=6,5,4,3 transitions of Tb3+ ions are observed, being more intense for 20%Yb3+ doped nGC (×1.7), see the digital photograph in the down-side inset in Fig. 6. Moreover, three much lower intensity peaks associated with the 5D3 → 7FJ=6,5,4 transitions are also observed, whose intensities also increase when the Yb3+ concentration varies from 10 to 20% (×3). These enhanced intensities, both from 5D4 and 5D3 emissions, can be related with the increase of photons absorbed in the infrared range. Moreover, an emission spectrum exciting Tb3+ ions at 351 nm of nGC with 20% Yb3+ ions is also included in the top inset of Fig. 6, showing emissions coming from the 5D4 level with similar features.
 | ||
| Fig. 6 Up-conversion emission spectra of nGCs with compositions 95SiO2–5NaTb0.80Yb0.20F4 and 95SiO2–5NaTb0.90Yb0.10F4, exciting at 980 nm and 300 mW. Inset shows the emission spectrum of the nGC with 20%Yb3+, exciting at 351 nm for comparison purposes (top-side) and digital photograph, exciting at 980 nm, 300 mW (down-side). | ||
In order to analyse the nature of the UC processes in these nGCs, the number of required infrared photons to populate the different Tb3+ excited levels are studied by the UC intensity dependence as a function of pump power. It is known that the intensity (I) of the UC emissions is proportional to the nth power of the infrared exciting pump power (P), I ∝ Pn, where n is the number of infrared photons absorbed for each up-conversion photon emitted. Thus, from a log–log plot of UC emission versus the incident pump power, the n values can be obtained. Log–log plots of UC emission versus the incident pump power for 10% and 20% Yb3+-doped nGCs are shown in Fig. 7, and the corresponding n values are included in Table 1. For the 10% Yb3+-doped nGC, the existence of processes involving 3 and 2 photons, for 5D3 and 5D4 emitting levels, respectively, becomes clear. However, in the case of 20% Yb3+-doped nGC, although the emissions from the 5D3 level show an expected 3-photon dependence, the 5D4 level emissions present characteristics of mixing with 2- and 3-photon processes.48
 | ||
| Fig. 7 Log–log plot of up-conversion intensity versus pump power of (a) 95SiO2–5NaTb0.90Yb0.10F4, and (b) 95SiO2–5NaTb0.80Yb0.20F4 nGCs, under excitation at 980 nm. | ||
| λ emission (nm) | n (10%Yb3+) | n (20%Yb3+) | n (20%Yb3+–2%Eu3+) |
|---|---|---|---|
| 378 5D3 → 7F6 (Tb3+) | 2.39 | 2.97 | 2.69 |
| 414 5D3 → 7F5 (Tb3+) | 2.48 | 2.92 | 3.03 |
| 435 5D3 → 7F4 (Tb3+) | 2.44 | 2.76 | 2.75 |
| 486 5D4→ 7F6 (Tb3+) | 1.84 | 2.26 | 2.61 |
| 541 5D4 → 7F5 (Tb3+) | 1.81 | 2.21 | 2.39 |
| 583 5D4 → 7F4 (Tb3+) | 1.81 | 2.24 | — |
| 620 5D4 → 7F3 (Tb3+) | 1.76 | 2.19 | — |
| 591 5D0 → 7F1 (Eu3+) | — | — | 1.86 |
| 612 5D0 → 7F2 (Eu3+) | — | — | 1.89 |
| 651 5D0 → 7F3 (Eu3+) | — | — | 1.76 |
| 701 5D0 → 7F4 (Eu3+) | — | — | 1.87 |
In view of these results, the proposed ET mechanism is indicated in Fig. 8. Under NIR excitation at 980 nm, it is possible to populate the 5D4 level of Tb3+ ions through CET involving two Yb3+ ions that simultaneously transfer energy to a Tb3+ ion (2Yb3+:2F5/2+ Tb3+:7F6→2Yb3+:2F7/2 + Tb3+:5D4). Then, electrons in the 5D4 level can relax down to the lower 7FJ=6,5,4,3 levels and emit visible emissions at 483, 542, 588, and 620 nm, respectively. The rest of the UC emissions result from the following mechanism: After the excitation from the 5D4 level, a third absorption step can promote the Tb3+ ions to the 5D1 level or a neighboring level by absorption of a photon (ESA) or by ET (or both) of Yb3+ ions. Next, they can relax non-radiatively to the 5D3 level and subsequently give rise to the emissions of the lower levels 7FJ=6,5,4 at 378, 414 and 435 nm, respectively.
 | ||
| Fig. 8 Energy level diagrams of Yb3+, Tb3+ and Eu3+ ions and proposed energy transfer mechanisms. | ||
Alternatively, due to the high percentage of Tb3+ ions in NaTbF4 NCs, these ions at the 5D3 level can relax to the 5D4 level by multiphonon processes and by cross-relaxation mechanisms.38
Finally, in order to obtain UC Eu3+ red emissions, nGCs with composition 95SiO2–5NaTb0.78Eu0.02Yb0.20F4 were obtained and their luminescence properties were studied. Excitation and emission spectra detecting and exciting Tb3+ and Eu3+ ions, present similar luminescence characteristics to Eu3+-doped nGC previously studied also confirming the existence of the ET mechanism from Tb3+ to Eu3+ ions (not shown).39,40
Additionally, by excitation at 980 nm, it is also possible to obtain Eu3+ emissions through CUC processes.28Fig. 9(a) shows the corresponding UC emission spectra up to 300 mW pump power, where intense sharp emissions from the 5D0 level of Eu3+ ions above 575 nm are observed. It should be noted that an R value of 1.45 (obtained from 25 mW) shows that these emissions come from Eu3+ ions located in NaTbF4 nanocrystalline environments. Additionally, much weaker emissions from 5D4 and 5D3 levels of Tb3+ ions from of Tb3+ ions from 350 to 575 nm are also observed.
 | ||
| Fig. 9 (a) Up-conversion emission spectra of nGC with composition 95SiO2–5NaTb0.78Yb0.20Eu0.02F4, excited at 980 nm, at different pump powers up to 300 mW. Inset shows luminescence decay, exciting Yb3+ ions at 980 nm and detecting Eu3+ ions at 701 nm. (b) Corresponding dependence of up-conversion emissions intensity versus pump power, excited at 980 nm. Inset shows the digital photograph of those excited at 980 nm, 300 mW. | ||
The corresponding UCQY values for 20%Yb3+-doped and 20%Yb3+–2%Eu3+ co-doped nGCs were 8.53 × 10⁻³ and 10.95 × 10⁻³, respectively. These values are comparable to cubic Yb/Er-co-doped NaLuF4 nGC19 with UCQY around 60 × 10−3, despite the knowledge that cooperative UC processes are several orders of magnitude less efficient than the energy transfer up-conversion (ETU) process.
In order to analyze the nature of the UC processes, the number of infrared photons (n) required to populate different excited levels as a function of the pump power is also calculated from the log–log plot (see Fig. 9(b)). The corresponding results are shown in the right column of Table 1 being consistent with those obtained for the nGC with the composition 95SiO2–5NaTb0.80Yb0.20F4. Thus, emissions from 5D3 and 5D4 levels involve 3 and 2–3 photons, respectively (as previously discussed), while in the case of emissions from the 5D0 level of Eu3+ ions, they are clearly associated with 2-photon processes (see the energy level diagram in Fig. 8).
Based on these results, one can propose the same ET mechanism previously described for ET from Yb3+ to Tb3+ ions, including energy migration through Tb3+ ions to the Eu3+ ones. The longer rise time of Eu3+ ions (270 μs) under 980 nm excitation in this case would support this assumption (see the inset in Fig. 9(a)). Thus, after the cooperative process involving two photons, it is possible to transfer energy non-radiatively towards the 5D1 level of the Eu3+ ions. From there, after a non-radiative decay process to the 5D0 level, the UC emissions in the red range dominate the spectrum originated, see the digital photograph in Fig. 9(b). Finally, it is important to note that, despite the probable energy back transfer from Tb3+ and Eu3+ ions to Yb3+ ones, the UC lifetimes of Eu3+ ions remain long enough (τ1 = 6.1 and τ2 = 1.5 ms) for applications that require time-gated techniques.16
4 Conclusions
Undoped and RE3+-doped nGCs comprising NaTbF4 NCs were successfully obtained by adequate treatment of precursor sol–gel glasses. Using XRD patterns, TEM images and EDS spectra, we can confirm the precipitation of cubic NaTbF4 NCs, homogeneously dispersed in the silica matrix, with an average size of 20–25 nm, where Na, Tb and F are their main constituents. Additionally, by using Eu3+ as a spectroscopic ion probe, different luminescent environments were assigned.Intense green and red emissions, visible to the naked eye, coming from Tb3+ to Eu3+ ions, respectively, were observed by DS (from UV-blue excitation) and by CUC (from 980 nm excitation) mechanisms, and the corresponding quantum yields were measured. Time-resolved spectra and transient evolution of luminescence evidenced an efficient energy migration from Tb3+ to Eu3+ ions, and from Yb3+ to Eu3+ ions through Tb3+ ones, making it possible to obtain long lived UC Eu3+ red emissions, which is very useful for time-gated luminescence techniques. These results allow considering these nGCs as UV/NIR to VIS converter materials for potential use in solar cells, w-LEDs and in anti-counterfeiting applications.
Conflicts of interest
There are no conflicts to declare.Acknowledgements
This work has been financially supported by “Vicerrectorado de Investigación, Transferencia y Campus Santa Cruz y Sur”, University of La Laguna NACSOS-project (1189_2020), MAGEC-REEsearch project (ProID2017010078) of “Agencia Canaria de Investigación” (ACIISI) and by Gobierno de Canarias (Proyecto “Tierras raras”, Grant number SD-22/25). The authors would also like to thank the SEGAI-ULL for providing XRD, TEM and EDS measurement facilities.Notes and references
- T. T. Basiev, I. T. Basieva and M. E. Doroshenko, J. Lumin., 2013, 133, 233–243 CrossRef CAS.
- A. A. Lyapin, P. P. Fedorov, E. A. Garibin, A. V. Malov, V. V. Osiko, P. A. Ryabochkina and S. N. Ushakov, Opt. Mater., 2013, 35, 1859–1864 CrossRef CAS.
- X. Li, D. Chen, F. Huang, G. Chang, J. Zhao, X. Qiao, X. Xu, J. Du and M. Yin., Laser Photonics Rev., 2018, 12(7), 1800030–1800037 CrossRef.
- E. N. Afshar, Mod. Phys. Lett. B, 2015, 29, 1550118–1550126 CrossRef CAS.
- J. J. Velázquez, V. D. Rodríguez, A. C. Yanes, J. del-Castillo and J. Méndez-Ramos., Opt. Mater., 2012, 34, 1994–1997 CrossRef.
- J. J. Velázquez, V. D. Rodríguez, A. C. Yanes, J. del-Castillo and J. Méndez-Ramos., J. Appl. Physiol., 2010, 108, 113530–113535 CrossRef.
- A. C. Yanes and J. del-Castillo., J. Alloys Compd., 2016, 658, 170–176 CrossRef CAS.
- X. Li, C. Yang, L. Qiu, S. Wang, Y. Chen, M. Yin and D. Chen., Laser Photonics Rev., 2022, 16(1), 2100346–2100359 CrossRef CAS.
- V. Harish, D. Tewari, M. Gaur, A. Bihari Yadav, S. Swaroop, M. Bechelany and A. Barhoum., Nanomaterials, 2022, 12, 457 CrossRef CAS PubMed.
- G. Liang, H. Wang, H. Shi, H. Wang, M. Zhu, A. Jing, J. Li and G. Li., J. Nanobiotechnol., 2020, 18, 154–175 CrossRef PubMed.
- Y. Yang, L. Wang, B. Wan, Y. Gu and X. Li., Front. Biotechnol., 2019, 7, 320–323 CrossRef PubMed.
- S. Siddique and J. C. L. Chow, Nanomaterials, 2020, 10, 1700–1739 CrossRef CAS PubMed.
- S. Hao, G. Chen and C. Yang, Theranostics, 2013, 3, 331–345 CrossRef PubMed.
- X. Wang, Q. Liu, Y. Bu, C.-S. Liu, T. Liu and X. Yan., RSC Adv., 2015, 5, 86219–86236 RSC.
- W. Ren, G. C. Clarke, J. Zhou and D. Jin., Adv. Mater., 2020, 32, 1901430–1901444 CrossRef CAS PubMed.
- H. Suo, Q. Zhu, X. Zhang, B. Chen, J. Chen and F. Wang., Mater. Today Phys., 2021, 21, 100520–100529 CrossRef CAS.
- S. Torres-García, C. Hernández-Álvarez, M. Medina-Alayón, P. Acosta-Mora, A. C. Yanes, J. del-Castillo, A. Menéndez-Velázquez and J. Méndez-Ramos., Ceram. Int., 2022 DOI:10.1016/j.ceramint.2022.09.307.
- S. Wang, J. Zhu, Y. He, Z. Li, J. Lin, S. Liao, F. Huang, P. Huang, Y. Zheng, X. Li and D. Chen., Laser Photonics Rev., 2022, 16(8), 2200039–2200046 CrossRef CAS.
- S. Wang, J. Lin, X. Li, J. Chen, C. Yang, P. Huang, Y. Cheng and D. Chen., J. Mater. Chem. C, 2020, 8, 16151–16159 RSC.
- J. del-Castillo, J. Méndez-Ramos, P. Acosta-Mora and A. C. Yanes., J. Lumin., 2022, 241, 118490–118494 CrossRef CAS.
- T. Parangi and M. K. Mishra, Comments Inorg. Chem., 2019, 0, 1–37 Search PubMed.
- E. D. Zanotto, Am. Ceram. Soc. Bull., 2010, 89(8), 19–27 CAS.
- J. del-Castillo and A. C. Yanes., Phys. Chem. Chem. Phys., 2018, 20, 20910–20918 RSC.
- C. Wang, T. Zhou, J. Jiang, H. Geng, Z. Ning, X. Lai, J. Bi and D. Ga., ACS Appl. Mater. Interfaces, 2017, 9(31), 26184–26190 CrossRef CAS PubMed.
- B. Yu, B. Zheng, H. Xia, J. Wang, H. Song and B. Chen., Ceram. Interfaces, 2021, 47, 9668–9678 CrossRef CAS.
- A. C. Yanes, J. del-Castillo, D. Luis and J. Puentes., J. Lumin., 2016, 170, 789–794 CrossRef CAS.
- J. Méndez-Ramos, A. C. Yanes, A. Santana-Alonso and J. del-Castillo., Chem. Phys. Lett., 2013, 555, 196–201 CrossRef.
- T. Grzyb., RSC Adv., 2014, 4, 2590–2595 RSC.
- N. Rakov, S. C. Duarte and D. S. Maciel., J. Lumin., 2019, 214, 116561–116566 CrossRef CAS.
- Q. Han, Y. Zou, H. Wu, Y. Song, Y. Wang and X. Zhang., J. Lumin., 2020, 225, 117348–117355 CrossRef CAS.
- P. Du, W. Ran, W. Li, L. Luo and X. Huang., J. Mater. Chem. C, 2019, 7, 10802–10809 RSC.
- Y. Luo, R. Yang, X. Zhang, B. Hu, S. Hu, L. Zhou and J. Yan., CrystEngComm, 2015, 17, 7762–7771 RSC.
- Z. Chen, Z. Geng, D. Shao, Z. Zhou and Z. Wang., CrystEngComm, 2012, 14, 2251–2257 RSC.
- X. Li, X. Chen, S. Yuan, S. Liu, C. Wang and D. Chen., J. Mater. Chem. C, 2017, 5, 10201–10210 RSC.
- J. del-Castillo, A. C. Yanes, A. Santana-Alonso and J. Méndez-Ramos., Opt. Mater., 2014, 37, 511–515 CrossRef CAS.
- A. C. Yanes, P. Mirabal-Bello and J. del-Castillo., J. Alloys Compd., 2021, 856, 157183–157191 CrossRef CAS.
- X. Y. Jin, Z. Y. Wang, H. Y. Xu, M. C. Jia and Z. L. Fu. Mat., Today Chem., 2022, 24, 100771–100779 CAS.
- R. Reisfeld and C. K. Jorgensen, Handbook on the Physics and Chemistry of Rare Earths, North Holland, Amsterdam, 1987 Search PubMed.
- R. Wang, D. Zhou, J. Qiu, Y. Yang and C. Wang., J. Alloys Compd., 2015, 629, 310–314 CrossRef CAS.
- X. Zhang, L. Zhou, Q. Pang, J. Shi. and M. Gong., J. Phys. Chem. C, 2014, 118(14), 7591–7598 CrossRef CAS.
- N. Pawlik, B. Szpikowska-Sroka and W. A. Pisarski, Materials, 2020, 13, 2522–2539 CrossRef CAS PubMed.
- L. M. Teng, W. Zhang, W. P. Chen, J. K. Cao, X. Y. Sun and H. Guo., Ceram. Interfaces, 2020, 46, 10718–10722 CrossRef CAS.
- K. Binnenmans., Coord. Chem. Rev., 2015, 295, 1 CrossRef.
- G. Lesly Jiménez, M. J. Rosales-Hoz, B. Handke, M. A. Leyva, C. Vázquez-López, I. Padilla-Rosales, C. Falcony and D. Dorosz., J. Lumin., 2022, 248, 119007–119014 CrossRef.
- Z. Smara, Y. Cheroura, D. Boyer, A. Potdevin, A. Chafa, O. Ziane and R. Mahiou., Opt. Mater., 2020, 104, 109932–109942 CrossRef CAS.
- M. Toki, S. Miyashita, T. Takeuchi, S. Kanbe and A. Kochi., J. Non-Cryst. Solids, 1998, 100, 479–482 CrossRef.
- J. D. Mackenzie and J. Non-Cryst, Solids, 1982, 48, 1–10 CrossRef CAS.
- M. Xue, X. Zhu, X. Qiu, Y. Gu, W. Feng and F. Li., ACS Appl. Mater. Interfaces, 2016, 8(28), 17894–17901 CrossRef CAS PubMed.
| This journal is © The Royal Society of Chemistry 2023 |