DOI:
10.1039/D3TC00634D
(Paper)
J. Mater. Chem. C, 2023,
11, 5515-5523
Highly efficient broadband NIR phosphor Y2CaHfScAl3O12:Cr3+,Yb3+ with superior thermal stability for spectroscopy applications†
Received
20th February 2023
, Accepted 28th March 2023
First published on 6th April 2023
Abstract
The rising demand for spectroscopy applications in the fields of information encryption, non-invasive detection and component analysis has attracted extensive attention to achieve high power near-infrared (NIR) light sources. Near-infrared phosphor-converted light emitting diodes (NIR pc-LEDs) are regarded as ideal light sources to meet the current needs due to their advantages of high power, low cost, and portability. However, it remains a huge challenge to design a NIR phosphor with high emission efficiency, superior thermal stability, and broadband emission. Herein, a novel NIR phosphor, Y2CaHfScAl3O12:Cr3+ (YCHSA:Cr3+), is reported from a fundamental study of garnet type inorganic materials. YCHSA:Cr3+ displays an intense broadband NIR emission covering from 650 to 900 nm with a full width at half maximum (FWHM) of 110 nm and good thermal stability (I423K/303K = 76%). Furthermore, we reasonably utilized the energy transfer from the Cr3+ to Yb3+ ions and obtained the YCHSA:0.08Cr3+,0.03Yb3+ phosphor, and achieved performance improvement with a broader NIR emission band (FWHM = 327 nm) as well as better thermal stability (up to I423K/303K = 83%). The excellent performance of NIR pc-LED is crucial for spectroscopy applications. The optimal samples and 450 nm commercial blue chips are packaged into NIR pc-LEDs, and give a high output power of 63.6 mW at a drive current of 100 mA. Finally, the superior performance in information encryption and non-invasive detection is demonstrated.
Introduction
NIR light sources have been widely applied in various fields, such as information encryption, non-invasive detection, component analysis, night vision, and plant growth illumination.1,2 As the traditional NIR light sources, incandescent lamps are shelved due to their low energy conversion efficiency, large size, and short lifetime. AlGaAs LEDs are attractive NIR light sources due to their high efficiency and small size. However, the high cost and narrow NIR emission band (FWHM ≤ 50 nm) impose roadblocks in promoting their application.3,4 Recently, NIR pc-LEDs as a new generation of NIR light sources have drawn extensive attention. NIR pc-LEDs have many superior properties such as small size, broadband emission, high efficiency, and excellent thermal stability. The compactness facilitates the widespread use of NIR light sources. The broader NIR emission band ensures to expand the detection range, enabling the detection of components by using various responses of organic groups in the component analysis. The higher emission intensity in the long wavelength region (>1000 nm) contributes to greater biological tissue penetration in the field of non-invasive detection. The high efficiency not only saves energy but also reduces heat release, and the excellent thermal stability allows pc-LEDs to maintain good performance at operating temperatures.5,6 These advantages depend on the excellent performance of the phosphors, as they are the ones that absorb the narrowband blue light of the chip and efficiently convert it to the desired NIR light.7
Over the past few years, many efforts have been made in the research of various activator doped NIR phosphors, such as MgAl2O4:Mn2+,8 Ba3Lu(BO3)3:Eu2+,9 K3LuSi2O7:Eu2+,10 Y2Ti2O7:Bi3+,11 Ca3Y2Ge3O12:Cr3+,12 LiInSi2O6:Cr3+,13 and Y3In2Ga3O12:Cr3+.14 Unfortunately, the FWHM of all these NIR phosphor emission bands is less than 200 nm and the emission is weak at positions greater than 900 nm, limiting their application in many fields. To obtain super broadband NIR emission, researchers developed Cr3+-doped phosphors with two or more different octahedral lattice sites, for example, La3Ga5GeO14:Cr3+,15 La2MgZrO6:Cr3+,16 and Li2MgZrO4:Cr3+.17 However, the thermal stability of these phosphors is poor, due to the fast non-radiative relaxation of the loosely coordinated Cr3+. Another strategy is to introduce Yb3+ ions into Cr3+-doped NIR phosphors to obtain super broadband NIR phosphors by constructing the energy transfer from Cr3+ to Yb3+ ions, such as Ca4ZrGe3O12:Cr3+,Yb3+,18 LiScP2O7:Cr3+,Yb3+,19 and Lu2CaMg2Ge3O12:Cr3+,Yb3+.20 but they also suffer from low quantum yield (QY) and/or poor thermal stability. Therefore, it is of great theoretical and practical value to actively explore new efficient super broadband and thermally stable NIR phosphors.
In this paper, we report a garnet-type YCHSA:0.08Cr3+ phosphor with broadband NIR emission (FWHM = 110 nm) and good thermal stability (I423K/303K = 76%). Furthermore, introducing Yb3+ ions into YCHSA:0.08Cr3+ led to a broader emission band (FWHM = 327 nm) and better thermal stability (I423K/303K = 83%). The optimized NIR pc-LED is fabricated by combining YCHSA:0.08Cr3+,0.03Yb3+ with a commercial blue LED chip, giving a high output power of 63.6 mW at a drive current of 100 mA, and its applications in information encryption and non-invasive detection are demonstrated.
Experimental section
Material synthesis.
Typically, YCHSA:Cr3+,Yb3+ phosphors were synthesized by a high-temperature solid-state reaction method. According to the Y2CaHfScAl3O12:xCr3+,yYb3+ (x = 0.02 to 0.34, y = 0.01 to 0.16), the stoichiometric amounts of raw materials Y2O3 (99.999%), CaCO3 (99%), HfO2 (99.9%), Sc2O3 (99.99%), Al2O3 (99.99%), Cr2O3 (99%), and Yb2O3 (99.99%) were weighed and well-ground in agate for about 0.5 hours for full mixing. Then the mixture was transferred into covered corundum crucibles and pre-fired at 800 °C for 2 hours and finally sintered at 1550 °C for 4 hours under a reductive atmosphere (90% N2 + 10% H2). After being cooled down to room temperature, the final products were ground to obtain the target green powders.
Characterization
Powder X-ray diffraction (XRD) measurements were performed on a D8 Advance Power Diffractometer (Bruker Corporation, Germany) at 40 kV and 40 mA with Cu Kα radiation (λ = 1.5406 Å). The Rietveld refinement was performed using the FullProf program. Diffuse reflection spectra (DRS) of samples were recorded using a UV-vis-NIR spectrometer (Hitachi UH4150). The particle morphology and energy dispersive X-ray (EDS) mapping of samples were characterized by scanning electron microscopy (SEM, JSM-IT800) equipped with an EDS detector (Oxford Aztec Standard X-MaxN 100 mm2). Photoluminescence excitation spectra, photoluminescence spectra and temperature-dependent (303–483 K) spectra were recorded using an Everfine EX-1000 Exciting Spectra And Thermal Quenching Analyzer For Phosphors. For the PL QY measurement, the samples were put inside an optical integrating sphere coupled to an Edinburgh Instruments FLS 980 spectrometer. The low temperature photoluminescence excitation spectra and photoluminescence spectra were recorded using an Edinburgh Instruments FLS-1000 spectrometer (Edinburgh Instruments, Edinburgh, UK). The fluorescence decay curves were measured using a fluorescence spectrophotometer (Edinburgh FLS1000). The NIR pc-LED devices were fabricated by mixing phosphor and transparent silicone resin at 1![[thin space (1/6-em)]](https://www.rsc.org/images/entities/char_2009.gif) :
:![[thin space (1/6-em)]](https://www.rsc.org/images/entities/char_2009.gif) 1 and coating the 450 nm InGaN blue chips. The photoelectric properties of the pc-LEDs were measured using an integrating sphere spectroradiometer system (HASS-2000, 350–1650 nm, Everfine).
1 and coating the 450 nm InGaN blue chips. The photoelectric properties of the pc-LEDs were measured using an integrating sphere spectroradiometer system (HASS-2000, 350–1650 nm, Everfine).
Results and discussion
Phase identification and crystal structure analysis
Fig. 1a shows the representative XRD patterns of undoped YCHSA, YCHSA:0.03Cr3+, YCHSA:0.08Cr3+, and YCHSA:0.08Cr3+,0.03Yb3+ samples, and standard cards of Ca2GdZr2Al3O12 (COD-4338781). One can see that the XRD peaks of the samples match well with the diffraction peaks of the standard cards, indicating that we have successfully synthesized the samples. There are minor diffraction peaks from CaHfO3 (PDF#36-1473) impurities. Due to their very small amount, the effect of CaHfO3 on photoluminescent properties of YCHSA:Cr3+,Yb3+ can be ignored. Fig. 1b shows the crystal structure of YCHSA. It is composed of [YO8/CaO8] dodecahedra, [HfO6/ScO6] octahedra, and [AlO4] tetrahedra. Considering that Sc3+ and Cr3+ ions possess the same electrovalence and a similar radius, Cr3+ ions are more likely to replace Sc3+ ions in the octahedra (Sc3+ (r[CN=6] = 0.745 Å), Cr3+ (r[CN=6] = 0.615 Å)). To further understand the structure of YCHSA, we use the crystallographic data of Ca2GdZr2Al3O12 (COD-4338781) as the start model to refine the undoped YCHSA and YCHSA:0.08Cr3+,0.03Yb3+ samples, and the results are presented in Fig. S1 (ESI†) and Fig. 1c. The fitted parameters for the undoped YCHSA and YCHSA:0.08Cr3+,0.03Yb3+ samples were obtained as Rwp = 9.35%, Rp = 6.87% and Rwp = 9.68%, and Rp = 7.07%, respectively, which represent reliable refinement results. The detailed refined crystallographic and structure parameters are summarized in Tables S1 and S2 (ESI†). To further study the microstructure and elemental composition of YCHSA:Cr3+,Yb3+, scanning electron microscopy (SEM) images and energy-dispersive X-ray spectrometry (EDS) patterns were recorded and are presented in Fig. 1d. The SEM image shows particles with an irregular shape and a size distribution range of 1–10 μm. The EDS mapping of randomly selected YCHSA:Cr3+,Yb3+ particle reveals that Y, Ca, Hf, Sc, Al, O, Cr, and Yb elements are uniformly distributed throughout the YCHSA:Cr3+,Yb3+ sample. The diffuse reflection spectra (DRS) of the undoped YCHSA, YCHSA:0.08Cr3+, and YCHSA:0.08Cr3+,0.03Yb3+ samples were recorded and are shown in Fig. 2a. Compared with the DRS of undoped YCHSA, YCHSA:0.08Cr3+ and YCHSA:0.08Cr3+,0.03Yb3+ have two additional absorption bands distributed in the blue and red regions corresponding to the 4A2g–4T1g and 4A2g–4T2g transitions of the Cr3+ ions. The optical band gap of undoped YCHSA can be calculated by the following equations:21| |  | (1) |
| | | [hυF(R∞)]2 = A(hυ − Eg) | (3) |
where R refers to the diffuse reflectance, F(R) represents absorption, hυ denotes photon energy, and A and Eg are the absorption constant and band gap. On the basis of the above-mentioned formula, the band gap of undoped YCHSA was calculated to be 3.89 eV, as shown in Fig. 2b.
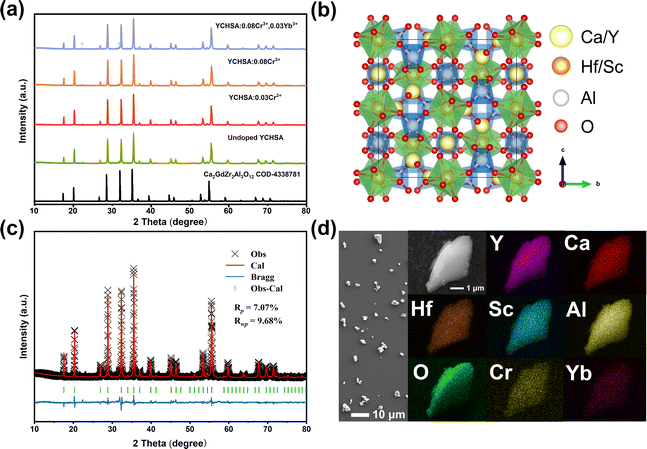 |
| | Fig. 1 (a) XRD patterns of the different doping concentrations of YCHSA:Cr3+,Yb3+, and the diffraction peak data of Ca2GdZr2Al3O12. (b) Crystal structure of YCHSA. (c) Rietveld refinement XRD pattern of YCHSA:0.08Cr3+,0.03Yb3+. (d) SEM image and EDS elemental mapping on a single particle of YCHSA:0.08Cr3+,0.03Yb3+. | |
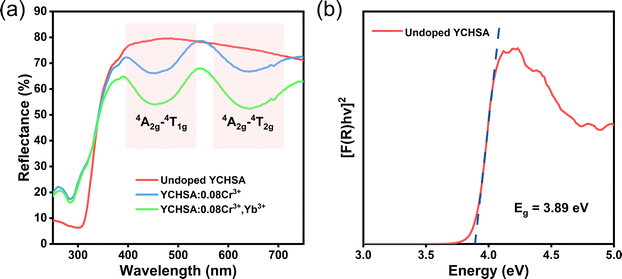 |
| | Fig. 2 (a) DRS of the undoped YCHSA, YCHSA:0.08Cr3+, and YCHSA:0.08Cr3+,0.03Yb3+ samples. (b) Tucker curves of the undoped YCHSA. | |
Luminescence properties
Fig. 3a shows the photoluminescence excitation (PLE) and photoluminescence (PL) spectra of the YCHSA:0.08Cr3+ phosphor. Two excitation bands at about 465 nm and 640 nm could be assigned to the 4A2g → 4T1g and 4A2g → 4T2g transitions of the Cr3+ ions. Under the excitation of 450 nm light, the PL spectrum shows a broadband NIR emission peaking at 757 nm with a FWHM of 110 nm, which corresponds to the 4T2g → 4A2g transition of the Cr3+ ions. According to Adachi's study, the local crystal-field parameters Dq, and B can be obtained by using the following formulas:22| |  | (4) |
| |  | (5) |
| |  | (6) |
where Dq represents the crystal field intensity, B is the Racah parameter. The exact E(2Eg)ZPL energy position can be determined using the clear spike in the PLE spectrum at 6 K in Fig. 3b to be 1.79 eV. According to Adachi's previous study, E(4T2g)ZPL is located near the onset of the PLE spectrum in Fig. 3b, where we take it as 1.73 eV. From eqn (4)–(6), Dq/B and E(4T1g)ZPL can be calculated as 2.07 and 2.52 eV, respectively. According to the crystal field theory, Cr3+ ions reside in a weak crystal field with broadband NIR emission (corresponds to 4T2g → 4A2g transition). The values of E(4T1g)ZPL/B, E(4T2g)ZPL/B, and E(2Eg)ZPL/B are further calculated and represented by colored dots displayed in Fig. 3c. The symbol dots all show excellent agreement with the Tanabe–Sugano diagram curves, which represents reliable results.
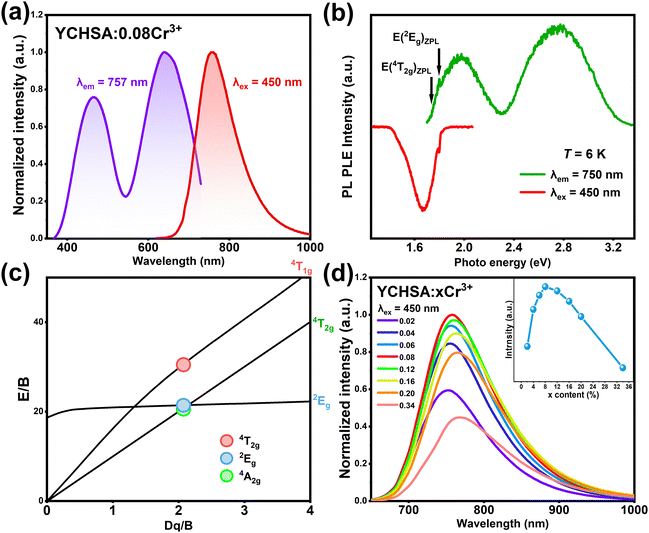 |
| | Fig. 3 (a) PL and PLE spectra of YCHSA:0.08Cr3+ at room temperature. (b) PL and PLE spectra of YCHSA:0.08Cr3+ when T = 6 K. (c) Tanabe–Sugano energy-level diagram for a 3d3 system in an octahedral crystal field. (d) Concentration-dependent emission spectra of YCHSA:xCr3+ (x = 0.02 to 0.34) phosphors. The upper inset shows the integrated emission intensity under different Cr3+ doping concentrations. | |
Fig. 3d presents the PL spectra of YCHSA:xCr3+ (x = 0.02 to 0.34), with a maximum emission intensity of Cr3+ ions for x = 0.08. On further increasing the doping amount of Cr3+ ions, the emission intensity decreases due to the effect of concentration quenching. The critical energy transfer distance (Rc) can be calculated to understand the mechanism of the concentration quenching in YCHSA:Cr3+ by the following formula:23
| |  | (7) |
where
N is the number of center cations in a unit cell,
V represents the cell volume, and
xc stands for the critical concentration. In YCHSA:Cr
3+,
N = 8,
V = 1902.11 Å
3 and
xc = 0.08. The calculated result of
Rc is 17.84 Å. Therefore, the energy transfer mechanism among Cr
3+ ions is governed by electric multipolar interactions since the exchange coupling takes place generally in a forbidden transition (the
Rc is typically < 5 Å). According to the report of Van Uitert, the PL intensity per activator concentration can be calculated by the following equation:
30| |  | (8) |
where
I represents the intensity of emission,
x is the concentration of Cr
3+ ions, and
θ and
A are constants under the same excitation. On the basis of the Dexter theory, the value of
θ = 6, 8, and 10 correspond to the dipole–dipole (d–d), dipole–quadrupole (d–q), and quadrupole–quadrupole (q–q) interaction, respectively. Fig. S2 (ESI
†) shows the dependence of log
![[thin space (1/6-em)]](https://www.rsc.org/images/entities/char_2009.gif) I
I/
x and log
![[thin space (1/6-em)]](https://www.rsc.org/images/entities/char_2009.gif) x
x; the slope (−
θ/3) of the line is calculated to be −1.37, therefore the
θ is 4.11 close to 6, indicating that the concentration quenching mechanism of Cr
3+ ions in YCHSA is attributed to dipole–dipole (d–d) interaction. Fig. S3 (ESI
†) shows a slight broadening of the NIR emission band and a red shift of the emission peak position as the concentration of Cr
3+ ions increases. The former is due to the enhanced lattice distortion as the content of Cr
3+ increases, leading to intensifying the splitting of the Cr
3+ energy levels. The latter is attributed to the increased probability of the energy transfer from Cr
3+ ions with higher
4T
2g energy levels to Cr
3+ ions with lower
4T
2g energy levels by increasing the Cr
3+-concentration.
The PLE and PL spectra of YCHSA:0.08Cr3+ and YCHSA:0.08Cr3+,0.03Yb3+ are shown in Fig. 4a and b, respectively. It can be found that the PLE spectrum for monitoring the Yb3+ emission at 1032 nm is similar to the PLE spectrum for monitoring the Cr3+ emission at 757 nm. Moreover, under 450 nm excitation, the PL spectrum of YCHSA:0.08Cr3+,0.03Yb3+ contains not only the emission band of Cr3+ ions but also the emission lines of Yb3+ ions (corresponding to the 2F5/2 → 2F7/2 transition). These two features illustrate the occurrence of energy transfer from Cr3+ to Yb3+ ions. The PL spectra of YCHSA:0.08Cr3+,yYb3+ (y = 0.01 to 0.16) were recorded and are shown in Fig. 4c. As the concentration of Yb3+ ions increases, one can see the constantly enhanced emission intensity of Yb3+ ions and the emission intensity of the Cr3+ ions continuously decreases. Fig. 4d shows the FWHM and integrated emission intensity of YCHSA:Cr3+,yYb3+. When the concentration of Yb3+ ions increases, FWHM first increases to the maximum value (327 nm) for y = 0.03 and then decreases. Compared with some reported broadband NIR emission phosphors (Table 1), YCHSA:0.08Cr3+,0.03Yb3+ has a relatively broad emission band. The integrated emission intensity of the codoped samples decreases monotonically with an increase in the concentration of Yb3+ ions. As illustrated in Fig. S4 (ESI†), the internal quantum efficiency (IQE) of YCHSA:0.08Cr3+ and YCHSA:0.08Cr3+,0.03Yb3+ samples is measured and found to be 85.8% and 67.8%, respectively. A partial energy level diagram of electron transition in YCHSA:Cr3+,Yb3+ is given in Fig. 4e to understand the mechanism of energy transfer from the Cr3+ to Yb3+ ions. Under 450 nm excitation, the electrons of Cr3+ ions jump from the ground state 4A2g to the excited state and relax to the lowest excited state 4T2g. Next, part of the electrons return to the ground state 4A2g with NIR emission covering from 650 to 900 nm. On part of the energy being transferred to the Yb3+ ions, electrons are excited from the 2F7/2 to 2F5/2 of the Yb3+ ions, and finally, return to 2F7/2 with the emission around 1000 nm in the long wavelength region.
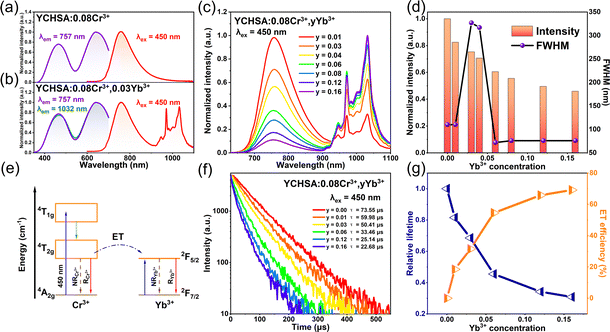 |
| | Fig. 4 (a) PLE and PL spectra of YCHSA:0.08Cr3+ and YCHSA:0.08Cr3+,0.03Yb3+. (b) Concentration-dependent PL spectra of YCHSA:0.08Cr3+,yYb3+ (y = 0.01 to 0.16). (c) Emission integrated intensity and FWHM of YCHSA:0.08Cr3+,yYb3+. (d) Partial energy level diagram for the energy transfer process of YCHSA:Cr3+,Yb3+. (e) PL decay curves of the YCHSA:0.08Cr3+,yYb3+ samples. (f) Relative PL lifetime of Cr3+ ions and (g) energy transfer efficiency in YCHSA:0.08Cr3+,yYb3+ samples. | |
Table 1 PL performance of some broadband NIR emission phosphors as well as photoelectric properties of the fabricated NIR pc-LEDs devices
| Phosphor |
FWHM (nm) |
I
423K/303K (%) |
Photoelectric conversion efficiency (%) |
Output power (mW) |
Ref. |
| Y2CaHfScAl3O12:0.08Cr3+,0.03Yb3+ |
327 |
83 |
29.7 |
63.6 mW@100 mA |
This work |
| Lu2CaMg2Si3O12:Cr3+ |
125 |
70 |
14.8 |
59.5 mW@100 mA |
24
|
| Ca2LaHf2Al3O12:Cr3+, Yb3+ |
300 |
— |
— |
33.24 mW@200 mA |
25
|
| Gd3Sc1.5Al0.5Ga3O12:Cr3+,Yb3+ |
— |
97 |
24 |
50 mW@100 mA |
26
|
| La2MgHfO6:Cr3+,Yb3+ |
333 |
81.6 |
3.7 |
— |
27
|
| LiInSi2O6:Cr3+ |
143 |
77 |
17.2 |
51.6 mW@100 mA |
13
|
| Ca2LuHf2Al3O12:Cr3+ |
— |
— |
21.28 |
46.09 mW@100 mA |
28
|
| CaLu2Mg2Si3O12:Cr3+ |
128 |
82.3 |
11.6 |
34.75 mW@100 mA |
29
|
Fig. 4f presents the decay curves of YCHSA:0.08Cr3+,yYb3+ under 450 nm excitation and monitoring at 757 nm. The PL lifetime of Cr3+ ions at various values of y is calculated, and the detailed results are listed in Table S3 (ESI†). As the concentration of Yb3+ ions increases, the PL lifetime of Cr3+ ions decreases monotonically from 73.55 to 22.68 μs. The energy transfer efficiency from the Cr3+ to Yb3+ ions can be calculated by the following formula:31
| |  | (9) |
where
τ0 and
τ are the Cr
3+ PL lifetime in the absence and the presence of Yb
3+, respectively. As shown in
Fig. 4g and Table S4 (ESI
†), the energy transfer efficiency increases continuously as the concentration of the Yb
3+ ions increases and reaches 69.16% at
y = 0.16, which is ascribed to the increasing probability of the energy transfer from the Cr
3+ ions to the neighboring Yb
3+ ions, indicating the enhanced rapidly energy transfer with an increase in the concentration of Yb
3+ ions.
Photoluminescence thermal stability
Photoluminescence thermal stability is a key characteristic for evaluating phosphors, as the operating temperature of LED devices is usually around 400 K. Fig. 5a, b and Fig. S5, S6 (ESI†) show the temperature-dependent PL spectra of YCHSA:0.08Cr3+,yYb3+ (y = 0, 0.03, 0.09 and 0.22) varying from 303 to 483 K, respectively. Fig. 5c shows the temperature dependences of Cr3+, Yb3+, and the total emission intensity. Under the excitation of 450 nm, the Cr3+ ions show similar thermal quenching behaviour with the increasing temperature, and the Cr3+ ions emission intensity at 423 K is ∼76% of that at 303 K. However, the emissions of Yb3+ ions are enhanced with increasing temperature in the range of 303–423 K. Thus, the introduction of Yb3+ ions into YCHSA:0.08Cr3+ considerably improves the thermal stability of the YCHSA:0.08Cr3+,yYb3+. The total emission intensity of YCHSA:0.08Cr3+,yYb3+ (y = 0, 0.03, 0.09 and 0.22) increased from 76% for y = 0 to 96% for y = 0.22 at 423 K. YCHSA:0.08Cr3+,0.03Yb3+ retained 83% of the initial emission intensity when the temperature reached 423 K, indicating YCHSA:0.08Cr3+,0.03Yb3+ has better stability than most of the reported NIR phosphors (Table 1). The enhancement of thermal stability can be attributed to the results of rapid energy transfer between Cr3+–Yb3+ ions pairs against thermal de-activation in Cr3+ ion emitting states.32
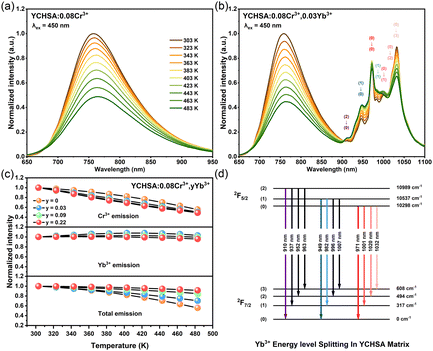 |
| | Fig. 5 Temperature-dependent normalized emission spectra of YCHSA:0.08Cr3+ (a) and YCHSA:0.08Cr3+,0.03Yb3+ (b), normalized integrated emission intensities of Cr3+, Yb3+ ions and total emission in YCHSA:0.08Cr3+,yYb3+ (y = 0, 0.03, 0.09 and 0.22) with increasing temperature (c) and the energy level of the Yb3+ ions in the YCHSA matrix (d). | |
It can be seen from Fig. 5b that the Yb3+-emission lines (located within 900–1100 nm) show different changes with the increase of temperature. The emission lines at 1032 and 1020 nm decrease rapidly, while the emission line at 949 nm is continuously enhanced. This phenomenon can be well explained by the Yb3+ ion energy level splitting. Due to the effect of the crystal field and the symmetry of the surrounding environment, the 2F5/2 energy levels of the Yb3+ ions split into three Stark energy levels and the 2F7/2 energy levels of Yb3+ ions split into four Stark energy levels in the YCHSA matrix as shown in Fig. 5d. The colored arrows in Fig. 5b correspond to the emission peaks marked with the same colors that can be directly identified in Fig. 5b. The black arrows correspond to emission peaks that cannot be directly identified in the spectrum, which are calculated from the determined energy levels. The emission lines at 910 nm, 937 nm, 952 nm, and 963 nm originate from the Stark level (2) of 2F5/2 to the Stark levels of 2F7/2 transition, The 949 nm, 982 nm, 996 nm, and 1007 nm emission lines are derived from the Stark level (1) of 2F5/2 to the Stark levels of 2F7/2 transition, The emission lines at 971 nm, 1001 nm, 1020 nm, and 1032 nm come from the Stark level (0) of 2F5/2 to the Stark levels of 2F7/2 transition. As the temperature increases, more electrons are thermally distributed to the higher Stark level of 2F5/2, so the emission lines originating from the Stark levels (1) and (2) are enhanced and the emission lines coming from the lowest Stark level (0) are weakened.
Fabrication of NIR pc-LEDs
Given the superior photoluminescence properties of the YCHSA:Cr3+,Yb3+ phosphors, NIR pc-LEDs are fabricated by coating the samples (YCHSA:0.08Cr3+,0.03Yb3+) on commercial InGaN chips (450 nm). Fig. 6a shows the luminescence spectra of the NIR pc-LED device obtained at different drive currents ranging from 10 to 300 mA. With an increase in the current, the spectral profile of the as-fabricated pc-LEDs has no changes except for the continuous intensity increase. The inset pictures of Fig. 6a are taken by a visible camera when the fabricated NIR pc-LED is off and on, respectively. From Fig. 6b the total output power and NIR output power gradually increase and reach 63.6 mW and 55.8 mW at 100 mA, while the total photoelectric conversion efficiency and NIR photoelectric conversion efficiency decrease gradually from 29.7% to 21.2% and 26.1% to 18.6% due to the efficiency of the blue LED chip decreasing. Detailed test information is listed in Table S5 (ESI†). The fabricated NIR pc-LEDs show excellent photoelectric properties compared with that of the previously reported broadband NIR emission phosphors in Table 1.
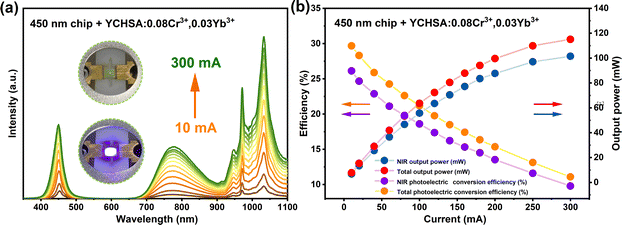 |
| | Fig. 6 (a) Luminescence spectra of the NIR pc-LED fabricated using YCHSA:0.08Cr3+,0.03Yb3+ under different drive currents. The inset pictures show that the fabricated pc-LED is off and on. (b) Output power and photoelectric conversion efficiency under various drive currents. | |
NIR pc-LEDs for applications
Since different inks have different absorption in NIR light, we exploited this property to explore the application of fabricated NIR pc-LEDs in information encryption. As shown in Fig. 7a, we first use carbon black ink to print important information on an A4 paper. Then we use a black water pen to draw black squares to obscure the important information. Under natural light, we can only see a black square. But when we light up the NIR pc-LED fabricated with YCHSA:0.08Cr3+,0.03Yb3+ and take pictures with a NIR camera, important information appears. We also explored the application of fabricated NIR pc-LEDs in non-invasive detection. As shown in Fig. 7b, it is hard to locate veins in the palm through a visible light camera under natural light, while it is easy to obtain a clear distribution of veins in the palm when we place the palm between the NIR pc-LED and the NIR camera and take a photo. These results reveal that YCHSA:Cr3+,Yb3+ have great potential for information encryption and non-invasive detection applications.
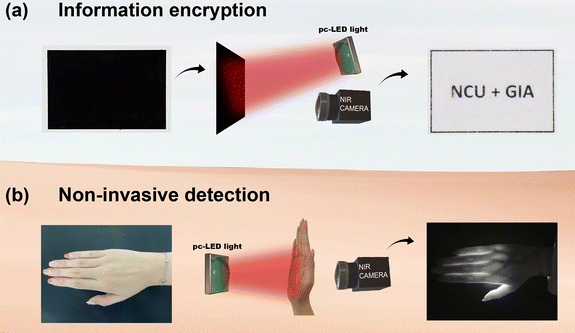 |
| | Fig. 7 Applications in information encryption (a) and non-invasive detection (b). | |
Conclusions
In summary, a series of efficient super broadband and thermally stable NIR phosphors have been developed by exploiting the YCHSA garnet as the host for Cr3+ and Yb3+ ions. Under 450 nm excitation, the YCHSA:0.08Cr3+ phosphors show a broad NIR emission peaking at 757 nm with a FWHM of 110 nm and good thermal stability (I423K/303K = 76%). On further introduction of Yb3+ ions, the YCHSA:0.08Cr3+,0.03Yb3+ has an emission band with a FWHM of 327 nm covering 700–1100 nm and enhanced thermal stability (I423K/303K = 83%). The high-performance NIR pc-LED device fabricated using the YCHSA:0.08Cr3+,0.03Yb3+ phosphor a and commercial blue chip produces 63.6 mW output power at 100 mA input current and its applications in information encryption and non-invasive detection are demonstrated. These results suggest that YCHSA:Cr3+,Yb3+ phosphors have great potential for spectroscopy applications.
Author contributions
Data curation: Pengcheng Luo; formal analysis: Dashuai Sun and Zeyu Lyu; investigation: Zheng Lu, Zhijun Li, Zhihang Yue, and Chengliang Lyu; methodology: Sida Shen; writing – original draft: Pengcheng Luo; writing – review & editing: Dashuai Sun, and Hongpeng You. All authors have read and agreed to the published version of the manuscript.
Conflicts of interest
The authors declare no conflicts of interest.
Acknowledgements
This work is financially supported by the Key Research Program of the Chinese Academy of Sciences (Grant No. ZDRW-CN-2021-3-3), the National Natural Science Foundation of China (Grant No. 52072363), and the Research Projects of Ganjiang Innovation Academy, Chinese Academy of Sciences (E255C001).
Notes and references
- E. T. Basore, W. Xiao, X. Liu, J. Wu and J. Qiu, Broadband Near-Infrared Garnet Phosphors with Near-Unity Internal Quantum Efficiency, Adv. Opt. Mater., 2020, 8(12), 2000296 CrossRef CAS.
- Z. Zhou, N. Zhang, J. Chen, X. Zhou, M. S. Molokeev and C. Guo, The Vis-NIR multicolor emitting phosphor Ba4Gd3Na3(PO4)6F2: Eu2+, Pr3+ for LED towards plant growth, J. Ind. Eng. Chem., 2018, 65, 411–417 CrossRef CAS.
- D. Huang, H. Zhu, Z. Deng, H. Yang, J. Hu, S. Liang, D. Chen, E. Ma and W. Guo, A highly efficient and thermally stable broadband Cr3+-activated double borate phosphor for near-infrared light-emitting diodes, J. Mater. Chem. C, 2021, 9(1), 164–172 RSC.
- V. Rajendran, M.-H. Fang, G. N. D. Guzman, T. Lesniewski, S. Mahlik, M. Grinberg, G. Leniec, S. M. Kaczmarek, Y.-S. Lin, K.-M. Lu, C.-M. Lin, H. Chang, S.-F. Hu and R.-S. Liu, Super Broadband Near-Infrared Phosphors with High Radiant Flux as Future Light Sources for Spectroscopy Applications, ACS Energy Lett., 2018, 3(11), 2679–2684 CrossRef CAS.
- D. Hayashi, A. M. van Dongen, J. Boerekamp, S. Spoor, G. Lucassen and J. Schleipen, A broadband LED source in visible to short-wave-infrared wavelengths for spectral tumor diagnostics, Appl. Phys. Lett., 2017, 110(23), 233701 CrossRef.
- D. Wen, H. Liu, Y. Guo, Q. Zeng, M. Wu and R. S. Liu, Disorder-Order Conversion-Induced Enhancement of Thermal Stability of Pyroxene Near-Infrared Phosphors for Light-Emitting Diodes, Angew. Chem., Int. Ed., 2022, 61(28), e202204411 CrossRef CAS PubMed.
- Z. Wu, X. Han, Y. Zhou, K. Xing, S. Cao, L. Chen, R. Zeng, J. Zhao and B. Zou, Efficient broadband near-infrared luminescence of Cr3+ doped fluoride K2NaInF6 and its NIR-LED application toward veins imaging, Chem. Eng. J., 2022, 427, 131740 CrossRef CAS.
- E. Song, X. Jiang, Y. Zhou, Z. Lin, S. Ye, Z. Xia and Q. Zhang, Heavy Mn2+ Doped MgAl2O4 Phosphor for High-Efficient Near-Infrared Light-Emitting Diode and the Night-Vision Application, Adv. Opt. Mater., 2019, 7(24), 1901105 CrossRef CAS.
- Z. Tang, F. Du, H. Liu, Z. Leng, X. Sun, H. Xie, M. Que and Y. Wang, Eu2+-Doped Layered Double Borate Phosphor with Ultrawide Near-Infrared Spectral Distribution in Response to Ultraviolet–Blue Light Excitation, Adv. Opt. Mater., 2022, 10(5), 2102204 CrossRef CAS.
- J. Qiao, G. Zhou, Y. Zhou, Q. Zhang and Z. Xia, Divalent europium-doped near-infrared-emitting phosphor for light-emitting diodes, Nat. Commun., 2019, 10(1), 5267, DOI:10.1038/s41467-019-13293-0.
- X. Wang, F. Jahanbazi, J. Wei, C. U. Segre, W. Chen and Y. Mao, Charge Transfer-Triggered Bi3+ Near-Infrared Emission in Y2Ti2O7 for Dual-Mode Temperature Sensing, ACS Appl. Mater. Interfaces, 2022, 14(32), 36834–36844 CrossRef CAS PubMed.
- N. Mao, S. Liu, Z. Song, Y. Yu and Q. Liu, A broadband near-infrared phosphor Ca3Y2Ge3O12:Cr3+ with garnet structure, J. Alloys Compd., 2021, 863, 158699 CrossRef CAS.
- X. Xu, Q. Shao, L. Yao, Y. Dong and J. Jiang, Highly efficient and thermally stable Cr3+-activated silicate phosphors for broadband near-infrared LED applications, Chem. Eng. J., 2020, 383, 123108 CrossRef CAS.
- C. Li and J. Zhong, Highly Efficient Broadband Near-Infrared Luminescence with Zero-Thermal-Quenching in Garnet Y3In2Ga3O12:Cr3+ Phosphors, Chem. Mater., 2022, 34(18), 8418–8426 CrossRef CAS.
- G. N. A. Guzman, V. Rajendran, Z. Bao, M. H. Fang, W. K. Pang, S. Mahlik, T. Lesniewski, M. Grinberg, M. S. Molokeev, G. Leniec, S. M. Kaczmarek, J. Ueda, K. M. Lu, S. F. Hu, H. Chang and R. S. Liu, Multi-Site Cation Control of Ultra-Broadband Near-Infrared Phosphors for Application in Light-Emitting Diodes, Inorg. Chem., 2020, 59(20), 15101–15110 CrossRef CAS PubMed.
- H. Zeng, T. Zhou, L. Wang and R.-J. Xie, Two-Site Occupation for Exploring Ultra-Broadband Near-Infrared Phosphor-Double-Perovskite La2MgZrO6:Cr3, Chem. Mater., 2019, 31(14), 5245–5253 CrossRef CAS.
- X. Zhou, J. Xiang, J. Zheng, X. Zhao, H. Suo and C. Guo, Ab initio two-sites occupancy and broadband near-infrared emission of Cr3+ in Li2MgZrO4, Mater. Chem. Front., 2021, 5(11), 4334–4342 RSC.
- J. Xiang, J. Zheng, X. Zhao, X. Zhou, C. Chen, M. Jin and C. Guo, Synthesis of broadband NIR garnet phosphor Ca4ZrGe3O12: Cr3+, Yb3+ for NIR pc-LED applications, Mater. Chem. Front., 2022, 6(4), 440–449 RSC.
- L. Yao, Q. Shao, S. Han, C. Liang, J. He and J. Jiang, Enhancing Near-Infrared Photoluminescence Intensity and Spectral Properties in Yb3+ Codoped LiScP2O7:Cr3+, Chem. Mater., 2020, 32(6), 2430–2439 CrossRef CAS.
- M. U. Dumesso, W. Xiao, G. Zheng, E. T. Basore, M. Tang, X. Liu and J. Qiu, Efficient, Stable, and Ultra-Broadband Near-Infrared Garnet Phosphors for Miniaturized Optical Applications, Adv. Opt. Mater., 2022, 10(16), 2200676 CrossRef CAS.
- Y. Wang, Z. Wang, G. Wei, Y. Yang, S. He, J. Li, Y. Shi, R. Li, J. Zhang and P. Li, Ultra-Broadband and high efficiency Near-Infrared Gd3ZnGa5-2GeO12:Cr3+ (x = 0–2.0) garnet phosphors via crystal field engineering, Chem. Eng. J., 2022, 437(1), 135346 CrossRef CAS.
- S. Adachi, Photoluminescence Spectroscopy and Crystal-Field Parameters of Cr3+ Ion in Red and Deep Red-Emitting Phosphors, ECS J. Solid State Sci. Technol., 2019, 8(12), R164–R168 CrossRef CAS.
- Z. Lu, D. Sun, Z. Lyu, S. Shen, L. Wang, J. Wang, H. Zhao and H. You, Novel efficient SrMgY3(SiO4)3F:Ce3+,Tb3+ phosphor with tunable color and thermal stability through energy transfer, J. Am. Ceram. Soc., 2022, 106(2), 1182–1193 CrossRef.
- W. Nie, L. Yao, G. Chen, S. Wu, Z. Liao, L. Han and X. Ye, A novel Cr3+-doped Lu2CaMg2Si3O12 garnet phosphor with broadband emission for near-infrared applications, Dalton Trans., 2021, 50(24), 8446–8456 RSC.
- D. Huang, Q. Ouyang, H. Xiao, B. Wang, H. Lian, Q. Zeng and J. Lin, Cr,Yb-codoped Ca2LaHf2Al3O12 garnet phosphor: electronic structure, broadband NIR emission and energy transfer properties, Dalton Trans., 2021, 50(3), 908–916 RSC.
- E. T. Basore, H. Wu, W. Xiao, G. Zheng, X. Liu and J. Qiu, High-Power Broadband NIR LEDs Enabled by Highly Efficient Blue-to-NIR Conversion, Adv. Opt. Mater., 2021, 9(7), 2001660 CrossRef CAS.
- H. Suo, Y. Wang, X. Zhao, X. Zhang, L. Li, K. Guan, W. Ding, P. Li, Z. Wang and F. Wang, Rapid Nondestructive Detection Enabled by an Ultra-Broadband NIR pc-LED, Laser Photonics Rev., 2022, 16(7), 2200012 CrossRef CAS.
- L. Zhang, D. Wang, Z. Hao, X. Zhang, Gh Pan, H. Wu and J. Zhang, Cr3+-Doped Broadband NIR Garnet Phosphor with Enhanced Luminescence and its Application in NIR Spectroscopy, Adv. Opt. Mater., 2019, 7(12), 1900185 CrossRef.
- R. Li, Y. Liu, C. Yuan, G. Leniec, L. Miao, P. Sun, Z. Liu, Z. Luo, R. Dong and J. Jiang, Thermally Stable CaLu2Mg2Si3O12:Cr3+ Phosphors for NIR LEDs, Adv. Opt. Mater., 2021, 9(16), 2100388 CrossRef CAS.
- C. Zhong, L. Zhang, Y. Xu, X. Wu, S. Yin, X. Zhang and H. You, Novel broadband near-infrared emitting phosphor LiGe2(PO4)3:Cr3+ with tuning and enhancement of NIR emission by codoping Sb5+, J. Alloys Compd., 2022, 903, 163945 CrossRef CAS.
- G. Liu, T. Hu, M. S. Molokeev and Z. Xia, Li/Na substitution and Yb3+ co-doping enabling tunable near-infrared emission in LiIn2SbO6:Cr3+ phosphors for light-emitting diodes, iScience, 2021, 24(4), 102250 CrossRef CAS PubMed.
- S. He, L. Zhang, H. Wu, H. Wu, G. Pan, Z. Hao, X. Zhang, L. Zhang, H. Zhang and J. Zhang, Efficient Super Broadband NIR Ca2LuZr2Al3O12:Cr3+,Yb3+ Garnet Phosphor for pc-LED Light Source toward NIR Spectroscopy Applications, Adv. Opt. Mater., 2020, 8(6), 1901684 CrossRef CAS.
|
| This journal is © The Royal Society of Chemistry 2023 |
Click here to see how this site uses Cookies. View our privacy policy here.  Open Access Article
 *abc
*abc
![[thin space (1/6-em)]](https://www.rsc.org/images/entities/char_2009.gif) :
:![[thin space (1/6-em)]](https://www.rsc.org/images/entities/char_2009.gif) 1 and coating the 450 nm InGaN blue chips. The photoelectric properties of the pc-LEDs were measured using an integrating sphere spectroradiometer system (HASS-2000, 350–1650 nm, Everfine).
1 and coating the 450 nm InGaN blue chips. The photoelectric properties of the pc-LEDs were measured using an integrating sphere spectroradiometer system (HASS-2000, 350–1650 nm, Everfine).


![[thin space (1/6-em)]](https://www.rsc.org/images/entities/char_2009.gif) I/x and log
I/x and log![[thin space (1/6-em)]](https://www.rsc.org/images/entities/char_2009.gif) x; the slope (−θ/3) of the line is calculated to be −1.37, therefore the θ is 4.11 close to 6, indicating that the concentration quenching mechanism of Cr3+ ions in YCHSA is attributed to dipole–dipole (d–d) interaction. Fig. S3 (ESI†) shows a slight broadening of the NIR emission band and a red shift of the emission peak position as the concentration of Cr3+ ions increases. The former is due to the enhanced lattice distortion as the content of Cr3+ increases, leading to intensifying the splitting of the Cr3+ energy levels. The latter is attributed to the increased probability of the energy transfer from Cr3+ ions with higher 4T2g energy levels to Cr3+ ions with lower 4T2g energy levels by increasing the Cr3+-concentration.
x; the slope (−θ/3) of the line is calculated to be −1.37, therefore the θ is 4.11 close to 6, indicating that the concentration quenching mechanism of Cr3+ ions in YCHSA is attributed to dipole–dipole (d–d) interaction. Fig. S3 (ESI†) shows a slight broadening of the NIR emission band and a red shift of the emission peak position as the concentration of Cr3+ ions increases. The former is due to the enhanced lattice distortion as the content of Cr3+ increases, leading to intensifying the splitting of the Cr3+ energy levels. The latter is attributed to the increased probability of the energy transfer from Cr3+ ions with higher 4T2g energy levels to Cr3+ ions with lower 4T2g energy levels by increasing the Cr3+-concentration.


