 Open Access Article
Creative Commons Attribution 3.0 Unported Licence
Ti3AlC2 MAX phase conversion to a novel 2D titanium carbo-oxide by an eco-friendly and low-cost method: highly selective gas sensing and supercapacitor evaluations
Roussin
Lontio Fomekong
*ab,
Jalal
Azadmanjiri
 b,
Joyce Boitumelo
Matsoso
b,
Marco
Serra
b,
Sana
Akir
b,
Lukáš
Dekanovsky
b,
Jan
Luxa
b,
Eva
Vejmelková
c and
Zdeněk
Sofer
b,
Joyce Boitumelo
Matsoso
b,
Marco
Serra
b,
Sana
Akir
b,
Lukáš
Dekanovsky
b,
Jan
Luxa
b,
Eva
Vejmelková
c and
Zdeněk
Sofer
 *b
*b
aHigher Teacher Training College, University of Yaounde I, P.O. BOX 47, Yaounde, Cameroon. E-mail: lonforou@yahoo.fr/roussin; lontio@univ-yaounde1.cm
bDepartment of Inorganic Chemistry, University of Chemistry and Technology, Technicka 5, Prague, 16628, Czech Republic. E-mail: zdenek.sofer@vscht.cz
cDepartment of Materials Engineering and Chemistry, Faculty of Civil Engineering, Czech Technical University in Prague, Thakurova 7, 16629, Prague, Czech Republic
First published on 30th March 2023
Abstract
Energy shortage and environmental pollution issues are among the biggest challenges of this century. Therefore, research into innovative new materials to overcome such issues is urgently required. In this context, this study reports the one-pot synthesis of a novel 2D titanium carbo-oxide layered structure using a simple and eco-friendly method. Then, its potential applications as a gas sensor and supercapacitor were evaluated for the first time. The 2D titanium carbo-oxide layered structure was prepared via a solvothermal method by exfoliation of the Ti3AlC2 MAX phase with tetramethylammonium hydroxide. X-ray diffraction, Raman spectroscopy, scanning electron microscopy, and X-ray photoelectron spectroscopy characterizations demonstrated that pure 2D titanium carbo-oxide flakes with a layered structure were successfully obtained. The synthesized nanomaterial showed a very good sensing response and high selectivity towards methanol at room temperature against ethanol and other volatile organic compounds. The investigation of its supercapacitor performance in three different aqueous electrolytes revealed that this 2D nanomaterial had a high potential window of 1.8 V in Na2SO4, high specific capacitance of 161 F g−1 in H2SO4, and 87.1% capacitance retention after 2500 cycles in KOH. The probably reduced interlayer spacing can explain the underlying mechanism of the sensor and its electrochemical capacitance.
1. Introduction
Owing to the ever-increasing global population, energy shortage and environmental pollution issues have become research hot topics attracting the attention of more scientists.1–5 Also, over the past decades, there has been a tremendous development of modern electronic devices, such as smartphones, tablets, and wearable devices. The over-consumption of these products has made the design of high-performance energy storage accessories highly important.6,7 One of the best-known energy storage devices that have received a lot of attention are supercapacitors. This is due to their many advantages, such as charge/discharge capabilities, high power densities, and long cycle life.8,9 On the other hand, human activities, such as industrialization, mining, urbanization, and exploration, are responsible for the increase of air pollutants, such as NOx, CO, SO2, and volatile organic compounds (VOCs).10,11 Among the VOCs, methanol is one of the most poisonous gases, and needs to be strictly controlled in the environment.12 If methanol is not treated immediately after inhalation or ingestion, it can provoke irreversible tissue damage, especially to the eyes and nervous system. On the other hand, there are many potential sources of methanol in everyday life, such as adulterated alcohol and chemical raw materials in laboratories and chemical plants, hence, there is a high potential risk of poisoning in such environments.13In order to solve all these energy storage and environmental problems, there has been a lot of interest devoted to the development of performant materials. Although many efforts have already been devoted to developing high-performance materials for supercapacitors and gas sensors, there is still a constant search to improve the performance and production costs of functional materials.14–18 Among the best-known conventional nanostructured materials are two-dimensional (2D) nanomaterials, which have attracted increased interest due to their outstanding electrical, magnetic, and mechanical properties.19,20 In 2011, a new family of 2D transition metal carbides, nitrides, and carbonitrides (MXene) represented by the general formula of Mn + 1XnTx (n = 1, 2, 3, or 4), where M is an early transition metal, X is carbon and/or nitrogen, and Tx is the surface terminal groups, such as –O, –OH, and/or –F species, was discovered. This type of 2D nanomaterial has unique characteristics, such as abundant surface functional groups, high metallic conductivity, high specific surface area, good hydrophilic nature, and good thermal stability. These characteristics make it a promising candidate in diverse high-technology applications, such as the electrodes of supercapacitors and as a sensing layer for gas sensors.21,22 However, most common synthesis method for MXenes involve etching of the MAX phase via highly concentrated hydrofluoric acid, which, in addition to being highly toxic, generally leads to a high content of –F termination groups on the surface of the material, thus negatively affecting the performance of the supercapacitors.23 All this limits the scaled-up large-scale, real-world applications of MXene. Some reports have shown that the post-treatment of MXene with a basic solution, such as KOH, can reduce the amount of –F and improve the performance of the supercapacitors.24 Therefore, the development of totally new 2D materials or new scalable methods that can lead to a significantly low content or even fully eliminate the –F termination group are strongly needed for achieving high-efficiency devices. Besides, MXene has also demonstrated good sensing properties due to its high metallic conductivity for low noise, large surface area, and fully functionalized surface for achieving a strong signal.22,25 In fact, most sensing materials, such as semiconducting metal oxides, have drawbacks, such as a high operating temperature and low selectivity, and these factors limit their practical applications.14,26 Although some reports have shown the use of MXene for VOC detection at room temperature, the selectivity still needs to be improved.27 The problem of selectivity in VOCs detection is more difficult, especially against ethanol, because all of them are reducing gases and have the tendency to react in the same way with the sensing material.
A recent research work published by Hussein O. Badr et al.28 reported an interesting route to produce novel 2D titanium carbo-oxide flakes using the Ti3AlC2 MAX phase with tetramethylammonium hydroxide (TMAOH, C4H13NO) by a simple wet chemistry method for battery and biomedical applications. As a first piece of work on these new 2D nanomaterials (with the MXene-like structure but are not MXene), further investigation is needed to understand and expand their application. Moreover, the synthesized nanomaterials in that research work also were impure and the minimum reaction time was 24 h, and these deficiencies require further development. Furthermore, depending on the reaction conditions, the obtained nanomaterials were either conductive or non-conductive, due to the differences in point defects. To the best of our knowledge, the present research work reports for the first time the one-pot preparation of a pure 2D titanium carbo-oxide layered structure using a simple solvothermal method, as well as its gas-sensing and supercapacitor properties. The projected straightforward preparation process, which involves only one step and the utilization of a cheap and eco-friendly solvent (TMAOH), shows good prospects for the large-scale production and real-world application of this material. The prepared 2D nanomaterial demonstrated very good selective methanol vapour sensing properties at room temperature, which may be useful for environmental monitoring as well as for the non-invasive assessment of gut bacterial activity by measuring methanol in exhaled breath. The evaluation of its supercapacitor potential in three different electrolytes, namely basic (KOH), neutral (Na2SO4), and acidic (H2SO4), using a free-binder electrode demonstrated that KOH was the most effective solution to obtain high electrochemical performance. The observed properties were probably related to the composition, point defects, and the interlayer spacing of the 2D titanium carbo-oxide electrodes.
2. Experimental section
2.1. Preparation of 2D titanium carbo-oxide flakes
The as-received Ti3AlC2 MAX phase material (Jinzhou Haixin Metal Materials, China) and tetramethylammonium hydroxide (TMAOH, C4H13NO), as a 10 wt% solution in H2O (Lachema, Czech Republic), were used without further purification. In a typical synthesis, 0.97 g of Ti3AlC2 and 9.1 g of TMAOH (Ti3AlC2![[thin space (1/6-em)]](https://www.rsc.org/images/entities/char_2009.gif) :
:![[thin space (1/6-em)]](https://www.rsc.org/images/entities/char_2009.gif) TMAOH = 1
TMAOH = 1![[thin space (1/6-em)]](https://www.rsc.org/images/entities/char_2009.gif) :
:![[thin space (1/6-em)]](https://www.rsc.org/images/entities/char_2009.gif) 2) were mixed, stirred for 30 min, and then transferred into a 50 mL Teflon-lined stainless steel autoclave. The autoclave was kept in an electric oven at 170 °C for 12 h. After the solvothermal treatment, the autoclave was cooled down to room temperature under ambient conditions. The obtained dark black sediment was collected and rinsed with ethanol, and then shaken and centrifuged at 3500 rpm four times until a clear supernatant was obtained with a pH value of 7. Once the supernatant became clear (inset Fig. 2a), 30 mL deionized water was added to the washed products, which were shaken for 5 min, followed by centrifugation at 3500 rpm (1315 rcf) for 30 min and again at 8000 rpm (6869 rcf) for 20 min, and finally the last time at 10
2) were mixed, stirred for 30 min, and then transferred into a 50 mL Teflon-lined stainless steel autoclave. The autoclave was kept in an electric oven at 170 °C for 12 h. After the solvothermal treatment, the autoclave was cooled down to room temperature under ambient conditions. The obtained dark black sediment was collected and rinsed with ethanol, and then shaken and centrifuged at 3500 rpm four times until a clear supernatant was obtained with a pH value of 7. Once the supernatant became clear (inset Fig. 2a), 30 mL deionized water was added to the washed products, which were shaken for 5 min, followed by centrifugation at 3500 rpm (1315 rcf) for 30 min and again at 8000 rpm (6869 rcf) for 20 min, and finally the last time at 10![[thin space (1/6-em)]](https://www.rsc.org/images/entities/char_2009.gif) 000 rpm (10
000 rpm (10![[thin space (1/6-em)]](https://www.rsc.org/images/entities/char_2009.gif) 733 rcf) for 10 min. A stable colloidal suspension was obtained (see inset Fig. 2a), while the unreacted powders eventually settled down.
733 rcf) for 10 min. A stable colloidal suspension was obtained (see inset Fig. 2a), while the unreacted powders eventually settled down.
2.2. Materials characterization
The suspension was drop-cast on a suitable substrate and an X-ray diffraction instrument (XRD, Bruker D8 Advance, Germany) equipped with a CuKα (λ = 1.5406 Å) source was used to determine the crystal structure of the synthesized material. The measurements were performed in the 2θ range of 5–90°, with a step size of 0.05°. A Raman spectrophotometer from Renishaw was used to measure the Raman spectra using a 532 nm laser, 50× magnification objective, and 0.75 mW laser power in order to avoid powder degradation and the formation of any TiO2 polymorph. The measurements were performed in different locations, with an exposure time of 20 s. A scanning electron microscopy system (SEM) with an FEG electron source (Tescan Maya) was used to investigate the morphology of the material. An EFTEM Jeol 2200 FS microscope (Jeol, Japan) was used for the HR-TEM measurements and the experiments were performed at an acceleration voltage of 200 keV. An SDD detector (X-MaxN 80 TS) from Oxford Instruments (UK) was used to obtain the elemental maps and EDS spectra. The suspension was drop-cast on a TEM grid (Cu; 200 mesh; Formvar/carbon) and dried in a vacuum oven at 60 °C for 120 min. The oxidation state of the elements and surface composition of the sample were determined by X-ray photoelectron spectroscopy (XPS) analysis. The experiment was performed with an electron spectroscopy for chemical analysis (ESCA) Probe P spectrometer (Omicron Nanotechnology, Germany) using a monochromatized Al Kα X-ray source (1486.7 eV).2.3. Gas-sensor preparation
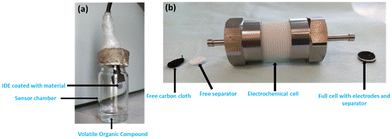
The gas-sensing properties towards VOCs were investigated by electrochemical impedance spectroscopy (EIS) using a gold interdigitated electrode (IDE) ED-IDE3-Au (Microflux Fluidic, Spain). The IDE was made with bars measuring 0.5 μm wide and with a gap of 0.5 μm between each other. In order to prepare the sensor, the IDE was first ultrasonically cleaned by deionized water, ethanol, and acetone and then dried in a nitrogen flow. The suspension of the sensing materials was drop-cast (2 drops) onto the preheated electrodes, dried at 90 °C for 10 min, and placed in a 20 mL chamber. For the experiments, the corresponding amount of each analyte (methanol, ≥99.9%; ethanol, ≥98%; acetone, ≥97%; isopropanol, ≥98%; n-butanol, ≥99%; and toluene, ≥98%, all from Lachner) was introduced in the 20 mL chamber and 5 min was left for vapor saturation before each measurement (Fig. 1a). The responses based on the EIS measurements were acquired in the 1–106 Hz frequency range using the Metrohm Autolab potentiostat controlled by Nova 2.14 software. After measurement, 5 min was also left for the recovery. The gas concentration of the analyte was calculated using eqn (1)| Cppm = (2.46 × Va × ρ × 107)/(Vc × Mw) | (1) |
| Resp = (Z0 – Zf) × 100/Z0 | (2) |
2.4. Supercapacitor preparation
Before the measurements, the synthesized titanium carbo-oxide was initially spray-coated on to flexible large clean carbon cloth (Kynol Europa GmbH) in order to obtain a uniform thin film. Since the material would form a stable suspension in water, no additives were added before its insertion in the spray gun followed by the spraying via a straightforward and easy process. After the spray process, the coated carbon clothes were dried for 48 hours in a vacuum oven at 35 °C followed by punching in a small circle shape with a diameter of 10 mm as the supercapacitor electrodes. A full cell was made by assembling two electrodes (small circles shape) separated by a Whatman cellulose membrane filter previously immersed in the electrolyte (Fig. 1b).An Autolab PGSTAT 204 system (Utrecht, Netherlands, NOVA Version 2.1.4) was used to investigate the supercapacitor properties in a two-electrode based system using three different electrolytes (1 M H2SO4, 1 M KOH, and 1 M Na2SO4). The electrochemical measurements were performed at room temperature and the electrochemical performances were evaluated using cyclic voltammetry (CV), galvanostatic charge–discharge (GCD), and electrochemical impedance spectroscopy (EIS). For each electrolyte, GCD was recorded between the corresponding potential window at different current densities (0.16–2.45 A g−1) and CVs at different scan rates (10–100 mV s−1). EIS measurements were recorded between 10 mHz and 100 kHz by an open-circuit potential at 10 mV. Based on the GCD curves, the specific capacitances (Cs in F g−1) of the electrodes were calculated using eqn (3) below:
| Cs = (I × Δt)/(m × ΔV) | (3) |
| Ecell = (Ccell × ΔV2 × 1000)/(2 × 3600) | (4) |
| Pcell = (Ecell × 3600)/Δt | (5) |
3. Results and discussion
3.1. Materials characterization
Fig. 2a shows the phase compositions of the as-received MAX phase and the synthesized nanomaterials. The main observed diffraction peaks for the MAX phase appeared at 9.5°, 19°, 34.0°, 38.5°, 41.5°, and 70°, corresponding to the (002), (004), (101), (104), (105), and (1012) planes, respectively. These peaks could determine the pure phase for Ti3AlC2 (JCPDS card no. 52-0875). After reaction with tetramethylammonium hydroxide (TMAOH, C4H13NO), a disappearance of all the peaks was observed and two new ones emerged at 7.5° and 15.3° corresponding to (001) and (002) diffraction planes, typical of 2D materials as reported by Yibin Jiang et al.29 This diffractogram was similar to the one reported by Hussein O. Badr et al.,28 who synthesized the same product using a wet chemistry method under reflux conditions. However, they noticed in their diffractogram the existence of Ti3AlC2 residue (smalls peak at 9.5° and 38.5°), which was not visible in the case of our sample. This situation confirmed the purity of the obtained product with the solvothermal method.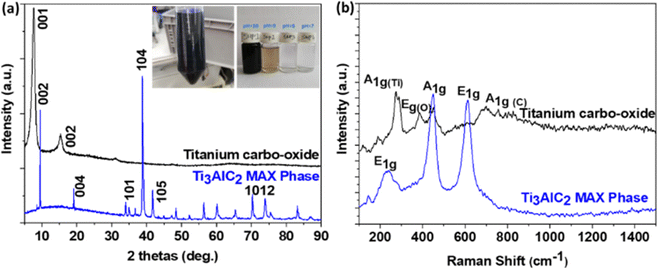 | ||
| Fig. 2 (a) XRD patterns (inset shows the colloidal suspension and the different supernatants) and (b) Raman spectra of the as-received Ti3AlC2 MAX phase and synthesized 2D titanium carbo-oxide. | ||
The Raman spectra of the Ti3AlC2 MAX phase and the as-prepared nanomaterials are presented in Fig. 2b. It could be observed that, new vibration bands emerged in the Raman spectrum of the as-prepared nanomaterials at 276, 388, 452, and 706 cm−1, indicating effectively the formation of new phases. The bands observed at 276 cm−1 (A1g) could be assigned to the vibration of Ti atoms, the one at 388 cm−1 (Eg) the vibration of O atoms, and the last one at 706 cm−1 (A1g), the vibration of C atoms. The band at 452 cm−1 could be related to some longitudinal Ti–O vibrational modes.
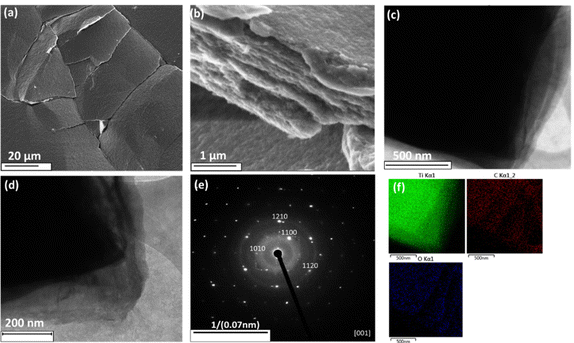
The SEM and TEM images at different magnifications (Fig. 3a–d) showed the morphology of the as-prepared sample. The images show the formation of large-area flakes and a multilayered structure. The EDX mapping from the TEM image (Fig. 3c) presented in Fig. 3f revealed the presence of titanium, carbon, and oxygen as the main elements, which were homogeneously distributed. No aluminium was detected, proving that during the reaction between Ti3AlC2 and TMAOH, aluminium had been totally removed, leading probably to the layered structure. Whereas in the conventional etching process, aluminium is usually removed using the very aggressive and dangerous chemical hydrofluoric acid, which makes the process non-environmentally friendly. This result confirmed the formation of a 2D titanium carbo-oxide layered structure by the applied synthetic route. Selected area electron diffraction (SAED) of the as-prepared material resulted in one main ring. After indexation, a good agreement with the XRD peaks was found, confirming the SAED patterns were representative. However, TCO still maintained a hexagonal symmetry like the parent Ti3AlC2 sample, which was consistent with the electron diffraction pattern.
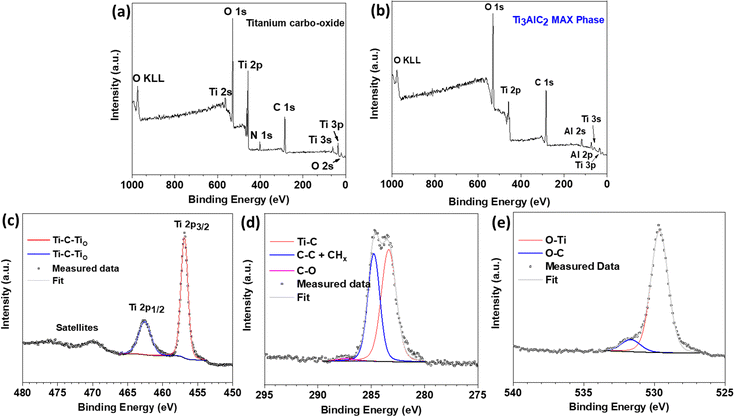
The material was further characterized by X-ray photoelectron spectroscopy (XPS), as displayed in Fig. 4. The survey spectrum in Fig. 4a revealed the presence of all the constituent elements (Ti, C, O) with no sign of Al, demonstrating its successful removal from the surface of the synthesized material. For comparison, the survey spectrum of the Ti3AlC2 MAX phase is also shown in Fig. 4b, clearly demonstrating the presence of Al in the starting material. On the other hand, we detected a small amount of nitrogen (ca. 5 at%), which certainly came from the ammonium salt used during the synthesis. The high-resolution core-level spectrum of the Ti2p region in Fig. 4c indicated only a single state of titanium. Based on previous reports on MAX phase Ti3AlC2 and the respective MXene, we could conclude that this state, located at 456.8 and 462.5 eV, originated from the oxygen-terminated titanium surface (Ti–C–TiO).17 Furthermore, the presence of a single oxidation state was in high contrast to previous reports, where TiO2 was very often reported in both MAX phases as well as the respective MXenes.17 The C 1s spectrum in Fig. 4d revealed two major components, one of which belonged to Ti–C bonds (282.8 eV),17 while the other one (284.8 eV) was associated with adventitious carbon or carbon coming from residual salt used during the synthesis. The last component was associated with C–O bonds coming from adventitious organic compounds. Finally, the O1s spectrum in Fig. 4e also confirmed the presence of Ti–O bonds (529.6 eV) and O–C derived from adventitious organic compounds (531.6 eV).
3.2. Gas-sensor applications
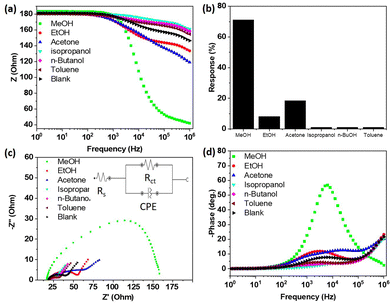
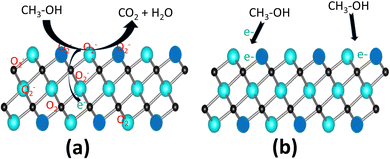
In order to investigate the sensing properties of the as-prepared materials, first, a screening was done for the detection of many VOCs (methanol, ethanol, acetone, isopropanol, n-butanol, and toluene) at room temperature and the results are presented in Fig. 5. As can be observed in Fig. 5a, in air (without gases), the impedance decreased slowly from 180 to 146 Ohm with the increase in the frequency. In the presence of gas vapours, we noticed a decreases in the impedance from 180 to 42 Ohm (for methanol), 119 Ohm (for acetone), 133 Ohm (for ethanol), which were certainly due to the charge transfer between the analytes and electrode. However, compared to the blank, a lower decrease in the impedance was observed in the presence of other VOCs. In fact, since the material behaved as an n-type semiconductor, in the presence of isopropanol, n-butanol, and toluene, in addition to oxygen, these gases were adsorbed and were ionized by taking additional electrons on the material surface, leading to a lower decrease in the impedance compared to the blank, where only oxygen molecules were present.Using eqn (2), the sensor responses were calculated and are presented in Fig. 5b. The response to 1500 ppm methanol (71.2%) was 3.8 times higher than that for a similar concentration of acetone (18.5%) and 8.5 times higher than that of ethanol (8.2%), confirming the very good selectivity of this sensing material towards methanol. This good selectivity could be ascribed to the small interlayer spacing of the 2D titanium carbo-oxide prepared here, where only small molecules, like methanol (3.6 Å), could preferentially diffuse, therefore enhancing the charge transfer between methanol and the sensing layer. Due to the large sizes of the other VOCs (4.4 Å for ethanol, 6.16 Å for acetone), their diffusion in the interlayer spacing was very difficult, therefore drastically decreasing their response. Nyquist plots were recorded after exposure of all the gases to the sensing materials and the results are presented in Fig. 5c. For methanol, a single semi-cycle was obtained, indicating that the electrical interaction between the electrode and methanol followed a parallel circuit connection with the impedance resistance parallel with the double-layer capacitance. The equivalent circuit (see the inset of Fig. 5c) revealed the solution resistance (Rs) of 44.5 Ohm, which indicated the transport properties of the accumulated methanol vapour solution-like electrolyte around the layer. The charge-transfer resistance (Rct) obtained was 140 Ohm and was related to the kinetics for the conversion of methanol to carbon dioxide and water. Since the as-prepared 2D titanium carbo-oxide was not highly conductive, a relatively high value of Rct was obtained. Bode phase plots of the sensing materials were obtained (Fig. 5d) and indicated a raised affinity in sensitivity towards methanol only, whereas this trend was almost unchanged for the other vapours, confirming the good selectivity observed for methanol. This high affinity was due to the possibility for methanol to be adsorbed and to diffuse easily in the interlayer spacing, which was not the case for the bigger molecules.
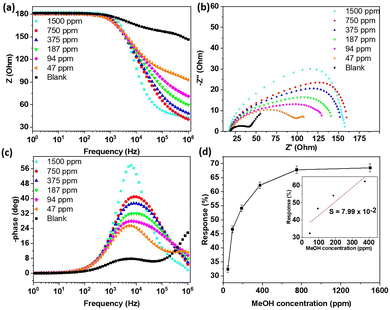
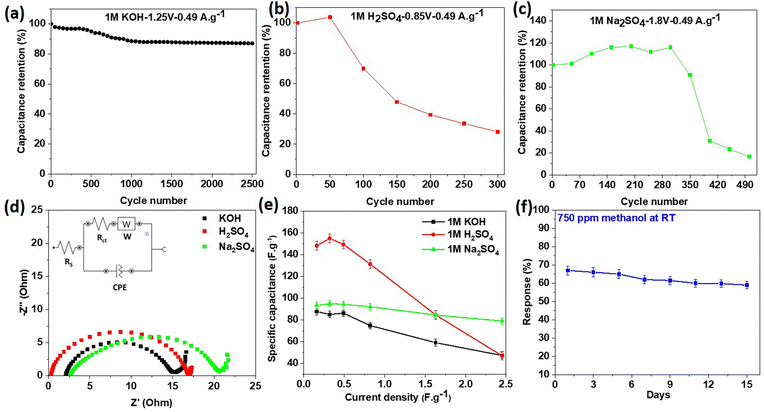
To further investigate the sensor performance of the prepared materials towards methanol, the sensor responses at different concentrations of methanol were recorded and the results are depicted on Fig. 6. As can be observed, the impedance decreased less with decreasing the methanol concentration (Fig. 6a), indicating a lower charge transfer. This was also confirmed in the Nyquist plots (Fig. 6b), where −Z′′ decreased with decreasing the methanol concentration. The Bode phase plots (Fig. 6c) also showed a decreasing affinity of the sensing materials with methanol when its concentration decreased. As clearly depicted in Fig. 6d, the sensor response increased with the increasing methanol concentration up to 750 ppm of methanol, before becoming constant. This could be due to the saturation of the sensing layer after 750 ppm, leading to a constant charge transfer. At low concentration, it could be presumed that more methanol molecules became adsorbed on the material surface (when the methanol concentration increased), leading to an increase in the charge transfer and therefore the sensor response. As shown in Table 1, the sensing performance for the detection of methanol of the new 2D titanium carbo-oxide sensing layer reported in this study was found to be relatively comparable and even somehow better that those of the 2D materials and metal oxides. Although the impedimetric investigation on the detection of methanol is a relatively new topic, the results obtained in this work showed that 2D titanium carbo-oxide does have potential to selectively detect methanol at room temperature. It should be noted that, the cross-sensitivity was evaluated by calculating the ratio between the sensors responses obtained in the methanol with the one obtained in ethanol or acetone, which are the most interfering gases. The sensor developed in this study was 8.5 times more sensitive to methanol than ethanol, which shows it had outstanding performance. Other sensing parameters for the 2D titanium carbo-oxide were evaluated through calculation of the sensitivity (S = dResp/dC) and concentration limit of detection (LoD = 3.3 × σ/S, σ is the standard deviation) as per the plots of the sensor response (Resp = (Z0 − Zf) × 100/Z0) against the concentration of the analyte (Fig. 6d). Using the linear part of that figure (inset Fig. 6d) a sensitivity of 7.99 × 10⁻² ppm−1 and an LoD of 2.26 ppm were obtained. The limit of our sensing system did not allow us to test experimentally this very low LoD. These values of the sensitivity and LoD are good and even better than some 2D materials operating at room temperature reported in the literature.36 The stability is also an important sensing parameter for practical application of a sensor device. The stability of 2D titanium carbo-oxide material was thus investigated by measuring the response towards methanol using our device that has been stored at room temperature. During a period of 15 days, the sensor response towards 750 ppm of methanol was measured every 2 days. As depicted in Fig. 11f, the sensor response decreased slowly from 67.1% on day 1 to 58.9 on day 15, corresponding to a 12% drop in performance. This finding, which is comparable to some reported in the literature,37 demonstrated that the 2D titanium carbo-oxide showed acceptable stability for the detection of methanol at room temperature.
| Materials | Operating temperature (°C) | Selectivity against ethanol (Resp-methanol/Resp-ethanol) | Selectivity against acetone (Resp-methanol/Resp-acetone) | Ref. |
|---|---|---|---|---|
| L-SnS@rGO | RT | 2.4 | 3.3 | 30 |
| CNPs/ZnO@ZIF-8 | RT | 2.1 | 4.9 | 31 |
| MoS2/TiO2 | 240 | 2.1 | 2.9 | 32 |
| 2D-HfS2 | RT | 2.2 | 1.8 | 33 |
| Indium tungsten oxide | 312 | 2.0 | 1.7 | 34 |
| Mg-doped InSnO | RT | 1.9 | 2.8 | 35 |
| Titanium carbo-oxide | RT | 8.5 | 3.8 | This work |
| O2 + e− → O2−(ads) | (6) |
| CH3–OH + 3/2 O2−(ads) → CO2 + 2H2O + 3/2e− | (7) |
3.3. Supercapacitor application
In order to fully screen the electrochemical capacitance performance of the synthesized 2D titanium carbo-oxide nanomaterials in a supercapacitor device, a standard two-electrode system using 1 M KOH, 1 M H2SO4, and 1 M Na2SO4 electrolytes was examined. This was because the electrolyte, which is one of the main components of supercapacitors, plays an important role in determining the safety, cost, and electrochemical performance of the overall such devices. Therefore, about 3 mg of active materials was sprayed on to each clean piece of chemically inert carbon cloth as a flexible substrate so that about 6 mg activated materials was calculated in each supercapacitor cell.Fig. 8 shows the CV loops recorded on the cell supercapacitors in all three electrolytes at different scan rates of 10, 30, 50, 70, and 100 mV s−1. Depending on the electrolyte, the fixed potential range applied was in the ranges of 0.00–1.25 V, 0.00–0.85 V, and 0.00–1.80 V for KOH, H2SO4, and Na2SO4, respectively. We should notice that a good potential window was reached here with a neutral aqueous electrolyte, thus expanding the application range of this electrode material. All the CV curves showed nearly rectangular-shaped loops, indicating a supercapacitor with good capacitance behaviour and with a storage mechanism based on electric double-layer capacitor (EDLC).23 However, it could be observed from Fig. 8d that the rectangular loop was more distorted for Na2SO4 and H2SO4, indicating that the equivalent series resistance (related to the electrode material resistance) became significant. This was certainly due to the low diffusion rate of the quite large sulfate ions within the probably reduced interlayer spacing of the active material.
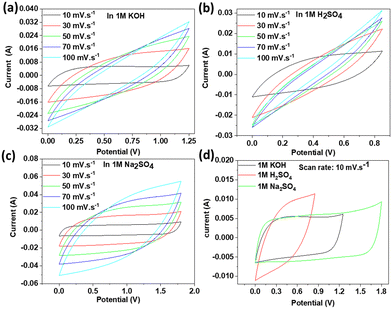 | ||
| Fig. 8 CVs at various scan rates in (a) KOH, (b) H2SO4, (c) Na2SO4 electrolytes and (d) comparative CV curves at a specific scan rate of 10 mV s−1. | ||
Galvanostatic charge/discharge (GCD) curves were recorded for the three electrolytes and are plotted in Fig. 9. The obtained triangular GCD curves at different constant current densities (0.16, 0.32, 0.49, 0.82, 1.63, and 2.45 A g−1) confirmed the good capacity behaviour. However, the Coulombic efficiency obtained in KOH (93%) was higher than that of Na2SO4 (66%) and H2SO4 (27%). The possible reason behind these differences was probably due to the small interlayer spacing for the active material, which reduced the diffusion of larger electrolyte ions like SO42− during the intercalation/deintercalation process. The IR drop in KOH was 0.03 V, which was lower than that of Na2SO4 (0.04 V) and H2SO4 (0.06 V), indicating effectively the lower internal resistance when KOH was used as an electrolyte.38Fig. 9d illustrates a comparison of the GCD curves in different electrolytes, and based on this, the specific capacitances were calculated for all three electrolytes at the minimum applied current of 0.001 A using eqn (3). Taking into consideration the IR drop and the potential window for each electrolyte, the different specific capacitances were 90 F g−1 (for KOH), 161 F g−1 (for H2SO4), and 129 F g−1 (for Na2SO4). These specific capacitances were higher than for many other pristine 2D materials reported in the literature.19 It already has been investigated and reported that the type of anionic and cationic species of the electrolyte affects the specific capacitance and this can explain the different values of the specific capacitances observed in this work.39 Looking at the cationic species in our study, it is rational that the supercapacitor with H2SO4 electrolyte showed the largest specific capacitance due to having the smallest hydrated H+ ion size (0.28 nm) and high conductivity and ionic mobility. Although K+ (0.331 nm) possessed a smaller hydrated ion size than Na+ (0.358 nm), the number of charges (two Na+ for Na2SO4 and one K+ for KOH) explained the higher specific capacitance for Na2SO4 in comparison to KOH. It could be observed from Fig. 9 that the Coulombic efficiency of the 2D titanium carbo-oxide supercapacitor performed better with a triangle shape in the KOH electrolyte at all the applied current densities. However, the Coulombic efficiency was not satisfactory for the initial two low current densities in the supercapacitors made by Na2SO4 and H2SO4 electrolytes. This undesired status of Coulombic efficiency with the last two supercapacitors may be attributed to the larger ionic size of SO42− (258 pm) than OH− (133 pm). The synthesized 2D titanium carbo-oxide had a high volume of surface defects, caused during the etching condition. Hence, the electrolyte ions could intercalate to the structure easily and with a greater volume at all current densities when charging the supercapacitors. The intercalated electrolyte ions, especially those with larger ionic sizes, could probably be trapped inside the 2D titanium carbo-oxide structure during the discharging and deintercalation process when a low current density is applied. Consequently, the discharge time would be lower than the charge time and this unbalance time condition would lead to poor Coulombic efficiencies at low current densities. For practical application, the energy (E) and power (P) densities of a supercapacitor cell should be evaluated in addition to the capacitance. Using eqn (4) and (5), the energy densities of 18.6, 14.1, and 55.5 W h kg−1 and power densities of 100.0, 62.1, and 143.5 W kg−1 were obtained for KOH, H2SO4, and Na2SO4 respectively, at an applied current of 0.001 A. The obtained different values can be explained by the different potential windows in the three selected electrolytes, as represented in Fig. 9d (1.25 V for KOH, 0.85 V for H2SO4, and 1.8 V for Na2SO4).
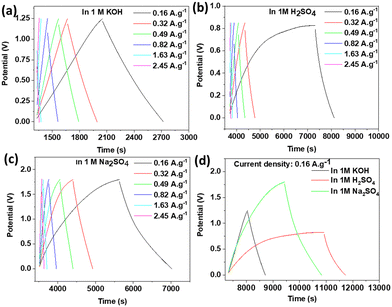 | ||
| Fig. 9 GCD at various current densities in (a) KOH, (b) H2SO4, (c) Na2SO4, and (d) comparative GCD curves at a specific current density of 0.16 A g−1. | ||
To further evaluate the overall electrochemical characteristics of the 2D titanium carbo-oxide supercapacitor, a Ragone plot (power density versus energy density) was plotted and is presented in Fig. 10a, which was also compared with some other references with different symmetric supercapacitor test cells. This demonstrated that the energy and power densities of the supercapacitor developed in this work were more competitive than some of the previous good reports.
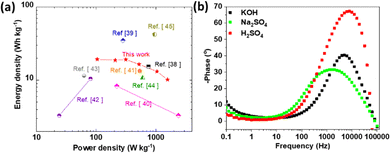 | ||
| Fig. 10 (a) Ragone plots of the 2D titanium carbo-oxide supercapacitor and its comparison with the other high prestigious ref. 40–47. (b) Bode phase angle plots. | ||
The cycling stability of the three supercapacitors was also evaluated at a low current density of 0.49 A g−1. As a proof of concept for this new material, we just limited the experiment to 2500 cycles. From Fig. 11b and c, it can be observed that the specific capacitance value moderately rose during the initial charge–discharge cycles, which may be associated with the precise activation of the electrode materials with the electrolytes, overcoming the internal resistances of the device. It is also evident from Fig. 11a–c that the electrode material had the best stability in KOH, with 87.1% capacitance retention value of the initial capacitance after 2500 cycles. However, this behaviour could not be seen with the other two electrolytes where the capacitance retention was less than 31% in Na2SO4 after 400 cycles and just 28% after 300 cycles in H2SO4. These differences in the cycling stabilities could be related to the anion sizes of the electrolytes and the small interlayer spacing of the 2D titanium carbo-oxide. In neutral and acidic electrolytes, the large SO42− will have low mobility during the intercalation/deintercalation process and this will decrease the cycling stability in those electrolytes.39 The other reason could be due to the large value of defects on the 2D nanomaterials, where the large ionic sizes first penetrate the material during charging the supercapacitor. However, they may be trapped inside the nanostructure materials when discharging.
Electrochemical impedance spectroscopy (EIS) was performed on the supercapacitor cells in order to understand the ion diffusion and charge transport of the active electrode materials in the three electrolytes. As shown in Fig. 11d, the Nyquist plots presented similar characteristics for the three electrolytes. However, the semicircle diameter in the high-frequency region for the KOH electrolyte was the smallest, and additionally, the oblique line of the KOH curve was closest to the vertical axis in the low-frequency region, indicating a low equivalent series resistance, which was compatible with the CV and GCD results. The inset of Fig. 11d shows the equivalent circuit for the EIS fitting curves in KOH. The value obtained for the combined resistance (Rs), comprising the ionic resistance of the electrolyte, intrinsic resistance of electrode materials, and contact resistance between the electrode and current collector, was 2.09 Ohm, and the charge-transfer resistance (Rct) was 12.7 Ohm, which was lower than that in other electrolytes (18.4 Ohm for Na2SO4 and 84.2 Ohm for H2SO4). The titanium carbo-oxide/KOH interface was equivalent to the electric double-layer capacity in the as-prepared materials supercapacitors, which expresses the constant phase element (CPE).
When increasing the current density, it was observed that the specific capacitance of the active electrode material decreased in the three electrolytes, as depicted in Fig. 11e. This general trend is in accordance with many woks published in the literature.51,56 In fact, when the current density increased, the charges did not have enough time to move through the interlayer spacing during the charge/discharge process, leading to the low specific capacitance. Fig. 10b presents the Bode phase angle plots examined in several supercapacitor cells based on the 2D titanium carbo-oxide electrode in the three electrolytes. As depicted in that figure, the Bode phase angle only reached about −10° at the lowest frequency, which showed the ionic resistance contributions dominated in the supercapacitor. The observed small Bode phase value is an indication of a poor insulator, which means there would be current leakage with electron flow through the dielectric separator. This also means that the material would be less able to effectively hold electric charge.57 This phenomenon could be enhanced particularly with the high conductivity of this 2D titanium carbo-oxide due to the point defects created during the etching process, as already reported by H. O. Badr et al.28 However, the phase angle increased over the high-frequency range, where a decline in phase angle response indicates an increase in ionic resistance. It is important to note that the layered structures of the 2D titanium carbo-oxide promoted the diffusion and adsorption of electrolyte ions, resulting in an attractive supercapacitor performance. Table 2 compares the supercapacitor performance of this new 2D titanium carbo-oxide material with other published works in various electrolytes. In Na2SO4 for example, the energy and power densities of this material were superior to some of the reported works in the literature. The specific capacitance obtained in H2SO4 for this material was also higher than some reported in the literature also. Therefore, it could be concluded that the pure 2D titanium carbo-oxide nanomaterials prepared by an eco-friendly and low-cost method in this work show superior supercapacitor characteristics.
| Materials | Electrolyte | Specific capacitance (F g−1) | Potential window (V) | Energy density | Power density | Ref. |
|---|---|---|---|---|---|---|
| Ti3C2Tx/MWCNT-rGO | 1 M H2SO4 | 48 at 2 mV s−1 | 1.1 | 8 W h kg−1 | 60 W kg−1 | 48 |
| Microporous carbon | 0.5 M Na2SO4 | 60 at 0.2 A g−1 | 1.8 | 7 W h kg−1 | 40 W kg−1 | 49 |
| Mo2CTx | 1 M H2SO4 | 79.14 at 0.3 A g−1 | 0.6 | 16.0 W h L−1 | 1449.1 W L−1 | 50 |
| V2NTx | 3.5 M KOH | 112.8 at 1.85 mA cm−2 | 1.0 | 15.66 W h kg−1 | 3748.4 W kg−1 | 51 |
| Ti3C2 | 6 M KOH | 118 at 5 A g−1 | 1.4 | — | — | 52 |
| carbon xerogel | 1 M Na2SO4 | 156 | 1.8 | 17.5 W h kg−1 | — | 53 |
| VS2 | 1 M KOH | 139 at 0.7 A g−1 | 0.6 | 15.6 W h kg−1 | 304 W kg−1 | 54 |
| Se/Ti3C2Tx | 1 M Na2SO4 | 96 at 0.17 A g−1 | 1.5 | 30 W h kg−1 | 124.7 W kg−1 | 55 |
| Titanium carbo-oxide | 1 M H2SO4 | 160 at 0.16 A g−1 | 0.9 | 14.1 W h kg−1 | 62.1 W kg−1 | This work |
| Titanium carbo-oxide | 1 M KOH | 90 at 0.16 A g−1 | 1.3 | 18.6 W h kg−1 | 100.0 W kg−1 | This work |
| Titanium carbo-oxide | 1 M Na2SO4 | 129 at 0.16 A g−1 | 1.8 | 55.5 W h kg−1 | 143.5 W kg−1 | This work |
4. Conclusion
In this work, we demonstrated a simple and cost-effective solvothermal method for preparing a newly developed 2D titanium carbo-oxide layered structure material. Full characterization of the as-prepared material was performed and the gas-sensing properties using electrochemical impedance spectroscopy and by assessing the supercapacitor performances were investigated. The sensor response obtained towards 1500 ppm of methanol at room temperature was 71%. The responses towards other interfering gases, such as acetone (∼18%), ethanol (∼8%), isopropanol (<1%), n-butanol (<1%), and toluene (<1%), were very low, indicating the good selectivity towards methanol. The small size of the interlayer spacing was probably the main reason for the good sensing performance. Three aqueous electrolytes were used to investigate the supercapacitor performances. The results indicated that the active electrode material had a specific capacitance of 90 F g−1 (for KOH), 161 F g−1 (for H2SO4), and 129 F g−1 (for Na2SO4) at an applied current rate of 0.001 A. The obtained potential window was 1.25 V (with KOH), 0.85 V (with H2SO4), and 1.8 V (with Na2SO4). The best cycling stability was acquired with KOH, where the retention capacitance was 87.1% after 2500 cycles. The ion sizes, the presence of point defects, and the interlayer spacing can explain the difference recorded in the supercapacitor performances in the three chosen electrolytes. As this first work is a kind of proof of concept, some investigations are still needed (e.g. to assess the sensor long-term stability, effect of humidity, supercapacitor stability over 10![[thin space (1/6-em)]](https://www.rsc.org/images/entities/char_2009.gif) 000 cycles) to understand and improve the material characteristics of this new 2D nanomaterial produced via an eco-friendly and inexpensive method. However, this material shows great promise to be applied in some other high-tech applications.
000 cycles) to understand and improve the material characteristics of this new 2D nanomaterial produced via an eco-friendly and inexpensive method. However, this material shows great promise to be applied in some other high-tech applications.
Author contributions
Roussin Lontio Fomekong: conceptualization, data curation, methodology and investigation concerning sensor and supercapacitor testing, writing original draft; Jalal Azadmanjiri: visualization, formal analysis concerning supercapacitor, writing – review; Joyce Boitumelo Matsoso: visualization, formal analysis concerning gas sensor; Marco Serra: formal analysis concerning SEM data curation; Sana Akir: writing – review, data curation; Lukáš Dekanovsky: formal analysis concerning SEM and data curation; Jan Luxa: formal analysis concerning XPS, data curation; Eva Vejmelková: formal analysis concerning TEM, data curation. Zdeněk Sofer: conceptualization, supervision, project administration, funding acquisition, validation, writing – review and editing.Conflicts of interest
There are no conflicts to declare.Acknowledgements
R. L. F. was supported by the European Structural and Investment Funds, OP RDE-funded project ‘CHEMFELLS IV’ (No. CZ.02.2.69/0.0/0.0/20_079/0017899). This work was supported by Czech Science Foundation (GACR No. 23-05918S).References
- I. F. U. Muzayanah, H. H. Lean, D. Hartono, K. D. Indraswari and R. Partama, Heliyon, 2022, 8, e10634 CrossRef PubMed.
- M. M. Rahman and X.-B. Vu, Sustainability, 2021, 13, 3749 CrossRef.
- H. Weber and J. D. Sciubba, Eur. J. Popul., 2019, 35, 379–402 CrossRef PubMed.
- S. H. Preston, Popul. Res. Policy Rev., 1996, 15, 95–108 CrossRef.
- J. P. Holdren, Popul. Environ., 1991, 12, 231–255 CrossRef.
- J. Mitali, S. Dhinakaran and A. A. Mohamad, Energy Storage Sav., 2022, 1, 166–216 CrossRef CAS.
- A. G. Olabi, C. Onumaegbu, T. Wilberforce, M. Ramadan, M. A. Abdelkareem and A. H. Al-Alami, Energy, 2021, 214, 118987 CrossRef CAS.
- M. Pershaanaa, S. Bashir, S. Ramesh and K. Ramesh, J. Energy Storage, 2022, 50, 104599 CrossRef.
- M. Şahin, F. Blaabjerg and A. Sangwongwanich, Energies, 2022, 15, 674 CrossRef.
- G. Shaddick, M. L. Thomas, P. Mudu, G. Ruggeri and S. Gumy, npj Clim. Atmos. Sci., 2020, 3, 23 CrossRef CAS.
- J. Gonzalez-Martin, N. J. R. Kraakman, C. Perez, R. Lebrero and R. Munoz, Chemosphere, 2021, 262, 128376 CrossRef CAS PubMed.
- E. David and V. C. Niculescu, Int. J. Environ. Res. Public Health, 2021, 18, 13147 CrossRef CAS PubMed.
- Z. Nekoukar, Z. Zakariaei, F. Taghizadeh, F. Musavi, E. S. Banimostafavi, A. Sharifpour, N. Ebrahim Ghuchi, M. Fakhar, R. Tabaripour and S. Safanavaei, Ann. Med. Surg., 2021, 66, 102445 Search PubMed.
- B. Saruhan, R. Lontio Fomekong and S. Nahirniak, Front. Sens., 2021, 2, 657931 CrossRef.
- H. Yu, C. Guo, X. Zhang, Y. Xu, X. Cheng, S. Gao and L. Huo, Adv. Sustainable Syst., 2022, 6, 2100370 CrossRef CAS.
- K. K. Patel, T. Singhal, V. Pandey, T. P. Sumangala and M. S. Sreekanth, J. Energy Storage, 2021, 44, 103366 CrossRef.
- L.-Å. Näslund, P. O. Å. Persson and J. Rosen, J. Phys. Chem. C, 2020, 124, 27732–27742 CrossRef.
- D. Lahem, F. R. Lontio, A. Delcorte, L. Bilteryst and M. Debliquy, IOP Conf. Ser.: Mater. Sci. Eng., 2016, 108, 012002 Search PubMed.
- S. M. Oh and S.-J. Hwang, J. Korean Ceram. Soc., 2020, 57, 119–134 CrossRef CAS.
- J. Zhang, L. Liu, Y. Yang, Q. Huang, D. Li and D. Zeng, Phys. Chem. Chem. Phys., 2021, 23, 15420–15439 RSC.
- G. Murali, J. Rawal, J. K. R. Modigunta, Y. H. Park, J.-H. Lee, S.-Y. Lee, S.-J. Park and I. In, Sustainable Energy Fuels, 2021, 5, 5672–5693 RSC.
- S. Nahirniak and B. Saruhan, Sensors, 2022, 22, 972 CrossRef CAS PubMed.
- R. Ma, Z. Chen, D. Zhao, X. Zhang, J. Zhuo, Y. Yin, X. Wang, G. Yang and F. Yi, J. Mater. Chem. A, 2021, 9, 11501–11529 RSC.
- J. Li, X. Yuan, C. Lin, Y. Yang, L. Xu, X. Du, J. Xie, J. Lin and J. Sun, Adv. Energy Mater., 2017, 7, 1602725 CrossRef.
- A. Khosla Sonu, H. T. A. Awan, K. Singh Gaurav, R. Walvekar, Z. Zhao, A. Kaushik, M. Khalid and V. Chaudhary, Adv. Sci., 2022, 9, e2203527 CrossRef PubMed.
- A. Palacios-Padrós, M. Altomare, A. Tighineanu, R. Kirchgeorg, N. K. Shrestha, I. Díez-Pérez, F. Caballero-Briones, F. Sanz and P. Schmuki, J. Mater. Chem. A, 2014, 2, 915–920 RSC.
- X. Li, Z. An, Y. Lu, J. Shan, H. Xing, G. Liu, Z. Shi, Y. He, Q. Chen, R. P. S. Han, D. Wang, J. Jiang, F. Zhang and Q. Liu, Adv. Mater. Technol., 2021, 7, 2100872 CrossRef.
- H. O. Badr, T. El-Melegy, M. Carey, V. Natu, M. Q. Hassig, C. Johnson, Q. Qian, C. Y. Li, K. Kushnir, E. Colin-Ulloa, L. V. Titova, J. L. Martin, R. L. Grimm, R. Pai, V. Kalra, A. Karmakar, A. Ruffino, S. Masiuk, K. Liang, M. Naguib, O. Wilson, A. Magenau, K. Montazeri, Y. Zhu, H. Cheng, T. Torita, M. Koyanagi, A. Yanagimachi, T. Ouisse, M. Barbier, F. Wilhelm, A. Rogalev, J. Björk, P. O. Å. Persson, J. Rosen, Y.-J. Hu and M. W. Barsoum, Mater. Today, 2022, 54, 8–17 CrossRef CAS.
- Y. Jiang, L. Cao, X. Hu, Z. Ren, C. Zhang and C. Wang, Inorg. Chem., 2018, 57, 15123–15132 CrossRef CAS PubMed.
- Y. Qin, J. Wang and Y. Bai, Phys. Status Solidi A, 2021, 218, 2000642 CrossRef CAS.
- L. Malepe, D. T. Ndinteh, P. Ndungu and M. A. Mamo, RSC Adv., 2022, 12, 27094–27108 RSC.
- S. Singh and S. Sharma, Sens. Actuators, B, 2022, 350, 130798 CrossRef CAS.
- S. Das, S. Sharma and S. K. Sharma, IEEE Sens. J., 2019, 19, 9090–9096 CAS.
- C. Wang, X. Kou, N. Xie, L. Guo, Y. Sun, X. Chuai, J. Ma, P. Sun, Y. Wang and G. Lu, ACS Sens., 2017, 2, 648–654 CrossRef CAS PubMed.
- L. Li, J. Li, W. Fu, D. Jiang, Y. Song, Q. Yang, W. Zhu and J. Zhang, Nanotechnology, 2022, 33, 252001 CrossRef PubMed.
- J. B. Matsoso, N. Antonatos, P. R. Kumar, C. Jellett, V. Mazánek, C. Journet and Z. Sofer, J. Mater. Chem. C, 2022, 10, 3307–3317 RSC.
- P. J. Maake, T. P. Mokoena, A. S. Bolokang, N. Hintsho-Mbita, J. Tshilongo, F. R. Cummings, H. C. Swart, E. I. Iwuoha and D. E. Motaung, Mater. Adv., 2022, 3, 7302–7318 RSC.
- K. Yang, K. Cho, D. S. Yoon and S. Kim, Sci. Rep., 2017, 7, 40163 CrossRef CAS PubMed.
- B. Pal, S. Yang, S. Ramesh, V. Thangadurai and R. Jose, Nanoscale Adv., 2019, 1, 3807–3835 RSC.
- Z. Pan, F. Cao, X. Hu and X. Ji, J. Mater. Chem. A, 2019, 7, 8984–8992 RSC.
- Q. Wang, S. Wang, X. Guo, L. Ruan, N. Wei, Y. Ma, J. Li, M. Wang, W. Li and W. Zeng, Adv. Electron. Mater., 2019, 5, 1900537 CrossRef CAS.
- W. Liu, Z. Wang, Y. Su, Q. Li, Z. Zhao and F. Geng, Adv. Energy Mater., 2017, 7, 1602834 CrossRef.
- Y. Wang, X. Wang, X. Li, R. Liu, Y. Bai, H. Xiao, Y. Liu and G. Yuan, Nanomicro Lett., 2020, 12, 115 CAS.
- J. Yan, C. E. Ren, K. Maleski, C. B. Hatter, B. Anasori, P. Urbankowski, A. Sarycheva and Y. Gogotsi, Adv. Funct. Mater., 2017, 27, 1701264 CrossRef.
- Z. Fan, Y. Wang, Z. Xie, D. Wang, Y. Yuan, H. Kang, B. Su, Z. Cheng and Y. Liu, Adv. Sci., 2018, 5, 1800750 CrossRef PubMed.
- Z. Pan and X. Ji, J. Power Sources, 2019, 439, 227068 CrossRef CAS.
- J. Fu, J. Yun, S. Wu, L. Li, L. Yu and K. H. Kim, ACS Appl. Mater. Interfaces, 2018, 10, 34212–34221 CrossRef CAS PubMed.
- A. M. Navarro-Suárez, K. L. Van Aken, T. Mathis, T. Makaryan, J. Yan, J. Carretero-González, T. Rojo and Y. Gogotsi, Electrochim. Acta, 2018, 259, 752–761 CrossRef.
- D. Jiménez-Cordero, F. Heras, M. A. Gilarranz and E. Raymundo-Piñero, Carbon, 2014, 71, 127–138 CrossRef.
- H. He, J. Wang, Q. Xia, L. Wang, Q. Hu and A. Zhou, Appl. Surf. Sci., 2021, 568, 150971 CrossRef CAS.
- S. Venkateshalu, J. Cherusseri, M. Karnan, K. S. Kumar, P. Kollu, M. Sathish, J. Thomas, S. K. Jeong and A. N. Grace, ACS Omega, 2020, 5, 17983–17992 CrossRef CAS PubMed.
- Y. Tang, J. Zhu, C. Yang and F. Wang, J. Electrochem. Soc., 2016, 163, A1975–A1982 CrossRef CAS.
- P. Staiti, A. Arenillas, F. Lufrano and J. Á. Menéndez, J. Power Sources, 2012, 214, 137–141 CrossRef CAS.
- S. A. Patil, I. Rabani, S. Hussain, Y. S. Seo, J. Jung, N. K. Shrestha, H. Im and H. Kim, Nanomaterials, 2022, 12, 339 CrossRef CAS PubMed.
- J. Azadmanjiri, L. Děkanovský, S. Wei, M. Li and Z. Sofer, J. Energy Storage, 2022, 56, 105918 CrossRef.
- M. Pathak, S. R. Polaki and C. S. Rout, RSC Adv., 2022, 12, 10788–10799 RSC.
- N. O. Laschuk, E. B. Easton and O. V. Zenkina, RSC Adv., 2021, 11, 27925–27936 RSC.
| This journal is © The Royal Society of Chemistry 2023 |

