 Open Access Article
Ordered arrays of gold nanoparticles crosslinked by dithioacetate linkers for molecular devices†
Maryana
Asaad
 *a,
Andrea
Vezzoli
b,
Abdalghani
Daaoub
c,
Joanna
Borowiec
d,
Eugenia
Pyurbeeva
a,
Hatef
Sadeghi
 c,
Sara
Sangtarash
c,
Simon J.
Higgins
c,
Sara
Sangtarash
c,
Simon J.
Higgins
 b and
Jan A.
Mol
 a
a
aSchool of Physical and Chemical Sciences, Queen Mary University of London, London, E1 4NS, UK. E-mail: m.asaad@qmul.ac.uk
bDepartment of Chemistry, University of Liverpool, Liverpool, L69 7ZF, UK
cSchool of Engineering, University of Warwick, Coventry, CV4 7AL, UK
dDepartment of Chemistry, University College London, London, WC1E 6BT, UK
First published on 30th March 2023
Abstract
The final performance of a molecular electronic device is determined by the chemical structure of the molecular wires used in its assembly. Molecular place-exchange was used to incorporate di-thioacetate terminated molecules into ordered arrays of dodecanethiol capped gold nanoparticles. X-Ray photoelectron spectroscopy confirmed successful molecular replacement. Room-temperature molecular conductance of a statistically large number of devices reveals that conductance is enhanced by up to two orders of magnitude for the di-thioacetate terminated molecules. Density functional theory transport calculations were performed on five different configurations of the di-thioacetate molecules between gold electrodes, and the calculated average conductance values are in good agreement with the experimentally-observed conductance trend. Our findings highlight important cooperative effects of bridging neighboring gold nanoparticles and choice of appropriate molecular wires when designing devices for efficient transport.
Introduction
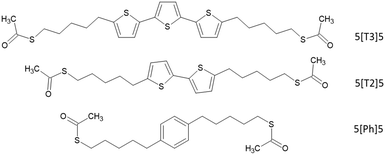
Self-assemblies of molecularly linked gold nanoparticles (AuNPs) have recently attracted significant attention due to their versatile chemical, electrical and optical properties,1–5 making them promising for advanced technologies such as sensors,6,7 optoelectronics,8 biomedical devices,9 thermoelectrics10 and others.11,12 The nanoparticles act as nanoscale contact electrodes, and various molecules can be attached to the nanoparticles via anchoring groups.8 The properties of the network can be tailored by controlling the nanoparticle size and modifying the organic matrix. A wide range of anchor groups have been investigated in self-assembled monolayers (SAMs) studies, but the dominant systems in the literature are superlattice structures formed from AuNPs encapsulated with thiols.13 Despite the availability of significant data on the synthesis, assembly and structure of thiol-functionalized AuNPs, only fundamental concepts have been demonstrated so far. Further improvement of device electrical performance is crucial in developing the next generation of nanodevices, with valuable real-world function.In this work, we explore the incorporation of a new set of dithioacetate (di(SAc))-terminated molecules into SAM AuNPs. The structures of these molecules consist of α-ter-, α-bi-thiophene and phenyl central moieties connected to alkyl chains as illustrated in Fig. 1. Single molecule studies have shown that molecular conductance is largely influenced by electronic structure of the molecule.14–16 Thus, we chose these three different central units on the basis of their extent of delocalization, ranging from a less conjugated phenyl-based linker to a well-conjugated α-ter-thiophene moiety. The use of dithioacetate termini allows linkage to two different gold nanoparticles via strong S–Au covalent bonding, which helps improve compactness and robustness of the 2D array, and thus, the final conductance of the array.17 The electrical properties of these ligands have been previously explored, at the single-molecule level, providing a good reference for comparison to self-assembled monolayers of AuNPs experiments.18 In this study, the authors found that the presence of the conjugated moiety in the alkyl tunneling barrier facilitates transport through coupling to additional electronic states located on the thiol ending group, which gives a rise to resonance close to Fermi energy. The conductance of the molecules exhibited shallow dependence on the alkyl side chain lengths. Here, gold nanoparticles are initially stabilized by dodecanethiol (DDT), which is a poor conductor. We then exploit molecular place exchange to insert the di(SAc)-terminated molecules into self-assembled DDT-capped AuNPs. This approach is likely to preserve the size of nanoparticles and does not interfere with the structural order of the network.8,13,19 X-Ray Photoelectron spectroscopy (XPS) confirmed the successful insertion of di(SAc) into the 2D arrays. The room temperature conductance of a statistically large number of devices was measured in air before and after exchange. We observed that upon exchange, the conductance of the network increases by up to two orders of magnitude for the conjugated compounds. Experiment and theory were employed to understand the conductance behavior of the di(SAc) compounds. We find that the single-molecule central unit effects can be translated into SAMs of AuNPs. The presence of conjugated central unit in the molecular backbone influences the S–Au coupling and therefore the final conductance of the array. The magnitude of the conductance increase depends on the nature of the conjugated part. This offers an excellent platform for building nanoscale molecular devices that mimic the electronic transport characteristics observed at the single molecule – level. The stability of these networks in air also offers the potential for building robust and efficient molecular junctions.
Experimental
Synthesis of organophilic AuNPs and functionalisation
Organophilic AuNPs were synthesised by adding 10 mg of gold chloride hydrate (HAuCl4)·3H2O (99.9%, Sigma Aldrich) to a mixture (1![[thin space (1/6-em)]](https://www.rsc.org/images/entities/char_2009.gif) :
:![[thin space (1/6-em)]](https://www.rsc.org/images/entities/char_2009.gif) 1 v/v) of oleylamine (technical grade, 70%, Merk) 1.5 mL and anhydrous toluene (99.8%, Sigma Aldrich) 1.5 mL. The mixture was heated at 200 °C for 45 min. After the completion of the reaction, which is evident by the formation of a dark red colour, methanol was added to the mixture, then the nanoparticles were separated by centrifugation and thoroughly washed with methanol or ethanol at least four times in order to remove any excess of surfactants (OAm). The AuNPs were subsequently solubilised in hexane (anhydrous, 95%, Sigma Aldrich). 100 μL of 1-dodecanethiol (≥98%, Sigma Aldrich) was added to the hexane dispersion of oleylamine-capped AuNPs. The resulting solution was stored in a fridge for 3 days to precipitate (black solid). The precipitate was collected by centrifugation, washed with methanol and dried in a vacuum desiccator. The product was then redispersed in hexane.
1 v/v) of oleylamine (technical grade, 70%, Merk) 1.5 mL and anhydrous toluene (99.8%, Sigma Aldrich) 1.5 mL. The mixture was heated at 200 °C for 45 min. After the completion of the reaction, which is evident by the formation of a dark red colour, methanol was added to the mixture, then the nanoparticles were separated by centrifugation and thoroughly washed with methanol or ethanol at least four times in order to remove any excess of surfactants (OAm). The AuNPs were subsequently solubilised in hexane (anhydrous, 95%, Sigma Aldrich). 100 μL of 1-dodecanethiol (≥98%, Sigma Aldrich) was added to the hexane dispersion of oleylamine-capped AuNPs. The resulting solution was stored in a fridge for 3 days to precipitate (black solid). The precipitate was collected by centrifugation, washed with methanol and dried in a vacuum desiccator. The product was then redispersed in hexane.
Fabrication of the 2D network and molecular exchange
2D arrays of DDT-coated AuNPs were prepared at the air/water interface. The assembly was carried out in a Teflon beaker, which provides slightly convex water surface. Typically, a few drops of the hexane (∼300 μL) solution containing DDT-capped AuNPs were spread on the water surface using a pipette. During the evaporation of hexane, DDT capped AuNPs arrange themselves into a close-packed array. The array was then transferred to a SiO2(400 nm)/Si substrate (the substrate is 1 × 1 cm consisting of 80 pairs of interdigitated (ID) electrodes with 1 μm interelectrode spacing) by micro-contact printing using a poly-dimethylsiloxane (PDMS) stamp. The stamp was blow-dried with a nitrogen gun prior to stamping to ensure all water droplets were removed. The investigated di(SAc) molecules (for synthesis and characterisation details of the di(SAc) molecules, see ESI†) were introduced into the arrays by place exchange. To achieve this, samples were immersed in a 2 μM solution of the incoming molecule in hexane over the course of 5–15 days. Samples were then taken out of solution and dried with N2 gas for electrical measurements.Characterisation
The IV measurements were performed on a TTPX probe station in air and at room temperature. Measurements of the temperature dependence of electrical properties of the arrays were done using Cryogen free high field system between 300 K and 3 K.UV-Vis absorption spectra were measured using a Shimadzu UV-2600 spectrometer, in the range 200–800 nm and with 2 nm resolution. Dynamic light scattering (DLS) measurements of the nanoparticles in hexane were carried out using Malvern Panalytical ZetaSizer Ultra. Samples for Transmission Electron Microscopy (TEM) were prepared by placing a drop of AuNPs/DDT solution (∼1 μL) on a carbon coated copper grid. TEM was performed using a JEOL-JEM 1230 TEM.
XPS measurements were conducted using a Thermo Fisher Scientific Nexsa XPS. All data were acquired using monochromatic Al Kα X-rays (1486.6 eV), with a pass energy of 25 eV. No considerable sample charging was observed. Charge referencing was done against adventitious carbon (C 1s, 284.6 eV). Fitting of the experimental peaks was performed using Thermo Scientific Avantage software. Peak fitting was done using mixed Gaussian/Lorentzian peak shapes and Smart type background substruction.
UPS experiment was conducted on Thermo Fisher Scientific Nexsa XPS. UPS spectra were obtained with a He lamp, He I of hv = 21.2 eV and I = 60 mA. To separate the secondary edges of the sample and analyser, a potential of 10 V was applied to the sample. The spectra were recorded in the range from −0.78 to 21.2 eV, with energy step size of 0.05 eV, pass energy of 2 eV, and dwell time of 50 ms.
Results and discussion
Characterisation of functionalised AuNPs and assembly
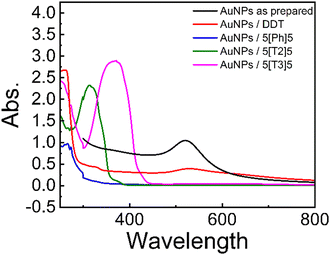
As-prepared AuNPs exhibit a surface plasmon resonance (SPR) peak at about 521 nm in the UV-Vis spectra (Fig. 2).The SPR peak of AuNPs shifts to slightly longer wavelength ∼530 nm after the addition of DDT. In contrast, AuNPs with the di(SAc)-terminated compounds exhibit blue shift with characteristic absorption peaks at 368 nm, 315 nm, and 267 nm for 5[T3]5 and 5[T2]5 and 5[Ph]5, respectively. These are also consistent with the presence of α-ter- and α-bi thiophene,20 and phenyl moieties within these molecules. The observed hyperchromic shift for the solutions containing 5[T3]5 and 5[T2]5 may be attributed to extended pi-conjugation. The absence of a SPR band in the UV-vis spectra for the di(SAc) compounds may indicate that the surface electrons could be localised, as may be expected from the strong Au–S covalent bonding.
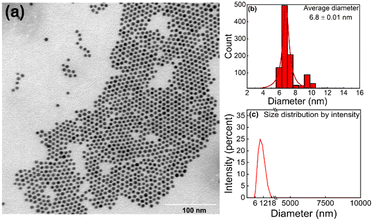
The formation of ordered monolayers of AuNPs was confirmed by TEM. Fig. 3a shows a TEM micrograph of a monolayer of spherical AuNPs coated with DDT. AuNPs form large areas of close packed hexagonal arrays, where one particle is surrounded symmetrically by six other particles. The average size of gold nanoparticles in the 2D array is 6.8 nm (Fig. 3b), and the average centre-to-centre distance between two adjacent nanoparticles is 8.7 nm. The average gap between two nanoparticles is 1.9 nm, which is very close to the length of the DDT tail ∼1.7 nm. The narrow size distribution was also confirmed by DLS measurements (Fig. 3c). The as-prepared AuNP shows only one peak with a narrow distribution, suggesting a monodispersed AuNP suspension with no agglomeration (no other peaks can be detected up to 10![[thin space (1/6-em)]](https://www.rsc.org/images/entities/char_2009.gif) 000 nm). The intensity-weighted average particle diameter (∼11 nm) is slightly greater than the value obtained from TEM. The difference can be rationalised by DLS being a technique sensitive to coordinated ligands and surfactant and therefore providing a fundamentally different measure of particle size.
000 nm). The intensity-weighted average particle diameter (∼11 nm) is slightly greater than the value obtained from TEM. The difference can be rationalised by DLS being a technique sensitive to coordinated ligands and surfactant and therefore providing a fundamentally different measure of particle size.
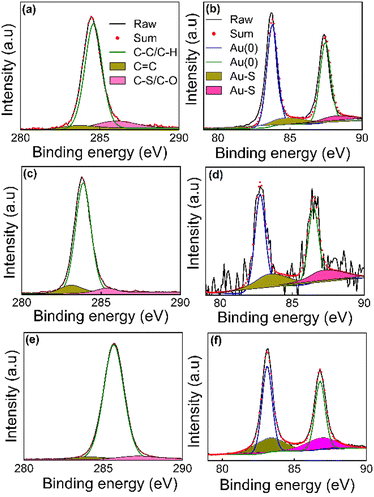
XPS was used to probe the surface chemistry of the functionalised AuNPs after molecular replacement with the di(SAc) compounds. Full survey spectra were recorded and the signals for C 1s and Au 4f are presented in Fig. 4. Meanwhile O 1s, and S 2p signals can be found in the ESI† (Fig. S1). The sets of binding energy positions for C 1s and Au 4f core levels are given in Table S1 (ESI†). In all samples, the C 1s XPS peaks were deconvoluted into 3 peaks using a Gaussian–Lorentzian peak profile. The binding energy of the C–C and C–H chemical bonds are assigned at 283.88–285.67 eV. The chemical shifts to higher binding energy values 285.92–287.19 eV are due to C–S or C–O/C![[double bond, length as m-dash]](https://www.rsc.org/images/entities/char_e001.gif) O species.21–23 The observed peak positions situated near 283 eV represent the sp2 hybridized state of carbon atoms (the binding energy of a π bond is normally ∼1 eV less than the binding energy of a σ bond).24 Two major peaks due to two spin–orbit components Au 4f7/2 and Au 4f5/2 at ∼82.70–84.19 eV and 86.50–88.02 eV, respectively, were observed. These values match well to reference binding energies of metallic AuNPs with a zero oxidation state.25–28 The curve-fitting of the Au 4f components manifests another contribution at higher binding energy values (∼+1 ev, Table S1, ESI†), which can be associated with gold atoms that are covalently bound to sulfur.23 The sulfur in all samples shows weak, broad signals, in the range 160–170 eV (ESI† Fig. S1), signalling a very thin adsorbed layer of the organic molecule. We found S 2p doublets for all the SAMs at binding energies ∼161–163 eV, which are in agreement with the values that are usually observed for various sulfur species bound to the surface of gold.29,30 A second S 2p doublet was observed at the position 164–165 eV in the samples prepared using 5[T2]5 and 5[T3]5, representing the thiophene moiety within the structure of these molecules that is not bound to gold.31 However, the 5[Ph]5 coated samples showed S 2p doublets at higher binding energies 167–168 eV, which may be attributed to oxidized sulfur, such as in sulfones or sulfoxides arising from possible reactions related to water contamination.
O species.21–23 The observed peak positions situated near 283 eV represent the sp2 hybridized state of carbon atoms (the binding energy of a π bond is normally ∼1 eV less than the binding energy of a σ bond).24 Two major peaks due to two spin–orbit components Au 4f7/2 and Au 4f5/2 at ∼82.70–84.19 eV and 86.50–88.02 eV, respectively, were observed. These values match well to reference binding energies of metallic AuNPs with a zero oxidation state.25–28 The curve-fitting of the Au 4f components manifests another contribution at higher binding energy values (∼+1 ev, Table S1, ESI†), which can be associated with gold atoms that are covalently bound to sulfur.23 The sulfur in all samples shows weak, broad signals, in the range 160–170 eV (ESI† Fig. S1), signalling a very thin adsorbed layer of the organic molecule. We found S 2p doublets for all the SAMs at binding energies ∼161–163 eV, which are in agreement with the values that are usually observed for various sulfur species bound to the surface of gold.29,30 A second S 2p doublet was observed at the position 164–165 eV in the samples prepared using 5[T2]5 and 5[T3]5, representing the thiophene moiety within the structure of these molecules that is not bound to gold.31 However, the 5[Ph]5 coated samples showed S 2p doublets at higher binding energies 167–168 eV, which may be attributed to oxidized sulfur, such as in sulfones or sulfoxides arising from possible reactions related to water contamination.
Electrical transport measurements
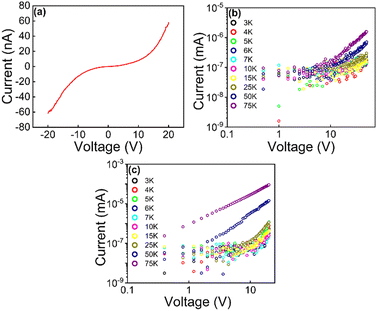
One major motivation behind the current study is to provide insight into charge transport through SAMs of AuNPs interlinked by di(SAc)-terminated molecules. In contrast to single molecule junction studies, statistics of experimental conductance of self-assembled monolayers of molecule–metal–molecule are rare in the literature. In this work, room-temperature conductance histograms were constructed from individual current–voltage (IV) traces. Control measurements on a bare device and on the di(SAc) molecules without AuNPs are provided in ESI† Fig. S2 and S3, respectively. All devices exhibited non-linear IV characteristics over the ±20 V bias range, as shown in Fig. 5a for a typical device. The exponential increase of current, with increasing bias, is consistent with a tunnelling mechanism of charge transport through the nanoparticle–molecule junctions.32,33 To test this assumption, the temperature dependence of conductance was evaluated for AuNPs coated with DDT and 5[Ph]5. Fig. 5b and c reveal that at low temperatures, both arrays showed a clear voltage threshold for conduction, signalling strong Coulomb blockade of transport.34 Additional current paths are opened at voltages beyond the threshold, leading to linear IV behaviour in which sequential transport is the dominant mechanism. Fig. 5b and c also show that as the temperature rises, the threshold for lifting the blockade regime shifts to lower voltage.Room-temperature conductance histograms for the self-assembled AuNP pre-exchange (coated with DDT) and post exchange for 5[Ph]5 (37 devices), 5[T3]5 (63 devices) and 5[T2]5 (63 devices) are presented in Fig. 6. The conductance values of all devices were calculated by determining the slope of the linear region of the IV curve. The investigated molecular wires are different on the basis of their extent of conjugation electron density, which in turn affects molecular conductance. Table 1 summarises the average conductance of the investigated molecules before and after exchange, obtained from fitting the histograms to Gaussian functions. AuNP/DDT has an average conductance value in the order of pS. The slight sample to-sample variation in AuNP/DDT monolayers may be due to changes in the network topology. The average conductance value increased one order of magnitude and reached saturation after 5 days’ replacement with molecule 5[Ph]5 ∼ 2.96 × 10⁻¹¹ S. Meanwhile, we observed a two orders of magnitude increase for the larger molecules 5[T2]5 and 5[T3]5 after 15 days’ replacement. The highest average conductance is observed for AuNPs cross-linked with 5[T2]5.
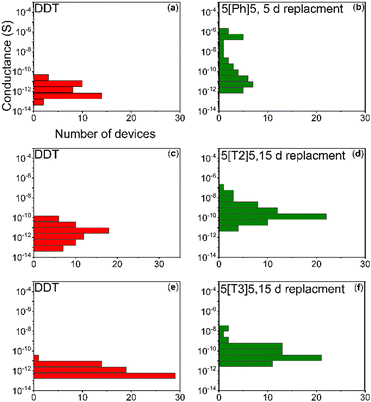 | ||
| Fig. 6 Conductance of SAM AuNPs versus occurrence in a log-normal histogram pre-exchange (a, c and e) and post-exchange for 5[Ph]5 (b), 5[T2]5 (d) and 5[T3]5 (f). | ||
| Sample | Pre-exchange | 17 h exchange | 5 d exchange | 15 d exchange |
|---|---|---|---|---|
| Conductance was obtained from Gaussian fits to conductance histograms. The conductance histograms for 17 h and 5 days’ replacement are provided in ESI Fig. S4. | ||||
| 5[Ph]5 | 1.89 × 10⁻¹² | 2.83 × 10⁻¹² | 2.96 × 10⁻¹¹ | — |
| 5[T2]5 | 7.06 × 10⁻¹² | — | — | 7.09 × 10⁻¹⁰ |
| 5[T3]5 | 4.87 × 10⁻¹² | — | 1.25 × 10⁻¹¹ | 1.003 × 10⁻¹⁰ |
Electronic structure and theoretical conductance
Experiment and theory were combined to understand the conductance behaviour of the AuNPs/di(SAc) SAMs. The surface electronic structure of the materials was probed using UPS, which allows a direct measure of the work function and valence band maxima (HOMO) of materials. UPS spectra of all SAMs are shown in Fig. 7a. The work function is extracted from the difference between the incident UV photon energy (21.21 eV) and the binding energy of the secondary electron edge (SEE) at the high binding energy region of the UPS spectra (determined by a linear extrapolation of the secondary electron cutoff), taking into account that the Fermi energy is set to zero binding energy. As illustrated in Fig. 7b, in all cases, the work functions of the SAMs are lower than that of bulk Au (5.2 eV). The replacement of DDT (work function = 5.04 eV) with 5[Ph]5, 5[T2]5 and 5[T3]5 decreases the work function to 4.43 eV, 4.93 eV and 4.86 eV respectively. This means that the electron injection barrier in to the LUMO level is reduced for the di(SAc) compounds. The optical band gap is evaluated using the equation Eg = 1240/λedg (nm), where λedg is the onset value of the absorption spectrum (UV-Vis) at the long wavelength region. The LUMO position is then determined from the HOMO and band gap value. Table 2 provides a summary of the band structure and energy levels for the investigated SAMs. The location of the energy levels of the molecule relative to the Fermi energy of the metallic contact is an important factor in determining the conductance of molecular arrays. Therefore, based on the obtained values, we reconstructed a band structure for the compounds used in this study, as shown in Fig. 7c. The band model scheme demonstrates that the Fermi level of gold lies between HOMO–LUMO gap for all molecules. It also predicts that the HOMO level of the 5[T2]5 compound is closer to Au Fermi energy, which may explain its enhanced conductance. Density functional theory (DFT) was used to compute electrical conductance and explore the interplay between electrical conductance of different molecular wires and their central moiety. We first perform the geometry optimisation of molecules between gold electrodes using the SIESTA35 implementation of DFT to obtain the ground-state mean-field Hamiltonian and overlap matrix elements. These results were then combined with the Gollum.36,37 Implementation of the nonequilibrium Green's function method was used to compute the electrical conductance of the junctions (see further details in ESI†).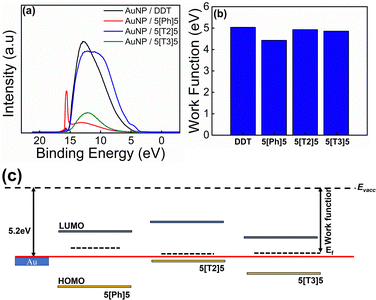 | ||
| Fig. 7 (a) UPS spectra of DDT and di(SAc) SAMs. (b) The extracted work functions. (c) Schematic of the electronic structure of the investigated SAMs. | ||
| Sample | E g | E f | HOMO | LUMO |
|---|---|---|---|---|
| The HOMO edge position is obtained by a linear extrapolation at the low binding energy cutoff region of the UPS spectra. | ||||
| 5[Ph]5 | 4.20 | 4.43 | 7.21 | 3.01 |
| 5[T2]5 | 3.46 | 4.93 | 5.35 | 1.89 |
| 5[T3]5 | 2.94 | 4.86 | 6.26 | 3.32 |
The presence of a central unit in the alkyl chain induces conformational changes, leading to various configurations and binding conformations to the electrodes, therefore modifying the electronic structure of the molecule.18 For this reason, we calculate the electrical conductance of five different energetically optimised binding configurations of each molecule as shown in Fig. 8. The relaxed molecular structure of the single molecular junction for 5[Ph]5, 5[T2]5 and 5[T3]5, as well as the average of electrical conductance values of five different configurations for each molecule, are shown in Fig. S5 (ESI†). Typically, the Fermi energy, EF, lies near the middle of the HOMO–LUMO gap, and comparing with the experimental trend our results suggest that EF falls within the highlighted region in the figure. The calculation with different binding configurations to electrodes for the di(SAc) molecules indicates that electron transport through the junctions varies according to the different configurations. The overall trend for the average conductance of different configurations agrees well with our experiment for a wide range of Fermi energies around DFT Fermi energy (5[T2]5 > 5[T3]5 > 5[Ph]5). The frontier molecular orbitals and energies are listed in Table S2 (ESI†). The predicted band gaps are in close agreement to our experimental values, however, the HOMO energy level of 5[T2]5 (−5.61 eV) is slightly higher than that of 5[T3]5 molecule (−5.36 eV). Generally, the frontier orbitals relative to the Fermi energy of Au contacts are not necessarily accurately determined by DFT calculations which, therefore, does not allow for a reliable comparison with the experimental HOMO energy levels obtained from UPS. Furthermore, discrepancy between experiment and theory might originate from the interactions with other molecules and nanoparticles in the assembly, which is lacking in the single molecule calculations. Clearly, different molecule–electrode contact geometries lead to large variations in electrical conductance. This is because the electronic coupling between Au–S and central group is significantly affected by the confirmation of molecule.
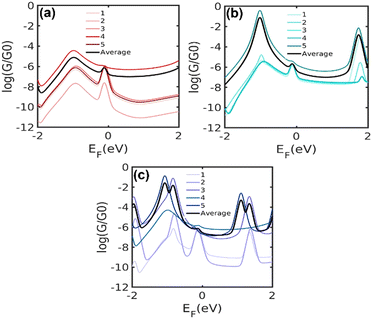 | ||
| Fig. 8 Calculated conductance of the molecule: (a) 5[Ph]5, (b) 5[T2]5 and (c) 5[T3]5 connected to electrodes using five different configurations. | ||
Conclusions
We have successfully incorporated di(SAc)-terminated molecules into self-assembled arrays of DDT-functionalised AuNPs. Cross-linking and conjugation are proposed as a viable way to improve charge-transport efficiency. The final conductance is enhanced by up to two orders of magnitude for the di(SAc)-terminated molecules. The results demonstrate that the single-molecule central unit effects can be translated into ordered 2D assemblies of AuNPs. The presence of conjugated moieties in the alkyl chain affects the final conductance of the array, the magnitude of which depends on the nature of the central unit. This work extends the field by exploring a new series of dithioacetate di(SAc) molecules and provides insight into their electronic behaviour.Author contributions
M. A. and J. A. M. conceived and designed the experiments. A. V. synthesised the organic molecules and characterised them. M. A. synthesised the samples, fabricated devices and performed structural and electrical characterisation with the help of J. B. and E. P. A. D., S. S. and H. S. developed the theoretical explanation, and A. D. performed the calculations. M. A. analysed the results with the help of A. V., S. J. H. and J. A. M. M. A. wrote the manuscript with the help of all co-authors.Conflicts of interest
The authors declare no competing interests.Acknowledgements
J. A. M. was supported through the UKRI Future Leader Fellowship, Grant No. MR/S032541/1, with in-kind support from the Royal Academy of Engineering. M. A. acknowledges the NanoVision Centre at QMUL for using the TEM facility.References
- C. B. Murray, C. R. Kagan and M. G. Bawendi, Annu. Rev. Mater. Sci., 2000, 30, 545–610 CrossRef CAS.
- D. V. Talapin, J. S. Lee, M. V. Kovalenko and E. V. Shevchenko, Chem. Rev., 2010, 110, 389–458 CrossRef CAS PubMed.
- B. Pelaz, S. Jaber, D. J. de Aberasturi, V. Wulf, T. Aida, J. M. de la Fuente, J. Feldmann, H. E. Gaub, L. Josephson, C. R. Kagan, N. A. Kotov, L. M. Liz-Marzan, H. Mattoussi, P. Mulvaney, C. B. Murray, A. L. Rogach, P. S. Weiss, I. Willner and W. J. Parak, ACS Nano, 2012, 6, 8468–8483 CrossRef CAS PubMed.
- Z. H. Nie, A. Petukhova and E. Kumacheva, Nat. Nanotechnol., 2010, 5, 15–25 CrossRef CAS PubMed.
- M. C. Daniel and D. Astruc, Chem. Rev., 2004, 104, 293–346 CrossRef CAS PubMed.
- S. Q. Liu and Z. Y. Tang, J. Mater. Chem., 2010, 20, 24–35 RSC.
- J. H. Liao, J. S. Agustsson, S. M. Wu, C. Schonenberger, M. Calame, Y. Leroux, M. Mayor, O. Jeannin, Y. F. Ran, S. X. Liu and S. Decurtins, Nano Lett., 2010, 10, 759–764 CrossRef CAS PubMed.
- J. H. Liao, S. Blok, S. J. van der Molen, S. Diefenbach, A. W. Holleitner, C. Schonenberger, A. Vladyka and M. Calame, Chem. Soc. Rev., 2015, 44, 999–1014 RSC.
- Q. Chen, X. D. Liu, J. F. Zeng, Z. P. Cheng and Z. Liu, Biomaterials, 2016, 98, 23–30 CrossRef CAS PubMed.
- W. B. Chang, B. Russ, V. Ho, J. J. Urban and R. A. Segalman, Phys. Chem. Chem. Phys., 2015, 17, 6207–6211 RSC.
- H. Wang, L. Yao, X. Mao, K. Wang, L. Zhu and J. Zhu, Nanoscale, 2019, 11, 13917–13923 RSC.
- T. Taguchi, K. Isozaki and K. Miki, Adv. Mater., 2012, 24, 6462–6467 CrossRef CAS PubMed.
- L. Srisombat, A. C. Jamison and T. R. Lee, Colloids Surf., A, 2011, 390, 1–19 CrossRef CAS.
- E. Leary, S. J. Higgins, H. van Zalinge, W. Haiss, R. J. Nichols, S. Nygaard, J. O. Jeppesen and J. Ulstrup, J. Am. Chem. Soc., 2008, 130, 12204–12205 CrossRef CAS PubMed.
- X. Xiao, B. Xu and N. J. Tao, Nano Lett., 2004, 4, 267–271 CrossRef CAS.
- M. P. Samanta, W. Tian, S. Datta, J. I. Henderson and C. P. Kubiak, Phys. Rev. B: Condens. Matter Mater. Phys., 1996, 53, R7626–R7629 CrossRef CAS PubMed.
- J. Liao, M. A. Mangold, S. Grunder, M. Mayor, C. Schönenberger and M. Calame, Journal, 2008, 10, 065019 Search PubMed.
- S. Sangtarash, A. Vezzoli, H. Sadeghi, N. Ferri, H. M. O'Brien, I. Grace, L. Bouffier, S. J. Higgins, R. J. Nichols and C. J. Lambert, Nanoscale, 2018, 10, 3060–3067 RSC.
- L. Bernard, Y. Kamdzhilov, M. Calame, S. J. van der Molen, J. H. Liao and C. Schonenberger, J. Phys. Chem. C, 2007, 111, 18445–18450 CrossRef CAS.
- K. Wang, A. Vezzoli, I. M. Grace, M. McLaughlin, R. J. Nichols, B. Q. Xu, C. J. Lambert and S. J. Higgins, Chem. Sci., 2019, 10, 2396–2403 RSC.
- Y. Joseph, I. Besnard, M. Rosenberger, B. Guse, H. G. Nothofer, J. M. Wessels, U. Wild, A. Knop-Gericke, D. S. Su, R. Schlogl, A. Yasuda and T. Vossmeyer, J. Phys. Chem. B, 2003, 107, 7406–7413 CrossRef CAS.
- D. J. Morgan, C, 2021, 7, 51 CAS.
- F. Vitale, I. Fratoddi, C. Battocchio, E. Piscopiello, L. Tapfer, M. V. Russo, G. Polzonetti and C. Giannini, Nanoscale Res. Lett., 2011, 6, 9 CrossRef PubMed.
- T. R. Gengenbach, G. H. Major, M. R. Linford and C. D. Easton, J. Vac. Sci. Technol., A, 2021, 39, 013204 CrossRef CAS.
- M. C. Bourg, A. Badia and R. B. Lennox, J. Phys. Chem. B, 2000, 104, 6562–6567 CrossRef CAS.
- L. Mohrhusen and M. Osmic, RSC Adv., 2017, 7, 12897–12907 RSC.
- Z. Y. Huo, C. K. Tsung, W. Y. Huang, X. F. Zhang and P. D. Yang, Nano Lett., 2008, 8, 2041–2044 CrossRef CAS PubMed.
- R. Radnik, C. Mohr and P. Claus, Phys. Chem. Chem. Phys., 2003, 5, 172–177 RSC.
- D. G. Castner, K. Hinds and D. W. Grainger, Langmuir, 1996, 12, 5083–5086 CrossRef CAS.
- S. Zhang, G. Leem and T. R. Lee, Langmuir, 2009, 25, 13855–13860 CrossRef CAS PubMed.
- T. M. Jiang, W. Malone, Y. F. Tong, D. Dragoe, A. Bendounan, A. Kara and V. A. Esaulov, J. Phys. Chem. C, 2017, 121, 27923–27935 CrossRef CAS.
- R. Parthasarathy, X. M. Lin and H. M. Jaeger, Phys. Rev. Lett., 2001, 87, 186807 CrossRef.
- K. Elteto, X.-M. Lin and H. M. Jaeger, Phys. Rev. B: Condens. Matter Mater. Phys., 2005, 71, 205412 CrossRef.
- T. B. Tran, I. S. Beloborodov, J. Hu, X. M. Lin, T. F. Rosenbaum and H. M. Jaeger, Phys. Rev. B: Condens. Matter Mater. Phys., 2008, 78, 075437 CrossRef.
- J. M. Soler, E. Artacho, J. D. Gale, A. García, J. Junquera, P. Ordejón and D. Sánchez-Portal, J. Phys.: Condens. Matter, 2002, 14, 2745–2779 CrossRef CAS.
- H. Sadeghi, Nanotechnology, 2018, 29, 373001 CrossRef PubMed.
- J. Ferrer, C. Lambert, V. Garcia-Suarez, D. Manrique, D. Visontai, L. Oroszlany, R. Rodriguez-Ferradas, I. Grace, S. Bailey, K. Gillemot, H. Sadeghi and L. Algharagholy, New J. Phys., 2014, 16, 093029 CrossRef.
Footnote |
| † Electronic supplementary information (ESI) available. See DOI: https://doi.org/10.1039/d3tc00145h |
| This journal is © The Royal Society of Chemistry 2023 |

