
A marvel of chiral squaraine aggregates: chiroptical spectra beyond the exciton model†
Davide
Giavazzi‡
 a,
Marvin F.
Schumacher‡
b,
Luca
Grisanti
c,
Mattia
Anzola
a,
Francesco
Di Maiolo
a,
Jennifer
Zablocki
b,
Arne
Lützen
b,
Manuela
Schiek
*d and
Anna
Painelli
*a
a,
Marvin F.
Schumacher‡
b,
Luca
Grisanti
c,
Mattia
Anzola
a,
Francesco
Di Maiolo
a,
Jennifer
Zablocki
b,
Arne
Lützen
b,
Manuela
Schiek
*d and
Anna
Painelli
*a
aDepartment of Chemistry, Life Science and Environmental Sustainability, Parma University, Parco Area delle Scienze 17/A, 43124 Parma, Italy. E-mail: anna.painelli@unipr.it
bKekulé-Institute for Organic Chemistry and Biochemistry, University of Bonn, Gerhard-Domagk-Str. 1, D-53121 Bonn, Germany
cDivision of Theoretical Physics, Ruđer Bošković Institute, Bijenićka cesta 54, 10000 Zagreb, Croatia
dCenter for Surface- and Nano-Analytics (ZONA), Institute for Physical Chemistry (IPC) and Linz Institute for Organic Solar Cells (LIOS), Johannes Kepler University, Altenberger Str. 69, A-4040 Linz, Austria. E-mail: manuela.schiek@jku.at
First published on 18th May 2023
Abstract
Squaraines are quadrupolar molecular dyes forming aggregates with remarkable structure-correlated excitonic properties within the visible to near-infrared spectral range. Upon chiral functionalization a chiroptical response such as circular dichroism is an additional spectroscopic feature. We provide a combined experimental and theoretical survey on chiral aggregates dispersed in a solution of proline-derived anilino squaraines (ProSQs) with varying terminal alkyl chain length (C3 to C12 and C16) directing the aggregation. Different aggregation scenarios with characteristic spectroscopic features appear, intricately depending on the alkyl chain length: concomitant blue- and red-shifted spectroscopic signatures both within the linear and circular absorption for intermediate chain length, and a scenario with dominating blue-shifted signatures for shorter and longer alkyl chain length. Molecular dynamics (MD) simulations on the aggregate structure return the opposite handedness suggesting kinetic control in the experiments. Two modified essential state models (ESM) are applied to calculate the optical spectra with prescribed geometric parameters: a model accounting for just electrostatic intermolecular interactions (ESM-ES) suggests two concomitant aggregates to explain the simultaneous blue- and red-shifted spectral signatures while a model including intermolecular charge transfer (ESM-CT) returns both features for a single aggregate. Due to the complexity of the calculation this is the first time an explicit expression for calculating circular dichroism including intermolecular charge transfer is rendered. However, the ESM-CT model is still limited to tetramers, so finite size effects such as disorder are not fully captured. This could be the reason why the ESM-CT does not reproduce the scenario with dominant blue-shifted spectral signatures. We demonstrate that a dimeric model is sufficient to describe linear absorption but fails for chiroptical properties. Furthermore, a superlinear amplification of circular dichroism intensity with increasing aggregate size is noted for both models. This adds value to the application potential for chiral squaraine aggregates.
10th Anniversary StatementIt is a pleasure to contribute a paper to the special issue dedicated to the 10th anniversary of the Journal of Materials Chemistry C, a journal that offers a vibrant publication environment for outstanding papers in materials science. The journal has a wide reader audience, reaching chemists and physicists, as well as bona fide materials scientists. A pool of distinguished authors and reviewers contributes to maintaining high standards. Interactions with Editors are easy and rewarding in several respects. Overall, our experiences with the Journal of Materials Chemistry C as authors, reviewers and special issue Editors have been pleasant and fruitful. Many happy returns! |
1 Introduction
Squaraine dyes represent a well known and widely investigated family of organic chromophores with unique spectral properties.1–10 They are characterized by a rigid inner core, a squaraine ring, with a strong electron affinity and, typically, two equivalent electron-donating groups are attached to the inner core in a centrosymmetric D–A–D structure. Asymmetrically substituted squaraines also have interesting properties,11,12 but will not be discussed here. So called quadrupolar DAD (or ADA) dyes are often unstable towards symmetry breaking either in the excited state (class I quadrupolar dyes) or in the ground state (class III quadrupolar dyes), a phenomenon that shows up most clearly in fluorescence or absorption solvatochromism, respectively.4 Squaraines are the most famous representative of the elusive family of quadrupolar dyes of class II, and resist symmetry breaking in either the ground or excited state, as a result of strong conjugation among the D and A molecular moieties. They show intense, narrow and marginally solvatochromic absorption and fluorescence bands, typically in the red portion of the spectrum, that can be moved to the near infrared region by a judicious choice of the D groups.13–16 Moreover, at roughly twice the energy of linear absorption, a state is found, dark to linear absorption, but with a large (resonantly enhanced) two photon cross-section.4 Squaraine dyes are investigated and exploited for NLO applications,2 bioimaging,17 biosensing18 and photodynamic therapy.19,20 Another interesting applicative field for squaraine dyes is found in solar cells,21–23 where, however, most interesting results are obtained with squaraine aggregates that show an amazing panchromatic absorbance spectrum.16,24–31Squaraine aggregates are fascinating systems, attracting interest not just for their panchromatic spectrum, but also for amplified NLO responses,32 and for large chiral responses.33–35 Modeling squaraine aggregates is challenging as the intertwined role of electrostatic (ES) intermolecular interactions, intra and intermolecular charge transfer (CT) and disorder must be taken into account. In a series of papers,30,36–38 Spano and Collison first proposed that the panchromatic absorption spectrum of squaraine aggregates is due to intermolecular CT interactions, a hypothesis recently supported by detailed spectroscopic measurements in squaraine crystals.39 The same hypothesis was very recently challenged in a paper where linear absorption and pump–probe spectra of squaraine aggregates are discussed in the framework of a disordered exciton model.40
In this complex and intriguing scenario, we address chiroptical properties of chiral aggregates of squaraine dyes. Specifically, the next chapter describes experimental data collected on a family of anilino squaraine dyes decorated with chiral pendants bearing alkyl chains of different length. The dyes aggregate in solution forming chiral superstructures that, depending on the length of the terminal alkyl chain, show distinctively different behavior. Aggregates of dyes decorated with alkyl chains with intermediate length (from C6 to C10) show two features in the absorbance spectra: the first one at 500–550 nm is located towards the blue with respect to the monomer absorption (at 640 nm) the second one, in the 700–800 spectral region, is strongly red-shifted vs. the monomer absorption. Quite interestingly, a bisignated signal appears in the CD spectrum in the proximity of both absorption features. In aggregates formed by dyes with either shorter (C3–C5) or longer (C11, C12, and C16) pendants, instead, the absorption and CD features at long wavelength become extremely weak and almost disappear.
This complex experimental scenario will be discussed adopting an essential state model (ESM) approach,4 describing each SQ dye in terms of three basis states, leading to a molecular model that reliably describes the spectral properties of the isolated dye.4,41 A first model for the aggregate, the ESM-ES, is then built accounting just for ES interactions among the dyes, much as in the standard exciton model. In the ESM-ES approach, experimental data can be accounted for in terms of the coexistence of H and J aggregates in the system.
Following the original suggestion from Spano and Collison,30,36–38 the model is extended, in the ESM-CT version, to also account for intermolecular CT interactions, leading to the highly non-trivial problem of calculating CD spectra in an aggregate with electrons delocalized among different molecular units. Towards this aim, we release the spinless-Fermion approximation adopted by Spano and Collison and propose an explicit expression for the rotational strengths in aggregates with delocalized electrons. To the best of our knowledge, this is the first attempt in this direction. In the ESM-CT approach, the experimental observation of two features in absorption spectra and two exciton couplets in CD spectra can be rationalized accounting for a single aggregate structure, an appealing result, as it does not require the somewhat ad hoc hypothesis of two families of aggregates. However, the model cannot easily describe the behavior of systems with short or very long alkylic chains that show a single dominant feature either in absorption or CD spectra.
Extensive molecular dynamics (MD) simulations were run to shed light on these intriguing systems, with somewhat disappointing results: in the process we learned that reliable aggregate structures for these systems may require simulations accounting for a very large number of molecules, with computational efforts well beyond the scope of this work. While we hardly reach a firm conclusion on the structure of the chiral aggregates of squaraine dyes, our discussion sets the basis for a thorough understanding of the physics of chiral aggregates. Moreover, we can definitely exclude the origin of the two bands as related to a Davydov splitting. This result on colloidal aggregates is interesting as it also suggests that the panchromatic spectrum observed in SQ films cannot be ascribed to the Davydov splitting but requires a different explanation.
2 Data and experiment
2.1 Titration experiments
The different proline-derived squaraine dyes (ProSQs), which differ in the terminal alkyl chain length (C3 to C12 and C16), were investigated for their aggregation behavior in poor solvent titration experiments. The general synthesis approach and analytical details are given in the ESI,† and for both enantiomers of C6 and C16 compounds can be found in ref. 34. For a titration experiment, a 2.30 × 10⁻⁴ M stock solution of each squaraine in a good solvent, here chloroform, is prepared. Afterwards, 50 μL of the stock solution is diluted by 2950 μL of poor solvent mixtures consisting of methanol with various water concentrations, varying from 0–40%. The colloidal solutions are mixed thoroughly and transferred to a 10 mm quartz cuvette (Hellma). UV/Vis transmission measurements were subsequently carried out using a Specord 200 spectrometer (Analytic Jena) with 0.5 nm step size and 5 nm s−1 scanning speed. Followed immediately by CD-spectroscopic measurements on a J-810 spectro-polarimeter (JASCO Corporation) with 1 nm step size, a scanning speed of 200 nm min−1, and a 1 nm bandwidth. An initial measurement of the pure solvent or solvent mixture was used for baseline correction. UV/Vis spectra are shown as absorbance = −log(transmission), which is for (colloidal) solution basically equivalent to absorption. The circular dichroism (CD) spectra are shown as ellipticity in units of milli degree (mdeg) as outputted from the spectro-polarimeter. Note that CD and ellipticity are not the same values but for small quantities ellipticity = CD/2.352.2 UV/Vis and CD measurements in solution
Experimental absorbance and CD spectra of colloidal (S,S)-ProSQ aggregates having an alkyl chain length of C5, C10 and C12 in varying ratios of the poor solvent methanol–water mixture are plotted in Fig. 1. These compounds are representative for the different aggregation regimes. Fig. S1 (ESI†) contains both enantiomers of the C7 compound to illustrate the inverted sign of the CD spectra, but otherwise identical spectral features. The spectra of all other available compounds (C3, C4, C6–C9, C11, C12 and C16) are given in the ESI† in Fig. S2 and S3. The C10 compound has an intermediate alkyl chain length and expresses two pronounced aggregate absorbance bands with two corresponding bisignate CD bands to the same extent, Fig. 1(c) and (d). These aggregate absorbance bands are blue- and redshifted with respect to the monomer absorbance band peaking at 640 nm. Both for the C5 and the C12 compound, the blue-shifted aggregate absorbance and CD features within the green spectral range are dominant, Fig. 1(a), (b), (e) and (f), respectively. The overall aggregation tendency increases with increasing chain length, which is indicated by the reduction of the molecular absorbance band already in the initial pure methanol solvent. Therefore, the predominant expression of blue-shifted spectral features is neither simply correlated with alkyl chain length nor with aggregation tendency. The dissolved molecular compounds do not have a corresponding CD feature since the stereogenic carbon atom is located on the pyrrolidine ring carrying the alkyl chain, and is not conjugated with the chromophoric squaraine backbone. The circular dichroism of the aggregate bands has an excitonic character and arises from the chiral arrangement of the squaraine backbones directed by the chiral alkyl chains.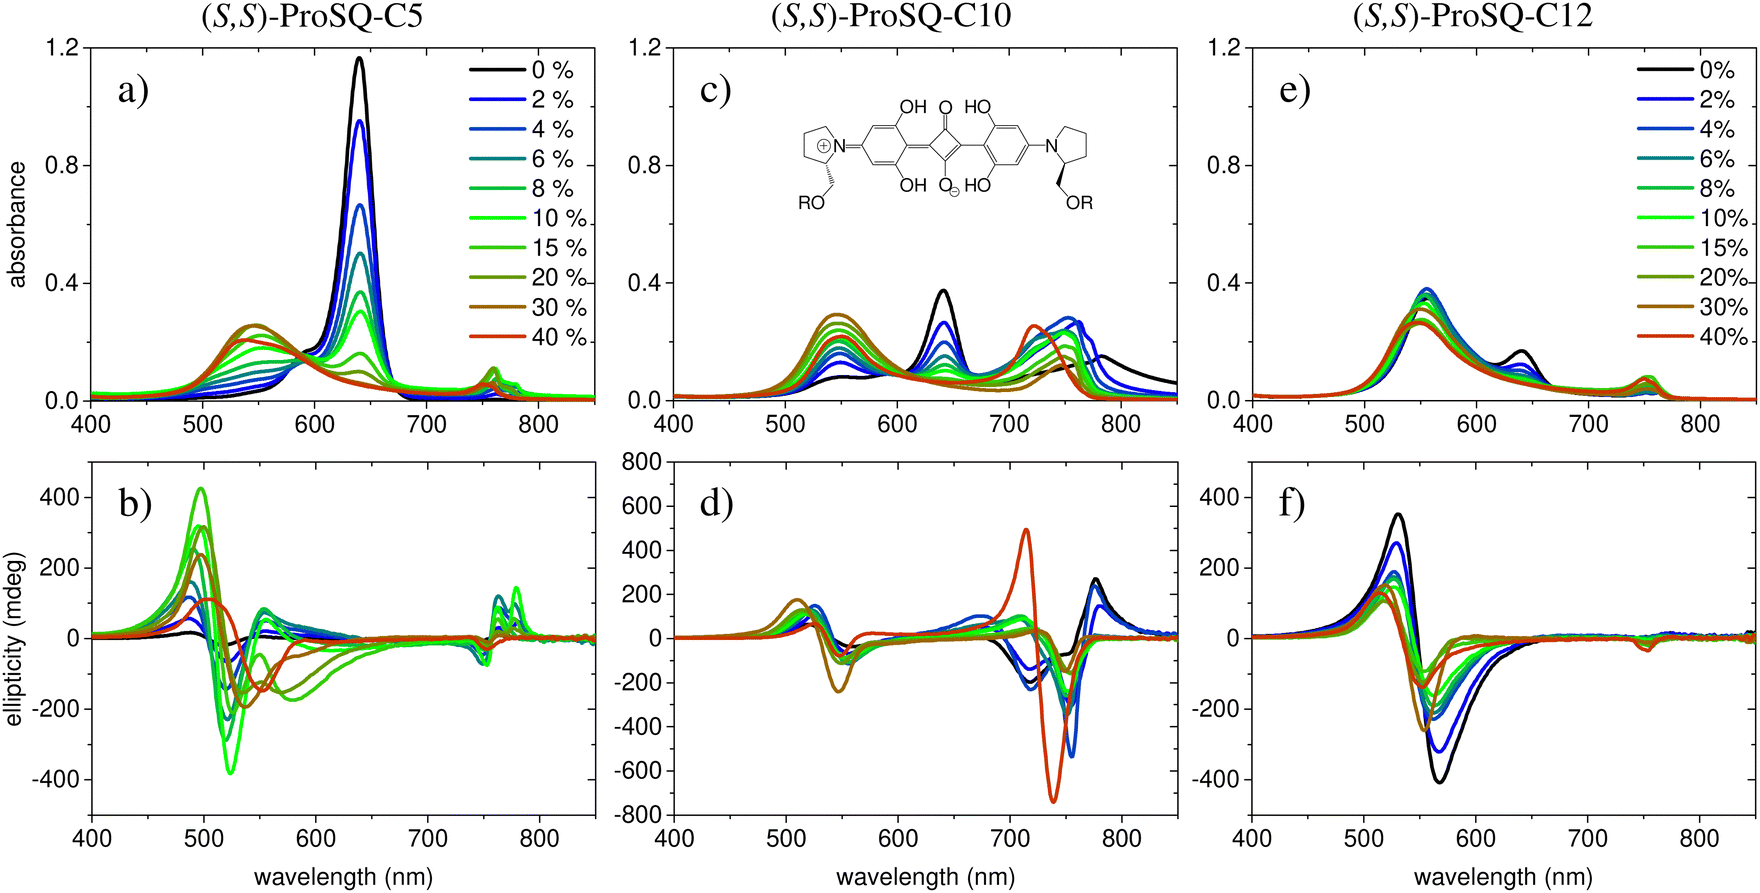 | ||
| Fig. 1 Experimental UV/Vis absorbance spectra (top row) and corresponding ellipticity spectra (bottom row) for selected (S,S)-ProSQ compounds with varying alkyl chain lengths: C5 in (a and b), C10 in (c and d), and C12 in (e and f). The inset in (c) sketches the molecular structure where R denotes the varying alkyl chain. The legend indicates the volume-percentage of water in the methanol–water mixture and applies to all plots. | ||
The two-dimensional representation of absorbance and CD spectra for all (S,S)-ProSQ compounds for two selected methanol–water mixing ratios are shown in Fig. 2 to give a better impression of the different aggregation regimes. For a lower water fraction of 4 vol% as plotted in Fig. 2(a) and (b) there is a dominant blue-shifted bisignate CD response for both the shorter (C3 to C5) and the longer (C11, C12, C16) alkyl chain compounds, while the intermediate alkyl chain length (C6 to C10) compounds form a more pronounced red-shifted bisignate CD response. Interestingly, the red-shifted CD signatures are not smoothly bisignate in shape but express more detailed spectral features. For a higher water fraction of 40 vol% as plotted in Fig. 2(c) and (d) nearly no molecular dissolved compounds are left. The bisignate blue-shifted CD response for the shorter and longer alkyl chain compounds gain signal strength while maintaining the signs of the band, i.e. positive at around 520 nm and negative at around 550 nm. The increased share of water in the solvent mixture has certainly more impact on the red-shifted CD feature, and consequently affects the intermediate alkyl chain length compounds more. The red-shifted CD features become less detailed so the spectral width is reduced and the bisignate shape becomes more evident. Additionally, the signs of the bisignate bands appear to be inverted, i.e. the most red-shifted band (here at around 750 nm) is negative while the band at around 710 nm is positive.
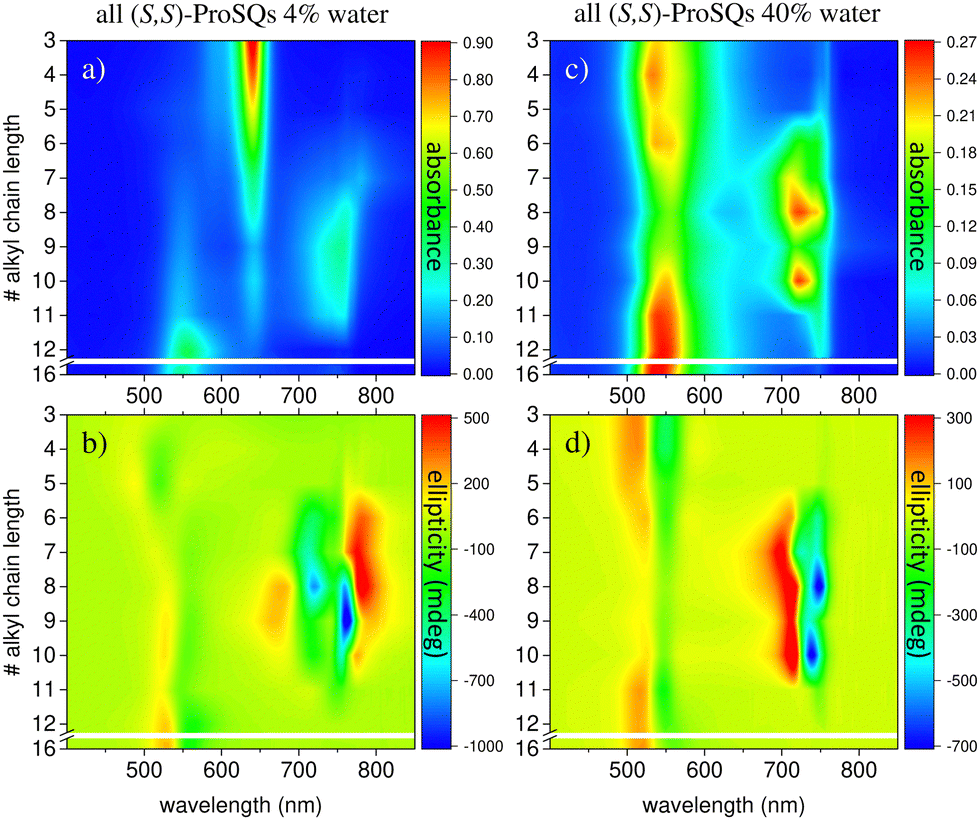 | ||
| Fig. 2 UV/Vis absorbance spectra (top row) and corresponding ellipticity spectra (bottom row) in a 2D representation of all (S,S)-ProSQ compounds with varying alkyl chain lengths (C3 to C12 and C16) for two selected volume-percentages of water in the methanol–water: 4% in (a) and (b) and 40% in (c) and (d). | ||
The absorption spectra of the colloidal suspensions of SQ aggregates shown in Fig. 1 and Fig. S13 (ESI†) share some similarity with the extensively studied spectra of SQ-films.16,26–31,42 Specifically, much as in the films, our aggregates show absorption features both to the red and to the blue of the monomer band. Our study may then offer some valuable information to shed light on the puzzling photophysics of SQ films. However, a major difference must be highlighted. In films, the absorbance spectrum is extremely broad, suggesting a fairly disordered structure with the coexistence of aggregates with different nature and/or dimension as well as of monomeric species. Our spectra, instead, show much sharper spectral features, suggesting more ordered structures, as also confirmed by the consistency of the spectra obtained from different batches.
The experimental absorbance spectra of our samples show a negligible amount of scattering, indicating the formation of tiny colloids in highly diluted suspensions. Consequently, these colloids could not be dried out on a solid support for microscopic or X-ray diffraction investigations, hindering the possibility to collect reliable experimental data on the aggregate geometry.
3 Simulations of the spectral properties of aggregates
All molecules of interest have the same chromophoric core, and only differ for the different lengths of the alkylic pendants. The spectral properties of the isolated molecules in the visible region are not affected by the length of the pendants, as best recognized looking at the absorption spectrum, where the monomer absorption is seen in all cases as a narrow band at 640 nm. Similarly, the chiral groups, while instrumental to guide the aggregates into chiral supramolecular structures, do not affect the spectral properties of the isolated (non-aggregated) molecules, that do not show any CD response in the visible spectral region. We will therefore adopt a bottom-up modeling strategy:32 in this subsection we will define and parametrize a model for the isolated (solvated) molecule, only accounting for the main chromophoric part. In the next two subsections, the molecular model will be exploited to build two concurrent models to describe the interacting dyes in the aggregates.Low-energy spectral properties of squaraine dyes are well-captured by an ESM approach that only accounts for three electronic states.4,41 The three basis (diabatic) states correspond to the main resonating structures, a neutral (DAD) state, |N〉, and two degenerate zwitterionic states (D+A−D and DA−D+) |Z1〉 and |Z2〉. The zwitterionic states are separated from the neutral state by an energy gap 2z and are coupled to the neutral state by a mixing matrix element −τ. Vibronic coupling is marginally relevant in squaraines, so that, in view of the complexity of the aggregation problem, we will not address it. Polar solvation will not be discussed either, as it does not affect the spectral properties of squaraines that have and maintain a centrosymmetric (hence non-polar) structure both in the ground and excited states.4 The molecular Hamiltonian reads:
ĥ = 2z![[small rho, Greek, circumflex]](https://www.rsc.org/images/entities/i_char_e0b7.gif) − τ − τ![[small sigma, Greek, circumflex]](https://www.rsc.org/images/entities/i_char_e111.gif) | (1) |
 | (2) |
![[d with combining circumflex]](https://www.rsc.org/images/entities/i_char_0064_0302.gif) = μ0(|Z1〉〈Z1| − |Z2〉〈Z2|) = μ0(|Z1〉〈Z1| − |Z2〉〈Z2|) | (3) |
Accounting for symmetry helps to understand the photophysics of squaraines:4 the two zwitterionic states can in fact be mixed into a symmetric |Z+〉 and an antisymmetric |Z−〉 combination. The |N〉 and |Z+〉 states are mixed into a ground |g〉 and a symmetric excited |e〉 state, while |Z−〉 stays unmixed. The lowest energy excitation |g〉 → |Z−〉 is active in one-photon absorption, while the higher energy excitation |g〉 → |e〉 is seen in two-photon absorption. The model parameters for squaraines can be fixed to best reproduce the position of one and two photon absorption band. Specifically, the one and two photon transition energies ħωc = 1.93 eV and ħωe = 3.04 eV, respectively,41 allow us to fix τ = 1.04 eV and z = 0.4 eV. Finally, the experimental transition dipole moment, μc = 12.5 D,41 fixes μ0 = 20.83 D. This corresponds to a dipole length a ∼ 4.33 Å, that we assign as the effective length of each D–A arm (cf.Fig. 3). We underline that the parametrization of the electronic Hamiltonian against solution data ensures that it implicitly accounts for the effect of the medium refractive index:43 the marginal variability of the refractive index in common organic solvents and, more generally, in organic media, allows us to adopt environment independent model parameters to describe dyes in organic media.43–45
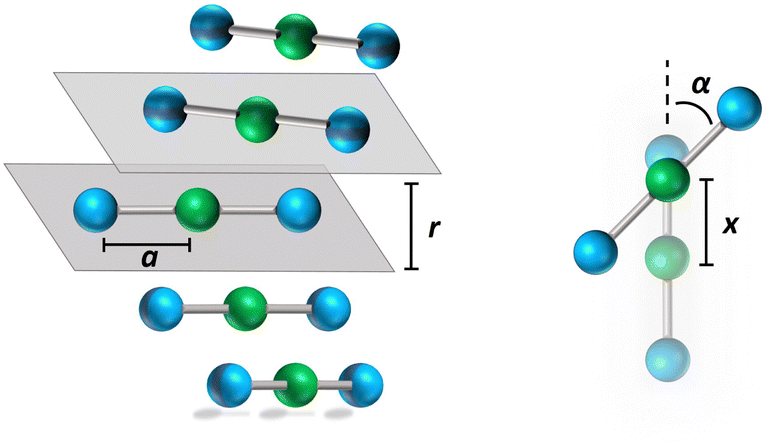 | ||
| Fig. 3 Schematic representation of the aggregate geometry. The blue and green spheres represent the electron donor (D) and acceptor (A) sites, respectively. Geometrical parameters are also shown: a is the length of the D–A arm, r is the interplanar distance, x is the displacement along the long molecular axis, and α is the angle formed by adjacent molecules. Positive and negative α describes left and right handed helices, respectively. The figure a pentamer, bigger aggregates are constructed maintaining the same arrangement along the stack (one molecule per unit cell). | ||
3.1 Squaraine aggregates: the ESM-ES approach
Having a reliable description of the solvated dyes, we are now in the position to develop a model that, accounting for intermolecular interactions, will describe the spectral properties of the aggregate. The alkylic pendant and the chiral groups play a fundamental and specific role in guiding the geometry of the supramolecular assemblies formed upon aggregation in poor solvents. This specific role is recognized in the distinctively different spectral properties of the aggregates formed by dyes with alkyl chains of different length (Fig. 1, 2 and Fig. S2, S3, ESI†), and by the opposite sign of the CD spectra collected from aggregates formed by enantiomeric species (Fig. S1, ESI†). As stated above, we observe that the tendency to aggregate is amplified in systems with longer chains. Specifically, signatures of aggregation are seen already in pure methanol solvent for pendants longer than C7, while for C16 only the aggregated form is observed. In any case, the spectral properties of the aggregates in the visible region are dominated by the chromophoric cores and their interactions. In this and in the following subsections we will therefore build two concurrent models for the aggregates, only accounting for the chromophoric species and their interactions.The exciton model46,47 is widely and successfully applied to describe linear spectral properties of molecular aggregates. The basic assumption of the exciton model is that electrons are localized on each molecular unit, so that only ES intermolecular interactions are accounted for and are usually dealt with in the dipolar approximation. In the standard version of the exciton model, molecules are described in terms of a single excited state. Moreover, the interactions between non-degenerate states are neglected, so that the exciton Hamiltonian is defined on the N degenerate states bearing a single excitation. This approximation amounts to neglect the molecular polarizability.48–50 In other terms, when the molecules are brought together in the aggregate, the exciton model neglects any effect of the interaction with the surrounding molecules apart from the exciton delocalization. This is a good approximation for poorly polarizable molecules or, equivalently, when the excitation energy is much larger than the intermolecular interactions, but is expected to fail for aggregates of largely polarizable molecules with low-lying excitations, like squaraines.37,48–52 A short description of the exciton model and its application to SQ aggregates can be found in the ESI,† Section 3.1.
ESMs for polar and multipolar dyes lend themselves quite naturally to address ES intermolecular interactions in molecular aggregates, releasing the main approximations of the exciton model.32,48,50,53,54 Specifically, modeling SQ aggregates we release the dipolar approximation and describe each molecule in terms of a ground and two excited states. More interestingly, however, since intermolecular interactions are defined on the diabatic basis, the resulting model fully accounts for the molecular polarizability, allowing the charge distribution on each dye to readjust in response to the ES potential generated by the surrounding molecule.48–50
As in the exciton model46,47 (see the ESI,† Section 3.1), in this subsection we neglect the overlap between frontiers molecular orbitals of different molecules, so that electrons are fully localized on each squaraine unit and intermolecular interactions are just ES in origin. The basis set relevant to the aggregate is then the direct product of the three basis states of each dye, for a grand-total of 3N states. This limits the dimension of aggregates that can be reasonably dealt with to ∼9. The Hamiltonian for the aggregate reads:
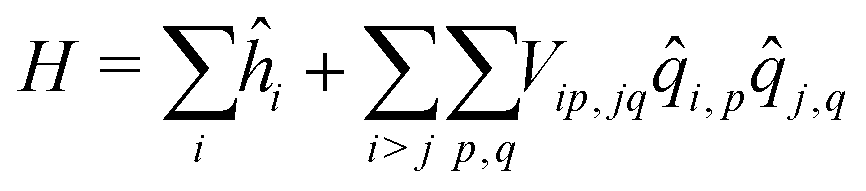 | (4) |
![[q with combining circumflex]](https://www.rsc.org/images/entities/i_char_0071_0302.gif) i,1 = |Zi1〉〈Zi1| i,1 = |Zi1〉〈Zi1| |
| i,2 = −|Zi1〉〈Zi1| − |Zi2〉〈Zi2| |
| i,3 = |Zi2〉〈Zi2| | (5) |
Finally, the ES interaction between unit charges residing in site p of molecule i and site q of molecule j is
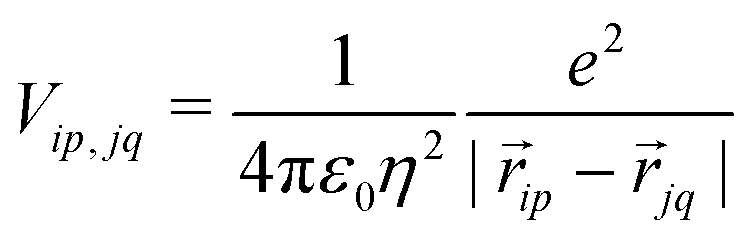 | (6) |
![[r with combining right harpoon above (vector)]](https://www.rsc.org/images/entities/i_char_0072_20d1.gif) ip is the vector that defines the position of the i, p site and η is the effective refractive index, accounting for the medium refractive index and for the screening due to electrons not explicitly accounted for in the model. In the following, results are shown for η2 = 2 (results for different values are shown in the ESI,† Section 3). Fig. 3 shows a schematic view of the aggregate geometry with the definition of the main geometrical parameters: a is the length of the D–A arm, r is the distance between adjacent molecular planes, α is the rotation angle between adjacent molecules, and x is the displacement of the dyes along the long molecular axis.
ip is the vector that defines the position of the i, p site and η is the effective refractive index, accounting for the medium refractive index and for the screening due to electrons not explicitly accounted for in the model. In the following, results are shown for η2 = 2 (results for different values are shown in the ESI,† Section 3). Fig. 3 shows a schematic view of the aggregate geometry with the definition of the main geometrical parameters: a is the length of the D–A arm, r is the distance between adjacent molecular planes, α is the rotation angle between adjacent molecules, and x is the displacement of the dyes along the long molecular axis.
The diagonalization of the Hamiltonian in eqn (4) leads to the aggregate eigenstates ψi. To calculate absorption spectra, the dipole moment operator  for the aggregate is defined as the vectorial sum of molecular dipole moments
  . The transition dipole moment from the ground state |ψ0〉 to state |ψi〉 is finally obtained, as needed to calculate the linear absorption spectrum (ESI,† Section 2.4).
The rotational strength, defining the intensity and sign of each feature in the CD spectrum, is:
 | (7) |
 is the magnetic dipole moment operator. Since electrons are localized on each molecular unit, following Condon,55,56 the rotational strength can be evaluated as:
 | (8) |
m is the position vector of the m-th molecular site.
The color maps in Fig. 4 show absorption and CD spectra calculated for aggregates of N = 2, 4 and 8 molecules, with r = 3.5 Å, α = 20° and variable x. Results for different geometries, reported in the ESI,† demonstrate that different aggregate geometries leads to marginally different spectra, maintaining the general picture unaffected.
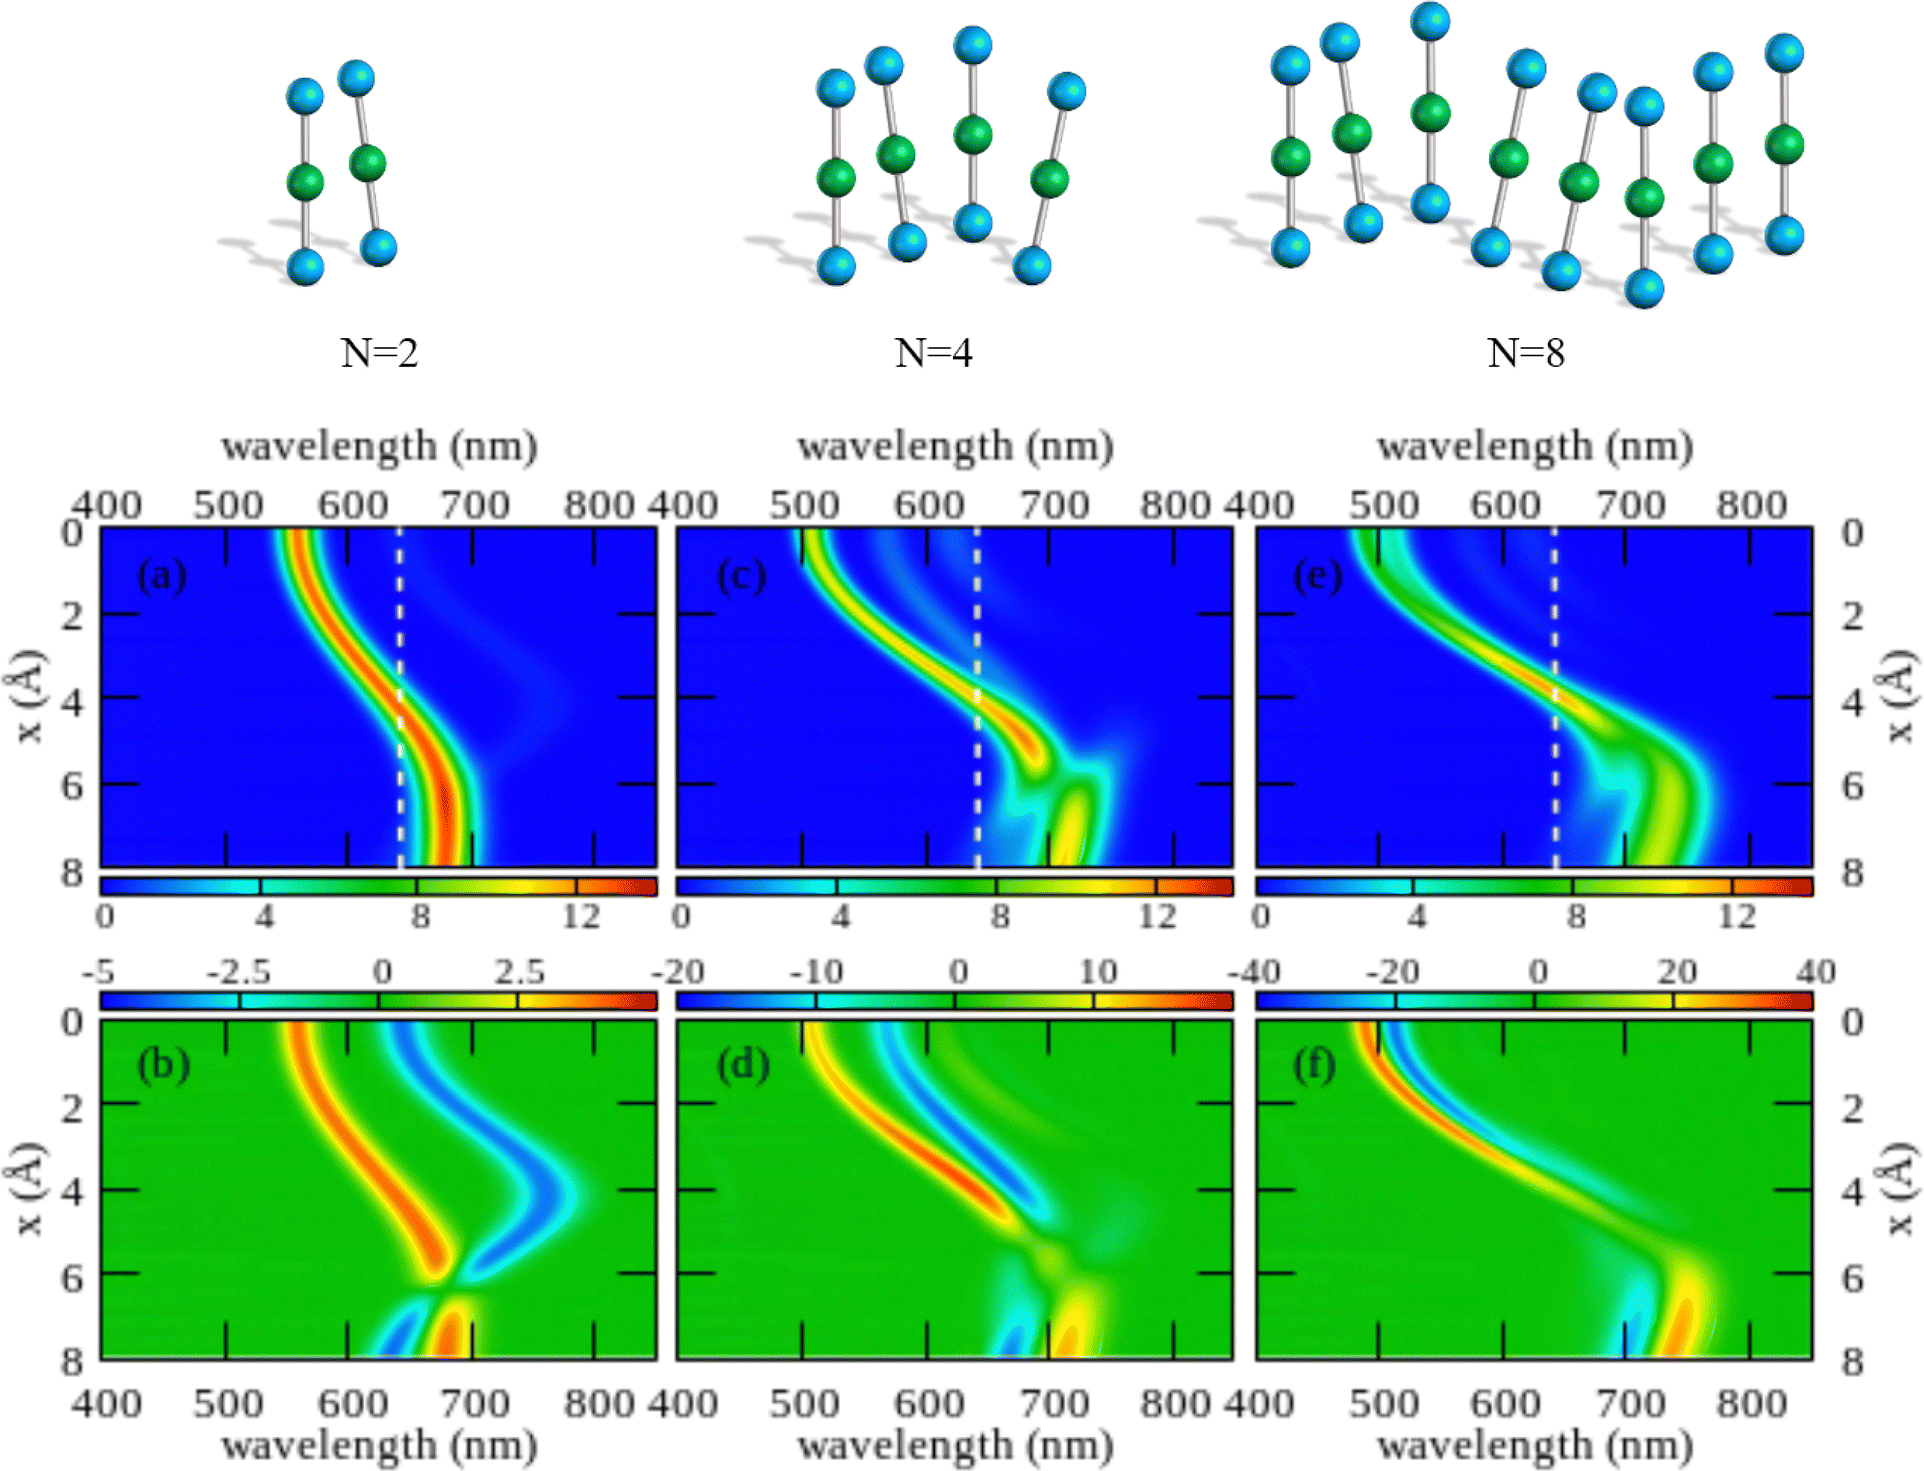 | ||
| Fig. 4 Spectral properties of squaraine aggregates described in the ESM-ES approach (model Hamiltonian in eqn (4)). Molecular parameters: z = 0.4 eV, τ = 1.04 eV, a = 4.33 Å. Results are shown for aggregates of 2, 4 and 8 molecules with r = 3.5 Å and α = 20°. The color maps show the absorption intensity (top panels) and the CD intensity (bottom panels) plotted against the wavelength (horizontal axis) upon varying x (vertical axis). All intensities, in arbitrary units, are normalized to the number of molecules. Notice the different scale adopted for the CD intensity in the three bottom panels to account for the superlinear amplification of CD intensity with aggregate size. | ||
Comparing results for 4 and 8 sites, one recognizes that the spectra become cleaner, as expected, due to the progressive reduction of finite size effects. Moreover, the splitting between the positive and negative peaks in the CD spectrum reduces when going from 4 to 8 sites, an effect that is more pronounced at small x. But, the overall picture is only marginally altered. On the opposite, the dimer spectrum leads to a qualitatively different picture. Indeed, the dimeric model qualitatively captures the behavior of the linear absorption spectra. Specifically, and in close analogy with the exciton model (Fig. S6, ESI†), a single band largely dominates the absorption spectrum, located to the blue of the monomer absorption spectrum for small x (H-aggregate geometry) and progressively moving to the red at larger x (J-aggregate geometry). But looking at the CD spectra, Fig. 4 lower panels, the situation changes. Qualitatively, and again in line with the exciton model (cf. Fig. S6, ESI†), in all cases a bisignated feature appears. As expected for a left-handed H-aggregate, at small x the positive CD feature is observed at higher frequency (shorter wavelength), while at large x, when moving to a J-aggregate structure, the sign of the CD doublet reverses.57 However, the CD signal for the dimer is qualitatively different from what we get for longer aggregates. For a dimer in fact the positive and negative CD signatures are seen at the frequencies of the upper and lower exciton states, so that the distance between the two peaks amounts to twice the exciton coupling. In bigger aggregates, instead, the exciton couplet involves nearby states close in energy to either the highest energy states in the exciton band (H-aggregates) or to the lowest energy states in the exciton band (J-aggregates). The distance between the positive and negative peaks is not a measure of the exciton splitting in aggregates with N > 2.57 A lesson is learned here: dimeric models work reasonably well to describe linear absorption spectra, but they may be misleading when applied to CD spectra, a conclusion that holds true for both the standard exciton model (Fig. S6, ESI†) and the ESM-ES model (Fig. 4).
Another interesting observation concerns the intensity of the spectra. Absorption and CD intensities in Fig. 4 are normalized to the number of sites. As expected, the normalized absorption intensity is roughly constant upon increasing the aggregate size. On the other hand, the normalized intensity of the CD signals increases fast with N, a result that could explain the very large chiroptical responses reported recently for annealed thin films of proline-derived squaraines with C16 alkyl chain (ProSQ-C16).35
It is instructive to compare results from the ESM-ES model in Fig. 4 with the results obtained in the standard exciton model, shown in Fig. S6 (ESI†). The two sets of results share some similarity, with a single main absorption peak and a single main bisignated CD feature. Moreover, as expected, in both models the absorption peak is located to the blue of the monomer absorption for superimposed or almost so molecules (small x in Fig. 3, H-like aggregates) while it is located to the red of the monomer absorption for largely displaced molecules (large x in Fig. 3, J-like aggregates). However, some important differences between the two models is observed.
In the exciton model, the switch from H to J-aggregate behavior occurs for x ∼ 2.5 Å, while much larger x ∼ 4 Å values are needed in the ESM-ES model. Even more interesting is the comparison of absorption and CD spectra. In the exciton model, the molecular polarizability is disregarded, so that the position of the absorption band vs the monomer absorption is determined by the sign of the intermolecular electrostatic interactions, positive for H-aggregates, negative for J-aggregates. Since, as recently discussed,57,58 for fixed helicity the sign of the CD doublet depends on the sign of intermolecular interactions, in the exciton model the sign of the bisignated signature in the CD spectrum reverses precisely at the same x value where the system crosses from H to J-behavior. The situation is more complex in the ESM-ES model, where the molecular polarizability is fully accounted for so that the charge distribution on each molecular unit rearranges in response to the presence of surrounding molecules. Accordingly, the reference absorption frequency of the monomer does not coincide with the one observed for the isolated dye and the position of the absorption peak of the aggregate cannot be only ascribed to the sign of the interaction. Just for the sake of simplicity, let's focus on the dimer case (left panels of Fig. 4): the sign of the CD spectrum reverses at x ∼ 6 Å, unambiguously suggesting that the sign of the intermolecular interaction is positive for x < 6 Å, and negative for x > 6 Å. This apparently contrasts with the observation of a red-shifted absorption in the region of x comprised between 4 and 6 Å. Indeed this is the strange region of non-fluorescent J-aggregates, corresponding to a region where the blue-shift associated with repulsive intermolecular interactions is overcompensated by the red-shift of the monomer absorption as due to the rearrangement of the charge distribution occurring in each polarizable molecule in response to the electric potential generated by the surrounding molecules.48,52,59,60
As noticed above, both the exciton model and the ESM-ES model predict for the dimer a bisignated CD signal whose positive and negative peaks are close to the position of the two Davydov components, so that the CD spectrum is centered at the position of the monomer absorption. For larger aggregates instead, the main CD features are seen in the close proximity of the main absorption band, so that the CD bisignated signal is centered either to the blue or to the red of the monomer absorption in H or J-aggregates, respectively.57 These results teach us another important lesson: as long as the electrons stay localized in each molecular unit, a single main bisignated CD signal is expected for each aggregate geometry. The experimental observation of two bisignated peaks in SQ aggregates therefore rules out the possibility that the red and blue spectral features observed in the absorption spectra are related to two Davydov components, which would imply a single bisignated signal in the CD spectrum. This is an important observation as it excludes at least one of the possible scenarios invoked to explain the spectra of SQ films.29
Having a general picture of the spectral properties of an aggregate of squaraine dyes described in the ESM-ES approach (Fig. 3 and Fig S7 and S8 in the ESI†) we can relate this picture to experimental data. The observation of two spectral features in both absorption and CD spectra, can be rationalized within ESM-ES due to the formation of aggregates (larger than dimers) where structures with x = 6–8 Å, responsible for the feature in the red region of the spectrum, coexists with structures with x ∼ 2 Å, responsible for the spectral feature at ∼500 nm. Quite interestingly, the feature in the red portion of the spectrum is located very close to the region where the simulated CD feature changes its sign, possibly explaining the large variability of the experimental CD spectrum in this region. Of course, the different intensities of the two spectral features in the aggregates formed by dyes with different side chains could be rationalized in terms of different relative amounts of the two aggregates in the different systems.
3.2 Introducing intermolecular charge resonance: the ESM-CT approach
In recent years, squaraine aggregates have been extensively investigated by Collison and Spano28,30,36–38 who ascribed the fairly complex absorbance spectra of (non-chiral) squaraine films to the presence of CT interactions among adjacent molecules. Specifically, a sizable overlap between two D–A pairs in nearby molecules, as schematically shown in Fig. 5, was proposed to justify the experimental observations. The films of (non-chiral) anilino squaraine with linear terminal alkyl chains investigated by Collison and Spano show two bands in the absorption spectrum, one to the blue and one to the red of the monomer absorption band, much as in our case, even if with much broader bandshapes. It is therefore interesting to see if a model accounting for intermolecular CT interactions (ESM-CT) does apply to our aggregates in colloidal suspensions.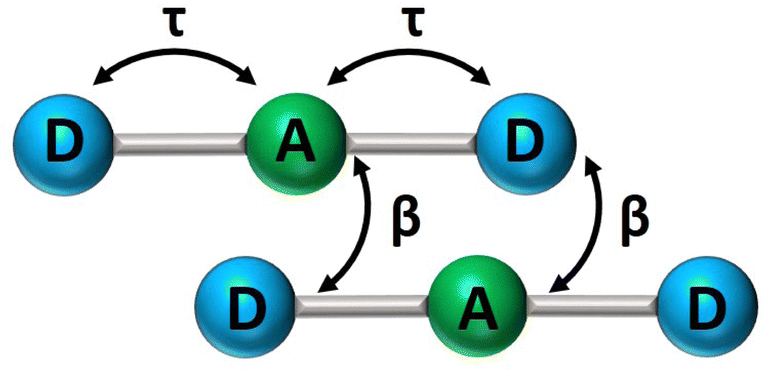 | ||
| Fig. 5 A sketch of intramolecular (τ) and intermolecular (β) charge resonance interactions, shown as double-sided arrows, for a pair of adjacent molecules. | ||
If electrons can hop among different molecules, the number of states needed to describe the aggregate increases fast. In a dimer, accounting only for charge degrees of freedom, the number of states increases from 9 in the case of localized electrons to 15.36 However, 15 states are not enough if the electron spin is appropriately accounted for, leading to much larger basis, as discussed in the ESI† (Section 2.3). The Hamiltonian for N molecules is constructed as a modified Hubbard Hamiltonian accounting on each molecule for three sites, D–A–D, and four electrons. The Hamiltonian reads (eqn (9)):
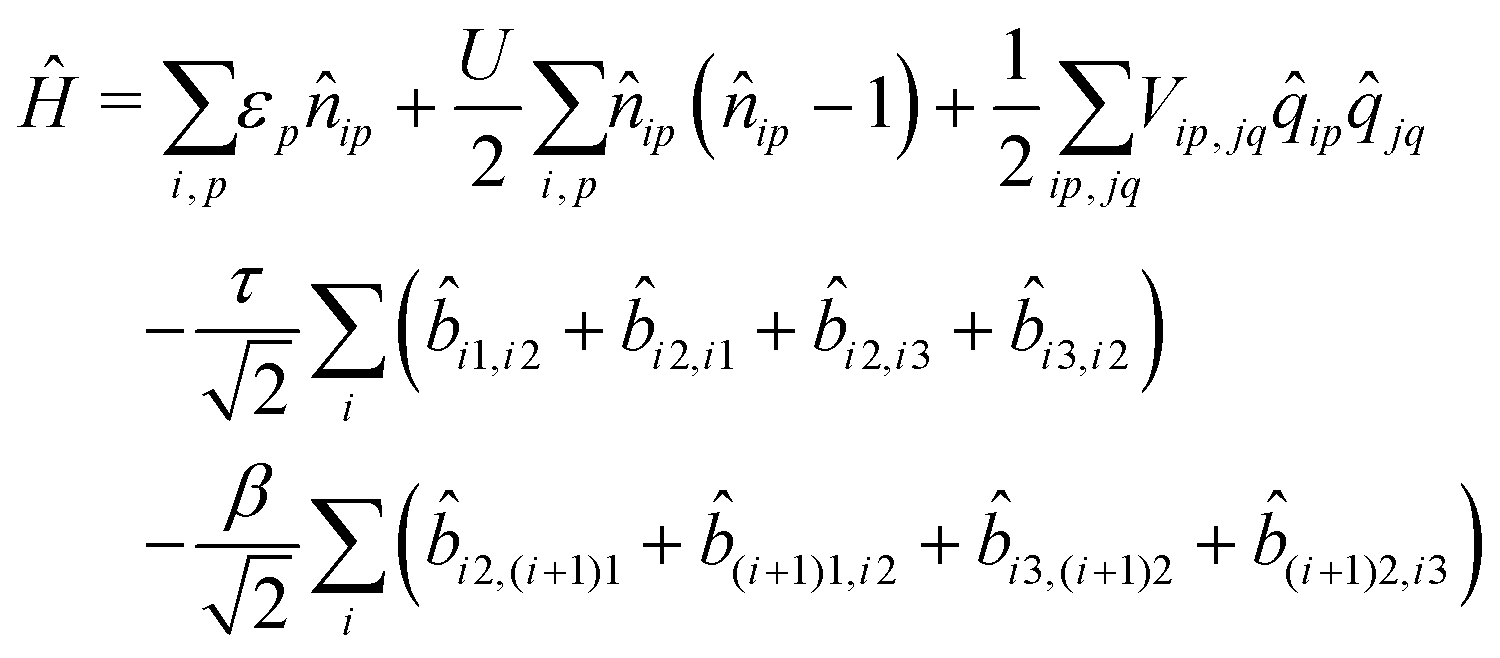 | (9) |
 , where ai,p,σ and a†i,p,σ annihilate and create, respectively, an electron with spin σ on the relevant site. We also define the auxiliary operator
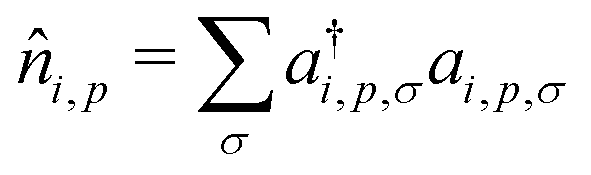
 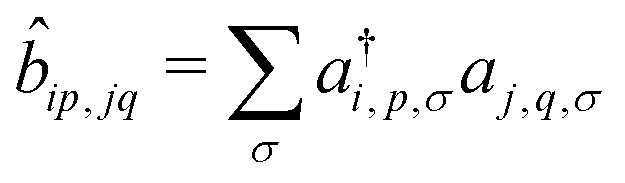 . The energy of the p site on each molecule is εp, while U (site-independent for the sake of simplicity) is the energy required to put two electrons on the same site. The intra and intermolecular electron hopping are described by τ and β, respectively. Finally, ES interactions are described by the last term in the first row: the operators measuring the charge on each site are i,p = 2 −
 ![[n with combining circumflex]](https://www.rsc.org/images/entities/i_char_006e_0302.gif) i,p for p = 1,3 (D site) and i,p = i,p for p = 2 (A site) and Vip,jq is defined as in eqn (6).
i,p for p = 1,3 (D site) and i,p = i,p for p = 2 (A site) and Vip,jq is defined as in eqn (6).
The ESM-CT must describe exactly the same physics as the ESM-ES in Section 3.1 when β = 0, provided that model parameters are appropriately selected. On-site energies are defined as εp = −Δ for p = 1,3 (D site) and εp = +Δ for p = 2 (A site). To limit the basis dimension, states with D sites bearing a negative charge or A sites bearing a positive charge or with sites bearing double charges (D2 + or A2 −) are excluded setting their energy to very large values. To this aim, we set U and Δ to very large values while maintaining their difference finite. Specifically, for direct comparison with the molecular essential state model, the energy difference between D+A−D and DAD configurations is 2z = 2Δ − U − V, where
 | (10) |
We adopt the real-space basis, i.e. the basis where the 4N electrons are distributed on the different sites and only consider the subspace with an equal number of spins up and down (see the ESI,† Section 2.3). Even discarding high energy states (with doubly charged sites or with negatively charged D or positively charged A), the dimension of the basis increases very fast with N, from 53 states in a dimer, to 707 in a trimer and 10![[thin space (1/6-em)]](https://www.rsc.org/images/entities/char_2009.gif) 453 in a tetramer. In any case, the relevant Hamiltonian matrix can be diagonalized to get the lowest eigenstates of interest for spectral properties.
453 in a tetramer. In any case, the relevant Hamiltonian matrix can be diagonalized to get the lowest eigenstates of interest for spectral properties.
To calculate the absorption spectrum we need the dipole moment operator that, due to the intermolecular CT, cannot be written as the sum of molecular dipoles. Its definition, in terms of site charges and positions, is however very simple:
 | (11) |
Addressing CD spectra is much more delicate. The Condon approach55–57,61 only applies to aggregates where electrons are confined inside each molecular unit and, to the best of our knowledge, approaches to evaluate CD spectra in aggregates also accounting for intermolecular CT interactions are not available. To calculate rotational strengths (eqn (7)) we need an explicit expression for the electric dipole moment operator, given in eqn (11), and for the magnetic dipole moment operator. The derivation of the magnetic dipole moment operator is non-trivial and is addressed in the ESI† (Section 2.2), where the somewhat clumsy expressions for the rotational strength are also explicitly reported.
The large dimension of the real space basis and the large number of matrices to be stored in the computer memory for the calculation of rotational strengths make ESM-CT calculations extremely demanding, limiting the dimension of the aggregate we could address to 4 molecules. The ESM-ES results shown in Section 3.1 for aggregates of 4 and 8 molecules suggest that, while finite size effects are sizable, reliable information can already be obtained for 4 sites. Fig. 6 shows ESM-CT spectra calculated for 4-site aggregates, with the same model parameters as in Fig. 4, but with intermolecular CT interactions switched on to β = 0.2, 0.4 and 0.6 eV. Results for other aggregate geometries and other parameter values are shown in the ESI† (Section 3.2).
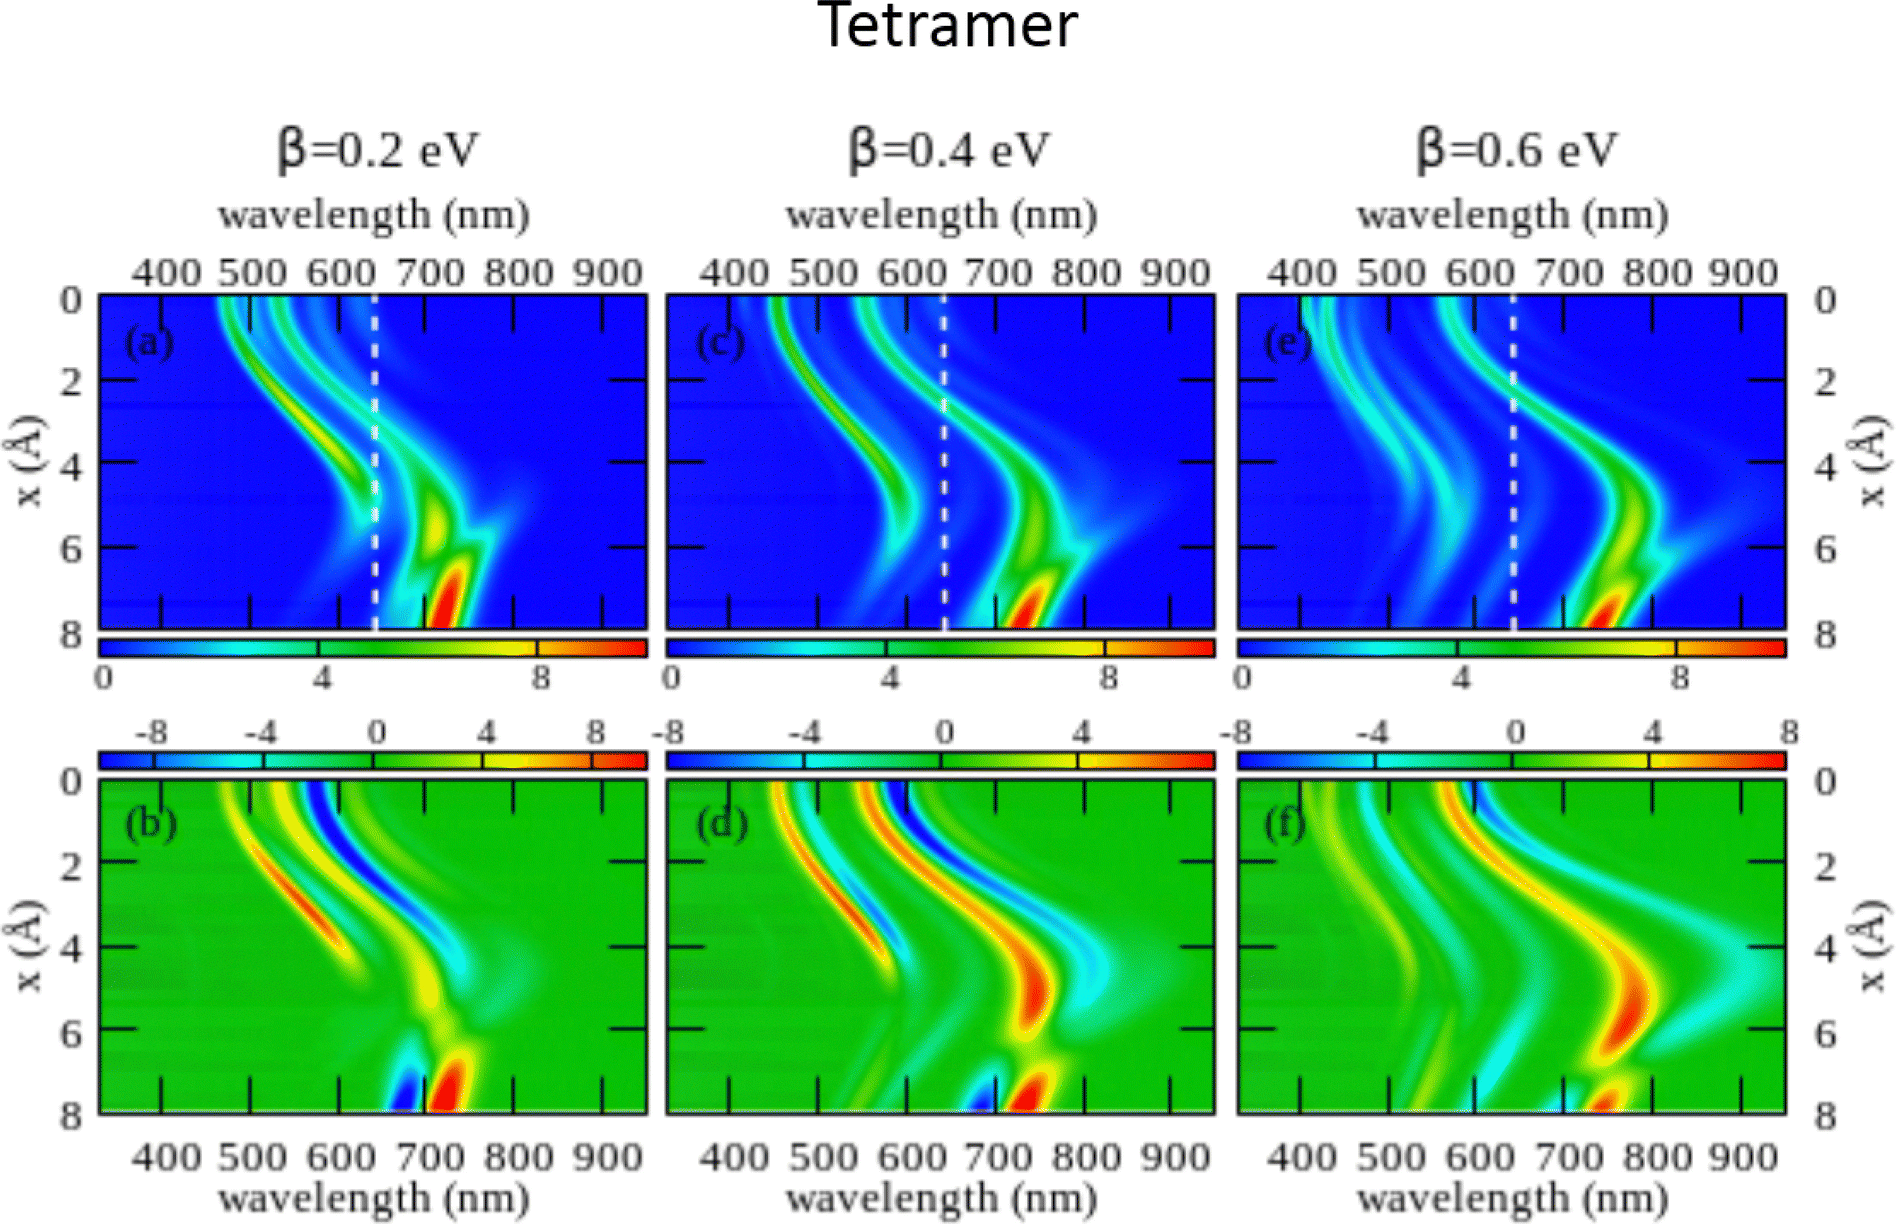 | ||
| Fig. 6 Spectral properties of squaraine aggregates described in the ESM-CT approach (model Hamiltonian in eqn (4)). Results are shown for tetramers adopting the same geometry and the same molecular parameters as in Fig. 4. The color maps show the absorption intensity (top panels) and the CD intensity (bottom panels) plotted against the wavelength (horizontal axis) and x (vertical axis). Left panels refer to β = 0.2 eV, middle panels to β = 0.4 eV and right panels to β = 0.6 eV. | ||
As first recognized by Collison and Spano,36 when intermolecular CT interactions are accounted for, two major peaks appear in the absorption spectrum whose separation increases with increasing β. Indeed, two predominant bands are seen for a dimer (see Fig. S11 and S12, ESI†) but, upon increasing the number of molecules, additional weak bands are also seen that, being most probably related to finite size effects, could disappear in larger aggregates. Quite interestingly, two bisignate features appear in the CD spectra in the same spectral regions as the two main absorption peaks (again the spectrum is somewhat more complex with additional small features appearing, most probably related to finite size effects). The superlinear increase of the intensity of the CD signal, observed for the model with localized electrons, is also confirmed in the presence of intermolecular CT interactions (see Fig. S12 in the ESI† where results of the ESM-CT model are shown for aggregates with N = 2, 3 and 4).
We are now in the position to discuss experimental results in the framework of the ESM-CT approach. Experimental spectra collected for aggregates of dyes with pendants of intermediate size (C6, C7 or C10) could be roughly accounted for in terms of aggregates with β = 0.4 eV and x ∼ 3–4 Å. So a single aggregate type can explain the observation of double features in both absorption and CD spectra. Simulating absorption and CD spectra accounting for a single form of aggregates is fairly appealing if compared with the need to postulate the presence of two different types of aggregates in the ESM-ES approach. However, the ESM-CT approach hardly applies to aggregates of dyes with short (C3, C5) or long (C11, C12, C16) chains. In these aggregates in fact the red-most feature observed in either absorption or CD spectra has a dramatically reduced intensity if compared with the blue-most features. In our model, irrespective of the strength of the CT interaction, and of the details of the aggregate geometry (see the ESI,† Section 3.2) it is not possible to simulate a spectrum where the red-most features have negligible intensity.
4 The helicity of the aggregate: a difficult case study for MD
In the previous section, we have seen how the complex experimental behavior of chiral squaraine aggregates can be rationalized in terms of (a) a model accounting for only ES intermolecular interactions in the hypothesis of the coexistence of both H-type and J-type aggregates or (b) due to the presence of a single type of aggregate if intermolecular CT interactions are present. As for the sign of the CD spectrum, in line with experimental results, some variability is expected for the red-most feature, while, as for the high energy feature, a consistent sign of the exciton doublet is observed experimentally that can be reproduced imposing a left-handed helix for aggregates of (S,S)-ProSQ compounds and a right-handed helix for aggregates of (R,R)-ProSQ compounds. In an effort to get independent information on the supramolecular arrangement of the dyes in the aggregates, as needed to assist the interpretation of experimental data, we performed extensive MD simulations on ProSQ-C10 aggregates.All simulations were run in Gromacs.62 First, a generalized Amber Force Field (GAFF)63 potential in its standard implementation with restrained ES potential (RESP) charges64 was adopted starting from the isolated molecules with constrained planarity of the conjugated framework. A first set of enhanced-sampling simulations with fixed number of molecules, pressure and temperature (NPT) were run on tetramers in explicit solvent, adopting the Hamiltonian replica exchange MD (HREMD) approach.65 Details about the method and the sample preparation can be found in the ESI,† Section 4. These simulations consistently returned a right-handed helix for the (S,S)-enantiomer, in contrast with the handedness requested to simulate the experimental CD spectra. Similar results were obtained using pure methanol as the solvent or methanol–water (60:40) mixtures, with marginal fluctuations around equilibrium structures (see Fig. S15, ESI†). A shorter simulation on (R,R)-ProSQ-C10 in water–methanol (60:40) produced a left-handed helix, as expected.
In an attempt to improve the description and move towards larger aggregates, a second round of simulations were run employing a modified version of the GAFF potential by (i) fixing some of the C–C–C–C dihedrals for the conjugated core, and (ii) improving the description of long alkyl chains, as suggested in the context of liquid crystal by Boyd and Wilson66 (more details in the ESI† – Section 4). We dubbed these simulations as mod.GAFF + LCFF MDs. Unbiased simulations on tetramers still returned similar structures as in the original GAFF, suggesting that, at least for small N, this family of force fields robustly predicts at the thermodynamic equilibrium the same type of helical aggregates (compare Fig. 7 with Fig. S15 in the ESI†).
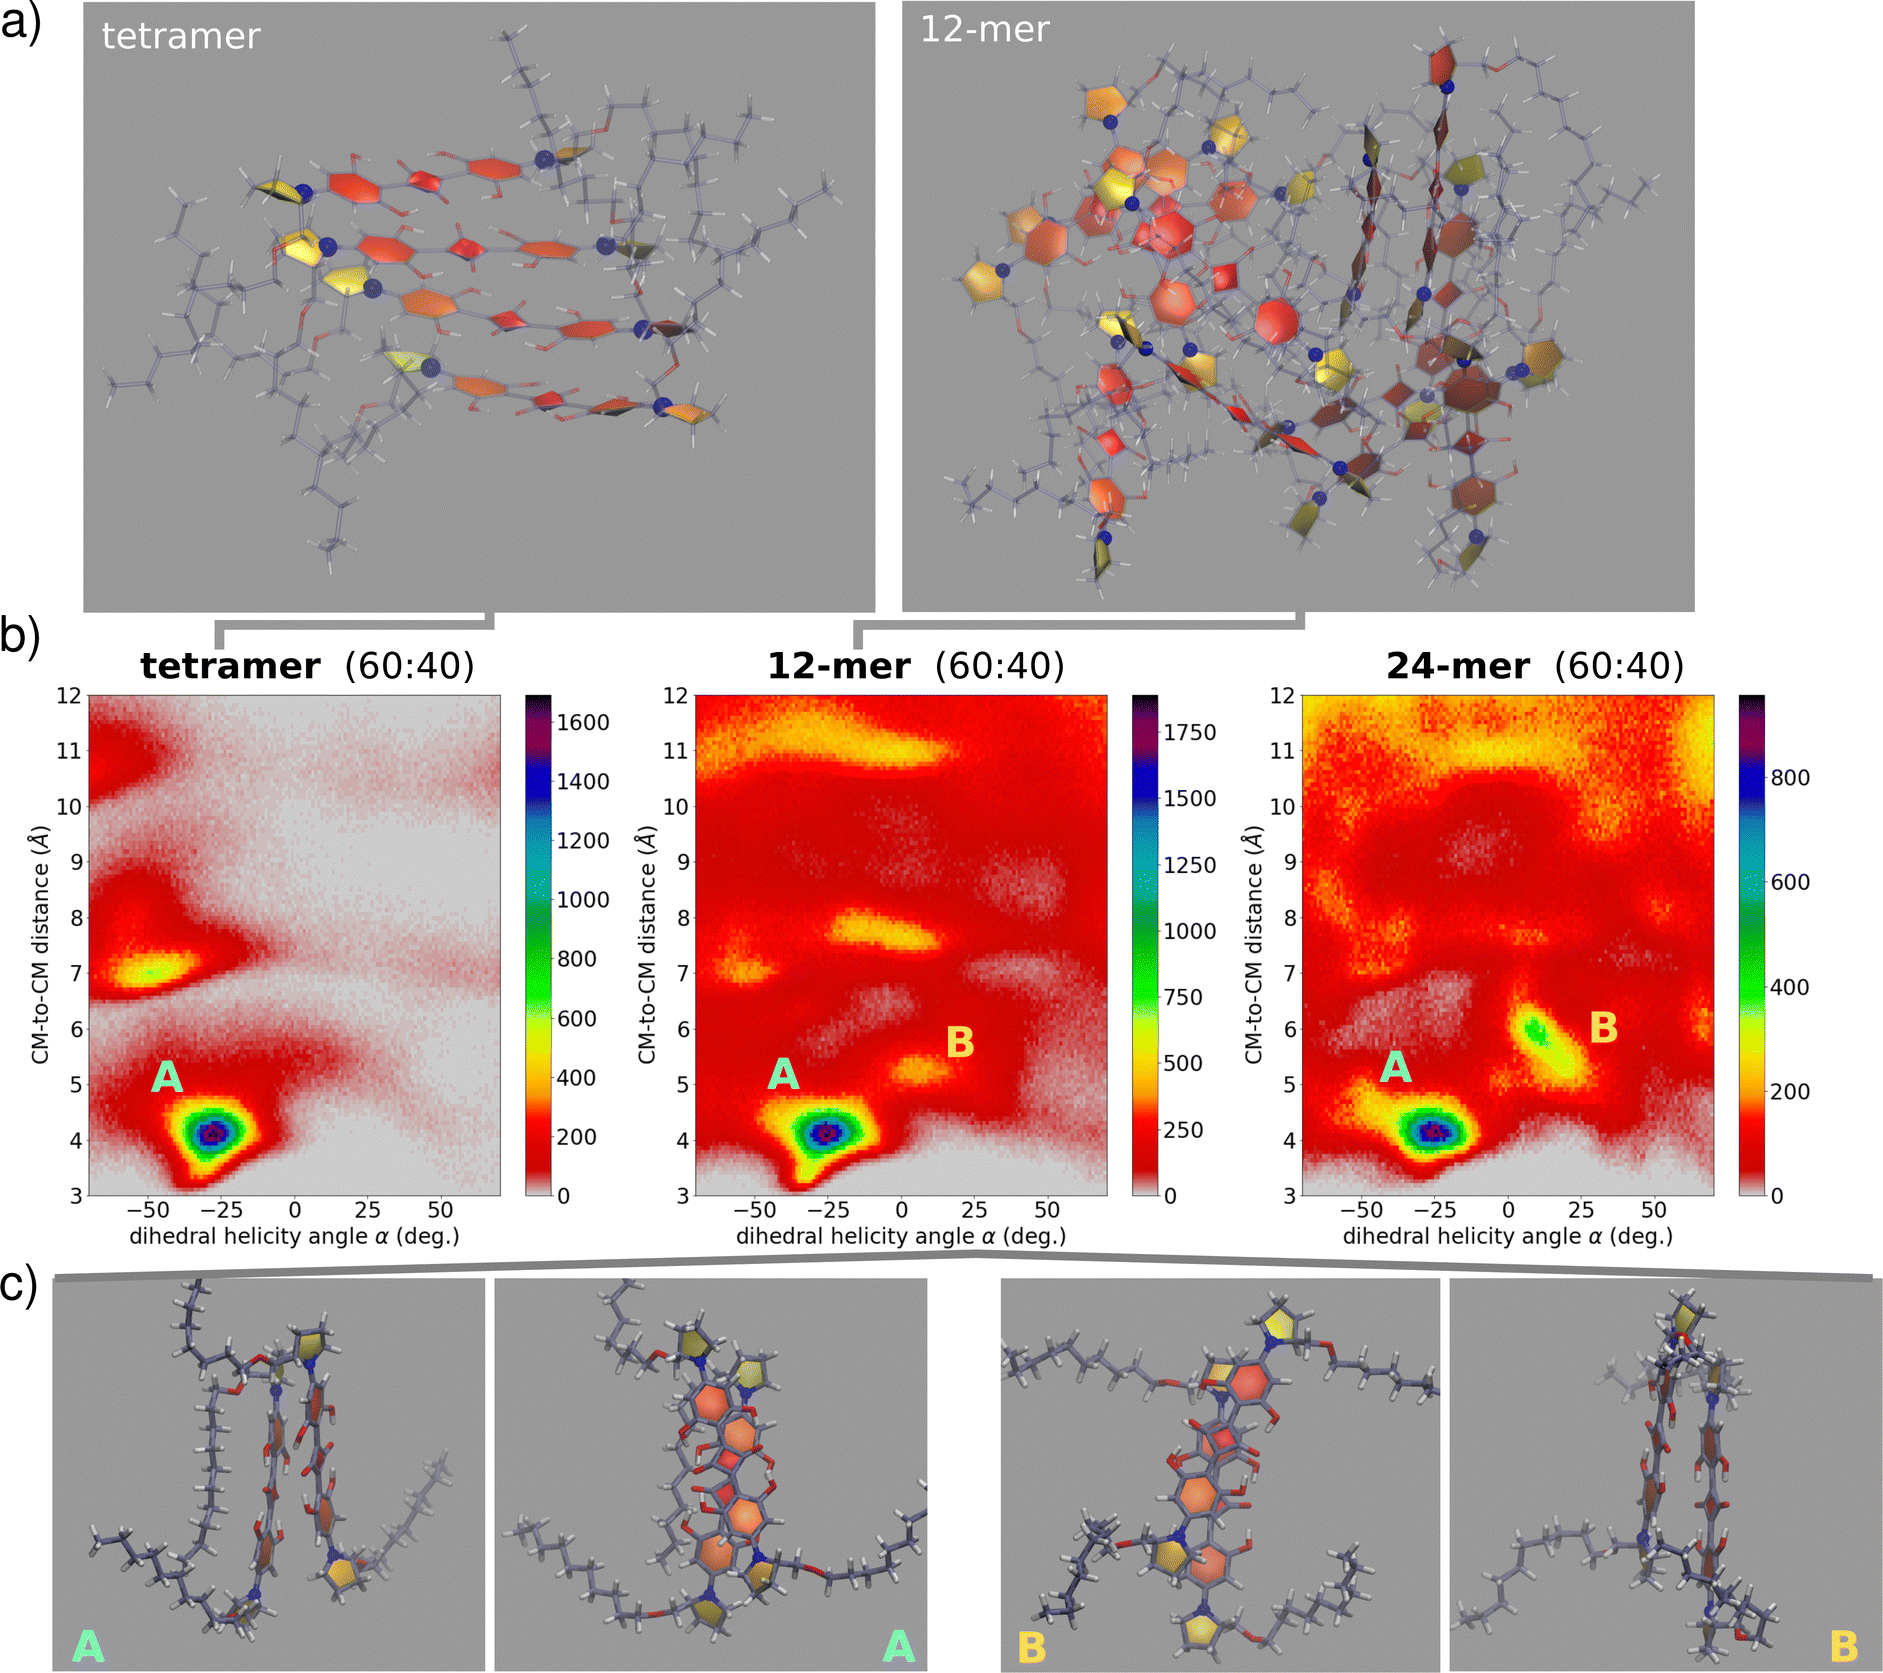 | ||
| Fig. 7 Snapshots and pairwise information extracted from MD trajectories. (a) Snapshots from the MD trajectories of tetramer (left) and 12-mer (right), with highlighted rings and N atoms in blue; (b) heatmaps showing the distribution of α (x-axis, in degree) and of the distance between two centers of mass (y-axis, in Å). Results refer to a tetramer (left panel), a 12-mer (middle panel) and a 24-mer (right panel) of (S,S)-ProSQ-C10 simulated with mod.GAFF + LCFF MDs; (c) selected representative dimer structure extracted from the 12-mer trajectory belonging to the A domain (on the left) and to the B domain (on the right), both in the top view (middle) and side view (external). | ||
In a very relevant work33 Hariharan and coworkers reported some interesting findings on chiral aggregates of a different family of squaraine dyes. They observed an astounding inversion of the sign of CD spectra of the aggregate after thermal treatment, suggesting that the helicity of the aggregate may reverse for aggregates formed under thermodynamic control vs kinetic control. Inspired by these results, we have exploited MD in an attempt to probe configurations not necessarily corresponding to the equilibrium. To this aim, two extra sets of simulations were run on 12-mer and 24-mer of (S,S)-ProSQ-C10 aggregates. In all cases, simulations started with the molecules arranged with their center of mass on a regular 3D grid and in random orientation. We prepared 6 different 12-mer samples and two different 24-mer samples in 60:40 MeOH:water. After relaxation and equilibration, we finally run unbiased NPT simulation for 45 ns (full details in the ESI,† Section 4). In this approach, several “disordered” large aggregates are investigated, in an effort to mimic conditions of kinetic control, while keeping a balance between satisfactory sampling and representative structures. With the aim of understanding the fundamental interactions assisting the optical signatures, we have limited our analysis by extracting from the dynamics the information related to molecular pairs. Specifically, for each aggregate size we collected distributions of pairwise geometric parameters (see the ESI,† Section 4). Fig. 7 show relevant results, with the colormaps showing as 2D histograms the distribution of the distance between two molecular centers of mass versus the rotation angle as defined in Fig. 3. We observe the presence of at least two basins among the first-neighbour close-distance region: the first basin, largely dominating, is located at negative α and hence corresponds to the right-handed helix of (S,S)-ProSQ-C10, expected to give rise to the wrong sign of the CD spectrum. The second basin, located at positive α, corresponds to a left-handed helix, the structure in line with the observed sign of the CD spectrum. Quite interestingly, this secondary basin becomes more prominent with increasing aggregate size, suggesting that MDs on larger aggregates could better reproduce the experiment. Moreover, as clear from Fig. 7, upon increasing the aggregate size a more diverse configurational landscape is obtained, with dimer structures exhibiting several possibilities of geometrical orientations. These maps include non-nearest-neighbor molecular pairs as well. From MD trajectories in mod.GAFF + LCFF, we can obtain an average value of such geometrical parameters (see also S19, ESI†). For the 12-mer in the B domain we obtain ![[small alpha, Greek, macron]](https://www.rsc.org/images/entities/i_char_e0c2.gif) = 8°,
= 8°, ![[d with combining macron]](https://www.rsc.org/images/entities/i_char_0064_0304.gif) CM–CM = 5.2 Å,
CM–CM = 5.2 Å, ![[r with combining macron]](https://www.rsc.org/images/entities/i_char_0072_0304.gif) = 3.5 Å,
= 3.5 Å, ![[x with combining macron]](https://www.rsc.org/images/entities/i_char_0078_0304.gif) = 3.9 Å. For the sake of comparison, we also report the corresponding values for A domain: = −28°, CM–CM = 4.0 Å, = 3.5 Å, = 2.3 Å.
= 3.9 Å. For the sake of comparison, we also report the corresponding values for A domain: = −28°, CM–CM = 4.0 Å, = 3.5 Å, = 2.3 Å.
While MD simulations suggest the opposite helix handedness to be the dominant, the above values of the geometrical parameters provide us a valuable flavour of the typical nearest-neighbour intermolecular pair motifs. These values compare well with those employed to simulate optical spectra in the previous Section. Besides critical aspects typically associated with simulations obtained with standard classical force fields, including assuming fixed charges and fixed parameters in spite of the large polarizability of the conjugated molecular structure, the presence of hydrogen bonds etc., it is likely that wrong handedness prediction for these systems may be caused by a free energy surface that strongly depends on the number of molecules, rendering its full exploration very challenging from the computational point of view. MD simulations on 12-mers were also exploited to select representative dimeric structures through clustering (see the ESI,† Section 4.4 for the adopted protocol). As expected, the largest abundance of the representative dimers refers to the right handedness. After carefully transferring these representative structures through constrained relaxations, we have run TD-DFT calculations on these representative dimers to calculate absorption and CD spectra (computational details in the ESI,† Section 4.5). Preliminary results obtained with two common functionals (B3LYP and CAM-B3LYP) are shown in Fig. S20 (ESI†). First, it is worth noticing that the calculated TD-DFT spectra predict CD features in agreement with the exciton or ESM-ES/CT models. Secondly, even for such simple dimers, the resulting spectra obtained with either functional have complex shapes, manifesting two spectral features and hence possibly supporting the presence of intermolecular CT interactions. Neither functional reproduces satisfactorily the experimental results: in both cases the blue-shifted spectral feature is too close to the monomer absorption peak, if compared with the experiment. As it is often the case, calculated spectra largely depend on the choice of the functional, suggesting that a more careful inspection of the electronic structure method is needed. Moreover, as discussed above, larger aggregates than dimers must be studied in order to extract reliable information. This may further complicate the spectra, making the TD-DFT calculations and the analysis of relevant results a very demanding task, definitely beyond the scope of this work.
5 Discussion and conclusions
An extensive experimental and theoretical study is presented on a large family of squaraine dyes in an effort to shed light on the structure of these fascinating systems showing astounding spectral features. The investigated proline-derived anilino squaraines have a similar chemical structure, bearing a chiral terminal group in each one of the two D moieties. The only difference among the investigated squaraine dyes is the length of the alkyl pendant attached to each D moiety: we were able to synthesize and characterize dyes with alkyl chains with a number of carbon atoms ranging from 3 to 12, as well as a dye bearing C16 chains. These alkyl chains are not part of the chromophoric system but steer the aggregation pattern. Upon aggregation, induced in solution by poor solvent titration, the different compounds show distinctively different spectral properties, suggesting different aggregation behavior. Specifically, the tendency to aggregate increases with the length of the alkyl chains. On the contrary, the nature of the formed aggregates, as demonstrated by the spectra, has a more complex and intriguing behavior. Specifically, dyes decorated with alkyl chains with intermediate length show two distinct and intense features in either the absorption and CD spectra, one located at longer wavelength vs. the monomer absorption the other one at shorter wavelengths. In aggregates of dyes with very short or very long alkyl chains, instead, the spectral features located at long wavelengths lose intensity and become almost irrelevant, while the spectral position of the two features is basically the same in all samples.The spectra of our colloidal suspensions of chiral aggregates, showing features appearing both to the blue and to the red of the monomer absorption, while much narrower, do share some similarity with the panchromatic spectra of squaraine films, then offering some useful hints about the origin of this technologically relevant and highly debated feature. Specifically, the consistent observation of two bisignated features in the CD spectrum of our aggregates, occurring at the frequencies of the red and blue-shifted absorption bands, allows to definitely exclude that the two signals are due to the two Davydov components of the relevant exciton, as expected in aggregates with oblique arrangement of the dyes. This conclusion definitely applies to our colloidal aggregates, but it can be very reasonably extended to squaraine aggregates in films. Other alternative scenarios are presently considered in the literature to explain the observation of two peaks in the spectra of non-chiral anilino squaraine films. In the first scenario, the observation of the two peaks is ascribed to intermolecular CT interactions, while an alternative view relies on the presence of disorder. Of course, the aggregation behavior can be markedly different in aggregates obtained from different squaraine dyes, however the chiroptical responses of our aggregates give precious additional information to shed light on this intriguing issue. Indeed, the presence of the two spectral features in our aggregates can be justified either in terms of a system where intermolecular interactions are purely ES in nature but two types of aggregation are present, or in terms of a single aggregation type in the presence of sizable intermolecular CT. On one side, the ESM-CT model hardly applies to systems where the feature to the blue is largely dominant, suggesting that most probably the specific case disorder is more important than intermolecular CT. However, due to the complexity of the calculation, the ESM-CT model could only be applied to systems not larger than a tetramer, leaving the doubt that finite size effects may alter the conclusion. While MD simulations do not fully unveil all structural details, they suggest an evolution of accessible configurations with the increase of the aggregate size. So, even if a direct comparison with the experiment remains a critical step, the atomistic information, i.e. the structure prediction by MD and the evaluation of the electronic structure with (TD)-DFT, can complement the information obtained with ESM and resize the boundary of the problem. Sizable intermolecular CT interactions are supported by preliminary TD-DFT results, that however require additional efforts to validate the functional choice and to extend the analysis to larger aggregates than dimers. At this stage, a definite conclusion is hardly reached. Additional and demanding simulations are needed to fully solve these issues.
In this study, we propose for the first time an explicit expression for the calculation of CD spectra of aggregates in the presence of intermolecular CT interactions, a highly non-trivial result. We learned that dimeric models may be adequate to describe linear spectral properties of aggregates, but fail for chiroptical properties. Moreover, we recognized an impressive superlinear amplification of the CD response with the aggregate dimension that survives both in the presence or in the absence of intermolecular CT interactions. While a firm conclusion about the structure of squaraine aggregates is hardly reached, we consider that this extensive study gives important information on chiral responses of molecular aggregates beyond the exciton model.
Conflicts of interest
There are no conflicts to declare.Acknowledgements
MS thanks the Linz Institute of Technology (LIT-2019-7-INC-313 SEAMBIOF) for funding and is grateful to Franz Badura from the PRO RETINA foundation. MFS and AL are obliged to the DFG GRK 2591 “Template-designed Organic Electronics – TIDE” for financial support. MFS thanks the Manchot Foundation for a doctoral scholarship. Work in Parma was funded by PNRR MUR project ECS-00000033-ECOSISTER, and benefited from the HPC center and from the equipment and framework of the COMP-HUB and COMP-R Initiatives, funded by the ‘Departments of Excellence program of the Italian Ministry for University and Research (MIUR, 2018–2022 and MUR, 2023–2027). MD simulations were run in Zagreb at the HPC (High Performance Computing) unit of the Division of Theoretical Physics of Ruer Bošković Institute. L. G. acknowledges the Croatian science foundation (HrZZ) through the project HYMO4EXNOMOMA (IP-2020-02-7262) and thanks Prof. Mark Wilson and Jane Boyd for the help with GAFF-LCFF. A. P. thanks Suresh Das for interesting discussion on the spectral properties of squaraine films. The authors thank Cristina Sissa for useful discussions.References
- S. Das, K. G. Thomas, R. Ramanathan, M. V. George and P. V. Kamat, Photochemistry of squaraine dyes. 6. Solvent hydrogen bonding effects on the photophysical properties of bis(benzothiazolylidene)squaraines, J. Phys. Chem., 1993, 97, 13625–13628 CrossRef CAS.
- S.-J. Chung, S. Zheng, T. Odani, L. Beverina, J. Fu, L. A. Padilha, A. Biesso, J. M. Hales, X. Zhan, K. Schmidt, A. Ye, E. Zojer, S. Barlow, D. J. Hagan, E. W. V. Stryland, Y. Yi, Z. Shuai, G. A. Pagani, J.-L. Brédas, J. W. Perry and S. R. Marder, Extended Squaraine Dyes with Large Two-Photon Absorption Cross-Sections, J. Am. Chem. Soc., 2006, 128, 14444–14445 CrossRef CAS PubMed.
- V. S. Jisha, K. T. Arun, M. Hariharan and D. Ramaiah, Site-Selective Binding and Dual Mode Recognition of Serum Albumin by a Squaraine Dye, J. Am. Chem. Soc., 2006, 128, 6024–6025 CrossRef CAS PubMed.
- F. Terenziani, A. Painelli, C. Katan, M. Charlot and M. Blanchard-Desce, Charge instability in quadrupolar chromophores: Symmetry breaking and solvatochromism, J. Am. Chem. Soc., 2006, 128, 15742–15755 CrossRef CAS PubMed.
- S. Sreejith, P. Carol, P. Chithra and A. Ajayaghosh, Squaraine dyes: a mine of molecular materials, J. Mater. Chem., 2008, 18, 264–274 RSC.
- L. Beverina and P. Salice, Squaraine Compounds: Tailored Design and Synthesis towards a Variety of Material Science Applications, Eur. J. Org. Chem., 2010, 1207–1225 CrossRef CAS.
- C. Sissa, F. Terenziani, A. Painelli, R. B. K. Siram and S. Patil, Spectroscopic Characterization and Modeling of Quadrupolar Charge-Transfer Dyes with Bulky Substituents, J. Phys. Chem. B, 2012, 116, 4959–4966 CrossRef CAS PubMed.
- T. Liu, X. Liu, W. Wang, Z. Luo, M. Liu, S. Zou, C. Sissa, A. Painelli, Y. Zhang, M. Vengris, M. V. Bondar, D. J. Hagan, E. W. Van Stryland, Y. Fang and K. D. Belfield, Systematic Molecular Engineering of a Series of Aniline-Based Squaraine Dyes and Their Structure-Related Properties, J. Phys. Chem. C, 2018, 122, 3994–4008 CrossRef CAS.
- F. J. AvilaFerrer, C. Angeli, J. Cerezo, S. Coriani, A. Ferretti and F. Santoro, The Intriguing Case of the One-Photon and Two-Photon Absorption of a Prototypical Symmetric Squaraine: Comparison of TDDFT and Wave-Function Methods, ChemPhotoChem, 2019, 3, 778–793 CrossRef CAS.
- J. He, Y. J. Jo, X. Sun, W. Qiao, J. Ok, T. Il Kim and Z. Li, Squaraine Dyes for Photovoltaic and Biomedical Applications, Adv. Funct. Mater., 2020, 31, 2008201 CrossRef.
- K. M. Shafeekh, S. Das, C. Sissa and A. Painelli, Asymmetric Squaraine Dyes: Spectroscopic and Theoretical Investigation, J. Phys. Chem. B, 2013, 117, 8536–8546 CrossRef CAS PubMed.
- G. M. Somashekharappa, C. Govind, V. Pulikodan, M. Paul, M. A. G. Namboothiry, S. Das and V. Karunakaran, Unsymmetrical Squaraine Dye-Based Organic Photodetector Exhibiting Enhanced Near-Infrared Sensitivity, J. Phys. Chem. C, 2020, 124, 21730–21739 CrossRef CAS.
- M. Basheer, U. Santhosh, S. Alex, K. G. Thomas, C. H. Suresh and S. Das, Design and synthesis of squaraine based near infrared fluorescent probes, Tetrahedron, 2007, 63, 1617–1623 CrossRef CAS.
- H.-Y. Ahn, S. Yao, X. Wang and K. D. Belfield, Near-Infrared-Emitting Squaraine Dyes with High 2PA Cross-Sections for Multiphoton Fluorescence Imaging, ACS Appl. Mater. Interfaces, 2012, 4, 2847–2854 CrossRef CAS PubMed.
- C. Magistris, S. Martiniani, N. Barbero, J. Park, C. Benzi, A. Anderson, C. Law, C. Barolo and B. ORegan, Near-infrared absorbing squaraine dye with extended conjugation for dye-sensitized solar cells, Renewable Energy, 2013, 60, 672–678 CrossRef CAS.
- K. Strassel, W.-H. Hu, S. Osbild, D. Padula, D. Rentsch, S. Yakunin, Y. Shynkarenko, M. Kovalenko, F. Nüesch, R. Hany and M. Bauer, Shortwave infrared-absorbing squaraine dyes for all-organic optical upconversion devices, Sci. Technol. Adv. Mater., 2021, 22, 194–204 CrossRef CAS PubMed.
- S. Sreejith, J. Joseph, M. Lin, N. V. Menon, P. Borah, H. J. Ng, Y. X. Loong, Y. Kang, S. W.-K. Yu and Y. Zhao, Near-Infrared Squaraine Dye Encapsulated Micelles for in Vivo Fluorescence and Photoacoustic Bimodal Imaging, ACS Nano, 2015, 9, 5695–5704 CrossRef CAS PubMed.
- O. S. Abdullaeva, F. Balzer, M. Schulz, J. Parisi, A. Lützen, K. Dedek and M. Schiek, Organic Photovoltaic Sensors for Photocapacitive Stimulation of Voltage-Gated Ion Channels in Neuroblastoma Cells, Adv. Funct. Mater., 2019, 29, 1805177 CrossRef.
- R. R. Avirah, D. T. Jayaram, N. Adarsh and D. Ramaiah, Squaraine dyes in PDT: from basic design to in vivo demonstration, Org. Biomol. Chem., 2012, 10, 911–920 RSC.
- P. S. S. Babu, P. M. Manu, T. J. Dhanya, P. Tapas, R. N. Meera, A. Surendran, K. A. Aneesh, S. J. Vadakkancheril, D. Ramaiah, S. A. Nair and M. R. Pillai, Bis(3,5-diiodo-2,4,6-trihydroxyphenyl)squaraine photodynamic therapy disrupts redox homeostasis and induce mitochondria-mediated apoptosis in human breast cancer cells, Sci. Rep., 2017, 7, 42126 CrossRef PubMed.
- G. Chen, H. Sasabe, W. Lu, X.-F. Wang, J. Kido, Z. Hong and Y. Yang, J-aggregation of a squaraine dye and its application in organic photovoltaic cells, J. Mater. Chem. C, 2013, 1, 6547 RSC.
- T. Maeda, T. V. Nguyen, Y. Kuwano, X. Chen, K. Miyanaga, H. Nakazumi, S. Yagi, S. Soman and A. Ajayaghosh, Intramolecular Exciton-Coupled Squaraine Dyes for Dye-Sensitized Solar Cells, J. Phys. Chem. C, 2018, 122, 21745–21754 CrossRef CAS.
- Y. Chen, W. Zhu, J. Wu, Y. Huang, A. Facchetti and T. J. Marks, Recent Advances in Squaraine Dyes for Bulk-Heterojunction Organic Solar Cells, Org. Photonics Photovoltaics, 2019, 6, 1–16 Search PubMed.
- S. Das, K. G. Thomas, K. J. Thomas, V. Madhavan, D. Liu, P. V. Kamat and M. V. George, Aggregation Behavior of Water Soluble Bis(benzothiazolylidene)squaraine Derivatives in Aqueous Mediasup/sup, J. Phys. Chem., 1996, 100, 17310–17315 CrossRef.
- S. Alex, M. C. Basheer, K. T. Arun, D. Ramaiah and S. Das, Aggregation Properties of Heavy Atom Substituted Squaraine Dyes: Evidence for the Formation of J-Type Dimer Aggregates in Aprotic Solvents, J. Phys. Chem. A, 2007, 111, 3226–3230 CrossRef CAS PubMed.
- S. D. Spencer, C. Bougher, P. J. Heaphy, V. M. Murcia, C. P. Gallivan, A. Monfette, J. D. Andersen, J. A. Cody, B. R. Conrad and C. J. Collison, The effect of controllable thin film crystal growth on the aggregation of a novel high panchromaticity squaraine viable for organic solar cells, Sol. Energy Mater. Sol. Cells, 2013, 112, 202–208 CrossRef CAS.
- S. Brück, C. Krause, R. Turrisi, L. Beverina, S. Wilken, W. Saak, A. Lützen, H. Borchert, M. Schiek and J. Parisi, Structure–property relationship of anilino-squaraines in organic solar cells, Phys. Chem. Chem. Phys., 2014, 16, 1067–1077 RSC.
- C. Zheng, I. Jalan, P. Cost, K. Oliver, A. Gupta, S. Misture, J. A. Cody and C. J. Collison, Impact of Alkyl Chain Length on Small Molecule Crystallization and Nanomorphology in Squaraine-Based Solution Processed Solar Cells, J. Phys. Chem. C, 2017, 121, 7750–7760 CrossRef CAS.
- G. M. Paternò, L. Moretti, A. J. Barker, C. DAndrea, A. Luzio, N. Barbero, S. Galliano, C. Barolo, G. Lanzani and F. Scotognella, Near-infrared emitting single squaraine dye aggregates with large Stokes shifts, J. Mater. Chem. C, 2017, 5, 7732–7738 RSC.
- C. Zheng, M. F. Mark, T. Wiegand, S. A. Diaz, J. Cody, F. C. Spano, D. W. McCamant and C. J. Collison, Measurement and Theoretical Interpretation of Exciton Diffusion as a Function of Intermolecular Separation for Squaraines Targeted for Bulk Heterojunction Solar Cells, J. Phys. Chem. C, 2020, 124, 4032–4043 CrossRef CAS.
- T. Wiegand, J. Godoy, S. Gupta, J. Cody, T. Coffey and C.-J. Collison, Optimal morphology, H-aggregation, and ternary blend excited state disruption in equilibrated squaraine-based all small molecule solar-cells, Thin Solid Films, 2022, 139623 Search PubMed.
- G. D'Avino, F. Terenziani and A. Painelli, Aggregates of quadrupolar dyes: Giant two-photon absorption from biexciton states, J. Phys. Chem. B, 2006, 110, 25590–25592 CrossRef PubMed.
- K. Jyothish, M. Hariharan and D. Ramaiah, Chiral Supramolecular Assemblies of a Squaraine Dye in Solution and Thin Films: Concentration-, Temperature-, and Solvent-Induced Chirality Inversion, Chem. – Eur. J., 2007, 13, 5944–5951 CrossRef CAS PubMed.
- M. Schulz, M. Mack, O. Kolloge, A. Lützen and M. Schiek, Organic photodiodes from homochiral L-proline derived squaraine compounds with strong circular dichroism, Phys. Chem. Chem. Phys., 2017, 19, 6996–7008 RSC.
- M. Schulz, J. Zablocki, O. S. Abdullaeva, S. Brück, F. Blazer, A. Lützen, O. Arteaga and M. Schiek, Giant intrinsic circular dichroism of prolinol-derived squaraine thin films, Nat. Commun., 2018, 9, 2413 CrossRef PubMed.
- N. J. Hestand, C. Zheng, A. R. Penmetcha, B. Cona, J. A. Cody, F. C. Spano and C. J. Collison, Confirmation of the origins of panchromatic spectra in squaraine thin films targeted for organic photovoltaic devices, J. Phys. Chem. C, 2015, 119, 18964–18974 CrossRef CAS.
- C. Zheng, C. Zhong, C. J. Collison and F. C. Spano, Non-Kasha behavior in quadrupolar dye aggregates: The red-shifted h-aggregate, J. Phys. Chem. C, 2019, 123, 3203–3215 CrossRef CAS.
- N. J. Hestand and F. C. Spano, Expanded Theory of H- and J-Molecular Aggregates: The Effects of Vibronic Coupling and Intermolecular Charge Transfer, Chem. Rev., 2018, 118, 7069–7163 CrossRef CAS PubMed.
- F. Balzer, N. J. Hestand, J. Zablocki, G. Schnakenburg, A. Lützen and M. Schiek, Spotlight on Charge-Transfer Excitons in Crystalline Textured n-Alkyl Anilino Squaraine Thin Films, J. Phys. Chem. C, 2022, 126, 13802–13813 CrossRef CAS.
- R. Bernhardt, M. Manrho, J. Zablocki, L. Rieland, A. Lützen, M. Schiek, K. Meerholz, J. Zhu, T. L. C. Jansen, J. Knoester and P. H. M. van Loosdrecht, Structural Disorder as the Origin of Optical Properties and Spectral Dynamics in Squaraine Nano-Aggregates, J. Am. Chem. Soc., 2022, 144, 19372–19381 CrossRef CAS PubMed.
- D. Timmer, F. Zheng, M. Gittinger, T. Quenzel, D. C. Lünemann, K. Winte, Y. Zhang, M. E. Madjet, J. Zablocki, A. Lützen, J.-H. Zhong, A. D. Sio, T. Frauenheim, S. Tretiak and C. Lienau, Charge Delocalization and Vibronic Couplings in Quadrupolar Squaraine Dyes, J. Am. Chem. Soc., 2022, 144, 19150–19162 CrossRef CAS PubMed.
- K. C. Deing, U. Mayerhöffer, F. Würthner and K. Meerholz, Aggregation-dependent photovoltaic properties of squaraine/PC61BM bulk heterojunctions, Phys. Chem. Chem. Phys., 2012, 14, 8328 RSC.
- A. Painelli, Amplification of NLO responses: vibronic and solvent effects in push-pull polyenes, Chem. Phys., 1999, 245, 185–197 CrossRef CAS.
- D. K. A. P. Huu, C. Sissa, F. Terenziani and A. Painelli, Optical spectra of organic dyes in condensed phases: the role of the medium polarizability, Phys. Chem. Chem. Phys., 2020, 22, 25483–25491 RSC.
- D. K. A. P. Huu, S. Saseendran and A. Painelli, Effective models for TADF: the role of the medium polarizability, J. Mater. Chem. C, 2022, 4620–4628 Search PubMed.
- M. Kasha, Energy Transfer Mechanism and the Molecular Exciton Model for Molecular Aggregates, Radiat. Res., 1964, 3, 317–331 Search PubMed.
- F. C. Spano, The Spectral Signatures of Frenkel Polarons in H- and J-Aggregates, Acc. Chem. Res., 2010, 43, 429–439 CrossRef CAS PubMed.
- F. Terenziani and A. Painelli, Supramolecular interactions in clusters of polar and polarizable molecules, Phys. Rev. B: Condens. Matter Mater. Phys., 2003, 68, 165405 CrossRef.
- M. Anzola, F. D. Maiolo and A. Painelli, Optical spectra of molecular aggregates and crystals: testing approximation schemes, Phys. Chem. Chem. Phys., 2019, 21, 19816–19824 RSC.
- M. Anzola and A. Painelli, Aggregates of polar dyes: beyond the exciton model, Phys. Chem. Chem. Phys., 2021, 23, 8282–8291 RSC.
- B. Bardi, C. Dall'Agnese, M. Tassé, S. Ladeira, A. Painelli, K. I. Moineau-Chane Ching and F. Terenziani, Multistimuli-Responsive Materials from Benzothiadiazole-Based Charge-Transfer Chromophores: Interdependence of Optical Properties and Aggregation, ChemPhotoChem, 2018, 2, 1027–1037 CrossRef CAS.
- C. Zhong, D. Bialas and F. C. Spano, Unusual Non-Kasha Photophysical Behavior of Aggregates of Push–Pull Donor–Acceptor Chromophores, J. Phys. Chem. C, 2020, 124, 2146–2159 CrossRef CAS.
- S. Sanyal, C. Sissa, F. Terenziani, S. K. Pati and A. Painelli, Superlinear amplification of the first hyperpolarizability of linear aggregates of DANS molecules, Phys. Chem. Chem. Phys., 2017, 19, 24979–24984 RSC.
- D. Giavazzi, S. Saseendran, F. Di Maiolo and A. Painelli, A Comprehensive Approach to Exciton Delocalization and Energy Transfer, J. Chem. Theory Comput., 2023, 19, 436–447 CrossRef CAS.
- E. U. Condon, Theories of Optical Rotatory Power, Rev. Mod. Phys., 1937, 9, 432–457 CrossRef CAS.
- D. P. Craig and T. Thirunamachandran, Molecular Quantum Electrodynamics, Academic Press, 1984 Search PubMed.
- K. Swathi, C. Sissa, A. Painelli and K. G. Thomas, Supramolecular chirality: a caveat in assigning the handedness of chiral aggregates, Chem. Commun., 2020, 56, 8281–8284 RSC.
- F. Bertocchi, C. Sissa and A. Painelli, Circular dichroism of molecular aggregates: A tutorial, Chirality, 2023 DOI:10.1002/chir.23565.
- B. Bardi, C. DallAgnese, K. I. Moineau-Chane Ching, A. Painelli and F. Terenziani, Spectroscopic Investigation and Theoretical Modeling of Benzothiadiazole-Based Charge-Transfer Chromophores: From Solution to Nanoaggregates, J. Phys. Chem. C, 2017, 121, 17466–17478 CrossRef CAS.
- C. Zheng, C. Zhong, C. J. Collison and F. C. Spano, Non-Kasha Behavior in Quadrupolar Dye Aggregates: The Red-Shifted H-Aggregate, J. Phys. Chem. C, 2019, 123, 3203–3215 CrossRef CAS.
- S. Kar, K. Swathi, C. Sissa, A. Painelli and K. G. Thomas, Emergence of Chiroptical Properties in Molecular Assemblies of Phenyleneethynylenes: The Role of Quasi-degenerate Excitations, J. Phys. Chem. Lett., 2018, 9, 4584–4590 CrossRef CAS PubMed.
- D. Van Der Spoel, E. Lindahl, B. Hess, G. Groenhof, A. E. Mark and H. J. C. Berendsen, GROMACS: Fast, flexible, and free, J. Comput. Chem., 2005, 26, 1701–1718 CrossRef CAS PubMed.
- J. Wang, R. M. Wolf, J. W. Caldwell, P. A. Kollman and D. A. Case, Development and Testing of a General Amber Force Field, J. Comput. Chem., 2004, 25, 1157 CrossRef CAS PubMed.
- C. I. Bayly, P. Cieplak, W. Cornell and P. A. Kollman, A Well-Behaved Electrostatic Potential Based Method Using Charge Restraints for Deriving Atomic Charges: the RESP Model, J. Phys. Chem., 1993, 97, 10269 CrossRef CAS.
- G. Bussi, Hamiltonian replica exchange in GROMACS: a flexible implementation, Mol. Phys., 2014, 112, 379–384 CrossRef CAS.
- N. J. Boyd and M. R. Wilson, Validating an optimized GAFF force field for liquid crystals: TNI predictions for bent-core mesogens and the first atomistic predictions of a dark conglomerate phase, Phys. Chem. Chem. Phys., 2018, 20, 1485–1496 RSC.
Footnotes |
| † Electronic supplementary information (ESI) available. See DOI: https://doi.org/10.1039/d2tc05555d |
| ‡ These authors contributed equally to this work. |
| This journal is © The Royal Society of Chemistry 2023 |