 Open Access Article
IrAu12 superatom modified by chiral diphosphines: doping-induced enhancement of chiroptical activity†
Haru
Hirai
 a,
Takuya
Nakashima
 *bc,
Shinjiro
Takano
 a,
Yukatsu
Shichibu
 de,
Katsuaki
Konishi
 *de,
Tsuyoshi
Kawai
 b and
Tatsuya
Tsukuda
 *a
*a
aDepartment of Chemistry, Graduate School of Science, The University of Tokyo, 7-3-1 Hongo, Bunkyo-ku, Tokyo 113-0033, Japan. E-mail: tsukuda@chem.s.u-tokyo.ac.jp
bDivision of Materials Science, Nara Institute of Science and Technology (NAIST), 8916-5 Takayama, Ikoma, Nara 630-0192, Japan
cDepartment of Chemistry, Graduate School of Science, Osaka Metropolitan University, 3-3-138 Sugimoto, Sumiyoshi-ku, Osaka 558-8585, Japan
dGraduate School of Environmental Science, Hokkaido University, North 10 West 5, Sapporo 060-0810, Japan
eFaculty of Environmental Earth Science, Hokkaido University, North 10 West 5, Sapporo 060-0810, Japan
First published on 1st February 2023
Abstract
Gold superatoms modified by chiral ligands are a new class of chiroptical nanomaterials, but improvement of their chiroptical properties, such as circular dichroism (CD) and circularly polarized luminescence (CPL), remains a challenge. In this work, we studied the effects of single-atom doping on the chiroptical properties of a representative Au13 superatom using [Au13((R,R)-DIPAMP)5Cl2]3+ and [Au13((S,S)-DIPAMP)5Cl2]3+ (Au13-R/S; DIPAMP = 1,2-bis[(2-methoxyphenyl)phenylphosphino]ethane). We synthesized an enantiomeric pair of superatoms: [IrAu12((R,R)-DIPAMP)5Cl2]+ and [IrAu12((S,S)-DIPAMP)5Cl2]+ (IrAu12-R/S). Single-crystal X-ray diffraction analysis revealed that the icosahedral Ir@Au12 core of IrAu12-R/S was more twisted along the Cl–Au–Ir–Au–Cl axis compared with the Au13 core of Au13-R/S, leading to a larger absorption anisotropy factor. IrAu12-R/S exhibited a much higher photoluminescence quantum yield (∼70%) compared with Au13-R/S (15%) due to a larger energy gap between the highest occupied and the lowest unoccupied molecular orbitals. Although Ir doping did not appreciably enhance the photoluminescence anisotropy factors, the brightness of the CPL of IrAu12-R/S was five times higher than that of Au13-R/S. This work provides a rational guide for improving the chiroptical activity of Au superatoms via the doping-mediated manipulation of the geometric and electronic structures.
Introduction
Ligand-protected gold (Au) and silver (Ag) superatoms with chiral structures have attracted growing interest as chiroptical nanomaterials because their atomically-precise structures make them ideal models for elucidating chiral structure–property correlations.1–4 Since the first preparation of the optically active Au superatom protected by L-glutathione,5 various enantiomeric superatoms have been synthesized using chiral ligands such as thiolates,6–9 diphosphines,10–14 alkynyls,15 and N-heterocyclic carbenes.16 Chiral superatoms also are obtained via the asymmetric arrangement of achiral ligands.17–21 Chiral counterions have often been used for the optical resolution and asymmetric synthesis of such chiral superatoms with achiral ligands.22–24 These superatoms and assemblies of them exhibit unique chiroptical properties such as circular dichroism (CD) and circularly polarized luminescence (CPL). The CD activity is determined by the absorption anisotropy factor (gabs), whereas the CPL is evaluated by the brightness (BCPL) as given via the following equation:25 | (1) |
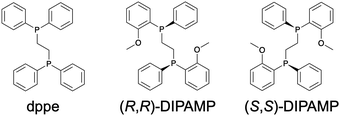
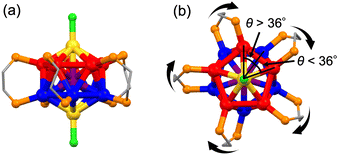
To test the effectiveness of the above strategies, we herein studied the effects of single-atom doping on the chiroptical properties of a representative Au13 superatom protected by chiral diphosphine ligands (Chart 1; dppe = 1,2-bis(diphenylphosphino)ethane, DIPAMP = 1,2-bis[(2-methoxyphenyl)phenylphosphino]ethane), i.e., [Au13((R,R)-DIPAMP)5Cl2]3+ (Au13-R) and [Au13((S,S)-DIPAMP)5Cl2]3+ (Au13-S).13,14 Single-crystal X-ray diffraction (SCXRD) analysis showed that the icosahedral Au@Au12 core consisted of a pair of Au5 rings bridged by five DIPAMP ligands with a linear Cl–Au–Au–Au–Cl axis at their center (Fig. 1a). The degree of structural distortion of the Au@Au12 core was evaluated via the dihedral angle of the two Au5 rings (θ) (Fig. 1b). The average deviation of θ from that of a perfect icosahedron (Δθ = |36° − θ|) was 1.19 ± 0.61° and 1.24 ± 0.59° for Au13-R/S, respectively.14 The dopant chosen in this study was iridium (Ir), based on the following findings obtained using achiral diphosphine ligands (Chart 1), for [Au13(dppe)5Cl2]3+ (Au13-dppe) and [IrAu12(dppe)5Cl2]+ (IrAu12-dppe). First, the Δθ value increased from 1.03 ± 0.95° for Au13-dppe to 1.69 ± 0.50° for IrAu12-dppe, probably due to the smaller atomic radius of Ir (2.0 Å) compared with that of Au (2.1 Å).28,29 Second, the ΦPL value increased markedly from 11% for Au13-dppe to ∼70% for IrAu12-dppe26 due to the expansion of the HOMO–LUMO (HL) gap from 1.9 eV for Au13-dppe to 2.3 eV for IrAu12-dppe. These results suggest that the chiroptical properties of the Au13 superatom can be improved through manipulation of the geometric and electronic structures via single-atom doping with Ir. To test this hypothesis, we fleshly synthesized an enantiomeric pair of Ir@Au12 superatoms: [IrAu12((R,R)-DIPAMP)5Cl2]+ (IrAu12-R) and [IrAu12((S,S)-DIPAMP)5Cl2]+ (IrAu12-S). The BCPL values of the IrAu12-R/S enantiomers were five times larger than those of the non-doped Au13-R/S enantiomers, mainly due to the enhancement of ΦPL (eqn (1)).
Experimental section
Synthesis and characterization of IrAu12-R/S·(PF6)
The PF6-salt of IrAu12-R/S was synthesized according to the synthesis method for IrAu12-dppe.26 The Au13-R/S enantiomers were also synthesized as a reference according to the method in ref. 14. Single crystals of IrAu12-R/S·(PF6) suitable for SCXRD measurements were obtained via recrystallization from CH2Cl2/cyclopentyl methyl ether. Details of the synthesis and the characterization of IrAu12-R/S are provided in the ESI.†Optical and chiroptical measurements
The UV–Vis absorption spectra and CD spectra were recorded using a Jasco V-670 spectrometer and a JASCO J-725 spectropolarimeter, respectively. The gabs values were calculated using the equation gabs = θ [mdeg]/(32![[thin space (1/6-em)]](https://www.rsc.org/images/entities/char_2009.gif) 980·Abs) using the CD (θ: ellipticity) and absorbance (Abs) data. PL spectra were recorded using a Jasco FP-8500 spectrofluorometer. The absolute value of ΦPL was measured at ambient temperature using a Hamamatsu Photonics CC9920-02G assembly with an integration sphere. The PL lifetime measurements were carries out using a C4780 streak camera. The excitation source was generated using a Nd:YVO4 laser (Verdi, Coherent) pumped Ti:sapphire laser system (Mira-900, Coherent) equipped with a cavity dumper (Pulse Switch, Coherent), which delivers 100 fs pulse trains at 800 nm. After doubling the frequency with a LiB3O5 crystal, the incident pulses were focused onto the samples (excitation wavelength = 400 nm). The PL decay curves were extracted from the 2D streak images in the range of 95 nm centered at the PL peak of each temperature. CPL spectra were recorded using a homemade CPL spectroscopy system equipped with a UV laser diode (375 nm) as the excitation source.30 The gPL values were calculated using the equation gPL = 2(IL − IR)/(IL + IR), where IL and IR are the PL intensity of the left and right circularly polarized light, respectively. An Ar-saturated solution was used for the PL and CPL measurements. The temperature for the PL and PL lifetime measurements was controlled in the range of 80–300 K using an Oxford Instruments OptistatDN liquid N2 cryostat. For variable-temperature (VT) UV-Vis, CD, and CPL studies, the temperature of the samples was controlled in the range of 200–300 K using a Unisoku CoolSpeK cryogenic cell holder.
980·Abs) using the CD (θ: ellipticity) and absorbance (Abs) data. PL spectra were recorded using a Jasco FP-8500 spectrofluorometer. The absolute value of ΦPL was measured at ambient temperature using a Hamamatsu Photonics CC9920-02G assembly with an integration sphere. The PL lifetime measurements were carries out using a C4780 streak camera. The excitation source was generated using a Nd:YVO4 laser (Verdi, Coherent) pumped Ti:sapphire laser system (Mira-900, Coherent) equipped with a cavity dumper (Pulse Switch, Coherent), which delivers 100 fs pulse trains at 800 nm. After doubling the frequency with a LiB3O5 crystal, the incident pulses were focused onto the samples (excitation wavelength = 400 nm). The PL decay curves were extracted from the 2D streak images in the range of 95 nm centered at the PL peak of each temperature. CPL spectra were recorded using a homemade CPL spectroscopy system equipped with a UV laser diode (375 nm) as the excitation source.30 The gPL values were calculated using the equation gPL = 2(IL − IR)/(IL + IR), where IL and IR are the PL intensity of the left and right circularly polarized light, respectively. An Ar-saturated solution was used for the PL and CPL measurements. The temperature for the PL and PL lifetime measurements was controlled in the range of 80–300 K using an Oxford Instruments OptistatDN liquid N2 cryostat. For variable-temperature (VT) UV-Vis, CD, and CPL studies, the temperature of the samples was controlled in the range of 200–300 K using a Unisoku CoolSpeK cryogenic cell holder.
Results and discussion
Geometric structure
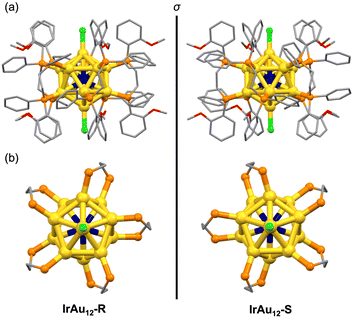
Isotopically resolved electrospray ionization (ESI) mass spectra of the IrAu12-R/S samples confirmed the composition and charge state of [IrAu12(DIPAMP)5Cl2]+ (Fig. S1, ESI†). The mass spectra also exhibited small peaks at m/z ≈ 4963, assigned to [IrAu12(DIPAMP)5ClBr]+ (IrAu12-Br) that originated from impurities in the chemicals used during the synthesis. Ratios of the peak area of IrAu12-Br to IrAu12-R/S were 0.05 and 0.04, respectively, indicating that the purity of IrAu12-R/S was ∼95 mol%. The purities of the IrAu12-R/S samples were further confirmed using 1H NMR and elemental analysis. The 1H NMR charts of the IrAu12-R/S samples showed signals only for the DIPAMP ligands and the cyclopentyl methyl ether (CPME) used for crystallization (Fig. S2, ESI†). The ratio of the integrated signals indicated that the samples contained two equivalents of CPME to IrAu12-R/S. The elemental analysis demonstrated that IrAu12-R/S contained 1.31 wt% of Cl, which was reproduced by considering that the samples consisted of 95 mol% of IrAu12-R/S·(PF6)·(CPME)2 and 5 mol% IrAu12-Br·(PF6)·(CPME)2. Nevertheless, based on a previous report that the optical absorption profile and ΦPL value of Au13-dppe were hardly changed by replacing the Cl ligands with Br,31 we concluded that the effect of the IrAu12-Br impurity on the optical and chiroptical measurements was negligible.The geometric structures of IrAu12-R/S were solved via SCXRD analysis. The unit cell contained a single IrAu12-R/S molecule and a PF6 anion, supporting the monovalent charge state for IrAu12-R/S as determined via ESI mass spectrometry. As shown in Fig. 2a, the IrAu12-R/S enantiomers have an icosahedral IrAu12 core ligated by five DIPAMP ligands and two Cl ligands. The position of the Ir atom could not been determined via SCXRD analysis due to the inability of distinguishing the electron density of Ir from Au. 31P{1H} NMR analysis was performed to reveal the location of Ir in the IrAu12 core (Fig. S3, ESI†). The single peak in the 31P{1H} NMR charts of IrAu12-R/S indicated that all ten phosphorus nuclei of the DIPAMP ligands were equivalent on the NMR time scale. Thus, the Ir atom was located at the center of the icosahedral core. The metal–metal bond lengths of IrAu12-R/S and Au13-R/S are summarized in Fig. S4 and Table S1 (ESI†). The average lengths of the Ir–Au bonds in IrAu12-R/S were 2.726 ± 0.012 Å and 2.729 ± 0.017 Å, respectively, which were shorter than those of the corresponding radial Au–Au bonds in Au13-R/S (2.761 ± 0.033 Å and 2.761 ± 0.034 Å, respectively).14 The average lengths of the peripheral Au–Au bonds of IrAu12-R/S (2.866 ± 0.026 Å and 2.870 ± 0.034 Å, respectively) were also shorter than those of Au13-R/S (2.904 ± 0.030 Å and 2.903 ± 0.032 Å, respectively).14 The contraction of the Ir@Au12 core with respect to Au@Au12 is due to the smaller van der Waals radius of Ir (2.0 Å) compared with that of Au (2.1 Å).32 The torsion of the Ir@Au12 core was quantified using the average value of Δθ (Fig. 2b). The values were 1.47 ± 0.30° and 1.89 ± 0.67° for IrAu12-R/S, respectively, which were larger than those of Au13-R/S (1.19 ± 0.61° and 1.24 ± 0.59°, respectively).14 These results indicated that the Au5 rings of the Ir@Au12 core were more twisted around the Cl–Au–Ir–Au–Cl axis compared with those of the Au13 core. In conclusion, the introduction of a smaller Ir atom to the Au13 core induced further distortion.
UV–Vis absorption and CD properties
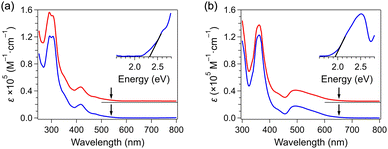
The UV–Vis absorption spectra of IrAu12-R/S (Fig. 3a) exhibited a distinct peak at 418 nm with an ε value of 2.08 × 10⁴ M−1 cm−1 and 2.01 × 10⁴ M−1 cm−1, respectively. These ε values were larger than those of Au13-R/S at 495 nm (1.61 × 10⁴ M−1 cm−1 and 1.76 × 10⁴ M−1 cm−1, respectively) (Fig. 3b).14 The onsets of the spectra revealed that the HL gaps of IrAu12-R/S were 2.3 eV, which are larger than those of Au13-R/S (1.9 eV) (insets of Fig. 3).14 These results indicated the expansion of the HL gap upon Ir doping, as observed in IrAu12-dppe and Au13-dppe (Table 1).26 Fig. S5 (ESI†) shows the VT UV–Vis spectra of IrAu12-R/S in 2-methyltetrahydrofuran (MeTHF) recorded at 300 and 200 K. The spectrum at 200 K exhibited a sharper profile than that of the spectrum at 300 K because the hot band transition was suppressed at the lower temperature.33–35 As a result, the two peaks at 420 and 470 nm became more pronounced and a new shoulder structure appeared at ∼520 nm (the insets of Fig. S5, ESI†).| Superatom | HL gap (eV) | ε (× 104 M−1 cm−1) | |gabs| (× 10−3) | λ PL (nm) | Φ PL (%) | τ PL (μs) | λ CPL (nm) | |gPL| (× 10−3) | Ref. |
|---|---|---|---|---|---|---|---|---|---|
| The numbers in parentheses represent the excitation wavelength. | |||||||||
| IrAu12-S | 2.3 | 2.01 (418 nm) | ∼4 (475 nm, 300 K) | ∼609 (400 nm) | 65.9 | 5.87 | ∼600 | ∼2 (600 nm, 300 K) | |
| ∼5 (475 nm, 200 K) | ∼4 (600 nm, 200 K) | ||||||||
| Au13-S | 1.9 | 1.76 (495 nm) | ∼2 (400 nm, 300 K) | ∼792 | 15 | 3.19 | ∼760 | ∼2 (760 nm, 300 K) | 13 |
| ∼3 (400 nm, 200 K) | ∼(4–5) (760 nm, 200 K) | ||||||||
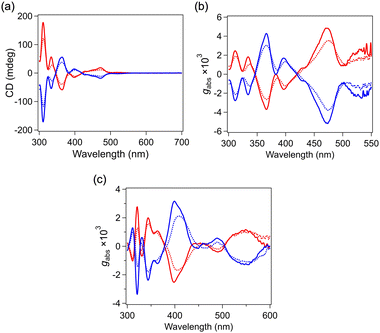
The VT CD spectra of IrAu12-R/S are shown in Fig. 4a. The spectral profiles of the enantiomeric pair show a mirror image relationship, indicating the enantiopurity of the samples. The peak positions in the CD spectra at ∼310, 340, 370, 400, 470, and 530 nm corresponded to the absorption peaks and shoulder at ∼305, 350, 420, 470 and 520 nm, respectively. The CD response for IrAu12-R/S in the visible region is associated with the optical transition within the chiral Ir@Au12 core since the frontier orbitals are assigned to superatomic orbitals according to density functional theory calculations.26 The |gabs| spectra of IrAu12-R/S and Au13-R/S are presented in Fig. 4b and c, respectively. The |gabs| values of IrAu12-R/S are ∼3 × 10⁻³ at 365 nm and ∼4 × 10⁻³ at 475 nm, respectively, at 300 K (Table 1). By contrast, the maximum |gabs| value for Au13-R/S was ∼2 × 10⁻³ at 400 nm at 300 K (Table 1), which is consistent with the reported value.13 According to the theoretical study in ref. 13, the higher |gabs| value for IrAu12-R/S compared with that for Au13-R/S is ascribed to the larger torsion of the Ir@Au12 core. The CD intensity of IrAu12-R/S was enhanced by lowering the temperature from 300 to 200 K (Fig. 4a). The |gabs| value increased at 200 K to ∼4 × 10⁻³ at 365 nm and ∼5 × 10⁻³ at 474 nm, respectively (Fig. 4b, Table 1). The enhancement at the lower temperature is probably associated with the suppression of the thermal fluctuation of the Ir@Au12 core structure. A similar temperature dependence was observed for the |gabs| values of Au13-R/S (Fig. 4c). The |gabs| value at 400 nm was enhanced to ∼3 × 10⁻³ by lowering the temperature to 200 K (Table 1).
PL and CPL properties
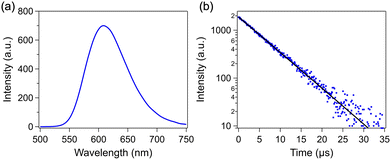
The PL spectra of IrAu12-S were recorded in de-aerated MeTHF (Fig. 5a). The PL peak of IrAu12-S appeared at 609 nm at ambient temperature, which was shorter than that of Au13-R/S (792 nm).14 This blueshift reflects the expansion of the HL gap by the doping with Ir. The ΦPL values of IrAu12-R/S in MeTHF at 300 K were 69.9% and 65.9%, respectively(Fig. S6, ESI† and Table 1), and were much higher than the reported value of Au13-R/S (15%).14 The time-resolved PL decay of IrAu12-S and Au13-S was also measured (Fig. 5b and Fig. S7, ESI†). The PL lifetime (τPL), obtained through fitting with a single exponential function, of IrAu12-S (5.87 μs) was longer than that of Au13-S (3.19 μs) (Table 1). The increase in ΦPL and τPL associated with the expansion of the HL gap was consistent with the case of IrAu12-dppe and Au13-dppe. According to the energy gap law, an increase in the PL energy suppresses the nonradiative relaxation process.36The VT CPL spectra of IrAu12-R/S and Au13-R/S were recorded in de-aerated MeTHF and a MeOH–EtOH mixture (1![[thin space (1/6-em)]](https://www.rsc.org/images/entities/char_2009.gif) :
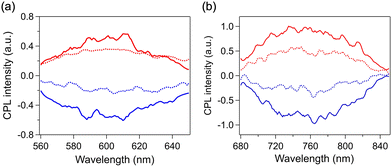
:![[thin space (1/6-em)]](https://www.rsc.org/images/entities/char_2009.gif) 1 v/v), respectively (Fig. 6). The spectral profiles of the enantiomeric pairs of both samples are mirror images. The CPL bands peaked at ∼600 and ∼760 nm for IrAu12-R/S and Au13-R/S, respectively, which are comparable to the positions of the corresponding PL bands at 300 K. The |gPL| values for IrAu12-R/S at 300 K were ∼3 × 10⁻³ and ∼2 × 10⁻³, respectively (Table 1), whereas those for Au13-R/S were ∼2 × 10⁻³, which are comparable to the reported values (2.5 × 10⁻³ and −2.3 × 10⁻³ for Au13-R/S, respectively).14 Note that the different |gPL| values between IrAu12-R/S are due to the limited sensitivity of the CPL measurement setup. The similarity of the |gPL| values between IrAu12-R/S and Au13-R/S is probably associated with the similar structures in the photoexcited state responsible for PL. The |gPL| values of IrAu12-R/S and Au13-R/S increased to ∼4 × 10⁻³ and ∼(4–5) × 10−3, respectively, upon lowering the temperature to 200 K (Fig. 6 and Table 1). The |gPL| values of IrAu12-R/S were of the same order (∼10−3) as those reported for other superatoms, whereas the ΦPL values of IrAu12-R/S were much higher than those of other chiral superatoms in either the solid or self-assembled state.11,15,19,21 Therefore, IrAu12-R/S are superior in terms of the CPL brightness (BCPL) defined using eqn (1).25 The BCPL value of IrAu12-S was 26 M−1 cm−1 (λ = 418 nm) at 300 K. This value is approximately five times higher than that of Au13-S (BCPL = 5.3 M−1 cm−1, λ = 495 nm) at 300 K, indicating that doping with Ir brightened the CPL, mainly by increasing the molar absorption coefficient at 495 nm and the HL gap of Au13-R/S.
1 v/v), respectively (Fig. 6). The spectral profiles of the enantiomeric pairs of both samples are mirror images. The CPL bands peaked at ∼600 and ∼760 nm for IrAu12-R/S and Au13-R/S, respectively, which are comparable to the positions of the corresponding PL bands at 300 K. The |gPL| values for IrAu12-R/S at 300 K were ∼3 × 10⁻³ and ∼2 × 10⁻³, respectively (Table 1), whereas those for Au13-R/S were ∼2 × 10⁻³, which are comparable to the reported values (2.5 × 10⁻³ and −2.3 × 10⁻³ for Au13-R/S, respectively).14 Note that the different |gPL| values between IrAu12-R/S are due to the limited sensitivity of the CPL measurement setup. The similarity of the |gPL| values between IrAu12-R/S and Au13-R/S is probably associated with the similar structures in the photoexcited state responsible for PL. The |gPL| values of IrAu12-R/S and Au13-R/S increased to ∼4 × 10⁻³ and ∼(4–5) × 10−3, respectively, upon lowering the temperature to 200 K (Fig. 6 and Table 1). The |gPL| values of IrAu12-R/S were of the same order (∼10−3) as those reported for other superatoms, whereas the ΦPL values of IrAu12-R/S were much higher than those of other chiral superatoms in either the solid or self-assembled state.11,15,19,21 Therefore, IrAu12-R/S are superior in terms of the CPL brightness (BCPL) defined using eqn (1).25 The BCPL value of IrAu12-S was 26 M−1 cm−1 (λ = 418 nm) at 300 K. This value is approximately five times higher than that of Au13-S (BCPL = 5.3 M−1 cm−1, λ = 495 nm) at 300 K, indicating that doping with Ir brightened the CPL, mainly by increasing the molar absorption coefficient at 495 nm and the HL gap of Au13-R/S.
Conclusions
We successfully synthesized the enantiomeric pair of Ir@Au12 superatoms protected by DIPAMP chiral diphosphine ligands and studied the single-atom doping effect on the chiroptical properties of the Au@Au12 superatoms. The icosahedral Ir@Au12 superatom was distorted more than the corresponding Au@Au12, resulting in larger |gabs| values for the former. Doping with the Ir atom expanded the HOMO–LUMO gap of the Au13 superatom, leading to the marked increase in ΦPL from 15% to ∼70%. By contrast, the |gPL| values of the IrAu12 and Au13 superatoms were comparable. As a whole, the CPL brightness of the Au13 superatom was enhanced by nearly five times upon introducing Ir at the center. This work provides a new strategy to enhance the CPL brightness of Au superatoms via the doping-mediated control of geometric and electronic structures.Author contributions
Haru Hirai: data curation, investigation, writing – original draft. Takuya Nakashima: formal analysis, investigation. Shinjiro Takano: conceptualization, investigation. Yukatsu Shichibu: data curation, methodology. Katsuaki Konishi: data curation, methodology. Tsuyoshi Kawai: resource. Tatsuya Tsukuda: funding acquisition, project administration, supervision, writing – review and editing. Each author contributed substantially to the manuscript.Conflicts of interest
There are no conflicts to declare.Acknowledgements
This research was financially supported by JST, CREST (Grant No. JPMJCR20B2) and JSPS KAKENHI (Grant No. JP20H00370 and JP20J21726). This work was partly supported by the Photoexcitonix Project at Hokkaido University.Notes and references
- S. Knoppe and T. Bürgi, Acc. Chem. Res., 2014, 47, 1318–1326 CrossRef CAS PubMed.
- Y. Li, T. Higaki, X. Du and R. Jin, Adv. Mater., 2020, 32, 1905488 CrossRef CAS PubMed.
- Y. Zhu, J. Guo, X. Qiu, S. Zhao and Z. Tang, Acc. Mater. Res., 2021, 2, 21–35 CrossRef CAS.
- Y. Shichibu and K. Konishi, ChemNanoMat, 2022, 8, e202200194 CAS.
- T. G. Schaaff, G. Knight, M. N. Shafigullin, R. F. Borkman and R. L. Whetten, J. Phys. Chem. B, 1998, 102, 10643–10646 CrossRef CAS.
- S. Si, C. Gautier, J. Boudon, R. Taras, S. Gladiali and T. Bürgi, J. Phys. Chem. C, 2009, 113, 12966–12969 CrossRef CAS.
- S. Knoppe, A. C. Dharmaratne, E. Schreiner, A. Dass and T. Bürgi, J. Am. Chem. Soc., 2010, 132, 16783–16789 CrossRef CAS PubMed.
- K. R. Krishnadas, L. Sementa, M. Medves, A. Fortunelli, M. Stener, A. Fürstenberg, G. Longhi and T. Bürgi, ACS Nano, 2020, 14, 9687–9700 CrossRef CAS PubMed.
- T. Nakashima, R. Tanibe, H. Yoshida, M. Ehara, M. Kuzuhara and T. Kawai, Angew. Chem., Int. Ed., 2022, 61, e202208273 CrossRef CAS PubMed.
- S. Takano and T. Tsukuda, J. Phys. Chem. Lett., 2016, 7, 4509–4513 CrossRef CAS PubMed.
- L. Shi, L. Zhu, J. Guo, L. Zhang, Y. Shi, Y. Zhang, K. Hou, Y. Zheng, Y. Zhu, J. Lv, S. Liu and Z. Tang, Angew. Chem., Int. Ed., 2017, 56, 15397–15401 CrossRef CAS PubMed.
- J.-Q. Wang, Z.-J. Guan, W.-D. Liu, Y. Yang and Q.-M. Wang, J. Am. Chem. Soc., 2019, 141, 2384–2390 CrossRef CAS PubMed.
- Y. Yang, Q. Zhang, Z.-J. Guan, Z.-A. Nan, J.-Q. Wang, T. Jia and W.-W. Zhan, Inorg. Chem., 2019, 58, 3670–3675 CrossRef CAS PubMed.
- Y. Shichibu, Y. Ogawa, M. Sugiuchi and K. Konishi, Nanoscale Adv., 2021, 3, 1005–1011 RSC.
- M.-M. Zhang, X.-Y. Dong, Z.-Y. Wang, X.-M. Luo, J.-H. Huang, S.-Q. Zang and T. C. W. Mak, J. Am. Chem. Soc., 2021, 143, 6048–6053 CrossRef CAS PubMed.
- R. W. Y. Man, H. Yi, S. Malola, S. Takano, T. Tsukuda, H. Häkkinen, M. Nambo and C. M. Crudden, J. Am. Chem. Soc., 2022, 144, 2056–2061 CrossRef CAS PubMed.
- I. Dolamic, S. Knoppe, A. Dass and T. Bürgi, Nat. Commun., 2012, 3, 798 CrossRef PubMed.
- H. Yoshida, M. Ehara, U. D. Priyakumar, T. Kawai and T. Nakashima, Chem. Sci., 2020, 11, 2394–2400 RSC.
- S. Chen, W. Du, C. Qin, D. Liu, L. Tang, Y. Liu, S. Wang and M. Zhu, Angew. Chem., Int. Ed., 2020, 59, 7542–7547 CrossRef CAS PubMed.
- H. Yi, K. M. Osten, T. I. Levchenko, A. J. Veinot, Y. Aramaki, T. Ooi, M. Nambo and C. M. Crudden, Chem. Sci., 2021, 12, 10436–10440 RSC.
- X. Q. Liang, Y. Z. Li, Z. Wang, S. S. Zhang, Y. C. Liu, Z. Z. Cao, L. Feng, Z. Y. Gao, Q. W. Xue, C. H. Tung and D. Sun, Nat. Commun., 2021, 12, 4966 CrossRef CAS PubMed.
- S. Knoppe, O. A. Wong, S. Malola, H. Häkkinen, T. Bürgi, T. Verbiest and C. J. Ackerson, J. Am. Chem. Soc., 2014, 136, 4129–4132 CrossRef CAS PubMed.
- H. Yao and M. Iwatsu, Langmuir, 2016, 32, 3284–3293 CrossRef CAS PubMed.
- J. Yan, H. Su, H. Yang, C. Hu, S. Malola, S. Lin, B. K. Teo, H. Häkkinen and N. Zheng, J. Am. Chem. Soc., 2016, 138, 12751–12754 CrossRef CAS PubMed.
- L. Arrico, L. di Bari and F. Zinna, Chem. – Eur. J., 2021, 27, 2920–2934 CrossRef CAS PubMed.
- H. Hirai, S. Takano, T. Nakashima, T. Iwasa, T. Taketsugu and T. Tsukuda, Angew. Chem., Int. Ed., 2022, 61, e202207290 CAS.
- N. Shinjo, S. Takano and T. Tsukuda, Bull. Korean Chem. Soc., 2021, 42, 1265–1268 CrossRef CAS.
- Y. Shichibu and K. Konishi, Small, 2010, 6, 1216–1220 CrossRef CAS PubMed.
- H. Hirai, S. Takano, T. Nakamura and T. Tsukuda, Inorg. Chem., 2020, 59, 17889–17895 CrossRef CAS PubMed.
- H. Tsumatori, T. Nakashima and T. Kawai, Org. Lett., 2010, 12, 2362–2365 CrossRef CAS PubMed.
- Z.-H. Gao, J. Dong, Q.-F. Zhang and L.-S. Wang, Nanoscale Adv., 2020, 2, 4902–4907 RSC.
- S. S. Batsanov, Inorg. Mater., 2001, 37, 871–885 CrossRef CAS.
- M. S. Devadas, S. Bairu, H. Qian, E. Sinn, R. Jin and G. Ramakrishna, J. Phys. Chem. Lett., 2011, 2, 2752–2758 CrossRef CAS.
- H. C. Weissker, H. B. Escobar, V. D. Thanthirige, K. Kwak, D. Lee, G. Ramakrishna, R. L. Whetten and X. López-Lozano, Nat. Commun., 2014, 5, 3785 CrossRef PubMed.
- Y. Negishi, T. Nakazaki, S. Malola, S. Takano, Y. Niihori, W. Kurashige, S. Yamazoe, T. Tsukuda and H. Häkkinen, J. Am. Chem. Soc., 2015, 137, 1206–1212 CrossRef CAS PubMed.
- K. Kwak, V. D. Thanthirige, K. Pyo, D. Lee and G. Ramakrishna, J. Phys. Chem. Lett., 2017, 8, 4898–4905 CrossRef CAS PubMed.
Footnote |
| † Electronic supplementary information (ESI) available. CCDC 2225808 and 2225809. For ESI and crystallographic data in CIF or other electronic format see DOI: https://doi.org/10.1039/d2tc05321g |
| This journal is © The Royal Society of Chemistry 2023 |

