 Open Access Article
Creative Commons Attribution 3.0 Unported Licence
Avoiding concentration quenching and self-absorption in Cs4EuX6 (X = Br, I) by Sm2+ doping
Casper
van Aarle
 *a,
Karl W.
Krämer
 b and
Pieter
Dorenbos
 a
a
aFaculty of Applied Sciences, Delft University of Technology, Mekelweg 15, Delft, The Netherlands. E-mail: c.vanaarle@tudelft.nl
bDepartment of Chemistry and Biochemistry, University of Bern, Freiestrasse 3, Bern, Switzerland
First published on 27th January 2023
Abstract
The benefits of doping Cs4EuBr6 and Cs4EuI6 with Sm2+ are studied for near-infrared scintillator applications. It is shown that undoped Cs4EuI6 suffers from a high probability of self-absorption, which is almost completely absent in Cs4EuI6:2% Sm. Sm2+ doping is also used to gain insight in the migration rate of Eu2+ excitations in Cs4EuBr6 and Cs4EuI6, which shows that concentration quenching is weak, but still significant in the undoped compounds. Both self-absorption and concentration quenching are linked to the spectral overlap of the Eu2+ excitation and emission spectra which were studied between 10 K and 300 K. The scintillation characteristics of Cs4EuI6:2% Sm is compared to that of the undoped samples. An improvement of energy resolution from 11% to 7.5% is found upon doping Cs4EuI6 with 2% Sm and the scintillation decay time shortens from 4.8 s to 3.5 s in samples of around 3 mm in size.
1. Introduction
The energy resolution is a key parameter in the development of γ-ray spectrometers. It is defined as the full width at half maximum of the photopeak in a pulse height spectrum and is a measure of how accurately γ-rays from different energies can be resolved. Typically, scintillator energy resolutions are compared under detection of 662 keV γ-rays from a 137Cs source. The current best energy resolution of 2.04% was achieved with LaBr3:Ce,Sr, for which a light yield of 70![[thin space (1/6-em)]](https://www.rsc.org/images/entities/char_2009.gif) 000 ph per MeV was reported.1 The energy resolution of LaBr3:Ce,Sr is close to the fundamental limit based on photon statistics, meaning significant improvements can only be made if more photons are detected in a scintillation event. This stresses the importance of developing high light yield scintillators. After the rediscovery of SrI2:Eu in 2008,2 SrI2:Eu has been further developed resulting in an energy resolution of 2.6% and light yields of up to 115
000 ph per MeV was reported.1 The energy resolution of LaBr3:Ce,Sr is close to the fundamental limit based on photon statistics, meaning significant improvements can only be made if more photons are detected in a scintillation event. This stresses the importance of developing high light yield scintillators. After the rediscovery of SrI2:Eu in 2008,2 SrI2:Eu has been further developed resulting in an energy resolution of 2.6% and light yields of up to 115![[thin space (1/6-em)]](https://www.rsc.org/images/entities/char_2009.gif) 000 ph per MeV have been reported.3–7 Among other Eu2+-doped halides, the best energy resolution of 2.3% was achieved with CsBa2I5:Eu, with reported light yields up to 100
000 ph per MeV have been reported.3–7 Among other Eu2+-doped halides, the best energy resolution of 2.3% was achieved with CsBa2I5:Eu, with reported light yields up to 100![[thin space (1/6-em)]](https://www.rsc.org/images/entities/char_2009.gif) 000 ph per MeV.8–11 This shows that Eu2+-doped halides are potential candidates for achieving an energy resolution below 2%.
000 ph per MeV.8–11 This shows that Eu2+-doped halides are potential candidates for achieving an energy resolution below 2%.
Despite these promising characteristics, Eu2+-doped scintillators still suffer from several drawbacks. Light yield and energy resolution typically tend to improve upon initial increase in Eu2+ concentration, but above several percent doping with Eu2+ these properties start to worsen again.12–16 This is at least in part caused by the large overlap between the Eu2+ excitation and emission spectrum, making Eu2+-doped halides prone to concentration quenching and, in the case of large crystals, self-absorption.3,17,18
Concentration quenching is caused by energy transfer between Eu2+ ions. This can take the form of consecutive transfer of a single excitation from one Eu2+ to another until it reaches a quenching site, or the excitation energy being lost by transfer to an already excited Eu2+ ion after which energy is lost due to relaxation back to the emitting state.19,20 Both these processes are strongly dependent on distance between Eu2+ ions and their effects can thus be diminished by increasing the distance between Eu2+ ions.21 Aside from reducing the amount of Eu2+ doping, this can also be achieved by selecting host compounds which intrinsically have larger distances between the divalent cation sites.
The compounds Cs4MX6 (M = Ca, Sr, Eu, Yb; X = Br, I) crystallize in the K4CdCl6-type structure with space group R![[3 with combining macron]](https://www.rsc.org/images/entities/char_0033_0304.gif) c.22 They contain a single M2+ site with isolated [MX6]4− octahedra, well separated from each other by Cs+ cations. Accordingly, the smallest M–M distance of R = 9.0 Å in Cs4EuI622–24 is much longer than for corner-sharing perovkites with R = 6.2 Å in CsEuI3.25 When only considering the dipole–dipole interaction (scaling with R−6
c.22 They contain a single M2+ site with isolated [MX6]4− octahedra, well separated from each other by Cs+ cations. Accordingly, the smallest M–M distance of R = 9.0 Å in Cs4EuI622–24 is much longer than for corner-sharing perovkites with R = 6.2 Å in CsEuI3.25 When only considering the dipole–dipole interaction (scaling with R−6![[thin space (1/6-em)]](https://www.rsc.org/images/entities/char_2009.gif) 21), the expected rate of energy transfer between Eu2+ nearest neighbours is around 10 times slower in Cs4EuI6 than it is in CsEuI3. Contribution of the exchange interaction will make this difference even larger. Based on this, one would expect that Cs4MX6 compounds are much less affected by concentration quenching than their CsMX3 counterparts, which is in line with the light yield increase reported by Wu et al. upon lowering the dimensionality of self-activated CsnEuI2+n compounds.24
21), the expected rate of energy transfer between Eu2+ nearest neighbours is around 10 times slower in Cs4EuI6 than it is in CsEuI3. Contribution of the exchange interaction will make this difference even larger. Based on this, one would expect that Cs4MX6 compounds are much less affected by concentration quenching than their CsMX3 counterparts, which is in line with the light yield increase reported by Wu et al. upon lowering the dimensionality of self-activated CsnEuI2+n compounds.24
Even though concentration quenching can be reduced by careful selection of the host lattice, the problem of self-absorption remains, especially for high Eu2+ concentration and large crystal size. A solution of the Eu2+ self-absorption problem in scintillators is the co-doping with Sm2+. With an addition of as little as 1% Sm2+, close to 100% of Eu2+ excitations are transferred to Sm2+ and almost exclusively Sm2+ emission is observed.26,27 The Sm2+ 4f55d → 4f6 emission can end up in any of the 4f6 [7FJ] states, while re-absorption can only take place from the 4f6 [7F0] ground state. Transitions to the 4f6 [7F1−6] states result in longer wavelength emissions that are less likely to be re-absorbed by other Sm2+ ions. In combination with the relatively low Sm2+ concentration of around 1%, the probably of self-absorption in Eu2+ and Sm2+ co-doped materials is greatly reduced compared to scintillators in which Eu2+ is the emitting ion.28
In this work, the benefits of doping Cs4EuBr6 and Cs4EuI6 with Sm2+ are studied in an attempt to solve self-absorption and concentration quenching and thereby develop a near-infrared scintillator. For this, Cs4EuBr6 and Cs4EuI6 samples were synthesizes with Sm2+ concentrations ranging from 0% to 2%. The amount of self-absorption is assessed for undoped and Sm2+-doped Cs4EuI6 through X-ray excited emission and decay measurements. Energy transfer from Eu2+ to Eu2+ and from Eu2+ to Sm2+ is studied through photoluminescence spectroscopy and decay studies. Lastly, the scintillation performance is assessed through 137Cs 662 keV γ-ray excited pulse height spectra.
2. Experimental techniques
Crystals of Cs4EuBr6, Cs4EuI6, and doped crystals with 0.5% and 2% Sm2+ were grown from the binary halides by the vertical Bridgman technique. CsBr (5N, Alfa) and CsI (suprapur, Merck) were dried in high vacuum at 200. EuBr2 and SmBr3 were prepared by the ammonium bromide method.29 The rare earth oxide M2O3 (M = Eu, 5N, Metall Rare earth Ltd; M = Sm, >3N, Fluka) was dissolved in concentrated HBr acid (suprapur, Merck) and an excess of NH4 Br (pro analysis, sublimed, Merck) added in a M to NH4 ratio of 2 to 7. The solution was dried up on a sand bath to yield the anhydrous ternary compound (NH4)3MBr6, which is subsequently decomposed to the binary bromide by heating in vacuum. EuBr2 was obtained at 500 °C and used without further purification. SmBr3 was sublimed at 650 °C in a silica apparatus under high vacuum for removal of SmOBr traces. SmBr2 was obtained by reduction of SmBr3 with Sm metal (3N; Alfa) in a Ta ampoule. The Ta-ampoule was sealed by helium arc-welding and enclosed into a silica ampoule under vacuum. The ampoule was heated to 900 °C for 7 days. The rare earth iodides were synthesized from the elements (Eu, 3N; Sm, 3N, both Alfa; I2, pro analysis, sublimed, Merck) in sealed silica ampoules under vacuum. EuI2 was obtained at 500 °C and purified by sublimation in an Au ampoule under vacuum at 900 °C. SmI3 was prepared at 700 °C and sublimed for purification at 800 °C. SmI2 was prepared from SmI3 and Sm in a Ta ampoule 1 day at 900 °C and 7 days at 600 °C.Stoichiometric amounts of the binary halides (about 5 g per sample) were sealed in Ta ampoules, as described above. The ampoules were heated in a Bridgman furnace to 560 °C, i.e., above the congruent melting points of Cs4EuBr6 at 545 °C and Cs4EuI6 at 540 °C. After 1 day at constant temperature, the crystal growth was started by slowly moving up the furnace. The samples were cooled to RT within about 10 days. Crystals were cleaved from the boules for spectroscopic investigations. The denoted doping level represents the melt composition. Since staring materials and products are highly hygroscopic and sensitive to oxidation, all handling was done under strictly dry and oxygen-free conditions (H2O and O2 < 0.1 ppm) in glove boxes and sealed sample containers.
X-ray excited emission spectra were measured using an X-ray tube with tungsten anode, operated at 79 kV and aluminium filter to block low energy X-rays for preventing radiation damage at the sample surface. The samples were attached to the cold finger of a Janis VPF-700 cryostat. The emission coming from the sample under a 90 angle with respect to the X-ray beam was coupled into an optical fibre and read out with an Ocean insights QE Pro spectrometer.
X-ray excited decay curves were measured using a time correlated single photon counting method. A start signal was generated upon triggering a PicoQuant LDH-P-C-400M laser diode exciting a Hamamatsu N5084 light excited X-ray tube with tungsten anode operated at 40 kV, creating a 500 ps long pulse of X-rays. Upon detection of a scintillation photon by the ID Quantique ID100-50 single-photon detector, a stop signal was generated. The start and stop signals were processed using an Ortec 567 time-to-amplitude converter of which the output was connected to an Ortec AD114 16k analog-to-digital converter. The sample was attached to the cold finger of a Janis VPF-700 cryostat. The sample chamber was kept at a vacuum of 10−5 mbar to protect the hygroscopic sample from moisture.
137Cs 662 keV γ-ray pulse height spectra of undoped samples were recorded using a R1791 photomultiplier tube (PMT) operated at a voltage of −700 V. The unpolished bare crystal was placed on the entrance window of the PMT and was covered with Teflon tape. No optical coupling was used. The number of photoelectrons created in a scintillation event was determined by comparing corresponding channel with the single electron response of the PMT. The light yield was calculated using the number of photoelectrons at the maximum of the 662 keV photopeak and correcting for the quantum efficiency and reflectivity of the PMT, using the method described by de Haas and Dorenbos.30
137Cs excited pulse height spectra of Sm2+-doped samples were recorded using an Advanced Photonix APD (type 630-70-72-510) operated at a bias voltage of 1690 V. The temperature of the APD was stabilised at 260 K. The APD signal was increased by a Cremit CR-112 pre-amplifier. The rest of the electronics are the same as used in the PMT set-up described above. The light yield was determined by comparing the channel of the photopeak with the peak from direct detection of 17.8 keV X-rays of 241Am.
Photoluminescence excitation and emission spectra were measured using a 450 W Xenon lamp and a Horiba Gemini 180 monochromator to excite the sample. Light from the sample was collected at a 90 angle with respect to the incoming excitation light. Reflected excitation light was filtered out with an optical filter. The emission light passed through a Princeton Instruments SpectraPro-SP2358 monochromator, after which it was detected by a Hamamatsu R7600-20 PMT. The sample was attached to the cold finger of a closed cycle helium cryostat.
Photoluminescence decay curves were recorded using an EKSPLA NT230 OPO laser to excite the sample with a repetition rate of 100 Hz and pulse duration of 10 ns. The emission passed through a Princeton Instruments SpectraPro-SP2358 monochromator and was detected by a Hamamatsu R7600U-20 PMT. An optical long pass filter was placed at the entrance of the monochromator to filter out the excitation light from the laser. The signal from the PMT was recorded using a CAEN DT5730 digitizer.
3. Results
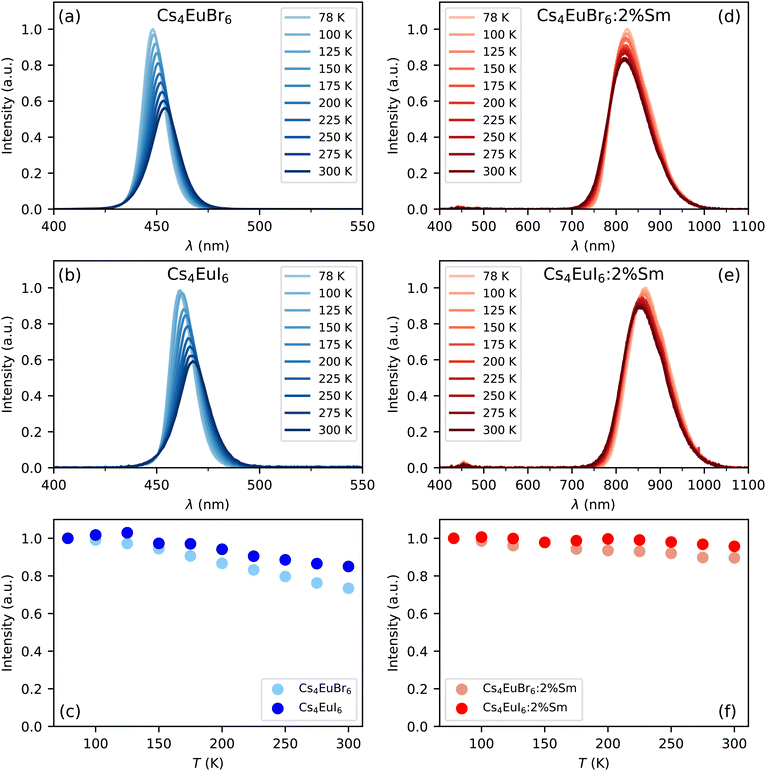
Fig. 1a and b show the X-ray excited emission spectra between 78 K and 300 K of undoped Cs4EuBr6 and Cs4EuI6, respectively. Cs4EuBr6 shows a single emission band around 450 nm. This emission band is assigned to the Eu2+ 4f6 5d → 4f7 transition. With increasing temperature, the peak of the emission band shifts to longer wavelengths. This is typically observed in materials with high Eu2+ concentration and is ascribed to self-absorption.8,13,31 Cs4EuI6 also shows a single emission band that is assigned to the Eu2+ 4f6 5d → 4f7 transition. The Eu2+ emission is located around 470 nm, at about 20 nm longer wavelength than for Cs4EuBr6. The emission band shows a similar shift to longer wavelengths with increasing temperature as was observed for Cs4EuBr6. The room temperature emission spectra of both samples correspond well to the data reported by Wu et al.24Fig. 1c shows the integrated emission intensity for Cs4EuBr6 and Cs4EuI6, normalised to their intensity at 78 K. The emission intensity of Cs4EuBr6 decreases by about 25% when temperature is increased from 78 K to 300 K. For Cs4EuI6, the emission intensity decreases by about 12%.Fig. 1d and e show the X-ray excited emission spectra between 78 K and 300 K of Cs4EuBr6:2% Sm and Cs4EuI6:2% Sm, respectively. Cs4EuBr6:2% Sm shows a broad emission band around 820 nm, which is assigned to the Sm2+ 4f55d → 4f6 transitions. With increasing temperature, the peak of the emission band shifts to shorter wavelengths. This is likely caused by thermal expansion of the sample, decreasing the crystal field splitting and thereby elevating the lowest 5d level to higher energies. The observation of the emission peak shifting to shorter wavelengths indicates a low probability of self-absorption of the Sm2+ emission. Cs4EuI6:2% Sm shows a similar broad emission band around 850 nm, which is also assigned to the Sm2+ 4f55d → 4f6 transition. Also in this sample, the peak of the Sm2+ emission shifts to shorter wavelengths as temperature is increased. In both samples, a small amount of Eu2+ emission is visible between 400 nm and 500 nm. The integrated emission intensity of Cs4EuBr6:2% Sm and Cs4EuI6:2% Sm is shown in Fig. 1f. Upon increasing the temperature from 78 K to 300 K, the emission intensity remains almost constant compared to the decrease in intensity observed in the undoped samples.
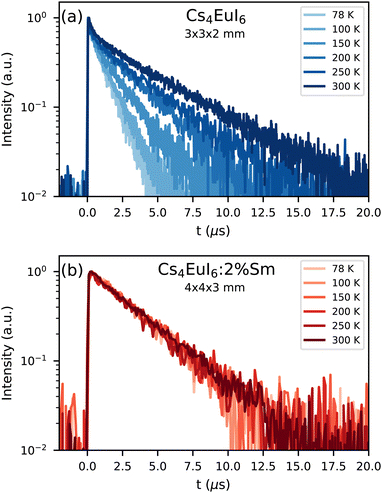
Fig. 2a shows the X-ray excited decay curves of a 3 × 3 × 2 mm3 Cs4EuI6 crystal between 78 K and 300 K. All decay curves show an initial fast component after which they converge to a single exponential of which the decay time increases with temperature. At 78 K, this decay time is 1.19 s and at 300 K it becomes 4 times slower with a decay time of 4.80 s. Fig. 2b shows the X-ray excited decay curves of a 4 × 4 × 3 mm3 Cs4EuI6:2% Sm crystal between 78 K and 300 K. A 630 nm long pass filter was placed between the sample and the detector to remove the small amount of remaining Eu2+ emission. Unlike the decay curve of undoped Cs4EuI6, no fast component is observed in the decay curve. The decay time is also almost independent of temperature and increases marginally from 3.16 s at 78 K to 3.50 s at 300 K.
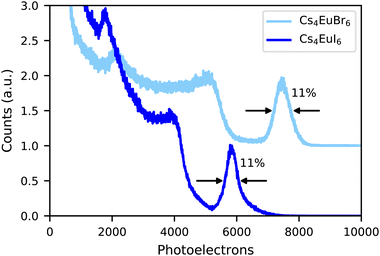
Fig. 3 shows the 137Cs 662 keV γ -ray pulse height spectra of undoped Cs4EuBr6 and Cs4EuI6 recorded on a PMT. The photopeak of Cs4EuBr6 corresponds to 7500 photoelectrons being emitted from the photocathode of the PMT. Taking into account the quantum efficiency (25%) and reflectivity (33%) of the PMT, the light yield is estimated around 30![[thin space (1/6-em)]](https://www.rsc.org/images/entities/char_2009.gif) 200 ph per MeV. Scintillation events in the photopeak of Cs4EuI6 correspond to 5800 photoelectrons. At its emission wavelength of 470 nm, the quantum efficiency of the PMT is 22% and the reflectivity is 35%. This gives a light yield of 26
200 ph per MeV. Scintillation events in the photopeak of Cs4EuI6 correspond to 5800 photoelectrons. At its emission wavelength of 470 nm, the quantum efficiency of the PMT is 22% and the reflectivity is 35%. This gives a light yield of 26![[thin space (1/6-em)]](https://www.rsc.org/images/entities/char_2009.gif) 100 ph per MeV. Both samples have an energy resolution of 11%.
100 ph per MeV. Both samples have an energy resolution of 11%.
Fig. 4 shows the 137Cs excited pulse height spectrum of Cs4EuI6:2% Sm recorded on an APD. In Fig. 4a, the pulse height spectrum is shown as recorded. On the x-axis, the number of primary electron–hole pairs created in the APD during a scintillation event is set out, which is equal to the amount of detected scintillation photons. This pulse height spectrum contains a background of events that are caused by absorption of γ-rays directly in the APD. The dashed curve is an exponential approximation for this background and has been subtracted from the data to result in the pulse height spectrum displayed in Fig. 4b. On average, 11![[thin space (1/6-em)]](https://www.rsc.org/images/entities/char_2009.gif) 000 photons are detected under the 662 keV photopeak, translating to a light yield of around 16
000 photons are detected under the 662 keV photopeak, translating to a light yield of around 16![[thin space (1/6-em)]](https://www.rsc.org/images/entities/char_2009.gif) 600 ph per MeV. An energy resolution of 7.5% has been attained.
600 ph per MeV. An energy resolution of 7.5% has been attained.
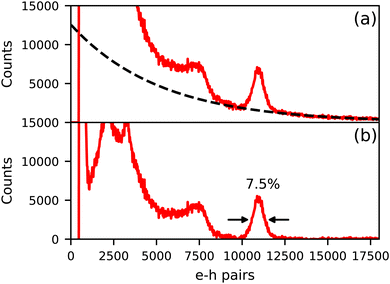 | ||
| Fig. 4 137Cs excited pulse height spectrum of Cs4EuI6:2% Sm measured on an APD. (a) Shows the spectrum as recorded and (b) shows the spectrum after background subtraction. | ||
Fig. 5 shows the photoluminescence excitation (dashed curves) and emission (solid curves) spectra of undoped Cs4EuBr6 and Cs4EuI6 between 10 K and 300 K. As temperature is increased, both samples show an increase in emission bandwidth and the excitation spectra stretch to longer wavelengths. The result is an increase in spectral overlap between the Eu2+ emission and Eu2+ excitation. This increase in spectral overlap increases the probability that Eu2+ emission is re-absorbed by other Eu2+, or that energy is transferred non-radiatively between neighbouring Eu2+ ions.
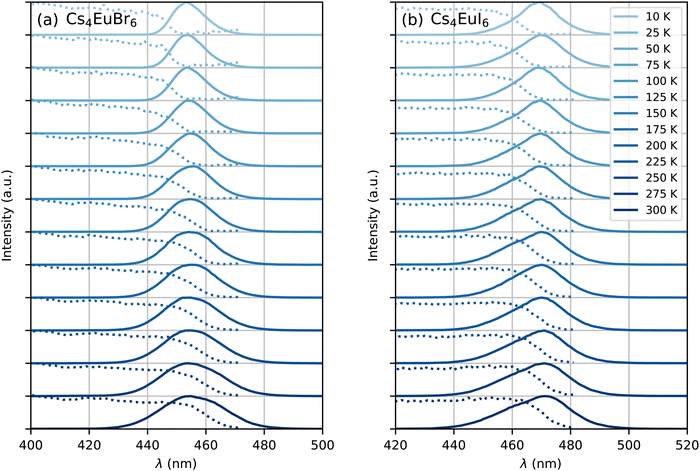 | ||
| Fig. 5 Photoluminescence excitation (dotted curve) and emission (solid curve) spectra between 10 K and 300 K of (a) Cs4EuBr6 and (b) Cs4EuI6. | ||
Fig. 6a shows the photoluminescence excitation and emission spectra of Cs4EuBr6:0.5% Sm at 300 K. Both the Eu2+ and Sm2+ 5d → 4f emission can be detected upon excitation at 350 nm, as shown by curve 1. The Eu2+ emission overlaps with the excitation spectrum of the Sm2+ emission (curve 3), which indicates that Eu2+ can transfer energy to Sm2+. Between 200 nm and 400 nm, the excitation spectrum of the Sm2+ 5d → 4f emission shows the same bands as the excitation spectrum of the Eu2+ 5d → 4f emission (curve 2). This confirms that energy transfer from Eu2+ to Sm2+ takes place.
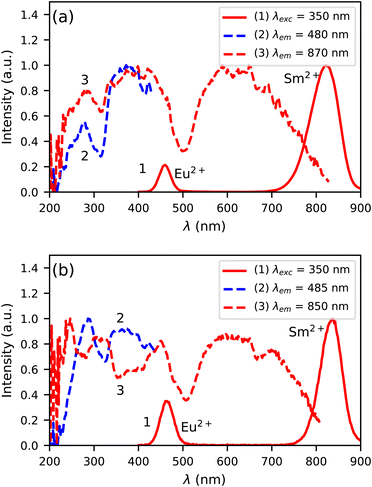 | ||
| Fig. 6 Photoluminescence excitation and emission spectra at 300 K of (a) Cs4EuBr6:0.5% Sm and (b) Cs4EuI6:0.5% Sm. | ||
In Fig. 6b, the photoluminescence excitation and emission spectra of Cs4EuI6:0.5% Sm are shown. Similar to Cs4EuBr6:0.5% Sm, it shows Eu2+ and Sm2+ 5d → 4f emission upon excitation at 350 nm, as shown by curve 1. In this case though, the excitation spectrum of the Sm2+ emission (curve 3) shows dips where the excitation spectrum of the Eu2+ emission (curve 2) shows highest intensity. This indicates that energy transfer from Eu2+ to Sm2+ is inefficient, which is likely due to the low Sm2+ concentration is this sample.
Fig. 7 shows the photoluminescence decay of Eu2+ emission in (a) Cs4EuBr6:0.5% Sm, (b) Cs4EuBr6:2% Sm, (c) Cs4EuI6:0.5% Sm and (d) Cs4EuI6:2% Sm. All samples show approximately the same behaviour. All decay curves deviate from exponential functions, starting with fast decay and becoming slower as time progresses. The initial fast decay rate is only moderately dependent on temperature. The largest temperature dependence is found in the tail of the decay, making all temperature series fan out. This behaviour strongly resembles that of migrationally accelerated energy transfer, where Eu2+ excitations are able to move closer to Sm2+ by means of energy transfer between neighbouring Eu2+ ions.20,32 The initial rising component in the decay curves of Fig. 7a and b are caused by the laser pulse duration of approximately 10 ns.
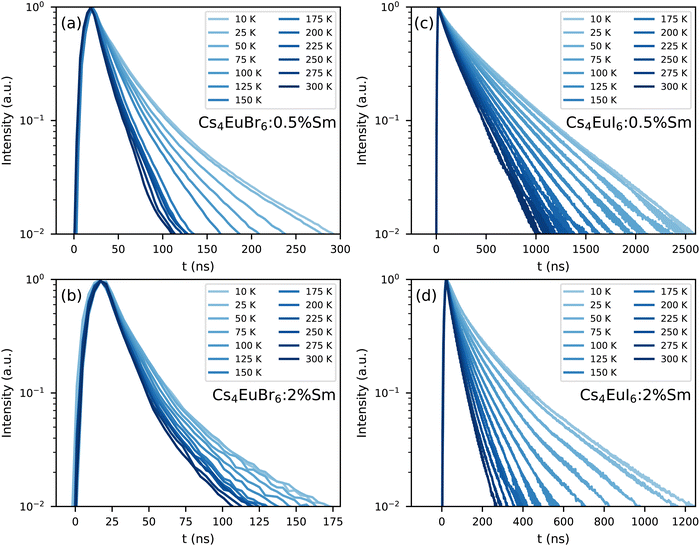 | ||
| Fig. 7 Photoluminescence decay of the Eu2+ emission upon 400 nm excitation between 10 K and 300 K in (a) Cs4EuBr6:0.5% Sm, (b) Cs4EuBr6:2% Sm, (c) Cs4EuI6:0.5% Sm and (d) Cs4EuI6:2% Sm. | ||
The lifetime of Eu2+ excitations varies strongly between the samples. As the decay curves cannot be approximated with a single exponential function, the 1/e-decay time τe is reported. τe is defined as the time it takes for the decay curve to decrease by a factor of 1/e starting from its maximum intensity. Increasing the Sm2+ concentration in Cs4EuBr6 from 0.5% to 2% decreases τe from 20 ns to 16 ns. For Cs4EuI6, the same increase in Sm2+ concentration decreases τe from 172 ns to 44 ns. This decrease of τe with increasing Sm2+ concentration is expected, as a higher Sm2+ causes faster non-radiative energy transfer to Sm2+.
Fig. 8a and b show the photoluminescence decay of Eu2+ and Sm2+ emission in Cs4EuBr6:2% Sm and Cs4EuI6:2% Sm, respectively. The excitation wavelength is 350 nm, at which primarily Eu2+ is excited. The decay time of the Sm2+ emission is 2.82 s in Cs4EuBr6:2% Sm and 3.26 s in Cs4EuI6:2% Sm. The Eu2+ emission is strongly quenched by the presence of Sm2+, therefore the inset shows the start of the decay curves on a shorter timescale. Here, it becomes visible that the Sm2+ emission intensity increases as the Eu2+ emission decays. This shows that excitations are transferred from Eu2+ to Sm2+.
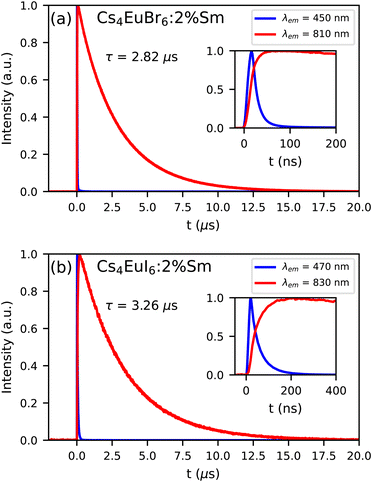 | ||
| Fig. 8 Photoluminescence decay of Eu2+ and Sm2+ emission upon 350 nm excitation at 300 K in (a) Cs4EuBr6:2% Sm and (b) Cs4EuI6:2% Sm. The insets show the same decay curve on a shorter time scale. | ||
4. Discussion
Both self-absorption and non-radiative energy transfer significantly modify a luminescence decay curve. The luminescence decay can thus yield information on the energy transfer processes in the sample. The probability of both processes scales with the spectral overlap between the excitation band of the absorbing ion and the emission band of the emitting ion. In the case of Eu2+ it is shown by Fig. 5 that temperature induced broadening of the Eu2+ excitation and emission bands results in a significant change in spectral overlap between these bands when going from 10 K to 300 K. This increase in spectral overlap occurs both in Cs4EuBr6 and Cs4EuI6. Based on this, it is expected that the probability of self-absorption and the non-radiative energy transfer rate between neighbouring Eu2+ ions increase with temperature. Both these processes typically decrease the light yield of a scintillator, which is in line with the observed decrease of the emission intensity under X-ray excitation, as shown in Fig. 1c.Fig. 2a shows the X-ray excited luminescence decay curves of Cs4EuI6. The experiment was performed in reflection mode, i.e., the detector was pointed to the surface of the sample illuminated by X-rays. With an average X-ray energy of around 10 keV, almost all X-rays are absorbed within the first 100 m below the sample surface; therefore almost all excitations of Eu2+ are present close to the surface on the side of the crystal oriented towards the detector. Light emitted into the direction of the detector has a low chance of being re-absorbed, thus the fast component visible in the first few microseconds gives an impression of the intrinsic radiative decay rate of Eu2+. The light which, after being emitted, travels deeper into the crystal has a high probability of being re-absorbed. The absorbed photons can be re-emitted into the direction of the detector and still contribute to the decay curve. The decay curve thereby converges to an exponential decay rate that is longer than the intrinsic radiative decay rate of Eu2+. This decay rate is given by eqn (1)33:
 | (1) |
| T (K) | Cs4EuI6 (3 × 3 × 2 mm3) | Cs4EuI6:2% Sm (4 × 4 × 3 mm3) | ||
|---|---|---|---|---|
| τ (μs) | a | τ (μs) | a | |
| 10 (PL) | 1.07 | — | 3.12 | — |
| 78 | 1.19 | 0.10 | 3.16 | 0.01 |
| 100 | 1.40 | 0.24 | 3.13 | 0.01 |
| 150 | 2.08 | 0.49 | 3.34 | 0.06 |
| 200 | 2.98 | 0.64 | 3.40 | 0.08 |
| 250 | 3.97 | 0.73 | 3.31 | 0.06 |
| 300 | 4.80 | 0.78 | 3.50 | 0.11 |
In the same temperature range, the Sm2+ emission of the 4 × 4 × 3 mm3 Cs4EuI6:2% Sm sample shows only a marginal increase in τ from 3.16 s to 3.50 s. Using eqn (1), the value of a is calculated for every temperature step. The results are summarised in Table 1. Even though the Cs4EuI6:2% Sm crystal is significantly larger than the undoped Cs4EuI6 crystal, the values of a are around 10 times lower at every temperature. This shows that the low sensitivity of Sm2+ to self-absorption combined with the low Sm2+ concentration is an effective way to almost completely solve the self-absorption problem of Cs4EuI6.
As Eu2+ transfers energy to Sm2+, doping the samples with Sm2+ introduces a large amount of quenching sites for Eu2+. Insight in the non-radiative energy transfer rate between Eu2+ ions can be attained by monitoring the photoluminescence decay of Eu2+ in the Sm2+-doped samples, see Fig. 7. Directly after excitation of Eu2+, the Eu2+ excitations are randomly distributed through the lattice. As the rate of non-radiative energy transfer scales with R−6, excited Eu2+ ions that happen to be close to Sm2+ will transfer their energy to Sm2+ with higher probability than those at larger distance. Therefore the Eu2+ excitations will be depleted rapidly close to Sm2+. In this stage, corresponding to the first tens of nanoseconds of the decay curves, the rate at which Sm2+ can deplete the volume around it is the limiting factor in the decay rate of Eu2+. Once the volume around Sm2+ has been depleted, non-radiative energy transfer between Eu2+ ions will replenish the excitations in the depleted volumes. At this point, non-radiative energy transfer between Eu2+ ions becomes the limiting factor of the Eu2+ decay rate and causes the Eu2+ decay to slow down.
The rate at which Sm2+ depletes the Eu2+ excitations around it is almost independent of temperature, because the spectral overlap between the Eu2+ emission bands and the Sm2+ absorption bands does not change much with temperature. On the other hand, the rate of non-radiative energy transfer between Eu2+ ions does depend on temperature, because the spectral overlap between the Eu2+ excitation and emission spectra increases with temperature, see Fig. 5. This is also visible in Fig. 7; during the depletion of Eu2+ excitations close to Sm2+ in the first tens of nanoseconds after excitation, the Eu2+ emission decays with approximately the same rate at every temperature. As time further progresses into the hundreds of nanoseconds, non-radiative energy transfer between Eu2+ ions becomes the limiting factor of the Eu2+ decay; this results in a strong temperature dependence of the decay rate on longer timescales and the decay curves fan out.
The results in Fig. 7 show that a significant amount of energy transfer between Eu2+ ions is observed even for the isolated [MX6]4− octahedra of Cs4EuX6. The light yield reported for undoped Cs4EuI6 (53![[thin space (1/6-em)]](https://www.rsc.org/images/entities/char_2009.gif) 000 ph per MeV)24 is still significantly lower than that of the more diluted compounds Cs4CaI6:7%Eu (69
000 ph per MeV)24 is still significantly lower than that of the more diluted compounds Cs4CaI6:7%Eu (69![[thin space (1/6-em)]](https://www.rsc.org/images/entities/char_2009.gif) 000 ph per MeV) and Cs4SrI6:9%Eu (78
000 ph per MeV) and Cs4SrI6:9%Eu (78![[thin space (1/6-em)]](https://www.rsc.org/images/entities/char_2009.gif) 000 ph per MeV),15 as reported by the same research group. When cooling Cs4EuI6 from 300 K to 78 K, the migration rate of the Eu2+ excitations slows down while the light yield increases 10% to 20% (Fig. 1c). These observations strongly suggest that concentration quenching still plays a role in undoped Cs4EuBr6 and Cs4EuI6.
000 ph per MeV),15 as reported by the same research group. When cooling Cs4EuI6 from 300 K to 78 K, the migration rate of the Eu2+ excitations slows down while the light yield increases 10% to 20% (Fig. 1c). These observations strongly suggest that concentration quenching still plays a role in undoped Cs4EuBr6 and Cs4EuI6.
Opposed to the undoped samples, Cs4EuBr6:2% Sm and Cs4EuI6:2% Sm show a much less significant change in intensity in the same temperature range, as shown by Fig. 1f. Once energy is transferred from Eu2+ to Sm2+ it cannot be transferred back to Eu2+ anymore. If the Sm2+ concentration is low enough, the distance between the Sm2+ ions is large and energy will not be transferred between Sm2+ ions. Aside from avoiding self-absorption, the doping of Eu2+ materials with Sm2+ effectively reduces concentration quenching.
Compared to the 2.1 s scintillation decay time of CsBa2I5:Sm2+, the 3.5 s decay time of Cs4EuI6:2% Sm is on the slow side for Sm2+-doped scintillators. However, due to the strong self-absorption in undoped Cs4EuI6, the decay time of Cs4EuI6:2% Sm is already faster than that of undoped Cs4EuI6 with sample sizes of only a few mm. It is also fast enough for applications in γ-ray spectroscopy, as successfully shown by the pulse height spectrum in Fig. 4.
5. Conclusions
The benefits of doping Cs4EuBr6 and Cs4EuI6 with Sm2+ have been studied for applications in γ-ray spectroscopy. It has been demonstrated that undoped Cs4EuI6 suffers from strong self-absorption. Despite the large distances between neighbouring Eu2+ ions, a small amount of concentration quenching has been observed in both Cs4EuBr6 and Cs4EuI6. Self-absorption and concentration quenching originate from the spectral overlap between the Eu2+ excitation and emission spectra.Both self-absorption and concentration quenching can be avoided by doping these scintillators with 2% Sm2+; this results almost exclusively in Sm2+ 4f55d → 4f6 emission. Due to the large amounts of self-absorption in the undoped samples, the room temperature scintillation decay time of the Sm2+ γ-doped Cs4EuI6 is already faster than that of small-size, undoped Cs4EuI6 crystals. The Sm2+ emission around 850 nm can be efficiently detected with an avalanche photodiode. Doping Cs4EuI6 with 2% Sm2+ improved the energy resolution from 11% to 7.5%.
Conflicts of interest
There are no conflicts of interest to declare.Acknowledgements
This research was subsidized by the TTW/OTP grant no. 18040 of the Dutch Research Council. The authors would like to thank Daniel Biner, Bern, for the synthesis and crystal growth of the materials.References
- M. S. Alekhin, J. T. M. de Haas, I. V. Khodyuk, K. W. Krämer, P. R. Menge, V. Ouspenski and P. Dorenbos, Appl. Phys. Lett., 2013, 102, 151915 CrossRef.
- N. J. Cherepy, G. Hull, A. D. Drobshoff, S. A. Payne, E. Van Loef, C. M. Wilson, K. S. Shah, U. N. Roy, A. Burger, L. A. Boatner, W. S. Choong and W. W. Moses, Appl. Phys. Lett., 2008, 92, 083508 CrossRef.
- L. A. Boatner, J. O. Ramey, J. A. Kolopus, R. Hawrami, W. M. Higgins, E. van Loef, J. Glodo, K. S. Shah, E. Rowe, P. Bhattacharya, E. Tupitsyn, M. Groza, A. Burger, N. J. Cherepy and S. A. Payne, J. Cryst. Growth, 2010, 312, 1213 CrossRef.
- N. J. Cherepy, B. W. Sturm, O. B. Drury, T. A. Hurst, S. A. Sheets, L. E. Ahle, C. K. Saw, M. A. Pearson, S. A. Payne, A. Burger, L. A. Boatner, J. O. Ramey, E. V. Van Loef, J. Glodo, R. Hawrami, W. M. Higgins, K. S. Shah and W. W. Moses, Proc. SPIE, 2009, 7449, 74490F CrossRef.
- L. Alaribe, C. Disch, A. Fauler, R. Engels, E. Keller, A. Cecilia, T. Dos Santos Rolo, E. Hamann and M. Fiederle, IEEE Trans. Nucl. Sci., 2012, 59, 2193 CAS.
- R. Hawrami, J. Glodo, K. S. Shah, N. Cherepy, S. Payne, A. Burger and L. Boatner, J. Cryst. Growth, 2013, 379, 69 CrossRef CAS.
- Y. Wu, Q. Li, D. J. Rutstrom, I. Greeley, L. Stand, M. Loyd, M. Koschan and C. L. Melcher, Nucl. Instrum. Methods Phys. Res., Sect. A, 2020, 954, 161242 CrossRef CAS.
- M. S. Alekhin, D. A. Biner, K. W. Krämer and P. Dorenbos, J. Lumin., 2014, 145, 723 CrossRef CAS.
- G. Bizarri, E. D. Bourret-Courchesne, Z. Yan and S. E. Derenzo, IEEE Trans. Nucl. Sci., 2011, 58, 3403 CAS.
- E. D. Bourret-Courchesne, G. Bizarri, R. Borade, Z. Yan, S. M. Hanrahan, G. Gundiah, A. Chaudhry, A. Canning and S. E. Derenzo, Nucl. Instrum. Methods Phys. Res., Sect. A, 2009, 612, 138 CrossRef CAS.
- U. Shirwadkar, R. Hawrami, J. Glodo, E. V. D. van Loef and K. S. Shah, IEEE Trans. Nucl. Sci., 2013, 60, 1011 CAS.
- K. Yang, M. Zhuravleva and C. L. Melcher, Phys. Status Solidi RRL, 2011, 5, 43 CrossRef CAS.
- Y. Wu, M. Zhuravleva, A. C. Lindsey, M. Koschan and C. L. Melcher, Nucl. Instrum. Methods Phys. Res., Sect. A, 2016, 820, 132 CrossRef CAS.
- J. Glodo, E. V. Van Loef, N. J. Cherepy, S. A. Payne and K. S. Shah, IEEE T. Nucl. Sci., 2010, 57, 1228 CAS.
- D. Rutstrom, L. Stand, M. Koschan, C. L. Melcher and M. Zhuravleva, J. Lumin., 2019, 216, 116740 CrossRef CAS.
- M. S. Alekhin, J. T. M. De Haas, K. W. Krämer and P. Dorenbos, IEEE T. Nucl. Sci., 2011, 58, 2519 CAS.
- M. S. Alekhin, K. W. Krämer and P. Dorenbos, Nucl. Instrum. Methods Phys. Res., Sect. A, 2013, 714, 13 CrossRef CAS.
- G. Gundiah, M. Gascón, G. Bizarri, S. E. Derenzo and E. D. Bourret-Courchesne, J. Lumin., 2015, 159, 274 CrossRef CAS.
- D. L. Dexter and J. H. Schulman, J. Chem. Phys., 1954, 22, 1063 CrossRef CAS.
- A. I. Burshtein, Phys.-Usp., 1984, 27, 579 CrossRef.
- D. L. Dexter, J. Chem. Phys., 1953, 21, 836 CrossRef CAS.
- C. Ling, W. Meitian and W. Shishua, J. Alloys Compd., 1997, 256, 112 CrossRef CAS.
- L. Stand, M. Zhuravleva, B. Chakoumakos, J. Johnson, M. Loyd, Y. Wu, M. Koschan and C. L. Melcher, J. Cryst. Growth, 2018, 486, 162 CrossRef CAS.
- Y. Wu, D. Han, B. C. Chakoumakos, H. Shi, S. Chen, M. Du, I. Greeley, M. Loyd, D. J. Rutstrom, L. Stand, M. Koschan and C. L. Melcher, J. Mater. Chem. C, 2018, 6, 6647 RSC.
- Cao Baopeng, Wang Shihua and Zhao Xinhua, J. Alloys Compd., 1992, 181, 511 CrossRef.
- W. Wolszczak, K. W. Krämer and P. Dorenbos, Phys. Status Solidi RRL, 2019, 13, 1900158 CrossRef.
- C. van Aarle, K. W. Krämer and P. Dorenbos, J. Lumin., 2021, 238, 118257 CrossRef CAS.
- R. H. P. Awater, M. S. Alekhin, D. A. Biner, K. W. Krämer and P. Dorenbos, J. Lumin., 2019, 212, 1 CrossRef CAS.
- G. Meyer, Advances in the Synthesis and Reactivity of Solids, JAI Press Inc., 1994, vol. 2, pp. 1–16 Search PubMed.
- J. T. M. De Haas and P. Dorenbos, IEEE T. Nucl. Sci., 2008, 55, 1086 Search PubMed.
- L. Stand, M. Zhuravleva, G. Camarda, A. Lindsey, J. Johnson, C. Hobbs and C. L. Melcher, J. Cryst. Growth, 2016, 439, 93 CrossRef CAS.
- M. J. Weber, Phys. Rev. B: Solid State, 1971, 4, 2932 CrossRef.
- W. Drozdowski and A. J. Wojtowicz, Nucl. Instrum. Meth. A, 2002, 486, 412 CrossRef CAS.
| This journal is © The Royal Society of Chemistry 2023 |

