DOI:
10.1039/D2TC04249E
(Paper)
J. Mater. Chem. C, 2023,
11, 8052-8061
Mn2+-doped Cs2ZnBr4 scintillator for X-ray imaging†
Received
6th October 2022
, Accepted 9th November 2022
First published on 15th November 2022
Abstract
Luminescent metal halides with a high photoluminescence quantum yield (PLQY), large Stokes shift and strong X-ray absorption capability have demonstrated prospects in high-energy radiation detection. Here, we report Mn2+-doped all-inorganic metal halide Cs2ZnBr4 as an X-ray imaging scintillator. The as-prepared Cs2ZnBr4:Mn2+ shows two emission bands peaking at 526 and 655 nm, respectively, with a PLQY of up to 58.8%. It is found that the dual emissions belong to the spin-forbidden d–d transition of Mn2+ ions in different coordination configurations, and the involved luminescence and evolution mechanisms have been analyzed. To investigate the scintillation properties, we successfully fabricated a homogeneous thin film scintillation screen containing Cs2ZnBr4:25%Mn2+, which shows good X-ray scintillation performance with a light yield of about 15![[thin space (1/6-em)]](https://www.rsc.org/images/entities/char_2009.gif) 600 photons per MeV and a low detection limit of 1.16 μGyair s−1. Moreover, the flexible and large-area scintillation screens exhibit good X-ray imaging performance with a spatial resolution of 5.06 lp mm−1 and excellent stability under continuous X-ray irradiation.
600 photons per MeV and a low detection limit of 1.16 μGyair s−1. Moreover, the flexible and large-area scintillation screens exhibit good X-ray imaging performance with a spatial resolution of 5.06 lp mm−1 and excellent stability under continuous X-ray irradiation.
10th Anniversary Statement
Luminescent materials are regarded as crucial elements for advanced optoelectronic devices. Our group has always worked in the field of rare earth phosphors and published two papers on Na3(Y,Sc)Si3O9:Eu2+ (J. Mater. Chem. C, 2013, 1, 5917–5924) and NaBaScSi2O7:Eu2+ (J. Mater. Chem. C, 2013, 1, 7139–7147) in the first issue of Journal of Materials Chemistry C. From 2016, our group began some pioneering work on the luminescent metal halides from doped halide perovskite nanocrystals to versatile metal halide crystals and published their earlier work on Cs(PbxMn1−x)(ClyBr1−y)3 nanocrystals in 2017 (J. Mater. Chem. C, 2017, 5, 9281–9287). As a young journal on materials for optical, magnetic and electronic devices, Journal of Materials Chemistry C has witnessed the rapid progress of inorganic luminescent materials and also the continual advance and achievement of our group. In 2022, I was appointed as the Associate Editor of Journal of Materials Chemistry C and I will have more opportunities to serve for this journal. I am also very glad to publish our recent manuscript on the Mn2+-doped Cs2ZnBr4 scintillator for X-ray imaging (J. Mater. Chem. C, 2023, 10, DOI: 10.1039/D2TC04249E) in this 10th anniversary themed issue for the Journal of Materials Chemistry C. Thanks!
|
1. Introduction
Zero-dimensional (0D) metal halides, as a new type of luminescent materials, have recently attracted much attention due to their low-cost and facile solution-processability.1–4 In terms of the 0D framework, miscellaneous metal halide anion sublattices (e.g., tetrahedral BX4, pyramidal BX5, and octahedral BX6, etc.) have been adopted,5–7 and the structural diversity endows them with versatile crystal structures and tunable photophysical properties, which make them promising candidates for potential optoelectronic applications, such as light-emitting diodes (LED), photodetectors, irradiation detectors, and so on.8–14 In particular, the strong X-ray absorption capability and various crystalline forms (e.g., polycrystalline films, single crystals, and nanocrystals) make 0D metal halides suitable for high-energy radiation detection, which is of great significance in medical diagnosis, industrial flaw detection, etc.15–20
X-ray imaging technology is mainly based on the penetrativity of X-ray and the difference in the density and thickness between different tissues (i.e., the attenuation difference of X-rays after penetrating different subjects).21,22 There are generally two main detection mechanisms: direct conversion of X-ray photons into electrical signals in detectors (i.e., direct conversion strategy) and indirect conversion into low energy photons in scintillators (i.e., indirect conversion strategy).23,24 Conventional semiconductor materials (e.g., Si, CdTe, and CdZnTe) are generally used for direct conversion detection. However, there exist some problems, such as low X-ray blocking capability of Si, and the large noise and nonuniform charge transport of CdTe and CdZnTe due to the charge carrier trapping limit.25–27 Moreover, complicated preparation processes and expensive preparation cost hinder their further applications. Traditional inorganic scintillators, such as CsI:TI, CdWO4, Bi4Ge3O12 (BGO), and (Lu,Y)2SiO5 (LYSO) have been successfully applied in indirect conversion X-ray detection due to their low detection limit and high energy resolution, but the inherent shortcomings, such as the complex preparation process, high synthesis temperature and vacuum conditions are also the restricting factors for X-ray imaging applications.28,29
Alternatively, the emerging 0D metal halides possess high photoluminescence quantum yields (PLQYs), large Stokes shift (i.e., negligible self-absorption) and strong X-ray absorption capability making them appropriate for indirect conversion X-ray detection.10,12,15,30,31 As a consequence, it is necessary to discover new luminescent 0D metal halides with good scintillation properties for X-ray imaging. One can then find many reports on the 0D metal halides, which show excellent radioluminescence (RL) properties. Typically, Cs3Cu2I5 nanocrystals show strong RL under X-ray irradiation with an extremely high light yield of above 79279 photons per MeV.32 Moreover, the X-ray imaging resolution based on the In-doped Cs3Cu2I5 single crystals even reaches 18 lp mm−1, which is higher than that of the commercial CsI:Tl based flat-panel X-ray detectors.33 Some 0D hybrid metal halide scintillators have also been reported, such as Sn(II)-based Bmpip2SnBr4,15 Cu(I)-based (DIET)3Cu3X3,30 and Mn(II)-based (C38H34P2)MnBr4.17 As a typical example, our group reported the textured TPP2MnBr4 transparent ceramic by seed-crystal-induced cold sintering, which shows a light yield of about 78000 ± 2000 photons per MeV, a low detection limit of 8.8 nGyair s−1, and a high spatial resolution of 15.7 lp mm−1 for X-ray imaging.11 Besides, our group reported the large size transparent medium based on the 0D hybrid manganese bromide, which also demonstrates good scintillation performances with a low detection limit of 103 nGyair s−1 and a spatial resolution of 13.4 lp mm−1 for X-ray imaging.34 However, long-term stability is an index for evaluating the practical application. Although some eco-friendly Sn(II)-, Cu(I)-, and Mn(II)-based 0D hybrid metal halide scintillators show competitive scintillation performances in indirect conversion X-ray detection, their poor stability restricts their development. Therefore, it is urgent to explore 0D metal halide scintillators with good stability for confirming the practical application requirements.
Herein, we reported new Mn2+-doped all-inorganic metal halide Cs2ZnBr4 prepared by a facile solution process at room temperature (RT). Under UV excitation, Mn2+-doped Cs2ZnBr4 polycrystalline powders show bright yellow-green emission with two peaks at 526 and 655 nm, as well as a PLQY of up to 58.8%. Experimental analysis demonstrates that the observed dual emissions come from the spin-forbidden d–d transition of Mn2+ ions in different coordination configurations. Moreover, Cs2ZnBr4:Mn2+ shows excellent air and thermal stability, and we fabricated a homogeneous thin film scintillation screen based on Cs2ZnBr4:25%Mn2+, which shows good X-ray scintillation performance with a light yield of about 15600 photons per MeV. The detection limit of 1.16 μGyair s−1 is approximately lower than the dosage for a standard medical diagnosis, moreover, the flexible, large-area scintillation screen exhibits good X-ray imaging performance with a spatial resolution of 5.06 lp mm−1 and excellent stability under continuous X-ray irradiation.
2 Experimental section
2.1 Materials
All reagents and solvents were used without further purification, including CsBr (99.9%, Aladdin), ZnBr2 (99.9%, Aladdin), MnBr2 (99.5%, Aladdin), HBr aqueous solution (48% in water by weight, Aladdin), ethanol (99.5, Aladdin) and polydimethylsiloxane (PDMS, SylgardTM 182).
2.2 Synthesis of undoped and Mn2+-doped Cs2ZnBr4 polycrystalline powders
5 mmol CsBr (2.128 g) and 2.5 mol ZnBr2 (0.563 g) were dissolved in 10 mL HBr aqueous solution to form a clear solution. Then, the prepared solution was filtered using a polyvinylidene fluoride (PVDF) filter with 0.45 μm pore-size to remove unreacted impurities. The filtrate was allowed to cool naturally to RT, the polycrystalline powders were separated out and repeatedly washed using ethanol. Finally, the obtained powders were dried in an oven at 60 °C for 6 h. For Mn2+-doped Cs2ZnBr4 polycrystalline powders (Cs2Zn1−xMnxBr4, x = 5%, 10%, 15%, 20%, 25%, 30%), the same method was used, and different proportions of MnBr2 were added to replace ZnBr2.
2.3 Synthesis of Cs2ZnBr4:Mn2+-PDMS films
Mn2+-doped Cs2ZnBr4 polycrystalline powders were fully ground in an agate mortar for obtaining uniform size distribution. PDMS was prepared by mixing the pre-polymer and curing agent at a volume ratio of 10:1. 25%Mn2+-doped Cs2ZnBr4 polycrystalline powders were used to synthesize PDMS films. 2.5 g Cs2ZnBr4:25%Mn2+ polycrystalline powders were dispersed in 5 ml ethanol. Subsequently, adding the dispersed powders to 10 g PDMS under sonication to obtain uniform slurry. Finally, the Mn2+-doped Cs2ZnBr4-PDMS thin film can be obtained by a spin coating method, followed by solidifying at 120 °C for 2 h. The thickness of the film can be controlled by speed of the spin coating.
2.4 Characterization
The powder X-ray diffraction (PXRD) measurement was performed on an Aeris powder X-ray diffraction (XRD) diffractometer (PANalytical Corporation, Netherlands) operating at 40 kV and 15 mA with a monochromatized Cu Kα radiation (λ = 1.5406 Å) and a linear VANTEC detector. The Rietveld refinements were performed by using Fullprof. The diffraction pattern was scanned over the angular range of 5–120 degrees (2θ) with a step size of 0.02, at RT. The temperature-dependent PXRD were measured by the same Aeris PXRD diffractometer equipped with BTS 500-benchtop heating stages (PANalytical Corporation, Netherlands). The X-ray photoelectron spectra (XPS) were recorded with a Thermo ESCALAB 250 XI instrument using monochromatic Al Kα radiation (hν = 1486.6 eV). Inductively coupled plasma optical emission spectroscopy (ICP-OES) was performed on Agilent 720ES. The Fourier transform infrared spectrum (FTIR) was performed on a PerkinElmer Spectrum GX. The photoluminescence (PL) and PL excitation (PLE) spectra at RT were recorded on an FLS1000 fluorescence spectrophotometer (Edinburgh Instruments Ltd, UK) equipped with a continuous xenon lamp (450 W) as an excitation source. The temperature-dependent PL spectra were measured by the same spectrophotometer equipped with Cryo-77 low temperature fluorescence instrument (Tian Jin Orient-KOJI instrument Co., Ltd). The luminescence thermal quenching behavior of the samples was measured by the same spectrophotometer equipped with a TAP-02 high-temperature fluorescence instrument (Tian Jin Orient-KOJI instrument Co., Ltd). The photoluminescence quantum yield (PLQY) was recorded by an integrated sphere, which was attached to the FLS1000 spectrofluorometer. The PLQY was calculated using the following equation: ηQY = IS/(ER − ES), in which IS represents the luminescence emission spectrum of the sample, ER is the spectrum of the excitation light from the empty integrated sphere (without the sample), and ES is the excitation spectrum for the excited sample. Time-resolved emission data were collected at RT using the FLS1000 spectrofluorometer using a microsecond light sources. Time-resolved emission data were collected at RT using the FLS1000 spectrofluorometer. The dynamics of emission decay were monitored by using the FLS1000's time-correlated single-photon counting capability (1024 channels; 2000 μs window) with data collection for 10000 counts.
Measurement of radioluminescence (RL) spectra and intensity.
FLS1000 spectrofluorometer (Edinburgh Instruments Ltd, UK) equipped with a X-ray tube (Amptek Inc, Mini-X, Mo target and tube voltage was 50 kV) and an integrating sphere is used to measure the RL spectra. The corresponding RL intensity can be calculated by integrating the RL spectra.
Calculation of X-ray attenuation efficiency.
The X-ray attenuation efficiency (AE) is calculated by the following formula: | | | AE = [1 − exp(−(μ/ρ)x)] × 100%, | (1) |
where μ/ρ is the photon cross section function obtained from the XCOM database of National Institute of Standards and Technology (NIST), x is mass thickness, which is defined as the mass per unit area, and is obtained by multiplying the thickness t by the density ρ, i.e., x = ρt. Here, we use the approximate density of Cs2ZnBr4, 3.74 g cm−3, to calculate attenuation efficiency, moreover, we used 22 keV as the photon energy to calculate the attenuation efficiency versus thickness of scintillator.
Calculation of light yield.
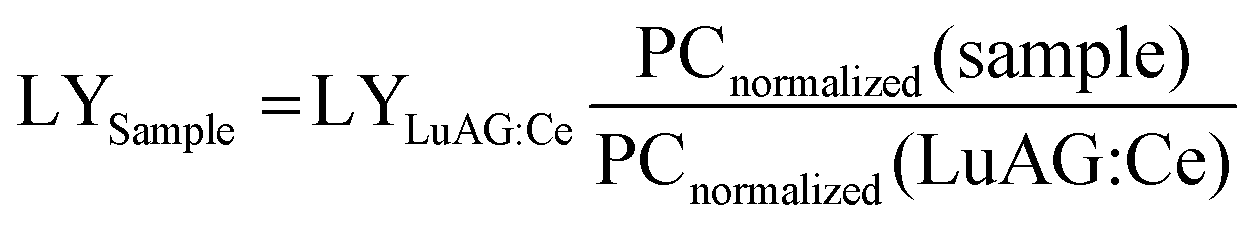
The commercial LuAG:Ce scintillator with a light yield 25000 photons per MeV is used as a reference to calibrate the light yield of the Cs2ZnBr4:Mn2+ scintillator. Cs2ZnBr4:Mn2+ and LuAG:Ce scintillators are set at the same position to measure the RL spectra. Then the corresponding photon counting results were obtained by integrating these RL spectra. Light yield is defined as the ratio of photon numbers emitted from the luminescent sites to the total absorbed X-ray energy, it represents an internal X-ray conversion efficiency. The different scintillators have the different X-ray absorptions even they have the same thickness. Therefore, the emission photon counts of scintillators should be normalized to same X-ray attenuation (100%) as the following formula:35| |  | (2) |
where AE is the X-ray attenuation efficiency (%) of scintillators at a certain thickness. The light yield of Cs2ZnBr4:Mn2+ scintillators (LYsample) is calculated by the following formula:| |  | (3) |
where LYLuAG:Ce is the light yield of LuAG:Ce (25000 photons per MeV), PCnormalized (sample) and PCnormalized (LuAG:Ce) are the photon counts of Cs2ZnBr4:Mn2+ and commercial LuAG:Ce scintillator normalized to respective X-ray attenuation efficiencies.
Calculation of the modulation transfer function (MTF).
MTF is defined as the transfer capability of the input signal modulation of spatial frequency, which generally acts as the evaluation index of the spatial resolution performance of the imaging system. MTF = output contrast of the image/enter the contrast of the image. Since the contrast of the output image is always smaller than that of the input image, thus, the MTF value is between 0 and 1. When the MTF value decreases to 0.2, the spatial resolution can be determined by the corresponding spatial frequency. Here, we adopt the slanted-edge method to calculate the MTF curve. We take an X-ray image using a thin slice of lead (Pb) with sharp edge, the edge spread function (ESF) can be obtained from the slanted-edge profile of this X-ray image. The MTF is calculated by the following equation:36| | 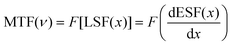 | (4) |
where ν is the spatial frequency and x is the position of pixels, and the line spread function (LSF) is the derivative of ESF and the MTF is the Fourier transform of LSF. MTF operation on images can be obtained using software Image J.
3 Results and discussion
3.1 Structural characterizations of Mn2+-doped Cs2ZnBr4
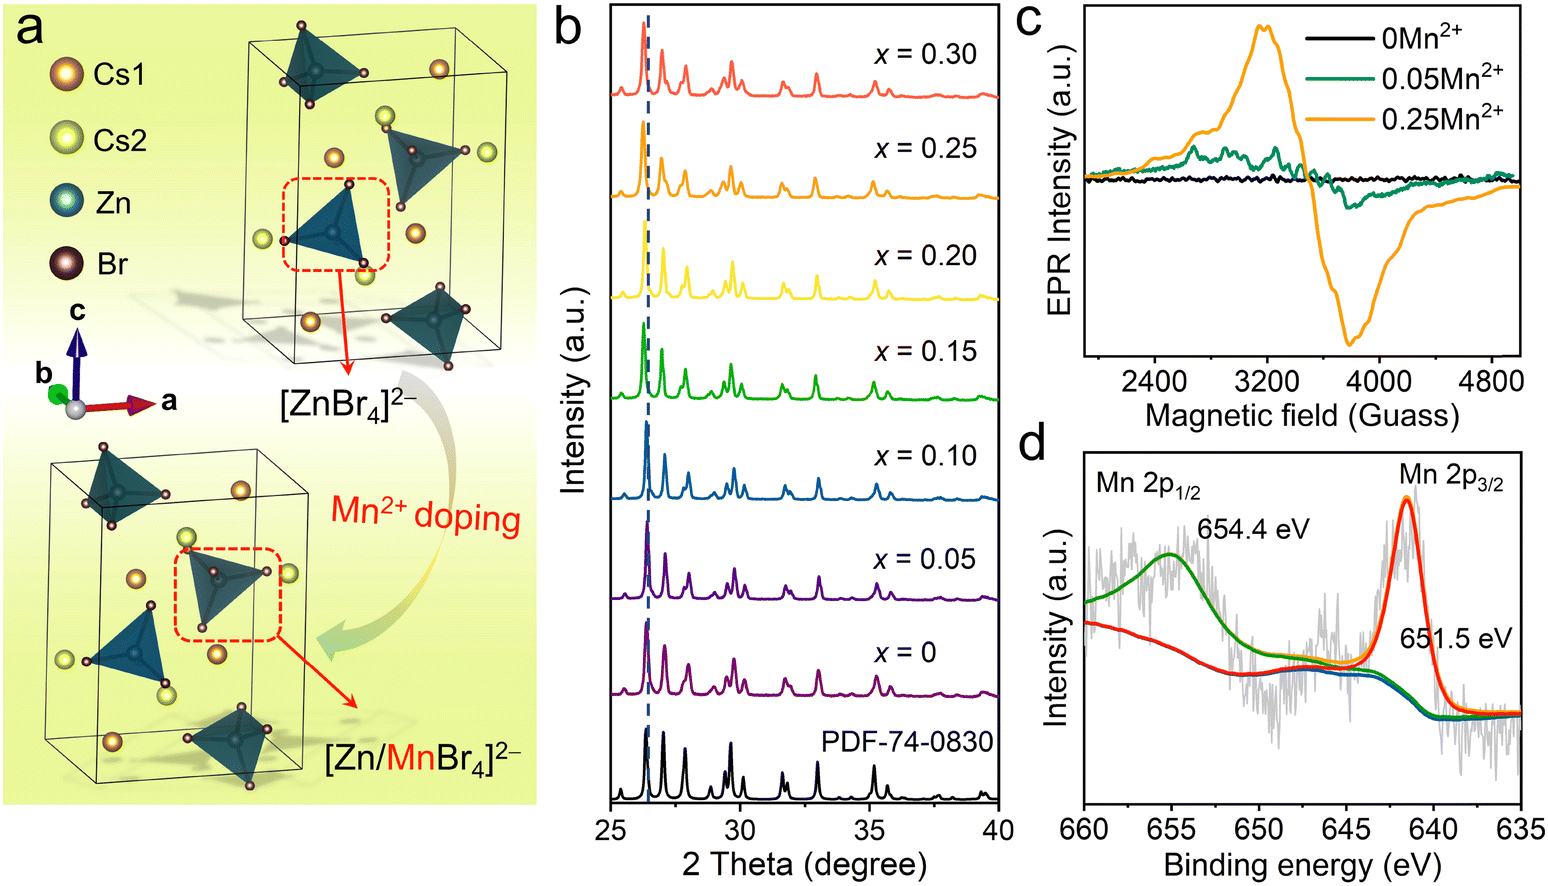
All-inorganic Cs2ZnX4 (X = Cl, Br) crystallize in orthorhombic space group Pnma.37,38 Among them, Cs2ZnBr4 belongs to a typical 0D structure (Fig. 1(a)), in which Zn2+ ions are coordinated with four Br− ions forming [ZnBr4]2− tetrahedrons, and the isolated [ZnBr4]2− are separated by the surrounding Cs+ cations. A similar ionic radius of Zn2+ (r = 0.60 Å, CN = 4) and Mn2+ (r = 0.66 Å, CN = 4) along with the tetrahedral coordination geometries (i.e., [ZnBr4]2− tetrahedrons) make Zn2+ crystallographic sites more suitable for Mn2+ doping (Fig. 1(a)).39–41 The Rietveld refinement of X-ray diffraction (XRD) pattern indicates the high phase purity of Mn2+-doped Cs2ZnBr4:Mn2+ (Fig. S1, ESI†). Refinement is stable and shows low R-factors (Table S1, ESI†). Atom coordinates and main bond lengths of Cs2ZnBr4:Mn2+ are shown in Table S2 (ESI†). The peak positions of PXRDs of Mn2+-doped Cs2ZnBr4 polycrystalline powders shift slightly toward low diffraction angles with increased Mn2+ concentrations (Fig. 1(b)). These results are consistent with the fact that Mn2+ doping leads to the enlarged unit cells due to the larger ionic radius of Mn2+ ions than Zn2+ ions in tetrahedral coordination geometry. For Mn2+-doped Cs2ZnBr4 polycrystalline powders, the actual Mn2+ concentrations are determined using an inductively coupled plasma optical emission spectrometer (ICP-OES), and the results show that the actual doping of Mn2+ contents are lower than experimentally expected value (Table S3, ESI†). For the convenience of description, the following discussion will use the experimental expected value to express the doping contents. It is reported that the secondary phase of Cs2MnBr4·2H2O appears when doping Mn2+ ions into the Cs2ZnBr4 matrix.42 However, we didn’t find the existence of the Cs2MnBr4·2H2O phase in the Mn2+-doped Cs2ZnBr4 matrix by Rietveld refinements (Fig. S1, ESI†). This is owing to the fact that the Cs2MnBr4·2H2O phase is dependent on the main phase Cs2ZnBr4 (Fig. S2, ESI†), and the trace secondary phase (i.e., Cs2MnBr4·2H2O) cannot be identified by PXRD. To verify the local crystal environments of Mn2+ in the Cs2ZnBr4 lattice, the electron paramagnetic resonance (EPR) spectra are measured. Generally, when Mn2+ ions uniformly distribute in lattice sites, we will observe six well-resolved spectral lines in EPR spectra.43,44 In our cases, no EPR signal is detected in the pristine Cs2ZnBr4 sample (Fig. 1(c)), and both in low and high Mn2+-doped Cs2ZnBr4 samples (e.g., 5% and 25% Mn2+ doping), we only observe the broadening spectral lines rather than the sextet spectral lines corresponding to 55Mn nucleus (I = 5/2), demonstrating the existence of the secondary phase. Furthermore, we measure the Fourier transform infrared spectrum (FTIR), and the stretching vibration (∼3438 cm−1) of –OH group in H2O molecules (Fig. S3, ESI†) is observed. All of results indicate the existence of the secondary phase (i.e., Cs2MnBr4 2H2O) in Mn2+-doped Cs2ZnBr4. Besides, X-ray photoelectron spectral (XPS) analysis is conducted to identify the valence state of Mn2+ in Cs2ZnBr4 matrix (Fig. 1(d)). The Mn core level spectrum shows the Mn 2p3/2 peak at 651.5 eV and Mn 2p1/2 peak at 654.4 eV with a separation of 2.9 eV, which confirm the existence of the Mn2+ dopant. In addition, the existence of the minor Cs2MnBr4·2H2O phase is confirmed by luminescence spectra, which is discussed in below.
 |
| | Fig. 1 (a) Crystal structure diagram of Cs2ZnBr4, including the proposed Mn2+ substitution process. (b) Partial PXRD patterns of Mn2+-doped Cs2ZnBr4 samples with different Mn2+ contents. (c) EPR spectra of undoped and Mn2+-doped Cs2ZnBr4 samples at RT. (d) High-resolution XPS spectrum of Mn 2p for Cs2ZnBr4:25%Mn2+ sample. | |
3.2 Photophysical properties of Mn2+-doped Cs2ZnBr4 polycrystalline powders
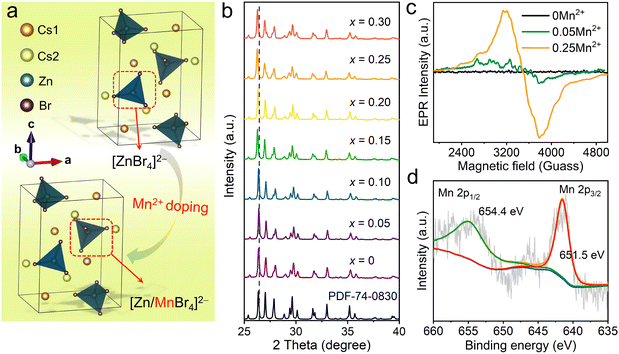
It is previously reported that pristine Cs2ZnBr4 shows the weak blue emission peaking at 465–470 nm under around 280 nm excitation.20,45,46 Herein, the normalized photoluminescence (PL) and PL excitation (PLE) spectra of Mn2+-doped Cs2ZnBr4 polycrystalline powders are shown in Fig. 2(a). The PLE spectra contains five peaks located at 296, 365, 379, 441 and 458 nm, which belong to the characteristic transitions of Mn2+ ions. Under 365 nm excitation, Mn2+-doped Cs2ZnBr4 show the bright yellow-green emission peaking at 526 and 655 nm. For different amounts of Mn2+ doped Cs2ZnBr4 samples, the shape and maxima of the PL spectra remain the same (Fig. S4, ESI†). Depending on the increased Mn2+ concentrations, the PL intensities firstly increase and then decrease due to concentration-quenching, and the sample with the highest PL intensity is obtained when the Mn2+ concentration reaches 25% (Fig. 2(b)). The PLQYs of different amounts of Mn2+ doped Cs2ZnBr4 also show the same variation trend with PL intensities, and the highest PLQY reaches 58.82% when 25% Mn2+ doping (Fig. 2(b) and Table S4, ESI†). The PL decay curves of Cs2ZnBr4:25%Mn2+ are determined by time-resolved spectra (Fig. 2(c)), and the red emission band shows the single exponential fitting and green emission band shows the double exponential fitting, and the microsecond level long lifetimes indicated that the dual emissions all come from the spin-forbidden d–d transition (4T1 → 6A1) of Mn2+ ions. The PL lifetimes of different amounts of Mn2+ doped Cs2ZnBr4 are shown in Fig. S5 and S6 (ESI†). It is found that the PL lifetimes of the green emission band firstly increase and then decrease (Table S5, ESI†). However, the PL lifetimes of the red emission bands almost remain unchanged with increased Mn2+ contents (Table S6, ESI†).
 |
| | Fig. 2 (a) Normalized PL, PLE and RL spectra of the Cs2ZnBr4:25%Mn2+ sample at RT. (b) PL intensity, RL intensity and the PLQYs of the different Mn2+-doped Cs2ZnBr4 samples. (c) Time-resolved PL spectra of Cs2ZnBr4:25%Mn2+ sample in different excitation and monitoring wavelengths at RT. The proposed PL (d) and RL (e) mechanisms of Mn2+-doped Cs2ZnBr4. | |
It is well known that the emission wavelengths of Mn2+ ions are highly dependent on the crystal field surroundings of the host lattices, allowing the characteristic emissions from green to red. Generally, Mn2+ ion in tetrahedral coordination geometry presents the typical green emission with weak ligand field strength and shows the red emission in octahedral coordination geometry with strong ligand field strength.44 As mentioned above, there is only one type of crystallographic site (i.e., tetrahedral coordination geometry, [ZnBr4]2−) for Mn2+ doping in Cs2ZnBr4 matrix, leading to the green emission peaking at 526 nm.
However, the observed red emission band peaking at 655 nm should come from Mn2+ emission with the octahedral coordination geometry. Therefore, by further considering the PXRD analysis, we attribute the red emission to Cs2MnBr4·2H2O phase and dual emission all originate from spin-forbidden d–d transition of Mn2+ ions, which is caused by different coordination configurations of Mn2+ ions. In addition, under X-ray excitation, Mn2+-doped Cs2ZnBr4 shows the bright radioluminescence (RL) with two emission bands, as shown in Fig. 2(a) and Fig. S7 (ESI†). Similarly, 25% Mn2+-doped sample show the strongest RL (Fig. 2(b)). The underlying PL and PL mechanisms for Mn2+-doped Cs2ZnBr4 are depicted in Fig. 2(d) and (e), respectively. Compared with PL mechanism, RL mechanism contains an extra photoelectron conversion process that transfers high-energy electronics to low-energy electronics for radiative recombination.47 To be precise, firstly, the heavy atoms (e.g. Cs, Br, Mn, Zn) of Cs2ZnBr4:Mn2+ absorb the radiation energy (i.e., X-ray) mainly by the photoelectric effect and inelastic Compton scattering, ejecting massive hot electrons. Then, the ejected hot electrons are thermalized on an ultrafast timescale and are captured by luminescent centers.
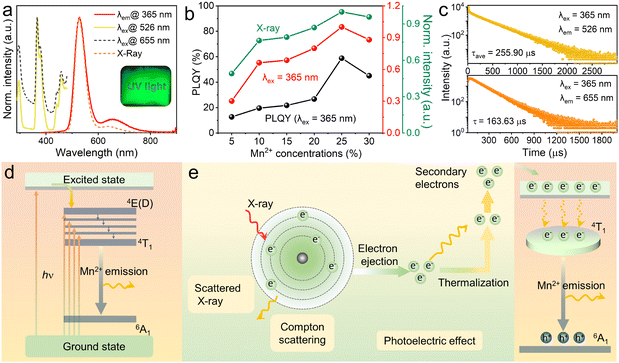
To gain insight into the photophysical properties, temperature-dependent PL spectra of Cs2ZnBr4:25%Mn2+ are measured. Differently, the green emissions are highly dependent on the temperatures, and an obvious blue-shift behavior is observed with the temperatures increase from 80 to 275 K (Fig. 3(a)), due to the enhanced electron–phonon interactions.48 However, the peak positions of red emissions almost remain unchanged. Similarly, the PL intensities of these two emissions gradually decrease with the increase of temperatures, which is caused by the PL thermal quenching resulting from the thermal dissociation of excitons.49 We also analyze the PL thermal quenching behavior above room temperature (Fig. 3(b)).
 |
| | Fig. 3 (a) Temperature-dependent PL spectra of Cs2ZnBr4:25%Mn2+ sample 365 nm upon excitation along with temperature range from 80 to 275 K. (b) Temperature-dependent PL spectra of Cs2ZnBr4:25%Mn2+ sample upon 365 nm excitation along with temperature range from RT to 250 °C. (c) Normalized integrated PL intensities of green and red emissions in Cs2ZnBr4:25%Mn2+ sample at different temperatures. (d) Temperature-dependent in situ PXRDs of Cs2ZnBr4:25%Mn2+ sample along with temperature range from RT to 200 °C (e) Schematic illustration for unusual PL thermal enhancement process in Mn2+-doped Cs2ZnBr4 samples. | |
Interestingly, with the temperatures increase from RT to 100 °C, the integrated PL intensities of green emissions show obvious improvement, and the integrated PL intensity at 100 °C even becomes 2.42 times that of the initial PL intensity. When temperatures continually increase from 100 to 250 °C, the integrated PL intensities of green emissions gradually decrease. At 250 °C, the integrated PL intensity of green emission still maintains the 75% of the initial PL intensity (Fig. 3(c)). In addition, the integrated PL intensities of red emissions show the obvious decrease with the increase of temperatures, and when temperatures are higher than 100 °C, the red emissions almost disappeared. Furthermore, Fig. 3(d) shows the temperature-dependent in situ PXRD of the Cs2ZnBr4:25%Mn2+ sample, and on account of the heating-induced lattice expand process that enhances the cell volumes, the diffraction peak positions shift slightly toward lower angles. Moreover, when increasing temperatures from RT to 200 °C, the diffraction peak intensities of PXRD gradually increase, demonstrating the gradual removal of the second phase (i.e., Cs2MnBr4·2H2O) with increasing temperature. This result is consistent with the PL thermal quenching behavior. By combining structural transformation and PL thermal quenching behavior, we propose the underlying thermal quenching mechanism, as shown in Fig. 3(e). Cs2MnBr4·2H2O contains two H2O molecules, and the H2O molecules are gradually volatilized and accompanied with the decomposition with increasing temperatures. Then, the extra free Mn2+ ions generated by the structural decomposition enter the Zn2+ sites. With the increase of Mn2+ contents, the PL intensities of the green emission gradually increase, when temperatures reach 100 °C, the Cs2MnBr4·2H2O phase is completely decomposed. Therefore, the PL intensities of green emissions reach the maximum at 100 °C, while the red emissions completely disappeared at 100 °C. With further increasing temperatures from 100 to 250 °C, normal thermal quenching behavior occurs, thus, the PL intensities of green emissions gradually decrease. Benefiting from the high stability of the all-inorganic Cs2ZnBr4 structure, the PL intensity of the green emission still maintains 75% of the initial PL intensity even at 250 °C. Soon afterwards, with the decrease of temperature, the samples absorb the moisture in air accompanied with the recovery of Cs2MnBr4·2H2O phase. Finally, the samples recover the original PL behavior, exhibiting the dual emissions. In addition, Mn2+-doped Cs2ZnBr4 polycrystalline powders show the remarkable stability under other conditions, such as continuous UV illumination, and storage under ambient conditions (Fig. S8 and S9, ESI†).
3.4 Photophysical properties of the Mn2+-doped Cs2ZnBr4 @PDSM thin film
The low-cost and facile solution synthesis method and good photophysical properties make Cs2ZnBr4:25%Mn2+ polycrystalline powders highly promising as X-ray scintillators in indirect conversion X-ray detection. To investigate the scintillation properties, the homogeneous flexible films were fabricated by a conventional spin-coating method. First, fresh Cs2ZnBr4:25%Mn2+ powders were ground in a mortar for obtaining uniform-sized powders. After mixing Cs2ZnBr4:25%Mn2+ powders with PDMS under ultrasonic conditions, the obtained slurry was dropped and spin-coated on a glass substrate, followed by solidifying at 120 °C for 2 h. The thicknesses of the obtained PDMS thin film screens containing Cs2ZnBr4:25%Mn2+ powders can be controlled by changing the spin speed. Finally, we obtained a uniform, large-sized (10 × 10 cm2), and transparent Cs2ZnBr4:25%Mn2+@PDSM thin film (Fig. 4(a) and (b)), and this film also shows bright yellow-green emission under UV excitation (Fig. 4(c)). Moreover, this film shows large flexibility, which can be folded, twisted, and stretched (Fig. 4(d)–(f)). In addition, the Cs2ZnBr4:25%Mn2+@PDSM thin film shows the slightly decreased PLQY of 56.35% compared with Cs2ZnBr4:25%Mn2+ polycrystalline powders (Fig. S9, ESI†). However, the as-prepared thin film shows improved environmental stability, and when exposed to air conditions (30% relative humidity and 30 °C) for about one week, only a 5% reduction of the PLQYs is observed. The improved environmental stability may be caused by the increased hydrophobicity.
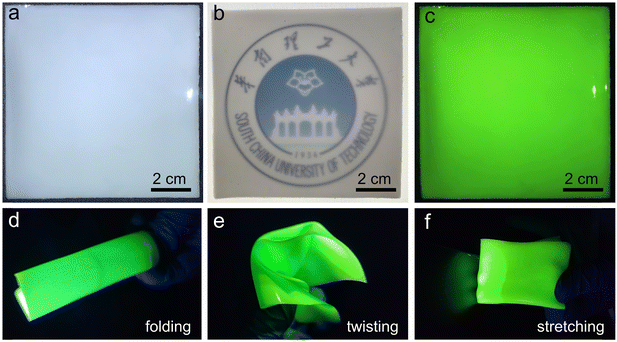 |
| | Fig. 4 (a) and (b) Photographs of large-sized and transparent Cs2ZnBr4:25%Mn2+@PDSM thin film under visible light. (c) Photograph of Cs2ZnBr4:25%Mn2+@PDSM thin film under 365nm UV light. Photographs of the flexible Cs2ZnBr4:25%Mn2+@PDSM thin film at different mechanical deformations under UV excitation: folding (d), twisting (e), and stretching (f). | |
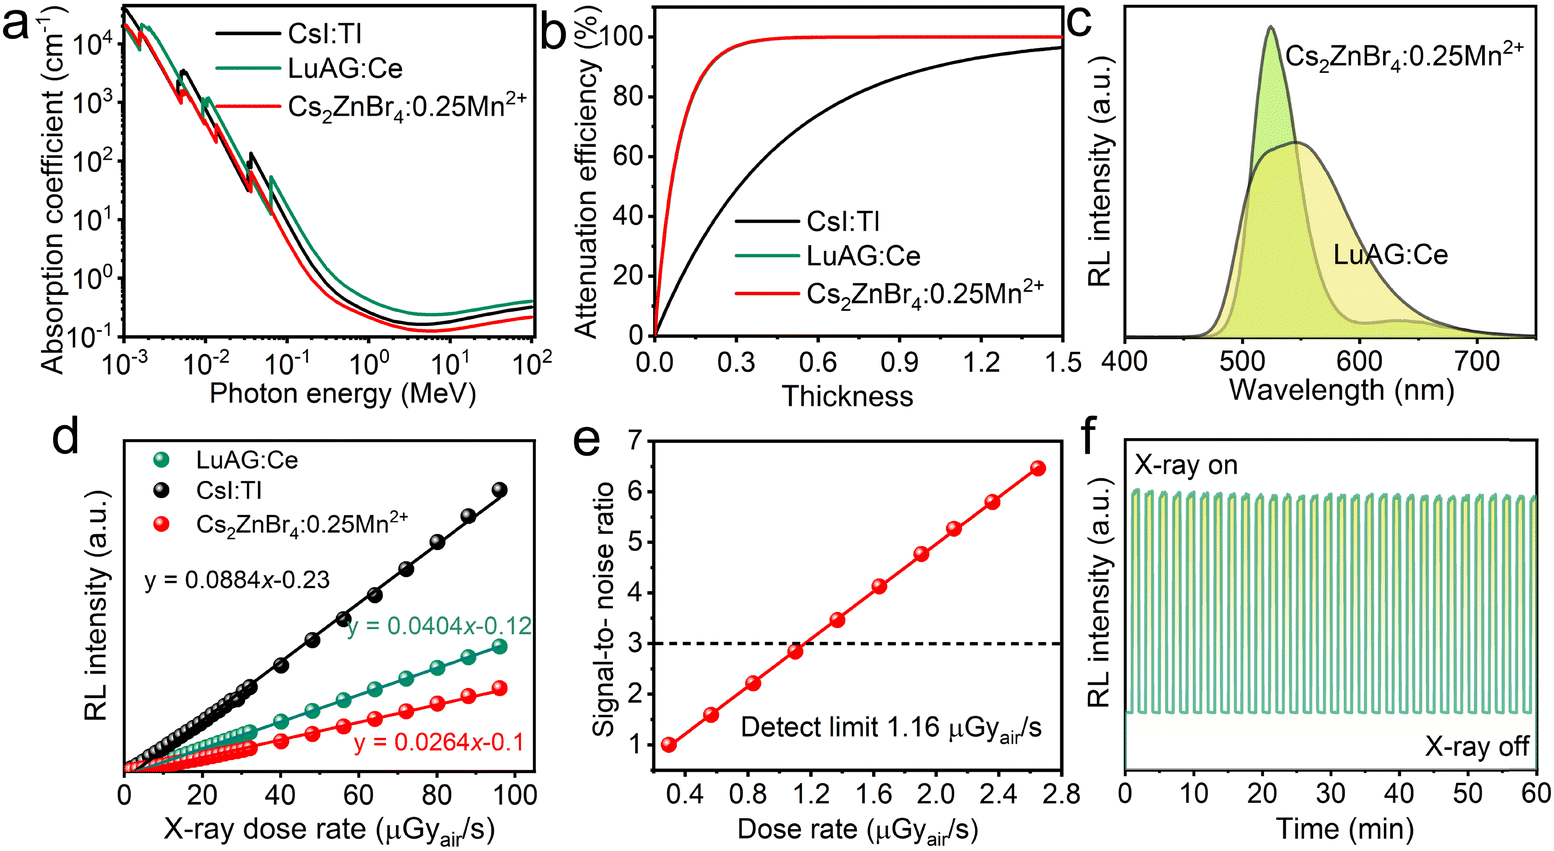
Fig. 5(a) shows the X-ray absorption coefficients (steady-state X-ray energy:22 keV) of the Cs2ZnBr4:25%Mn2+ and the typical commercial scintillators (LuAG:Ce and CsI:TI) in broad range of photon energies based on the photon cross-section database.35 The absorption of Cs2ZnBr4:25%Mn2+ in the region for medical digital radiography (i.e., 18–30 keV) is slightly higher than CsI:Tl and slightly lower than LuAG:Ce. Fig. 5(b) shows the X-ray attenuation efficiency of Cs2ZnBr4:25%Mn2+ and typical scintillators (LuAG:Ce and CsI:TI) as a function of thickness at a X-ray photon energy of 22 keV. Cs2ZnBr4:25%Mn2+ shows the same X-ray attenuation efficiency with a LuAG:Ce scintillator. The RL spectra of Cs2ZnBr4:25%Mn2+@PDSM thin film and LuAG:Ce scintillators are measured under the same conditions, as shown in Fig. 5(c). The Cs2ZnBr4:25%Mn2+@PDSM thin film shows similar PL and RL spectra, indicating that the same radiative recombination channel appears upon X-ray and UV excitations. Because Cs2ZnBr4:Mn2+ has similar X-ray attenuation efficiencies with commercial LuAG:Ce scintillator, we select the thickness value as 0.3 mm for LuAG:Ce and the scintillator in this work to evaluate the response under various X-ray dose rates. As shown in Fig. 5(d), the as-prepared thin film scintillator presents good linearity to the X-ray dose rates in a large range from 0.45 μGyair s−1 to 96.09 μGyair s−1, which is beneficial for obtaining good imaging contrast. Light yield is one of the important indicator for evaluating the performance of scintillators, which can be indirectly obtained from the linear response curves. The response of the Cs2ZnBr4:25%Mn2+@PDSM thin film is 0.624 times that of the commercial LuAG:Ce scintillator, and we could obtain the light yield of ∼15600 photons per MeV. Then, the Cs2ZnBr4:25%Mn2+@PDSM thin film was used as a reference to determine the light yield of the well-known CsI:Tl scintillator under the same conditions. The light yield of the CsI:Tl scintillator was calculated to be ∼54100 photons per MeV, which is close to its reported value (54000 photons per MeV). We compare the RL properties of the Cs2ZnBr4:25%Mn2+@PDSM thin film with recently reported metal halide scintillators (Table S7, ESI†), and the light yield of our sample is close to that of the Rb2CuCl3 scintillator reported recently.50 The lowest detection limit is also an important indicator for determining the minimum dose rate required for detection. It can be defined under the dose rate at which the signal to noise ratio (SNR) equals 3.11Fig. 5(e) shows the linearity of RL intensity as a function of low dose rate for the Cs2ZnBr4:25%Mn2+@PDSM thin film scintillation screen, and the lowest detection limit is determined to be about 1.16 μGyair s−1, which is lower than the dose rate of 5.5 μGyair s−1 required for X-ray medical diagnostics.35 In addition, our scintillator shows the good stability, when exploring X-ray illumination, the RL intensities of our thin film scintillation screen only show the minor fluctuations (Fig. 5(f)).
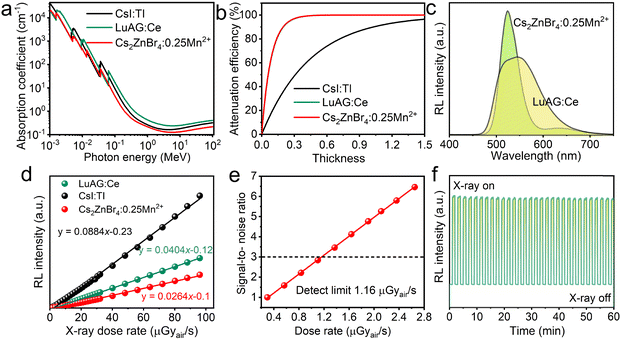 |
| | Fig. 5 (a) Absorption coefficients of Cs2ZnBr4:25%Mn2+, LuAG:Ce and CsI:Tl scintillators as a function of photon energy from 1 keV to 100 MeV. (b) Attenuation efficiency of Cs2ZnBr4:25%Mn2+, LuAG:Ce and CsI:Tl scintillators as a function of photon energy of 22 keV. (c) RL spectra of Cs2ZnBr4:25%Mn2+ and LuAG:Ce scintillators (tube voltage: 50 kV; dose rate: 96.09 μGyair s−1). (d) Normalized integrated RL intensities of Cs2ZnBr4:25%Mn2+, LuAG:Ce and CsI:Tl scintillators as a function of different X-ray dose rates. (e) Linear relationship between signal-to-noise ratio value and X-ray dose rates. (f) Photostability of the Cs2ZnBr4:25%Mn2+ scintillator under cyclical X-ray illumination. | |
3.5 X-ray imaging based on the Cs2ZnBr4@PDSM thin film scintillation screen
To prove the practicability of our thin film scintillation screen in X-ray imaging, we have employed our homemade X-ray imaging optical system (Fig. S10. ESI†). The first target object used is an aluminum specimen box containing a metal spring inside, as shown in Fig. 6(a), and the spring can normally not be observed in visible light. However, when exposing to X-ray illumination, contrast images are obtained, which show a clear metal spring inside (Fig. 6(b) and (c)). To further demonstrate the X-ray imaging capability, we use a ball-point pen and a metallic key partially wrapped in rubber as target objects, this Cs2ZnBr4:25%Mn2+@PDSM thin film scintillation screen also exhibits clear images of the inside structure (Fig. 6(d)–(f)). To characterize the spatial resolution of X-ray imaging, the modulation transfer function (MTF) of the image is obtained by the slanted-edge method. As shown in Fig. 6(g), a spatial resolution of 5.06 lp mm−1 can be achieved when the MTF is 0.2, which is comparable with the recently reported scintillator Cs2Ag0.6Na0.4In0.85Bi0.15Cl6 (4.4), and CsMnCl3:1%Pb (4.3) scintillators.47,51 All of results demonstrate the potential of the Cs2ZnBr4:25%Mn2+@PDSM thin film scintillation screen in nondestructive image detection applications.
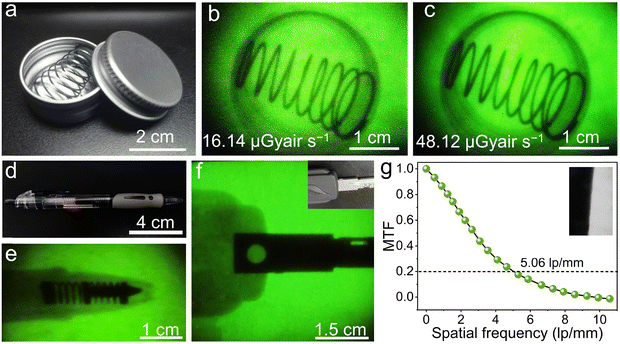 |
| | Fig. 6 (a) Photograph of aluminum specimen box with an iron spring under visible light. (b) and (c) X-ray imaging of an aluminum specimen box with an iron spring under the X-ray doses of 16.14 and 48.12 μGyair s−1, respectively. (d) Photograph of the ball-point pen. (e) X-ray imaging of the ball-point pen under the X-ray dose of 16.14 μGyair s−1. (f) X-ray imaging of a metallic key partially wrapped in rubber under the X-ray dose of 16.14 μGyair s−1, inset shows the photograph of the same metallic key. (g) MTF of the Cs2ZnBr4:25%Mn2+ thin film scintillation screen measured by the slanted-edge method (inset). | |
4 Conclusions
In conclusion, Mn2+-doped Cs2ZnBr4 luminescent metal halides and their composite film are reported in this work, and the crystals show unusual dual emissions peaking at 526 and 655 nm with the highest PLQY of 58.8% when 25%Mn2+ doping. PL studies demonstrate that the dual emissions come from the spin-forbidden d–d transition of Mn2+ ions located at different coordination configurations in different doped matrices, Cs2ZnBr4 and Cs2MnBr4·2H2O phases. In addition, Mn2+-doped Cs2ZnBr4 show good stabilities. For demonstrating the potential as an X-ray scintillator, a homogeneous flexible thin film scintillation screen based on Cs2ZnBr4:25%Mn2+@PDSM is fabricated, which shows improved environmental stability and good X-ray scintillation performance, including a modest light yield of 15600 photons per MeV and a low detection limit of 1.16 μGyair s−1. Moreover, the clear X-ray images of the target objects were observed by using such a film screen, and the spatial resolution could reach 5.06 lp mm−1, demonstrating potential in X-ray imaging.
Conflicts of interest
The authors declare no conflicts of interest.
Acknowledgements
This work was supported by the National Natural Science Foundation of China (No. 51961145101), the State Key Laboratory of Luminescent Materials and Devices (Skllmd-2022-02) and the Local Innovative and Research Teams Project of Guangdong Pearl River Talents Program (2017BT01X137).
Notes and references
- M. Z. Li and Z. G. Xia, Chem. Soc. Rev., 2021, 50, 2626–2662 RSC.
- O. F. Mohammed, J. Phys. Chem. Lett., 2019, 10, 5886–5888 CrossRef CAS.
- C. K. Zhou, L. J. Xu, S. Lee, H. R. Lin and B. W. Ma, Adv. Opt. Mater., 2020, 9, 2001766 CrossRef.
- L. Zhou, J. F. Liao and D. B. Kuang, Adv. Opt. Mater., 2021, 9, 2100544 CrossRef CAS.
- A. Vogler and H. Nikol, Comments Inorg. Chem., 1993, 14, 245–261 CrossRef CAS.
- H. Nikol, A. Becht and A. Vogler, Inorg. Chem., 2002, 31, 3277–3279 CrossRef.
- L. Zhou, J. F. Liao, Z. G. Huang, J. H. Wei, X. D. Wang, H. Y. Chen and D. B. Kuang, Angew. Chem., Int. Ed., 2019, 58, 15435–15440 CrossRef CAS PubMed.
- G. J. Zhou, B. B. Su, J. L. Huang, Q. Y. Zhang and Z. G. Xia, Mater. Sci. Eng., R, 2020, 141, 100548 CrossRef.
- J. Kundu and D. K. Das, Eur. J. Inorg. Chem., 2021, 4508–4520 CrossRef CAS.
- Q. Q. He, C. K. Zhou, L. J. Xu, S. J. Lee, X. S. Lin, J. Neu, M. Worku, M. Chaaban and B. W. Ma, ACS Mater. Lett., 2020, 2, 633–638 CrossRef CAS.
- K. Han, K. Sakhatskyi, J. Jin, Q. Zhang, M. V. Kovalenko and Z. Xia, Adv. Mater., 2022, 34, e2110420 CrossRef PubMed.
- J. H. Wei, Y. W. Yu, J. B. Luo, Z. Z. Zhang and D. B. Kuang, Adv. Opt. Mater., 2022, 10, 2200724 CrossRef CAS.
- Y. C. Liu, Z. Xu, Z. Yang, Y. X. Zhang, J. Cui, Y. H. He, H. C. Ye, K. Zhao, H. M. Su, R. Lu, M. Liu, M. G. Kanatzidis and S. Liu, Matter, 2020, 3, 180–196 CrossRef.
- B. B. Su, M. Z. Li, E. H. Song and Z. G. Xia, Adv. Funct. Mater., 2021, 31, 2105316 CrossRef CAS.
- V. Morad, Y. Shynkarenko, S. Yakunin, A. Brumberg, R. D. Schaller and M. V. Kovalenko, J. Am. Chem. Soc., 2019, 141, 9764–9768 CrossRef CAS.
- X. M. Li, J. X. Chen, D. D. Yang, X. Chen, D. L. Geng, L. F. Jiang, Y. Wu, C. F. Meng and H. B. Zeng, Nat. Commun., 2021, 12, 3879 CrossRef CAS PubMed.
- L. J. Xu, X. S. Lin, Q. Q. He, M. Worku and B. W. Ma, Nat. Commun., 2020, 11, 4329 CrossRef CAS PubMed.
- C. W. E. van Eijk, Phys. Med. Biol., 2002, 47, R85–R106 CrossRef.
- H. Li, Y. Zhang, M. Zhou, H. Y. Ding, L. Zhao, T. M. Jiang, H. Y. Yang, F. Zhao, W. Q. Chen, Z. W. Teng, J. B. Qiu, X. Yu, Y. M. Yang and X. H. Xu, ACS Energy Lett., 2022, 7, 2876–2883 CrossRef CAS.
- Y. C. Zhou, Q. Zhou, X. W. Niu, Z. G. Yan, T. F. Lin, J. W. Xiao and X. D. Han, Inorg.
Chem. Front., 2022, 9, 2987–2996 RSC.
- T. Y. He, Y. Zhou, X. J. Wang, J. Yin, L. Gutiérrez-Arzaluz, J. X. Wang, Y. H. Zhang, O. M. Bakr and O. F. Mohammed, ACS Energy Lett., 2022, 7, 2753–2760 CrossRef CAS.
- Y. Zhou, J. Chen, O. M. Bakr and O. F. Mohammed, ACS Energy Lett., 2021, 6, 739–768 CrossRef CAS.
- J. T. Cao, Z. Guo, S. Zhu, Y. Fu, H. Zhang, Q. Wang and Z. J. Gu, ACS Appl. Mater. Interfaces, 2020, 12, 19797–19804 CrossRef CAS.
- T. T. Xu, Y. Y. Li, M. Nikl, R. Kucerkova, Z. Y. Zhou, J. Chen, Y. Y. Sun, G. D. Niu, J. Tang, Q. Wang, G. H. Ren and Y. T. Wu, ACS Appl. Mater. Interfaces, 2022, 14, 14157–14164 CrossRef CAS.
- Z. W. Pan, L. Wu, J. Z. Jiang, L. Shen and K. Yao, J. Phys. Chem. Lett., 2022, 13, 2851–2861 CrossRef CAS PubMed.
- H. T. Wei, Y. J. Fang, P. Mulligan, W. Chuirazzi, H. H. Fang, C. C. Wang, B. R. Ecker, Y. L. Gao, M. A. Loi, L. Cao and J. S. Huang, Nat. Photonics, 2016, 10, 333–339 CrossRef CAS.
- L. Gao and Q. F. Yan, Sol. RRL, 2019, 4, 1900210 CrossRef.
- W. J. Li, L. L. Liu, M. R. Tan, Y. H. He, C. J. Guo, H. M. Zhang, H. T. Wei and B. Yang, Adv. Funct. Mater., 2021, 31, 2107843 CrossRef CAS.
- L. Lu, M. Z. Sun, Q. Y. Lu, T. Wu and B. L. Huang, Nano Energy, 2021, 79, 105437 CrossRef CAS.
- K. Han, J. C. Jin, B. B. Su, J. W. Qiao and Z. G. Xia, Adv. Opt. Mater., 2022, 10, 2200865 CrossRef CAS.
- L. Y. Lian, X. Wang, P. Zhang, J. S. Zhu, X. W. Zhang, J. B. Gao, S. Wang, G. J. Liang, D. L. Zhang, L. Gao, H. S. Song, R. Chen, X. Z. Lan, W. X. Liang, G. D. Niu, J. Tang and J. B. Zhang, J. Phys. Chem. Lett., 2021, 12, 6919–6926 CrossRef CAS PubMed.
- L. Y. Lian, M. Y. Zheng, W. Z. Zhang, L. X. Yin, X. Y. Du, P. Zhang, X. W. Zhang, J. B. Gao, D. L. Zhang, L. Gao, G. D. Niu, H. S. Song, R. Chen, X. Z. Lan, J. Tang and J. B. Zhang, Adv. Sci., 2020, 7, 2000195 CrossRef CAS.
- Q. Wang, Q. Zhou, M. Nikl, J. W. Xiao, R. Kucerkova, A. Beitlerova, V. Babin, P. Prusa, V. Linhart, J. K. Wang, X. M. Wen, G. D. Niu, J. Tang, G. H. Ren and Y. T. Wu, Adv. Opt. Mater., 2022, 10, 2200304 CrossRef CAS.
- B. H. Li, Y. Xu, X. L. Zhang, K. Han, J. C. Jin and Z. G. Xia, Adv. Opt. Mater., 2022, 10, 2102793 CrossRef CAS.
- T. M. Jiang, W. B. Ma, H. Zhang, Y. Tian, G. Lin, W. G. Xiao, X. Yu, J. B. Qiu, X. H. Xu, Y. Yang and D. X. Ju, Adv. Funct. Mater., 2021, 31, 2009973 CrossRef CAS.
- Q. S. Chen, J. Wu, X. Y. Ou, B. L. Huang, J. Almutlaq, A. A. Zhumekenov, X. W. Guan, S. Y. Han, L. L. Liang, Z. G. Yi, J. Li, X. J. Xie, Y. Wang, Y. Li, D. Y. Fan, D. B. L. Teh, A. H. All, O. F. Mohammed, O. M. Bakr, T. Wu, M. Bettinelli, H. H. Yang, W. Huang and X. G. Liu, Nature, 2018, 561, 88–93 CrossRef CAS PubMed.
- B. Morosin and E. C. Lingafelter, Acta Crystallogr., 1959, 12, 744–745 CrossRef CAS.
- R. Puget, M. Jannin, R. Perret, L. Godefroy and G. Godefroy, Ferroelectrics, 1990, 107, 229–234 CrossRef CAS.
- B. B. Su, M. S. Molokeev and Z. G. Xia, J. Mater. Chem. C, 2019, 7, 11220–11226 RSC.
- G. J. Zhou, Z. Y. Liu, J. L. Huang, M. S. Molokeev, Z. W. Xiao, C. G. Ma and Z. G. Xia, J. Phys. Chem. Lett., 2020, 11, 5956–5962 CrossRef CAS.
- V. Morad, I. Cherniukh, L. Pottschacher, Y. Shynkarenko, S. Yakunin and M. V. Kovalenko, Chem. Mater., 2019, 31, 10161–10169 CrossRef CAS PubMed.
-
J. Almutlaq, Engineering of Lead-Free Materials for Light-Emitting Application: Structural and Photophysical Studies, 2020 Search PubMed.
- B. B. Su, M. S. Molokeev and Z. G. Xia, J. Phys. Chem. Lett., 2020, 11, 2510–2517 CrossRef CAS.
- B. B. Su, G. J. Zhou, J. L. Huang, E. H. Song, A. Nag and Z. G. Xia, Laser Photonics Rev., 2021, 15, 2000334 CrossRef CAS.
- P. F. Cheng, L. Feng, Y. F. Liu, D. Y. Zheng, Y. B. Sang, W. Y. Zhao, Y. Yang, S. Q. Yang, D. H. Wei, G. X. Wang and K. L. Han, Angew. Chem., Int. Ed., 2020, 59, 21414–21418 CrossRef CAS PubMed.
- M. Wang, R. T. Yang, S. S. Cheng, G. Q. Li, M. C. Jia, X. Chen, D. Wu, X. J. Li and Z. F. Shi, J. Phys.: Condens. Matter, 2022, 34, 204009 CrossRef.
- W. J. Zhu, W. B. Ma, Y. R. Su, Z. Chen, X. Y. Chen, Y. G. Ma, L. Z. Bai, W. G. Xiao, T. Y. Liu, H. M. Zhu, X. F. Liu, H. F. Liu, X. Liu and Y. M. Yang, Light: Sci. Appl., 2020, 9, 112 CrossRef CAS.
- R. S. Zeng, K. Bai, Q. L. Wei, T. Chang, J. Yan, B. Ke, J. L. Huang, L. S. Wang, W. C. Zhou, S. Cao, J. L. Zhao and B. S. Zou, Nano Res., 2021, 14, 1551–1558 CrossRef CAS.
- G. Blasse, J. Chem. Phys., 1969, 51, 3529–3530 CrossRef CAS.
- X. Zhao, G. D. Niu, J. S. Zhu, B. Yang, J. H. Yuan, S. R. Li, W. R. Gao, Q. S. Hu, L. X. Yin, K. H. Xue, E. Lifshitz, X. S. Miao and J. Tang, J. Phys. Chem. Lett., 2020, 11, 1873–1880 CrossRef CAS.
- L. Q. Guan, S. Shi, X. W. Niu, S. C. Guo, J. Zhao, T. M. Ji, H. Dong, F. Y. Jia, J. W. Xiao, L. D. Sun and C. H. Yan, Adv. Sci., 2022, 9, e2201354 CrossRef PubMed.
|
| This journal is © The Royal Society of Chemistry 2023 |
Click here to see how this site uses Cookies. View our privacy policy here. 
 *ab
*ab