Sublimable complexes with spin switching: chemical design, processing as thin films and integration in graphene-based devices†
Miguel
Gavara-Edo‡
 a,
Francisco Javier
Valverde-Muñoz‡
 a,
Rosa
Córdoba
 a,
M. Carmen
Muñoz
 b,
Javier
Herrero-Martín
 c,
José Antonio
Real
 *a and
Eugenio
Coronado
 *a
*a
aInstitute of Molecular Science, University of Valencia, Catedrático José Beltrán 2, Paterna 46980, Spain. E-mail: Jose.A.Real@uv.es; Eugenio.Coronado@uv.es
bDepartamento de Fisica Aplicada, Universitat Politècnica de València, Camino de Vera s/n, Valencia 46022, Spain
cBoreas Beamline CELLS-ALBA Synchrotron, Carrer de la Llum 2-26, Cerdanyola del Vallès 08290, Spain
First published on 2nd December 2022
Abstract
Among the different types of switchable molecular compounds, sublimable Fe(II) SCO molecules provide a suitable platform to develop smart devices that respond to external stimuli. Herein, we report the synthesis, crystallographic structure and magnetic properties of three new neutral Fe(II) SCO molecules belonging to the {Fe[H2B(pz)2]2(L)} family with bidentate-α-diimine ligands L = 3-(pyridin-2-yl)-[1,2,3]triazolo[1,5-a]pyridine (tzpy), 5,5′,6,6′-tetrahydro-4H,4′H-2,2′-bi(1,3-thiazine) (btz) and 4,4′,5,5′-tetrahydro-2,2′-bithiazole (bt) (1, 2 and 3, respectively), as well as two solvated forms of 1 and 3. All three desolvated compounds present thermal- and light-induced SCO transitions with different degrees of cooperativity and effectiveness. Furthermore, 1 and 2 are demonstrated to be sublimable under HV conditions, affording homogeneous thin films 200 nm thick (TF1 and TF2) that retain the chemical integrity of the original molecules regardless of the deposition surface. The SCO behaviour of the films is characterized by the XAS technique revealing the partial retainment of both thermal- and light-induced spin transitions, yet losing the cooperativity. Finally, SCO/2D horizontal hybrid devices based on CVD-graphene are produced using these films. Being the first ones of this type utilizing molecules of the {Fe[H2B(pz)2]2(L)} family, with L = tzpy and btz, the devices have allowed the successful detection of the thermal SCO transition through the electric properties of CVD-graphene.
10th Anniversary statementSince the splitting of Journal of Materials Chemistry into three A, B and C independent journals, these journals have reached a much broader range of scientific communities. Nowadays, these journals constitute one of the best platforms for exchanging and disseminating knowledge within the multidisciplinary field of materials chemistry. In our case, we have published in these journals more than 40 articles mostly based on multifunctional molecular materials exhibiting appealing magnetic, optical and electrical properties and showing potential for different applications. Thanks to the J. Mater. Chem. family of journals, we have been able to contribute to the development of emerging fields such as molecular spintronics and molecular quantum technologies. For this and for much more, congratulations!. |
Introduction
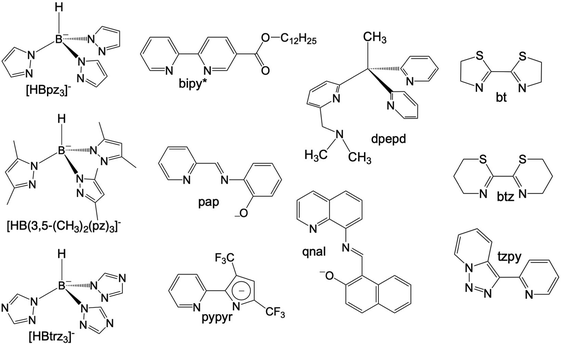
Octahedral FeII spin crossover (SCO) complexes are molecular materials that reversibly switch between high-spin (HS: t2g4eg2, S = 2) and low-spin (LS: t2g6eg0, S = 0) states inducing changes in the magnetic, optical, electrical and structural properties controlled through the action of external stimuli such as temperature and/or pressure changes, light irradiation and guest molecules. These features have attracted much attention due to their potential applicability as active components in electronic and spintronic devices, e.g. sensors and memory devices.1–9 To this end, selected FeII SCO materials have been processed at sub-micrometer scales as nanocrystals/nanoparticles or also as thin films usually deposited by layer-by-layer or high-vacuum (HV) sublimation methods.10,11HV sublimation has been demonstrated to be an efficient method to grow very pure films of SCO nanomaterials with a sub-monolayer precision. This has been demonstrated for a reduced number of neutral mononuclear FeII SCO complexes affording intermolecular interactions that favour sublimation under relatively mild conditions. Among them, [Fe(phen)2(NCS)2],12–14 {Fe[H2B(pz)2]2(L)}15–17 with L = phen and bipy ([H2B(pz)2]− = hydrobispyrazolylborate, L = 1,10-phenanthroline, 2,2′-bypiridine) and [Fe(Pyrz)2]18,19 (Pyrz = hydro-tris-(3,5-dimethyl-pyrazolyl)borate) have been most investigated. To the best of our knowledge, the first thin films based on SCO molecules deposited by sublimation were reported in the last decade for the archetypal [Fe(phen)2(NCS)2].20 More recently, this study was extended to investigate the effect of different metallic substrates on the SCO properties of this molecule.21 However, thin films of the complex {Fe[H2B(pz)2]2(phen)} deposited on different substrates have been the most intensively investigated. These studies have revealed electron-induced reversible switching of single SCO complexes22 and the light induced excited spin state trapping (LIESST) phenomenon on ultrathin films deposited on Au(111),23 also on highly oriented pyrolytic graphite (HOPG) surfaces,24 and even electrically sensed when embedded in a vertical junction.25 In addition, they have inspired the preparation of homologous complexes derived from the 4-methyl/-chloro- and 4,7-dimethyl/-dichloro substituted phen,26 whose SCO properties have been investigated in bulk and thin films by sublimation on HOPG and for the 3,4,7,8-tetramethyl homologous complexes deposited on Au(111) and bismuth.27 Concerning {Fe[H2B(pz)2]2(bipy)}, it has been observed the locking and unlocking of the SCO behavior as a function of the film thickness on Au(111), or deposited on dielectric substrates (SiO2 and Al2O3).28–30 Also, a practically complete SCO transition has been observed on HOPG, showing a clear growth of cooperativity with the increase of the number of monolayers from 0.35(4) to 10(1).31 A different approach to explore cooperativity has been used preparing 10 nm thin films of the sublimed {Fe[H2B(pz)2]2(bipy*)} system on SiO2, bipy* being a 2,2′-bipyridine functionalized with a dodecyl (C12) alkyl chain to favour intermolecular interactions.32 Lately, much effort has been dedicated to study the sublimation of [Fe(Pyrz)2]. At first, when processed as thin films (ca. 100 nm thick regime), this system was observed to present an incomplete thermal SCO transition, yet in a similar temperature range to that of the bulk material without clear loss of cooperativity.33 Furthermore, both LIESST and soft X-ray induced excited spin state trapping (SOXIESST), known to occur in the bulk, were as well found in the films. Subsequent work revealed the coexistence of two polymorphs within the sublimed films of this molecule, where each of them appears to present a different SCO behaviour.34 Then, using the most stable polymorph, a spin-state device was first produced incorporating this molecule.35 More recently, further work was devoted in this direction by exploiting the more effective light-induced SCO properties of the less stable polymorph with its integration in a first-of-its-kind contactless graphene-based horizontal device.36 In parallel, ultrathin films (submonolayers) of this molecule have been studied on different substrates showing that they experience a variety of surface induced effects such as electric field induced HS/LS ordered superstructures, quenching of the HS state, a reverse LIESST effect, single-molecule spin state manipulation and negative differential resistance.37–43 All these studies have evidenced the vast and rich SCO phenomenology available for each of the different molecular systems aforementioned. Nonetheless, it should be noted that other sublimable SCO molecules have been reported as well such as {Fe[HB(pz)3]2},44,45 {Fe[HB(trz)3]2},46 [Fe(dpepd)(NCS)2],47 [Fe(qnal)2]·xCH2Cl2,48 and [Fe(pypyr(CF3)2)2(phen)]49 (all the ligands corresponding to these molecules are depicted in Scheme 1).
In this context, here we describe the synthesis, structure, magnetic and photomagnetic properties for the bulk materials of three new SCO molecules of the {Fe[H2B(pz)2]2(L)}·nS type, with L being the bidentate-α-diimine ligands tzpy (1·CH3CN, 1), btz (2), and bt (3·1/2CH2Cl2, 3) (see Scheme 1). Furthermore, we have succeeded in the preparation of thin films TF1 and TF2 deposited on different substrates (SiO2, Au coated (40 nm) glass and CVD-graphene) from sublimation under HV conditions of the as-synthesized 1 and 2 bulk powders, respectively, probing their sublimable character. In contrast, 3 has been found to decompose upon heating under HV conditions without sublimation. The chemical integrity of TF1 and TF2 has been analyzed by means of infrared (IR) and Raman spectroscopies, while their thermal and light-induced SCO behavior has been monitored by means of X-ray absorption spectroscopy (XAS). Finally, TF1 and TF2 films have been integrated on horizontal hybrid devices based on CVD-graphene to detect the thermal SCO behavior of the films through the electrical properties of the 2D material, since graphene has been previously proven as a highly sensitive platform to the changes undergone by SCO materials upon their spin transition (i.e. devices based on sublimed films and van der Waals heterostructures).35,36,50
Results and discussion
Synthesis
{Fe[H2B(pz)2]2(L)} (L = btz, tzpy and bt) complexes were synthesized following the method previously described for L = phen and bipy.15 Under the reported conditions, {Fe[H2B(pz)2]2(tzpy)} is rapidly formed giving a pink-orange microcrystalline precipitate (1). Single crystals of its acetonitrile solvate (1·CH3CN) were isolated in 48 h from liquid-to-liquid layering of a MeOH solution of [FeII/2[H2B(pz)2]−] (bottom) and a CH3CN solution of tzpy (top) separated by a mixture of MeOH:CH3CN. The thermal analysis of the resulting needle-shaped crystals shows a sharp loss of weight in the interval 390–410 K consistent with a mol of CH3CN per mol of complex (Fig. S1a, ESI†). Powder X-ray diffraction patterns show that the desolvated form corresponds to the pink-orange microcrystalline phase (1) (Fig. S1b, ESI†). Compound {Fe[H2B(pz)2]2(btz)} (2) precipitates as a deep blue highly crystalline product of medium solubility, while single crystals for appropriate structure analysis were obtained within 24 h from evaporation of the resulting methanolic mother liquor under an Ar stream. The same synthetic procedure used for L = bt gave single crystals of the unsolvated complex {Fe[H2B(pz)2]2(bt)} (3). However, given the relative low solubility of bt in MeOH and in order to increase the yield of the complex, CH2Cl2 was used as an alternative solvent where bt is more soluble, thereby affording the corresponding hemisolvate form (3·1/2CH2Cl2). The thermal analysis shows that a loss of weight, consistent with one molecule of CH2Cl2 per two moles of complex, takes place in the temperature interval 379–450 K (Fig. S2, ESI†).Magnetic properties
The magnetic properties were monitored through the thermal dependence of the product χMT with χM being the molar magnetic susceptibility and T being the temperature. The χMT vs. T plots for the solvate and unsolvate form of the tzpy derivative are shown in Fig. 1a. At 300 K, the χMT value is ca. 3.80 cm3 K mol−1 for 1 and 1·CH3CN. This value decreases by ca. 0.3 cm3 K mol−1 upon cooling down to 180 K (1) and 200 K (1·CH3CN). Below these temperatures, both forms show a complete HS-to-LS transformation reaching a χMT value of about 0.1 cm3 K mol−1 at 50 K. The SCO takes place, respectively, in one and two steps for the 1·CH3CN and 1, being more cooperative for the latter. Indeed, in the heating mode, the χMT vs. T plot matches quite well the cooling mode for the 1·CH3CN form but a very narrow hysteresis (ca. 4 K) is observed for 1. The equilibrium temperature T1/2 at which the HS and LS molar fractions are equal to 0.5 is 135 K (1·CH3CN) and 167.5 K (1), respectively. For the latter, the characteristic temperatures at which the [∂(χMT)/∂T] vs. T plot shows a maximum are 157 and 177 K.For compound 2, the χMT value is 3.7 cm3 K mol−1 at 300 K and decreases slightly upon cooling down to 210 K (Fig. 1b). Just below this temperature, it undergoes a cooperative one step SCO transition attaining a χMT ≈ 0 cm3 K mol−1 at 192 K. In the heating mode, the χMT vs. T plot does not match that of the cooling mode defining a hysteresis loop 6 K wide with (T1/2)down = 197 K and (T1/2)up = 203 K.
Concerning compound 3, the χMT value 3.8 cm3 K mol−1 remains almost constant down to 50 K and then slightly decreases due to the occurrence of zero-field-splitting of the S = 2 HS state denoting the stabilization of the HS state at all temperatures. In contrast, for the solvate form 3·1/2CH2Cl2, χMT decreases as T decreases in a very similar way as described for the solvate form of the tzpy, 1·CH3CN, undergoing a complete SCO characterized by T1/2 = 116 K (Fig. 1c).
Photo-generation of the metastable HS* state from the LS state, the so-called LIESST experiment,51 was carried out at 10 K irradiating microcrystalline samples of the title compounds with green light (λ = 532 nm). Under these conditions, the four samples that display SCO undergo the LIESST phenomenon with different yields. Indeed, χMT saturates to values of 3.4 cm3 K mol−1 for 1 and 1·CH3CN, 1.9 cm3 K mol−1 for 3·1/2CH2Cl2 and 0.9 cm3 K mol−1 for 2. Subsequently, the light was switched off and the temperature increased at a rate of 0.3 K min−1 inducing a gradual increase of χMT that attains a maximum value of 3.8 cm3 K mol−1 in the interval of 30–35 K for 1 and 1·CH3CN, 2.09 cm3 K mol−1 for 3·1/2CH2Cl2 in the interval 20–30 K, and 0.97 for 2 at 17 K, which corresponds, respectively, to ca. 100%, 54% and 26% of the maximum value observed at 300 K. This increase in χMT reflects the thermal population of different microstates originating from the zero-field splitting of the HS* state. At higher temperatures, χMT decreases rapidly until joining the thermal SCO curve, respectively, at ca. 65, 63 and 47 K, indicating that the metastable HS* state has relaxed back to the stable LS state. The corresponding TLIESST temperatures, evaluated as ∂(χMT)/∂T,52 are, respectively, ca. 55, 57 and 36 K. These temperatures are consistent with the inverse-energy-gap law, i.e. the metastability of the photo-generated HS* species decreases as the stability of the LS increases.53–55
Structure
Single crystals of 1·CH3CN, 2, 3·1/2CH2Cl2 and 3 were measured, respectively, at 110 K/250 K, 120 K/240 K, 120 K/220 K and 120 K. The crystals keep the same space group at both temperatures, 1·CH3CN (triclinic P![[1 with combining macron]](https://www.rsc.org/images/entities/char_0031_0304.gif) ), 2 (orthorhombic Pna21) and 3·1/2CH2Cl2 (monoclinic P21/c). The unsolvate form 3 adopts the triclinic P
), 2 (orthorhombic Pna21) and 3·1/2CH2Cl2 (monoclinic P21/c). The unsolvate form 3 adopts the triclinic P![[1 with combining macron]](https://www.rsc.org/images/entities/char_0031_0304.gif) . Selected crystal data are gathered in Table S1 (ESI†).
. Selected crystal data are gathered in Table S1 (ESI†).
The molecular structure for the four derivatives is depicted in Fig. 2 together with the atom numbering. The FeII centre is surrounded by two [H2B(pz)2]− anionic ligands adopting each other a cis conformation, while the remaining positions are occupied by the bidentate-α-diimine ligand L = tzpy, btz or bt, thereby completing a distorted [FeN6] octahedral geometry with the Fe–N bond lengths defined by the [H2B(pz)2]− ligands shorter than those defined by L. A selection of significant bond-lengths and angles is gathered in Tables S2–S6 (ESI†). Furthermore, the complexes are chiral but both enantiomers coexist in the unit cell. Two slightly different Fe sites (Fe1 and Fe2) and consequently four crystallographically distinct [H2B(pz)2]− ligands are found for 1·CH3CN (only the Fe1 site is displayed in Fig. 2a, site Fe2 is shown in Fig. S3, ESI†). At 250 K, the average bond lengths 〈Fe1–N〉 = 2.188(3) Å and 〈Fe2–N〉 = 2.187(3) Å are practically identical. However, at 110 K, both sites exhibit an unsymmetrical decrease of 〈Fe–N〉 as the LS state is populated: 〈Fe1–N〉 = 2.018(6) Å and 〈Fe2–N〉 = 2.058(6) Å, which involves a change in 〈Fe1–N〉 and 〈Fe2–N〉 of 0.170 and 0.129 Å, respectively. Taking into account a structural reinvestigation of the L = phen and bipy homologous complexes, the 〈Fe1–N〉 change is 0.180 Å,17 and assuming this value applicable to the title compounds, a transformation of 95% and 71% is found for Fe1 and Fe2 sites, respectively. Considering the two Fe sites, the overall transformation is 83%, a value reasonably consistent with the χMT ≈ 0.83 cm3 K mol−1 at 110 K, which corresponds to 78.2% of the HS-to-LS transformation. The angular distortion of [FeN6] from the ideal octahedron, defined as the sum of the angular deviation of the 12 cis angles  is very similar for the two sites ΣFe1 = 39.9° (110 K) and 58.2° (250 K) and ΣFe2 = 44.5° (110 K) and 52.3° (250 K).
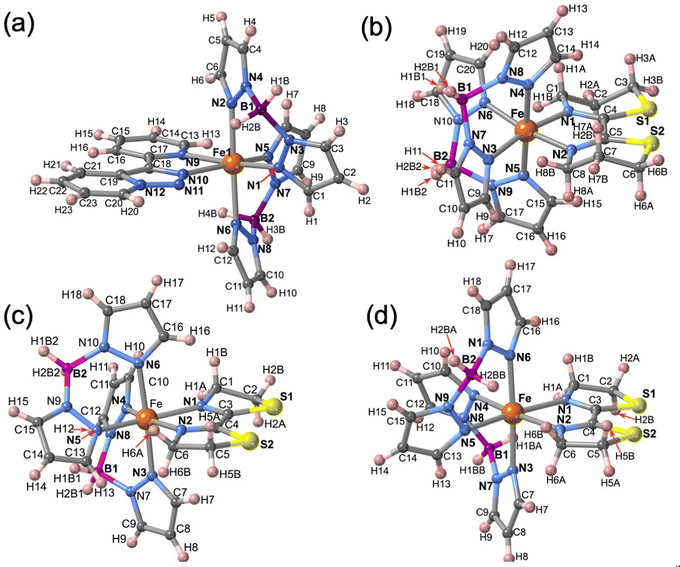 | ||
| Fig. 2 Molecular unit of 1·CH3CN, 2, 3·1/2CH2Cl2 and 3, showing the atom numbering. Only one of the two FeII centres (Fe1) is shown in 1·CH3CN, for Fe2 (see Fig. S3, ESI†). | ||
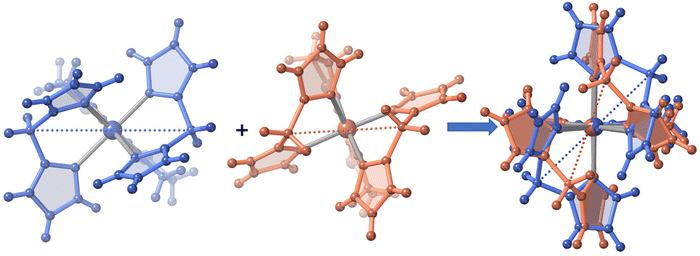
The only one [FeN6] octahedral site found for 2 is characterized by 〈Fe–N〉 = 1.985(4) and 2.172(5) Å at 120 and 240 K, respectively. The difference of 0.187 Å well-corresponds with the change of the average Fe–N bond length typically observed for a complete HS ↔ LS transformation in agreement with the magnetic data. Furthermore, the SCO is accompanied by a change of ΣFe from 47.3° (120 K) to 60.1° (240 K. For 3·1/2CH2Cl2 the 〈Fe–N〉 value is 2.181(4) Å at 220 K, where the complex is fully HS and decreases down to 〈Fe–N〉 = 2.103(4) Å at 120 K, the lowest attained temperature due to experimental limitations. The difference of 0.078 Å, consistent with a partial HS → LS transformation ca. 42%, matches reasonably well with the χMT value 2.3 cm3 K mol−1 at 120 K, which corresponds ca. 40% of the complete HS → LS spin state change. In this interval of temperatures, ΣFe changes from 40.4° (120 K) to 52.1° (220). For the unsolvate form 3, the 〈Fe–N〉 value equal to 2.184(4) Å at 120 K is perfectly consistent with the HS shown by this compound at any temperature, in spite of the ΣFe = 42.9°. However, at molecular level, the most remarkable difference between the structure of 3 and its solvated homologue is the different relative conformation of the two [H2B(pz)2]− ligands around the FeII centre (see Fig. 3). This difference makes the separation between the [H2B(pz)2]− tetrahedrons significantly longer for 3 (6.585 Å) than for its solvate counterpart (4.607 Å). This “short” conformation is also observed for 2, while the “long” conformation is observed for 1·CH3CN as well as for the previously reported 2,2′-bipy and phen derivatives.
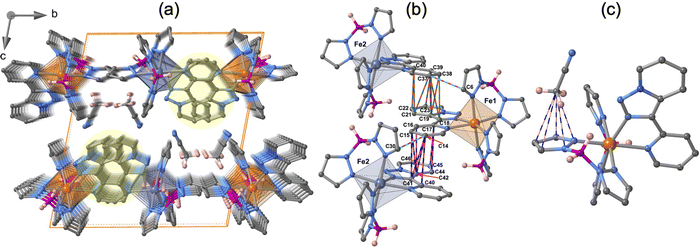
The crystal packing of 1·CH3CN is depicted in Fig. 4a. The unit cell contains four molecules, two for each crystallographically distinct FeII centre. Similar to the {Fe[H2B(pz)2]2(phen)}15–17 complex, the aromatic nature of the tzpy ligand enables the formation of a very efficient π–π stacking, involving a great number of intermolecular C⋯C contacts smaller than the sum of the van der Waals radii (≈3.7 Å) between adjacent complexes with alternating Fe1–Fe2–Fe1 centres running along the a-direction (Fig. 4b). The resulting supramolecular zig–zag chains stack down the b-direction, where no relevant interactions exist, defining layers parallel to the a–b plane, which stack along the c-direction generating voids where the CH3CN molecules are located. Interestingly, the CH3CN methyl group interacts with one of the pyrazole rings of each Fe1 and Fe2 centres (Fig. 4c). The number and the length of these short contacts strongly depend on the spin state of the compound (see Table S7, ESI†).
The non-aromatic nature of the neutral α-diimine ligand btz is the cause of the much less compact molecular packing exhibited by 2. Indeed, no relevant intermolecular contacts are observed for this compound even in the LS state at 120 K (Fig. S4 and Table S8, ESI†). In contrast, the crystal packing of 3·1/2CH2Cl2 and 3 displays a larger number of intermolecular C⋯C and C⋯S contacts, particularly at 120 K, despite bt also being a non-aromatic ligand (Fig. S5 and Table S8, ESI†).
Sublimation of 1 and 2 as molecular thin films
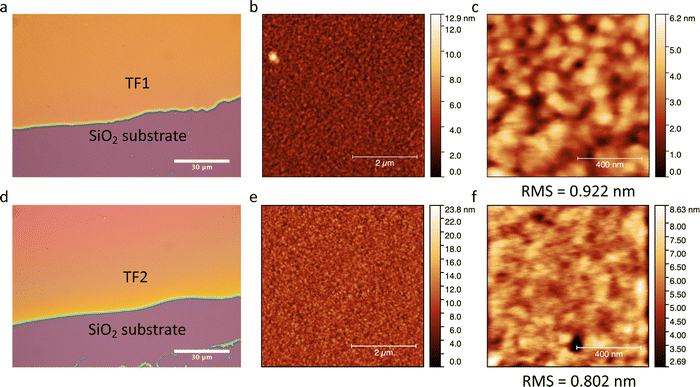
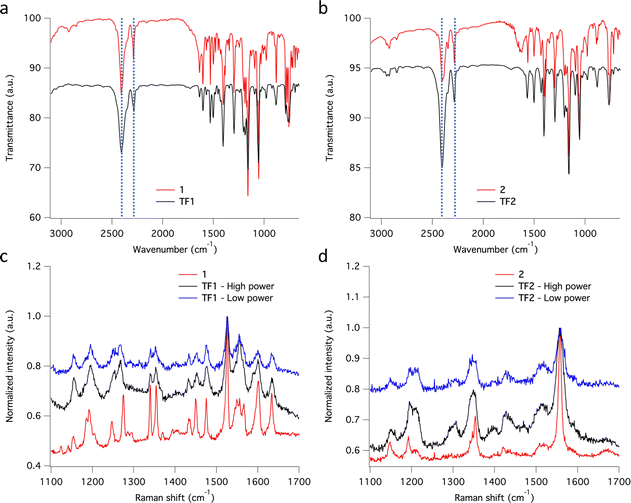
Thin films TF1 and TF2ca. 200 nm thick were prepared by sublimation under HV conditions of the respective as-synthesized desolvated bulk powders 1 and 2 (see Methods). Also, sublimation of 3 was explored unsuccessfully since the bulk powder decomposed in the crucible upon heating without accomplishing any deposition onto overlaying substrates. Different substrates (SiO2, Au coated (40 nm) glass and CVD-graphene) were used for the deposition of the molecular films depending on their purpose. It is important to note that in this thickness range, the chemical integrity of SCO molecules is usually preserved for this family of compounds since surface-induced effects have only been observed in the (sub)monolayer regime.23,26,27,29,56–58 Furthermore, all films show similar morphology, regardless of the type of substrate used, with highly homogenous coverages and very low roughness (ca. 1 nm), according to optical and atomic force microscopies (AFM) (Fig. 5). These results match with the characteristics observed for the other reported materials of this family of compounds in this thickness regime.25,29,56,57The chemical integrity of TF1 and TF2 was analyzed by means of infrared (IR) and Raman spectroscopies. Moreover, their respective bulk materials (1 and 2) were characterized simultaneously for comparison. The high resemblance observed between the IR spectra of TF1 and TF2 grown on Au substrates, and those of their respective bulk powders 1 and 2, stand out as an indicative feature of the preservation of the chemical integrity of the molecules after their sublimation.24 Note in particular the characteristic vibrational modes of the asymmetrical/symmetrical stretching of the B–H bond: 2407/2283 cm−1 (1) and 2403/2283 cm−1 (2) (Fig. 6a and b). Similarly, the Raman spectra recorded using a 532 nm laser for TF1 and TF2 grown on SiO2 substrates using two different laser powers show high similarity to those of 1 and 2 (Fig. 6c and d), evidencing retainment of the molecular integrity of the SCO molecules after sublimation, like other systems of the same family of SCO molecules.57
Spin crossover behavior of the deposited films TF1 and TF2 on SiO2 and graphene substrates
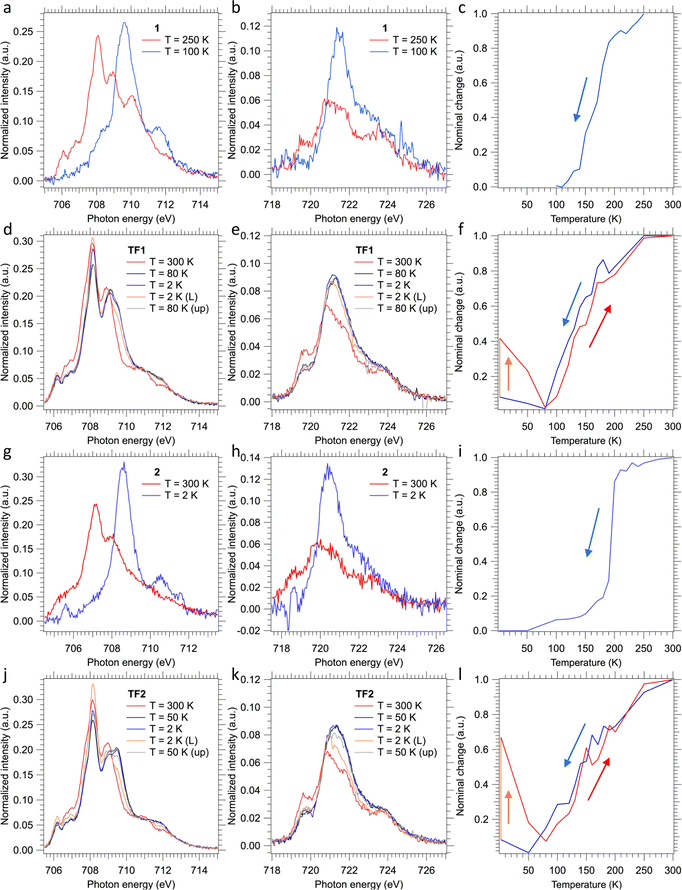
The SCO behavior of the films TF1 and TF2 deposited on SiO2 substrates, as well as that of their bulk counterparts 1 and 2, was monitored using the XAS technique at the Fe L2,3 edges (see Fig. 7). In order to get the thermally induced SCO profile of the films, temperature variable XAS spectra were recorded in both cooling and heating modes. Additional XAS spectra were recorded to characterize the LIESST effect irradiating the films for 10 min at 2 K using a red laser (λ = 633 nm) and the subsequent thermal relaxation of the photo-generated HS molecules upon heating in the dark. Concerning the bulk powders, only temperature variable XAS spectra were recorded in the cooling mode.Upon cooling, the almost disappearance of the peaks found at 708.1 and 708.9 eV of the Fe L3 edge at high temperature (characteristic of HS state) in favor of the appearance of a very intense new peak at 709.6 eV at low temperature (characteristic of LS state) in 1 and 2 is consistent with the thermal spin transition (Fig. 7a, b, g and h).24,26,27,58,59 Furthermore, this is accompanied by a drastic increase in the intensity of the main peak of the Fe L2 edge at 721.5 eV. Therefore, the thermal dependence of the HS fraction for 1 and 2 was obtained for the cooling mode from a linear fitting of the XAS spectra of the fully populated HS and LS states (see Fig. 7c and i). These thermal dependences characterized by T1/2 ≈ 170 and 195 K, for 1 and 2, respectively, are fully consistent with the cooling branches derived from the magnetic susceptibility measurements (Fig. 1a and b). Nonetheless, the measured spectra also reveal partial oxidation of the bulk material since some contribution of FeIII is observed at the Fe L3 edge at 710 eV invariably at all temperatures.60 Further evidence is found at the Fe L2 edge, where its shape corroborates this partial oxidation of the bulk material.60 This observation is in strong contrast with the magnetic susceptibility measurements, since no oxidation is observed for neither compound as the low-temperature χMT values practically equal to zero are consistent with 100% of FeII centres in both derivatives. Hence, we believe that this partial oxidation is the consequence of the unavoidable manipulation and adhesion of the bulk powders onto the C-tape for the performance of the XAS experiment.
Regarding thin films, the recorded XAS spectra at 300 K show a pure HS-FeII signal for both TF1 and TF2 films (red lines in Fig. 7d, e and j, k, respectively). The lack of oxidation in this case is accomplished by keeping the films under an inert atmosphere during the whole process, something unavoidable for the bulk powders. Upon cooling, both films appear to undergo some changes at the Fe L2,3 edges in a similar fashion to the above-described for the respective bulk powders. However, in this case, the total changes accomplished at low temperatures (80 K and 50 K for TF1 and TF2, respectively) are much smaller (black lines in Fig. 7d, e and j, k). These results indicate that the thermal spin transition undergone by the films is incomplete, more gradual (blue lines in Fig. 7f and l) and shifted to lower temperatures, with (T1/2)down ≈ 130 and 140 K for TF1 and TF2, respectively. Note that the exact value of the minimum HS fraction reached cannot be calculated with exact accuracy since the partial oxidation of the bulk powder prevented from collecting reliable pure HS and LS referential spectra. Nonetheless, from similar reported XAS characterization of molecules of this family, we can estimate a maximum thermally achieved HS to LS conversion close to 20% for TF1 at 80 K and close to 25% for TF2 at 50 K.24,26,27,58,59 Upon further cooling, both molecules appear to experience some soft X-ray induced excited spin state trapping (SOXIESST) effect during the collection of the respective XAS spectra (blue lines in Fig. 7d, e and j, k), reaching at 2 K ca. 8% of the initial HS state (blue lines in Fig. 7f – between 2 and 80 K – and Fig. 7l – between 2 and 50 K). This manifests the susceptibility of the films to soft X-rays at low temperatures (below 80 K for TF1 and 50 K for TF2), something expectable since the SOXIESST effect has been already observed for films of other molecules of this family.26,27,58
Furthermore, upon red laser irradiation at 2 K during 10 min, the LIESST effect is accomplished (orange lines in Fig. 7d, e and j, k). This is especially effective in the film TF2, where ca. 70% of the LS molecules switch to the photo-generated HS state (orange line in Fig. 7f), in contrast to the film TF1 in which 40% of the LS centres are excited (orange lines in Fig. 7l). The metastable photo-generated HS states relaxed back to the LS through smooth heating (grey lines in Fig. 7d, e and j, k). This progression is clearly monitored between 2 K and 80 K (red lines in Fig. 7f and l) reaching back the ground state at ca. 80 K. Then, upon further heating, the thermal spin transition of both films shows full reversibility describing a similar trend as the cooling process, almost without hysteresis (red lines in Fig. 7f and l).
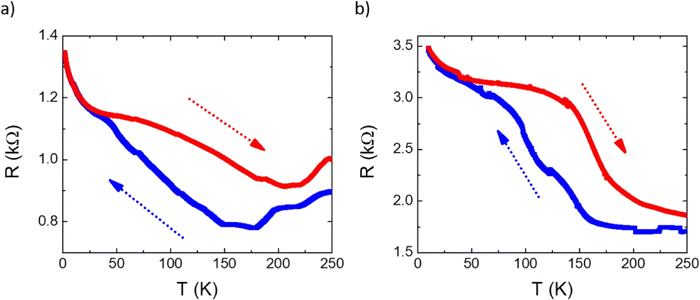
SCO was also studied in hybrid interfaces formed by subliming 1 and 2 as thin films over graphene. Following a similar procedure to that recently reported by us,36 horizontal devices were produced depositing TF1 and TF2 onto pre-contacted CVD-graphene. In these heterostructures, the resistive properties of the underlying CVD-graphene substrate are highly sensitive to the strain induced by the volume change associated with the spin state change of the anchored SCO layer.35,36 The measurements of the transport properties of the devices as a function of temperature for a single full thermal cycle between 2 and 250 K are presented in Fig. 8. In both cases, a change in the resistance of graphene is observed in the SCO/graphene device that does not appear in pristine CVD-graphene devices.36 Thus, upon cooling, a progressive increase in the resistance is observed in the range 50–160 K centered at ca. 100–120 K, in good agreement with XAS measurements. Upon heating, an apparent hysteretic behavior is observed. However, this behavior is not intrinsic to the material but due to the progressive loss of mass in the film under HV conditions, as can be seen by its overall thinning after the thermal cycling by ca. 25–30% (Fig. S6, ESI†). In fact, the cycling involves long measurement times (for example, a full cycle at 1 K min−1, recording data every 0.5 K requires ca. 10 h), in such a manner that, under HV conditions, a part of the film sublimes back. Nonetheless, these results account for the successful electrical detection of the spin crossover transition in these films, corroborating the XAS experiment.
Conclusions
Sublimable spin crossover molecules are still very scarce. Here we have prepared novel molecules of this kind by extending the family {Fe[H2B(pz)2]2(L)}, where L is a bidentate-α-diimine ligand. In the second step, we assess their suitability to be integrated as thin films into resistive devices. The three chosen bidentate α-diimine ligands, L = tzpy, btz and bt, have afforded the targeted complexes (1–3) plus two additional solvated forms (1·CH3CN, 3·CH2Cl2). All derivatives except 3·CH2Cl2 undergo thermal- and light-induced SCO behaviour with T1/2 values in the range 115–200 K.Sublimation of the two unsolvated SCO derivatives undergoing SCO properties, 1 and 2, and subsequent controlled condensation of the molecules on specific substrates have afforded the corresponding 200 nm thick thin films TF1 and TF2 whose SCO properties have been characterized through XAS studies. From these XAS results, different features are observed in the SCO behavior that contrast with the expected as compared to the respective bulk powders: (i) the incomplete character of the thermal spin transition; (ii) the total loss of cooperativity; and (iii) the shifting to lower temperatures. Several circumstances may converge in the origin of these features. First, the high sensitivity of the films to X-ray irradiation is observed even at high temperatures (>100 K). This effect could prevent a large fraction of the molecules from properly undergoing the thermal spin transition, as it has been previously observed in some bulk SCO materials and more recently for films of a SCO molecule, where the thermal spin transition was totally supressed.36,61 Thus, since both films TF1 and TF2 show the typical SOXIESST effect up to 80 K and having a rather strong shifting to lower temperatures of their thermal spin transition, it could be reasonable to consider this high sensitivity to X-ray irradiation as a possible cause. A second additional explanation may arise from the very small size of nanoparticles in the film, not distinguishable in the AFM images collected (Fig. 1b, c, e and f), and the presence of defects, pinning some of these molecules in the HS state regardless of the temperature.56–58,62 A partial decomposition of the pristine molecules on the surface to form tetrahedral (SCO inactive) [Fe(bpz)2] fragments could also be considered.27,58 However, since this fragmentation is only expected to occur at the (sub)monolayer level and would also affect substantially the shape of the XAS spectra at the Fe L2,3 edge, this can be discarded in our case.
Finally, we have integrated these films TF1 and TF2 onto CVD-graphene based horizontal hybrid devices and detected their thermal SCO transition through the changes observed in the electrical properties of the underlying 2D material.
Methods
Synthesis
The ligands tzpy, btz and bt were synthesized according to methods previously described.63,64 The potassium salt of the hydrobispyrazolylborate, K[H2B(pz)2], was purchased from commercial sources.Single crystals of 1·CH3CN were obtained by slow liquid diffusion (layering method) using test tubes containing a MeOH solution (3mL) of 1FeII/2[H2Bpz2]− at the bottom, a 1MeOH:1CH3CN mixture (10 mL) in the middle and a CH3CN solution (2 mL) of tzpy on top. Single crystals of 3·1/2CH2Cl2 were accidentally obtained trying to improve the yield of 3. The synthetic protocol was modified replacing MeOH with CH2Cl2 as a solvent and keeping the resulting mother liquor in an ice bath during its slow evaporation in an argon stream. The crystals of 1·CH3CN, 2, 3 and 3·1/2CH2Cl2 were analyzed using single crystal X-ray diffraction methods. The solvated compounds were also confirmed through thermogravimetric analysis.
![[thin space (1/6-em)]](https://www.rsc.org/images/entities/char_2009.gif) 000). The sublimation conditions consisted in: (a) 1 heated at 100 °C in a 5 × 10⁻⁷ mbar HV to reach a deposition rate of 0.4 Å s−1; and (b) 2 heated at 90 °C in a 5 × 10⁻⁶ mbar HV to reach a deposition rate of 0.4 Å s−1. These deposition rates were monitored by in situ sublimation through a calibrated quartz crystal microbalance (QCM), and the final thicknesses of the produced films (200 nm thick) were verified by profilometry (KLA Alpha-Step D-500 profilometer with a nanometric resolution).
000). The sublimation conditions consisted in: (a) 1 heated at 100 °C in a 5 × 10⁻⁷ mbar HV to reach a deposition rate of 0.4 Å s−1; and (b) 2 heated at 90 °C in a 5 × 10⁻⁶ mbar HV to reach a deposition rate of 0.4 Å s−1. These deposition rates were monitored by in situ sublimation through a calibrated quartz crystal microbalance (QCM), and the final thicknesses of the produced films (200 nm thick) were verified by profilometry (KLA Alpha-Step D-500 profilometer with a nanometric resolution).
Physical characterization
Elemental analyses (C, H, and N) were performed using a CE Instruments EA 1110 CHNS Elemental analyzer. Magnetic measurements were performed using a Quantum Design MPMS-XL-5 SQUID magnetometer in the 2 to 400 K temperature range with an applied magnetic field of 1 T. Experimental magnetic susceptibilities were corrected for diamagnetism of the constituent atoms by the use of Pascal's constants. Photomagnetic measurements were performed irradiating with a Diode Pumped Solid State Laser DPSS-532-20 from Chylas and coupled via an optical fiber to the cavity of the SQUID magnetometer. The optical power at the sample surface was adjusted to ∼3 mW cm−2, and it was verified that it resulted in no significant change in magnetic response due to heating of the sample. The samples consisted of a thin layer of the compound whose weight was corrected by comparison of a thermal spin crossover curve with that of a more accurately weighted sample of the same compound. Calorimetric measurements were performed using a differential scanning calorimeter Mettler Toledo DSC 821e. Low temperatures were obtained with an aluminium block attached to the sample holder, refrigerated with a flow of liquid nitrogen and stabilized at a temperature of 110 K. The sample holder was kept in a dry box under a flow of dry nitrogen gas to avoid water condensation. The measurements were carried out using around 10–15 mg of polycrystalline samples sealed in aluminium pans with a mechanical crimp. Temperature and heat flow calibrations were made using standard samples of indium using its melting transition (429.6 K, 28.45 J g−1). An overall accuracy of ±0.2 K in temperature and ±2% in the heat capacity is estimated. The uncertainty increases for the determination of the anomalous enthalpy and entropy due to the subtraction of an unknown baseline. Powder X-ray measurements were performed on a PANalytical Empyrean X-ray powder diffractometer (monochromatic CuKα radiation).Conflicts of interest
There are no conflicts to declare.Acknowledgements
This work was supported by: the European Union (ERC AdG Mol-2D 788222), the Spanish MCIN (2D-HETEROS PID2020-117152RB-I00, SPINCROSMAT PID2019-106147GB-I00 and SUPERSCO PID2020-117264GB-I00, co-financed by FEDER, and Excellence Unit “María de Maeztu”, CEX2019-000919-M) and the Generalitat Valenciana (Prometeo program, PROMETEO/2021/022, and PO FEDER Program, IDIFEDER/2018/061 and IDIFEDER/2020/063). This work forms part of the Advanced Materials program supported by MCIN with funding from European Union NextGenerationEU (PRTR-C17.I1) and by Generalitat Valenciana. M. G.-E. acknowledges the support of a fellowship FPU15/01474 from MIU. F. J. V.-M. acknowledges the support of the Generalitat Valenciana (APOSTD/2021/359). R. C. acknowledges the support of a fellowship from “la Caixa” Foundation (LCF/BQ/PR19/11700008) and the Generalitat Valenciana (SEJIGENT/2021/012T). All XAS experiments were performed at Boreas beamline at ALBA Synchrotron with J. H.-M. in both proposal and in-house experiments. The authors thank Alejandra Soriano Portillo and Ángel López Muñoz for their technical support.References
- E. König, Environmental Science and Technology, 1991, vol. 43, pp. 51–152 Search PubMed.
- P. Gütlich, A. Hauser and H. Spiering, Angew. Chem., Int. Ed. Engl., 1994, 33, 2024–2054 CrossRef.
- J. A. Real, A. B. Gaspar, V. Niel and M. C. Muñoz, Coord. Chem. Rev., 2003, 236, 121–141 CrossRef CAS.
- P. Gütlich and H. A. Goodwin, Spin Crossover in Transition Metal Compounds I, Springer Berlin Heidelberg, Berlin, Heidelberg, 2004, vol. 233 Search PubMed.
- P. Gütlich and H. A. Goodwin, Spin Crossover in Transition Metal Compounds II, Springer Berlin Heidelberg, Berlin, Heidelberg, 2004, vol. 234 Search PubMed.
- P. Gütlich and H. A. Goodwin, Spin Crossover in Transition Metal Compounds III, Springer Berlin Heidelberg, Berlin, Heidelberg, 2004, vol. 235 Search PubMed.
- J. A. Real, A. B. Gaspar and M. C. Muñoz, Dalton. Trans., 2005, 2062 RSC.
- A. Bousseksou, G. Molnár, L. Salmon and W. Nicolazzi, Chem. Soc. Rev., 2011, 40, 3313 RSC.
- W. Nicolazzi and A. Bousseksou, Comptes Rendus Chim., 2018, 21, 1060–1074 CrossRef CAS.
- G. Molnár, S. Rat, L. Salmon, W. Nicolazzi and A. Bousseksou, Adv. Mater., 2018, 30, 1703862 CrossRef PubMed.
- K. S. Kumar and M. Ruben, Angew. Chem., Int. Ed., 2021, 60, 7502–7521 CrossRef CAS PubMed.
- E. König and K. Madeja, Inorg. Chem., 1967, 6, 48–55 CrossRef.
- W. A. Baker and H. M. Bobonich, Inorg. Chem., 1964, 3, 1184–1188 CrossRef CAS.
- B. Gallois, J. A. Real, C. Hauw and J. Zarembowitch, Inorg. Chem., 1990, 29, 1152–1158 CrossRef CAS.
- J. A. Real, M. C. Muñoz, J. Faus and X. Solans, Inorg. Chem., 1997, 36, 3008–3013 CrossRef CAS PubMed.
- N. Moliner, L. Salmon, L. Capes, M. C. Muñoz, J.-F. Létard, A. Bousseksou, J.-P. Tuchagues, J. J. McGarvey, A. C. Dennis, M. Castro, R. Burriel and J. A. Real, J. Phys. Chem. B, 2002, 106, 4276–4283 CrossRef CAS.
- A. L. Thompson, A. E. Goeta, J. A. Real, A. Galet and M. Carmen Muñoz, Chem. Commun., 2004, 1390–1391 RSC.
- J. P. Jesson, J. F. Weiher and S. Trofimenko, J. Chem. Phys., 1968, 48, 2058–2066 CrossRef CAS.
- V. Davesne, M. Gruber, T. Miyamachi, V. Da Costa, S. Boukari, F. Scheurer, L. Joly, P. Ohresser, E. Otero, F. Choueikani, A. B. Gaspar, J. A. Real, W. Wulfhekel, M. Bowen and E. Beaurepaire, J. Chem. Phys., 2013, 139, 074708 CrossRef CAS PubMed.
- S. Shi, G. Schmerber, J. Arabski, J.-B. Beaufrand, D. J. Kim, S. Boukari, M. Bowen, N. T. Kemp, N. Viart, G. Rogez, E. Beaurepaire, H. Aubriet, J. Petersen, C. Becker and D. Ruch, Appl. Phys. Lett., 2009, 95, 043303 CrossRef.
- M. Gruber, T. Miyamachi, V. Davesne, M. Bowen, S. Boukari, W. Wulfhekel, M. Alouani and E. Beaurepaire, J. Chem. Phys., 2017, 146, 092312 CrossRef.
- T. G. Gopakumar, F. Matino, H. Naggert, A. Bannwarth, F. Tuczek and R. Berndt, Angew. Chem., Int. Ed., 2012, 51, 6262–6266 CrossRef CAS PubMed.
- E. Ludwig, H. Naggert, M. Kalläne, S. Rohlf, E. Kröger, A. Bannwarth, A. Quer, K. Rossnagel, L. Kipp and F. Tuczek, Angew. Chem., Int. Ed., 2014, 53, 3019–3023 CrossRef CAS PubMed.
- H. Naggert, J. Rudnik, L. Kipgen, M. Bernien, F. Nickel, L. M. Arruda, W. Kuch, C. Näther and F. Tuczek, J. Mater. Chem. C, 2015, 3, 7870–7877 RSC.
- C. Lefter, S. Rat, J. S. Costa, M. D. Manrique-Juárez, C. M. Quintero, L. Salmon, I. Séguy, T. Leichle, L. Nicu, P. Demont, A. Rotaru, G. Molnár and A. Bousseksou, Adv. Mater., 2016, 28, 7508–7514 CrossRef CAS PubMed.
- M. Bernien, H. Naggert, L. M. Arruda, L. Kipgen, F. Nickel, J. Miguel, C. F. Hermanns, A. Krüger, D. Krüger, E. Schierle, E. Weschke, F. Tuczek and W. Kuch, ACS Nano, 2015, 9, 8960–8966 CrossRef CAS PubMed.
- S. Ossinger, H. Naggert, L. Kipgen, T. Jasper-Toennies, A. Rai, J. Rudnik, F. Nickel, L. M. Arruda, M. Bernien, W. Kuch, R. Berndt and F. Tuczek, J. Phys. Chem. C, 2017, 121, 1210–1219 CrossRef CAS.
- A. Pronschinske, Y. Chen, G. F. Lewis, D. A. Shultz, A. Calzolari, M. Buongiorno Nardelli and D. B. Dougherty, Nano Lett., 2013, 13, 1429–1434 CrossRef CAS PubMed.
- A. Pronschinske, R. C. Bruce, G. Lewis, Y. Chen, A. Calzolari, M. Buongiorno-Nardelli, D. A. Shultz, W. You and D. B. Dougherty, Chem. Commun., 2013, 49, 10446–10452 RSC.
- X. Zhang, P. S. Costa, J. Hooper, D. P. Miller, A. T. N’Diaye, S. Beniwal, X. Jiang, Y. Yin, P. Rosa, L. Routaboul, M. Gonidec, L. Poggini, P. Braunstein, B. Doudin, X. Xu, A. Enders, E. Zurek and P. A. Dowben, Adv. Mater., 2017, 29, 1702257 CrossRef PubMed.
- L. Kipgen, M. Bernien, S. Ossinger, F. Nickel, A. J. Britton, L. M. Arruda, H. Naggert, C. Luo, C. Lotze, H. Ryll, F. Radu, E. Schierle, E. Weschke, F. Tuczek and W. Kuch, Nat. Commun., 2018, 9, 2984 CrossRef PubMed.
- K. S. Kumar, M. Studniarek, B. Heinrich, J. Arabski, G. Schmerber, M. Bowen, S. Boukari, E. Beaurepaire, J. Dreiser and M. Ruben, Adv. Mater., 2018, 30, 1705416 CrossRef PubMed.
- V. Davesne, M. Gruber, M. Studniarek, W. H. Doh, S. Zafeiratos, L. Joly, F. Sirotti, M. G. Silly, A. B. Gaspar, J. A. Real, G. Schmerber, M. Bowen, W. Weber, S. Boukari, V. Da Costa, J. Arabski, W. Wulfhekel and E. Beaurepaire, J. Chem. Phys., 2015, 142, 194702 CrossRef CAS PubMed.
- O. Iasco, M.-L. Boillot, A. Bellec, R. Guillot, E. Rivière, S. Mazerat, S. Nowak, D. Morineau, A. Brosseau, F. Miserque, V. Repain and T. Mallah, J. Mater. Chem. C, 2017, 5, 11067–11075 RSC.
- N. Konstantinov, A. Tauzin, U. N. Noumbé, D. Dragoe, B. Kundys, H. Majjad, A. Brosseau, M. Lenertz, A. Singh, S. Berciaud, M.-L. Boillot, B. Doudin, T. Mallah and J.-F. Dayen, J. Mater. Chem. C, 2021, 9, 2712–2720 RSC.
- M. Gavara-Edo, R. Córdoba, F. J. Valverde-Muñoz, J. Herrero-Martín, J. A. Real and E. Coronado, Adv. Mater., 2022, 34, 2202551 CrossRef CAS PubMed.
- K. Bairagi, O. Iasco, A. Bellec, A. Kartsev, D. Li, J. Lagoute, C. Chacon, Y. Girard, S. Rousset, F. Miserque, Y. J. Dappe, A. Smogunov, C. Barreteau, M. L. Boillot, T. Mallah and V. Repain, Nat. Commun., 2016, 7, 12212 CrossRef CAS PubMed.
- K. Bairagi, A. Bellec, C. Fourmental, O. Iasco, J. Lagoute, C. Chacon, Y. Girard, S. Rousset, F. Choueikani, E. Otero, P. Ohresser, P. Sainctavit, M.-L. Boillot, T. Mallah and V. Repain, J. Phys. Chem. C, 2018, 122, 727–731 CrossRef CAS.
- L. Zhang, Y. Tong, M. Kelai, A. Bellec, J. Lagoute, C. Chacon, Y. Girard, S. Rousset, M. Boillot, E. Rivière, T. Mallah, E. Otero, M. Arrio, P. Sainctavit and V. Repain, Angew. Chem., Int. Ed., 2020, 59, 13341–13346 CrossRef CAS PubMed.
- M. Kelai, B. Cahier, M. Atanasov, F. Neese, Y. Tong, L. Zhang, A. Bellec, O. Iasco, E. Rivière, R. Guillot, C. Chacon, Y. Girard, J. Lagoute, S. Rousset, V. Repain, E. Otero, M.-A. Arrio, P. Sainctavit, A.-L. Barra, M.-L. Boillot and T. Mallah, Inorg. Chem. Front., 2021, 8, 2395–2404 RSC.
- Y. Tong, M. Kelaï, K. Bairagi, V. Repain, J. Lagoute, Y. Girard, S. Rousset, M.-L. Boillot, T. Mallah, C. Enachescu and A. Bellec, J. Phys. Chem. Lett., 2021, 12, 11029–11034 CrossRef CAS PubMed.
- M. Kelai, V. Repain, A. Tauzin, W. Li, Y. Girard, J. Lagoute, S. Rousset, E. Otero, P. Sainctavit, M.-A. Arrio, M.-L. Boillot, T. Mallah, C. Enachescu and A. Bellec, J. Phys. Chem. Lett., 2021, 12, 6152–6158 CrossRef CAS PubMed.
- D. Li, Y. Tong, K. Bairagi, M. Kelai, Y. J. Dappe, J. Lagoute, Y. Girard, S. Rousset, V. Repain, C. Barreteau, M. Brandbyge, A. Smogunov and A. Bellec, J. Phys. Chem. Lett., 2022, 13, 7514–7520 CrossRef CAS PubMed.
- L. Salmon, G. Molnár, S. Cobo, P. Oulié, M. Etienne, T. Mahfoud, P. Demont, A. Eguchi, H. Watanabe, K. Tanaka and A. Bousseksou, New J. Chem., 2009, 33, 1283 RSC.
- T. Mahfoud, G. Molnár, S. Cobo, L. Salmon, C. Thibault, C. Vieu, P. Demont and A. Bousseksou, Appl. Phys. Lett., 2011, 99, 053307 CrossRef.
- S. Rat, K. Ridier, L. Vendier, G. Molnár, L. Salmon and A. Bousseksou, CrystEngComm, 2017, 19, 3271–3280 RSC.
- M. Bernien, D. Wiedemann, C. F. Hermanns, A. Krüger, D. Rolf, W. Kroener, P. Müller, A. Grohmann and W. Kuch, J. Phys. Chem. Lett., 2012, 3, 3431–3434 CrossRef CAS PubMed.
- M. Atzori, L. Poggini, L. Squillantini, B. Cortigiani, M. Gonidec, P. Bencok, R. Sessoli and M. Mannini, J. Mater. Chem. C, 2018, 6, 8885–8889 RSC.
- S. Rohlf, M. Gruber, B. M. Flöser, J. Grunwald, S. Jarausch, F. Diekmann, M. Kalläne, T. Jasper-Toennies, A. Buchholz, W. Plass, R. Berndt, F. Tuczek and K. Rossnagel, J. Phys. Chem. Lett., 2018, 9, 1491–1496 CrossRef CAS PubMed.
- C. Boix-Constant, V. García-López, E. Navarro-Moratalla, M. Clemente-León, J. L. Zafra, J. Casado, F. Guinea, S. Mañas-Valero and E. Coronado, Adv. Mater., 2022, 34, 2110027 CrossRef CAS PubMed.
- S. Decurtins, P. Gütlich, C. P. Köhler, H. Spiering and A. Hauser, Chem. Phys. Lett., 1984, 105, 1–4 CrossRef CAS.
- J.-F. Létard, P. Guionneau, L. Rabardel, J. A. K. Howard, A. E. Goeta, D. Chasseau and O. Kahn, Inorg. Chem., 1998, 37, 4432–4441 CrossRef PubMed.
- A. Hauser, Coord. Chem. Rev., 1991, 111, 275–290 CrossRef CAS.
- A. Hauser, A. Vef and P. Adler, J. Chem. Phys., 1991, 95, 8710–8717 CrossRef CAS.
- A. Hauser, C. Enachescu, M. L. Daku, A. Vargas and N. Amstutz, Coord. Chem. Rev., 2006, 250, 1642–1652 CrossRef CAS.
- H. Naggert, A. Bannwarth, S. Chemnitz, T. Von Hofe, E. Quandt and F. Tuczek, Dalton. Trans., 2011, 40, 6364–6366 RSC.
- T. Palamarciuc, J. C. Oberg, F. El Hallak, C. F. Hirjibehedin, M. Serri, S. Heutz, J. F. Létard and P. Rosa, J. Mater. Chem., 2012, 22, 9690–9695 RSC.
- T. G. Gopakumar, M. Bernien, H. Naggert, F. Matino, C. F. Hermanns, A. Bannwarth, S. Mühlenberend, A. Krüger, D. Krüger, F. Nickel, W. Walter, R. Berndt, W. Kuch and F. Tuczek, Chem. – Eur. J., 2013, 19, 15702–15709 CrossRef CAS PubMed.
- B. Warner, J. C. Oberg, T. G. Gill, F. El Hallak, C. F. Hirjibehedin, M. Serri, S. Heutz, M. A. Arrio, P. Sainctavit, M. Mannini, G. Poneti, R. Sessoli and P. Rosa, J. Phys. Chem. Lett., 2013, 4, 1546–1552 CrossRef CAS PubMed.
- G. Cressey, C. M. B. Henderson and G. van der Laan, Phys. Chem. Miner., 1993, 20, 111–119 CrossRef CAS.
- A. Y. Mohamed, M. Lee, K. Kitase, T. Kitazawa, J. Y. Kim and D. Y. Cho, Crystals, 2018, 8, 433 CrossRef.
- C. Bartual-Murgui, V. Rubio-Giménez, M. Meneses-Sánchez, F. J. Valverde-Muñoz, S. Tatay, C. Martí-Gastaldo, M. C. Muñoz and J. A. Real, ACS Appl. Mater. Interfaces, 2020, 12, 29461–29472 CAS.
- V. Niel, A. B. Gaspar, M. C. Muñoz, B. Abarca, R. Ballesteros and J. A. Real, Inorg. Chem., 2003, 42, 4782–4788 CrossRef CAS PubMed.
- D. A. Tomalia and J. N. Paige, J. Org. Chem., 1973, 38, 3949–3951 CrossRef CAS.
- G. M. Sheldrick, Acta Crystallogr., Sect. C: Struct, Chem, 2015, 71, 3–8 Search PubMed.
Footnotes |
| † Electronic supplementary information (ESI) available. CCDC 2209227 (3·1/2CH2Cl2, 120 K), 2209228 (2, 120 K), 2209229 (3, 120 K), 2209230 (2, 240 K), 2209231 (3·1/2CH2Cl2, 220 K), 2209232 (1·CH3CN, 110 K) and 2209233 (1·CH3CN, 250 K). For ESI and crystallographic data in CIF or other electronic format see DOI: https://doi.org/10.1039/d2tc04120k |
| ‡ These authors contributed equally to this work. |
| This journal is © The Royal Society of Chemistry 2023 |

