High-power piezoelectric behavior of acceptor-doped 〈001〉 and 〈111〉 textured piezoelectric ceramics†
Haoyang
Leng
 a,
Yongke
Yan
a,
Xiaotian
Li
a,
Sumanta Kumar
Karan
a,
Yongke
Yan
a,
Xiaotian
Li
a,
Sumanta Kumar
Karan
 a,
Mark
Fanton
b and
Shashank
Priya
*a
aDepartment of Materials Science and Engineering, and Materials Research Institute, The Pennsylvania State University, University Park, Pennsylvania 16802, USA. E-mail: sup103@psu.edu
bApplied Research Laboratory, The Pennsylvania State University, University Park, PA 16801, USA
First published on 29th November 2022
Abstract
Piezoelectric ceramics with high piezoelectric co-efficient, d33, and mechanical quality factor, Qm, are required in high-power applications. 〈001〉 and 〈111〉 textured Pb(In1/2Nb1/2)O3–Pb(Mg1/3Nb2/3)O3–PbTiO3 ceramics were fabricated using templated grain growth method and their high-power electromechanical properties were characterized. It is shown that 〈001〉 textured ceramics possess higher d33 compared to random and 〈111〉 textured counterparts, while the Qm is strongly enhanced in 〈111〉 textured ceramics due to less favored polarization rotation. MnO2 doping is shown to further improve the Qm values for both 〈001〉 and 〈111〉 textured ceramics because of the restricted polarization switching induced by the defect dipole. Doped 〈001〉 textured ceramics can exhibit the high d33 and moderate Qm (d33 = 725 pC N−1, Qm = 716) in comparison with 〈111〉 textured ceramics exhibiting low d33 and high Qm (d33 = 350 pC N−1, Qm = 1495). Owing to the combinatory soft and hard piezoelectric properties, the doped 〈001〉 textured ceramics exhibit 1.5× higher vibration velocity (∼0.90 m s−1) in comparison with commercial hard PZTs. Interestingly, a slightly higher vibration velocity (∼0.94 m s−1) can be obtained in doped 〈111〉 textured ceramics, which is mainly attributed to the high Qm and low elastic compliance s11. These results demonstrate the promise of textured piezoelectric ceramics for high-power applications.
1. Introduction
The lead-free piezoelectric materials have been extensively investigated due to their environmental safety benefits. However, compared to lead-based piezoelectric materials, the lead-free piezoelectric materials have inferior comprehensive properties, limiting their practical applications.1,2 Lead-based relaxor-PT materials, such as Pb(Mg1/3Nb2/3)O3–PbTiO3 (PMN–PT), are promising candidates for electromechanical devices including actuators, transducers, and sensors, due to their superior piezoelectric properties in comparison to conventional PZT ceramics.3–5 However, the low phase transition temperatures in PMN–PT, including Curie temperature Tc and rhombohedral to tetragonal phase transition temperature Tr–t, limit the temperature stability.6,7 The relaxor ternary system, Pb(In1/2Nb1/2)O3–Pb(Mg1/3Nb2/3)O3–PbTiO3 (PIN–PMN–PT), can exhibit higher phase transition temperatures while retaining comparable piezoelectric properties to that of PMN–PT.8–10For high-power transducer applications, piezoelectric ceramics need to possess high piezoelectric coefficient d and mechanical quality factor Qm in order to maximize vibration velocity (vrms ∝ Qm·d) and output power (P ∝ v2).11–13 Prior studies have shown that the piezoelectric constant d33 of PIN–PMN–PT can be significantly improved by texturing along 〈001〉 crystallographic direction using template grain growth (TGG) method. For example, the 〈001〉 textured PIN–PMN–PT ceramics can exhibit a high d33 of 927 pC N−1, which is ∼2× higher than that of non-textured (random) counterparts.9 The enhanced d33 of 〈001〉 textured ceramics can be explained by invoking the piezoelectric anisotropy similar to that shown for piezoelectric single crystals.14,15 However, the textured PIN–PMN–PT ceramics possess a low Qm (∼100), which restricts their applications in high-power transducer devices.16 Similar to MnO2 doped PIN–PMN–PT single crystal, acceptor doping can be an effective way to improve the Qm value of textured PIN–PMN–PT ceramics. In these cases, the acceptor ions substitute on the B-site of the perovskite structure, creating defect dipoles consisting of negatively charged center defect ions paired with positively charged oxygen vacancies.17–19 These defect dipoles pin the domain wall motion under applied electric field, leading to reduced mechanical loss and enhanced Qm in piezoelectric ceramics. Prior results show that 〈001〉 textured MnO2-doped 0.24PIN–0.42PMN–0.34PT piezoelectric ceramics can exhibit an excellent combination of d33 and Qm (d33 = 725 pC N−1, Qm = 716).20 However, the effect of MnO2 doping on Qm value in polycrystalline ceramics for different crystallographic orientations is not well understood. One of the reasons for this lack of understanding is the difficulty in synthesizing 〈111〉 textured PIN–PMN–PT ceramics as compared to 〈001〉 orientation. Here, we address this issue and provide synthesis pathway to consistently realize 〈111〉 oriented piezoelectric ceramics and use this success in synthesis to provide comprehensive comparative analysis of 〈001〉 and 〈111〉 oriented PIN–PMN–PT ceramics.
We have investigated the effect of 〈001〉 and 〈111〉 texturing on piezoelectric properties and mechanical quality factor of undoped and MnO2-doped 0.24PIN–0.42PMN–0.34PT ceramics to understand the orientation dependence. Two different types of templates, 〈001〉 and 〈111〉 BaTiO3 (BT) crystals were used to texture 0.24PIN–0.42PMN–0.34PT ceramics along 〈001〉 and 〈111〉 directions, respectively. The piezoelectric properties and mechanical quality factor of random, 〈001〉 oriented, and 〈111〉 oriented ceramics were measured and compared to understand the differences in their magnitudes as well as influence of MnO2 doping. High-power piezoelectric vibration characteristics were measured for both doped 〈001〉 and 〈111〉 textured ceramics to evaluate their promise for practical applications.
2. Experimental procedure
The compositions described by the formulation, 0.24Pb(In1/2Nb1/2)O3–0.42Pb(Mg1/3Nb2/3)O3–0.34PbTiO3 (0.24PIN–0.42PMN–0.34PT) and 2 mol% MnO2-doped 0.24PIN–0.42PMN–0.34PT, were synthesized using two-step columbite precursor method.17 The 〈001〉 and 〈111〉 BaTiO3 (BT) templates were prepared by topochemical microcrystal conversion (TMC) method.21,22 The ceramic slurry for tape-casting was prepared by ball-milling the 0.24PIN–0.42PMN–0.34PT or 2 mol% MnO2-doped 0.24PIN–0.42PMN–0.34PT matrix powders with polyvinyl butyral (PVB) binder, toluene solvent and 0.25 wt% CuO. In this ceramic slurry, 2 vol% 〈001〉 and 〈111〉 BT templates were mixed by magnetic stirring and the mixture was tape casted at a rate of 20 mm s−1 using a doctor blade with height of 0.25 mm. The dried green tapes were cut, stacked, and laminated at 85 °C under 20 MPa pressure for 15 min. The green samples were heated to 600 °C with a heating rate of 0.5 °C min−1 and fired for 1h to remove the organic binder, and then cold-isostatically pressed at 200 MPa for 1 min. The 0.24PIN–0.42PMN–0.34PT with 0 vol% BT (random), 0.24PIN–0.42PMN–0.34PT with 2 vol% 〈001〉 BT (〈001〉 textured), and 0.24PIN–0.42PMN–0.34PT with 2 vol% 〈111〉 BT (〈111〉 textured) samples were subsequently embedded in calcined 0.24PIN–0.42PMN–0.34PT powders with 1.5 wt% excess PbO and sintered at 1220 °C for 6 h in air. The 2 mol% MnO2-doped 0.24PIN–0.42PMN–0.34PT with 2 vol% 〈001〉 BT (doped-〈001〉 textured) and 2 mol% MnO2-doped 0.24PIN–0.42PMN–0.34PT with 2 vol% 〈111〉 BT (doped-〈111〉 textured) samples were embedded in calcined 2 mol% MnO2-doped 0.24PIN–0.42PMN–0.34PT powders with 1.5 wt% excess PbO and sintered at 1200 °C for 6 h in air. The sintered samples were polished to remove residual powders. The sintered densities were measured by Archimedes’ method, as listed in Table S1 (ESI†).The phases and microstructures were determined using X-ray diffraction (XRD, PANalytical Empyrean) and field-emission scanning electron microscopy (FESEM Apreo) in combination with electron backscatter diffraction (EBSD), respectively. The 〈001〉 and 〈111〉 texture degree F was evaluated by Lotgering factor method according to the X-ray diffraction patterns in the 2-theta range of 20–60°.23,24 The piezoelectric coefficient d33 was measured by using a quasi-static d33 meter (YE2730A, APC Products). The dielectric permittivity εr as a function of temperature was measured at 1 kHz by a multifrequency LCR meter (HP4284A). Ferroelectric P–E hysteresis loops and the piezoelectric unipolar strains were measured at 1 Hz using a Precision Premier II ferroelectric Tester (Radiant Technologies). The mechanical coupling coefficient k and mechanical quality factor Qm were determined by resonance and anti-resonance technique using impedance analyzer (Keysight E4990A). Piezoresponse force microscopy (PFM) mode in Bruker Icon II instrument was used to characterize the domain structure and microscopic piezoresponse. The high-power piezoelectric vibration characteristics of commercial hard PZT (APC 841) sample, and 〈001〉 and 〈111〉 textured ceramics were measured in the transverse 31 mode using a laser vibrometer (PSV-500 by Polytec).
3. Results and discussion
3.1. Fabrication of 〈001〉 and 〈111〉-textured ceramics
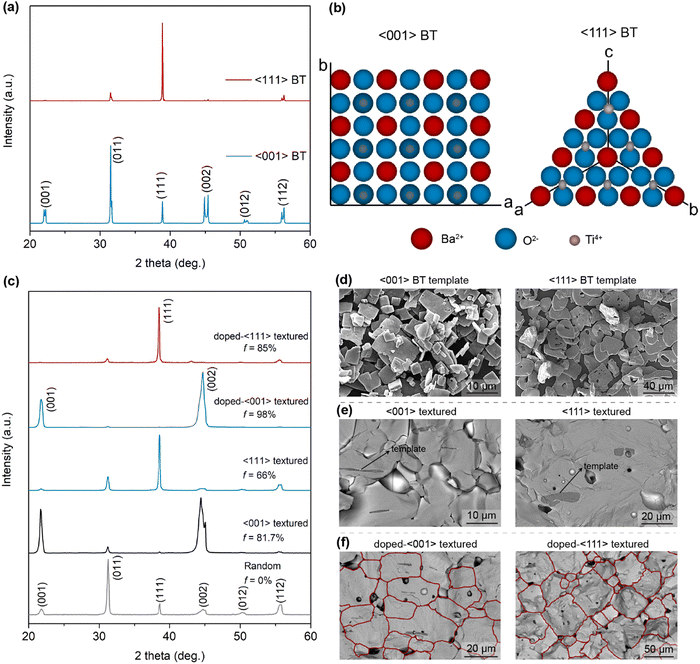
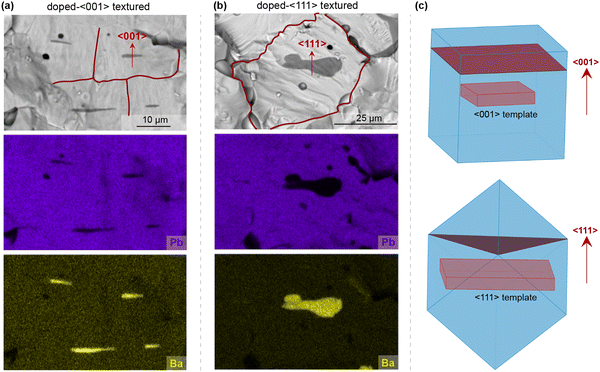
Fig. 1a shows X-ray diffraction (XRD) patterns for 〈001〉 and 〈111〉 oriented BT templates after the topochemical conversion reaction. It can be found that both 〈001〉 and 〈111〉 oriented BT templates exhibit tetragonal perovskite phase. The scanning electron microscopy (SEM) images of 〈001〉 and 〈111〉 BT templates are shown in Fig. 1d. Both 〈001〉 and 〈111〉 BT templates possess high-aspect ratio plate-like morphologies. The length and thickness of 〈001〉 BT templates are in the ranges of 5–10 μm and 0.2–1.2 μm, respectively, while the 〈111〉 BT templates have a larger size with 20–30 μm in length and 1.5–3 μm in thickness. Fig. 1b shows the schematic illustration of Ba2+ and O2− ions arrangement along 〈001〉 and 〈111〉 directions for BT templates, which demonstrates that 〈111〉 BT has higher atomic packing density compared to 〈001〉 BT. The XRD patterns of random and textured ceramics are shown in Fig. 1c. All samples exhibit perovskite phase, while the 〈001〉 and 〈111〉 textured ceramics exhibit enhanced intensities of (00l) and (111) diffraction peaks, respectively, in comparison with random counterpart, indicating the strong 〈001〉 or 〈111〉 orientation of grains. The calculated Lotgering factors F00l and F111 for 〈001〉 and 〈111〉 textured ceramics are 81.7% and 66%, respectively. After MnO2 doping, both doped 〈001〉 and 〈111〉 textured ceramics can exhibit much higher F00l of 98% and F111 of 85%, respectively, indicating that the MnO2 dopant can effectively promote the 〈001〉 or 〈111〉 texture development in PIN–PMN–PT ceramics. Fig. 1e and f show the cross-sectional SEM images for undoped and doped 〈001〉 and 〈111〉 textured ceramics, respectively. The epitaxial grain growth of PIN–PMN–PT matrix on 〈001〉 and 〈111〉 BT templates (black areas) can be observed in this figure. In addition, it can be found that the doped 〈001〉 and 〈111〉 textured ceramics can exhibit textured microstructures with dense grain structure. The enhanced grain growth induced by MnO2-doping has also been found in PZT–PZN piezoelectric ceramics, which is assumed to be caused by diffusion of oxygen vacancies.25 The oxygen vacancies induced by MnO2-doping can facilitate the lattice diffusion, leading to the enhanced grain growth.20,25 Considering the different sizes of 〈001〉 and 〈111〉 BT templates, it is worth noting that there is still space to further improve the 〈111〉 texturing degree of PIN–PMN–PT ceramics by optimizing the tape-casting parameters (e.g. blade gap height and tape-casting speed). This presents opportunities for future studies.Fig. 2 compares the grain growth behavior of 〈001〉 and 〈111〉 oriented PIN–PMN–PT matrix grains. The EDS maps indicate the excellent stability of 〈001〉 and 〈111〉 BT templates inside the PIN–PMN–PT matrix during the template grain growth process at high temperatures. It is interesting to note that 〈001〉 and 〈111〉 oriented grains exhibit different shapes. Specifically, the 〈001〉 oriented PIN–PMN–PT grains grown from the 〈001〉 BT template exhibit a rectangular cross-section, while the 〈111〉 oriented counterparts display a diamond shape cross-section (Fig. 2a and b). The different grain morphologies in doped-〈001〉 and 〈111〉 textured ceramics can also be observed in Fig. 1f. Fig. 2c shows the schematic diagrams describing the different grain growth behavior of 〈001〉 and 〈111〉 oriented grains. For the grains grown on the surface of 〈001〉 template, they will follow a layer-by-layer growth mode to form {001}-faced cuboids. This is due to the fact that the perovskite phase have the lowest energy along {001} surface and the 〈001〉 template has plate-like morphologies.21,26 Compared to the 〈001〉 oriented grains, the 〈111〉 oriented grains grown on the surface of 〈111〉 template will grow fastest along 〈111〉 direction due to the high surface energy of {111} planes, leading to the absence of {111} surfaces in the final shape and forming triangular bi-pyramids with low-energy density {001} surfaces.
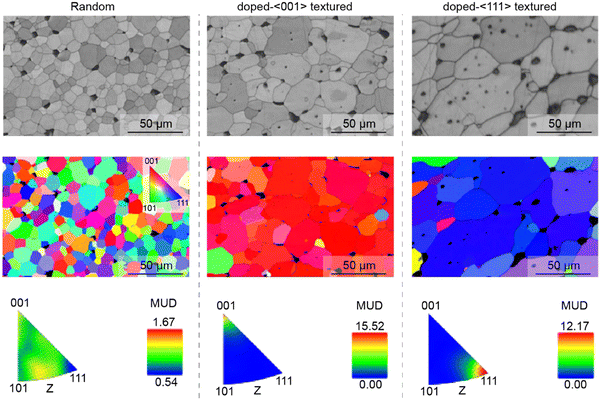
The SEM images of polished surface and the corresponding EBSD images for random and textured ceramics are shown in Fig. 3. The doped 〈111〉 textured ceramics possess much larger grain size compared to doped 〈001〉 textured ceramics. As shown in Fig. 1d, the 〈111〉 BT templates have much larger crystal size compared to 〈001〉 BT templates. Since the total BT template content inside the PIN–PMN–PT matrix is fixed for 〈001〉 and 〈111〉 textured ceramics, 〈111〉 textured ceramics will have lower number of the templates (fT) inside the PIN–PMN–PT matrix compared to 〈001〉 textured ceramics. As a result, 〈111〉 oriented grains have longer crystal growth length (xT) before impinging on surrounding textured grains, based on the relationship  ,27 leading to the larger grain sizes. The EBSD mapping further provides the evidence for strong 〈001〉 and 〈111〉 orientation of grains in textured ceramics.
3.2. Dielectric and piezoelectric properties of 〈001〉 and 〈111〉-textured ceramics
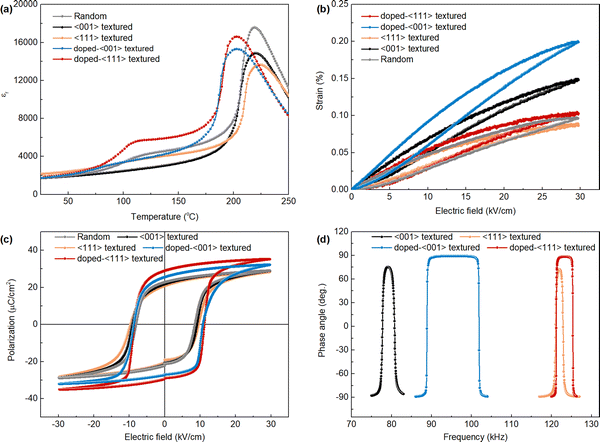
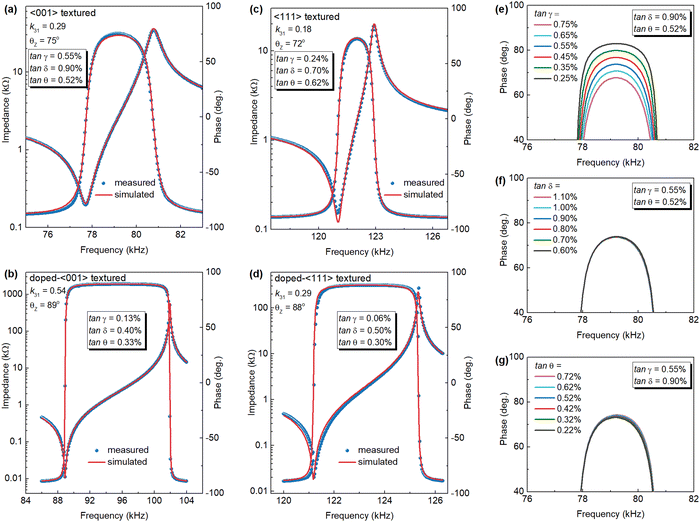
Fig. 4a shows the dielectric constant as a function of temperature for random, 〈001〉 textured, and 〈111〉 textured ceramics. First, two dielectric peaks at approximately 118 °C and 219 °C, corresponding to rhombohedral to tetragonal (Tr–t) and tetragonal to cubic (Tc) phase transitions can be found in random ceramic. Both 〈001〉 and 〈111〉 textured ceramics have Tc value around 219 °C, indicating that the presence of 2 vol% BT template has little influence on the transition temperature. After MnO2 doping, the Curie temperature Tc slightly decreases to 204 °C for doped 〈001〉 and 〈111〉 textured ceramics. Similar phenomenon induced by Mn doping has also been reported in PSZTN system.28Fig. 4b compares the unipolar strain response measured at the electric field of 30 kV cm−1 for random, 〈001〉 textured, and 〈111〉 textured ceramics. The strain values follow the trend, S〈001〉 > SRandom > S〈111〉 at 30 kV cm−1, which is consistent with the trend of measured small signal d33 values for random and textured ceramics in Table 1. From the P–E hysteresis loops shown in Fig. 4c, it is interesting to note that both MnO2-doped 〈001〉 and 〈111〉 textured ceramics possess higher remnant polarization (Pr) compared to undoped 〈001〉 and 〈111〉 counterparts. The lower Pr values of undoped 〈001〉 and 〈111〉 textured ceramics can be understood from the impedance spectra shown in Fig. 4d. It is known that the maximum impedance phase angle θZ in impedance spectra is related to the poling degree of piezoelectric ceramics.29,30 The undoped 〈001〉 and 〈111〉 textured ceramics exhibit lower θZ values of 75° and 72°, respectively, compared to doped 〈001〉 and 〈111〉 textured counterparts with high θZ values of 89° and 88°, respectively, indicating the low poling degree of undoped textured ceramics. The low poling degree implies insufficient polarization switching under electric field, resulting in low Pr value of piezoelectric ceramics. In addition to the different polarization values, the apparent horizontal shift in the P–E hysteresis loops of MnO2-doped textured ceramics can be observed in comparison with undoped textured counterparts (Fig. 4c), suggesting the existence of internal bias field Ei induced by the well oriented defect dipoles. The Ei value can be calculated by the equation Ei = (Ec+ + Ec−)/2, where Ec+ and Ec− are the intersections of P–E hysteresis loops with the positive and negative E field axis, respectively.31 The Ei value is calculated to be 1.10 kV cm−1 and 1.31 kV cm−1 for doped 〈001〉 and 〈111〉 textured ceramics, respectively.| Specimen | Template | F 00l [%] | ε 33 T/εo | s 11 [μm2 N−1] | tan![[thin space (1/6-em)]](https://www.rsc.org/images/entities/char_2009.gif) δ [%] δ [%] |
d 33 [pC N−1] | d 31 [pC N−1] | k 31 | Q m |
|---|---|---|---|---|---|---|---|---|---|
| a Ref. 20. | |||||||||
| Randoma | 0 | 0 | 1836 | 12.39 | 0.96 | 304 | 101 | 0.22 | 147 |
| 〈001〉 textured | 2 vol% 〈001〉 BT | 81.7 | 1727 | 14.44 | 0.9 | 412 | 138 | 0.29 | 165 |
| 〈111〉 textured | 2 vol% 〈111〉 BT | 66 | 2097 | 11.20 | 0.7 | 274 | 82 | 0.18 | 385 |
| Doped-〈001〉 textureda | 2 vol% 〈001〉 BT | 98 | 1498 | 15.90 | 0.42 | 725 | 247 | 0.54 | 716 |
| Doped-〈111〉 textured | 2 vol% 〈111〉 BT | 85 | 1850 | 9.90 | 0.5 | 350 | 116 | 0.29 | 1495 |
| Commercial APC 841 | 0 | 0 | 1152 | 11.24 | 0.5 | 312 | 108 | 0.33 | 1050 |
The detailed dielectric and piezoelectric properties of random, 〈001〉 textured, and 〈111〉 textured ceramics can be found in Table 1. The piezoelectric coefficient d33 of 〈001〉 textured ceramics is higher than that of random ceramics, while the 〈111〉 textured ceramics show the lowest d33 value.
For perovskite ferroelectrics, the piezoelectric coefficient d33 is proportional to Q33PSε33.32–34 The electrostrictive coefficient Q33 of perovskite ferroelectrics exhibits orientation dependent behavior. The maximum Q33 is along the 〈001〉 direction, while the minimum value is along the 〈111〉 direction.34 In addition, the anisotropy of Q33 is not sensitive to the ferroelectric phases. As a result, the 〈001〉 textured ceramics will exhibit the highest d33 value compared to random and 〈111〉 textured ceramics. Although the highest d33 value can be obtained in 〈001〉 textured ceramics, the percentage enhancement in d33 coming from the 〈001〉 texturing is less than 40% (from 304 pC N−1 in random ceramics to 412 pC N−1 in 〈001〉 textured ceramics) due to the incomplete template grain growth of 〈001〉 textured ceramics (F00l ∼ 81.7%).
As shown in Table 1, the 〈111〉 textured ceramics possess much higher mechanical quality factor Qm of 385 in comparison with 〈001〉 textured ceramics exhibiting Qm value of 165, indicating the orientation dependence of Qm in PIN–PMN–PT ceramics. This is different from the softening and hardening effects induced by dopants in piezoelectric ceramics. It is known that the polarization rotation under external electric field will result in high magnitude of mechanical loss (tan![[thin space (1/6-em)]](https://www.rsc.org/images/entities/char_2009.gif) γ) in ferroelectrics.35,36 When an electric field is applied to poled piezoelectric sample with multi-domain configuration, the torque per unit volume for the polarization rotation can be expressed as:37
γ) in ferroelectrics.35,36 When an electric field is applied to poled piezoelectric sample with multi-domain configuration, the torque per unit volume for the polarization rotation can be expressed as:37
 | (1) |
After MnO2 doping, the d33 of 〈001〉 textured ceramics exhibit significant improvement from 412 pC N−1 to 725 pC N−1, which is due to the improved 〈001〉 texturing degree (F00l value from 81.7% to 98%) and poling degree (θZ value from 75° to 89°) induced by MnO2 doping effect. The 〈111〉 textured ceramics also exhibit similar trend, where the d33 value increases from 274 pC N−1 to 350 pC N−1 due to the improved poling degree (θZ value from 72° to 88°). The low poling degree of piezoelectric ceramics is usually caused by different losses, including mechanical loss tan![[thin space (1/6-em)]](https://www.rsc.org/images/entities/char_2009.gif) γ, dielectric loss tan δ, and piezoelectric loss tan
γ, dielectric loss tan δ, and piezoelectric loss tan![[thin space (1/6-em)]](https://www.rsc.org/images/entities/char_2009.gif) θ.37–39 These three losses can be obtained by simulating the impedance spectra using the loss incorporated equivalent circuit.39,40 As shown in Fig. 5a–d, the simulation results demonstrate that both 〈001〉 and 〈111〉 textured ceramics possess much higher loss in comparison with doped 〈001〉 and 〈111〉 textured counterparts. The simulation results in Fig. 5e–g and Fig. S2 (ESI†) show the effect of different magnitudes and different types of loss on phase angle θZ of 〈001〉 and 〈111〉 textured ceramics, respectively. It was found that both dielectric loss tan
θ.37–39 These three losses can be obtained by simulating the impedance spectra using the loss incorporated equivalent circuit.39,40 As shown in Fig. 5a–d, the simulation results demonstrate that both 〈001〉 and 〈111〉 textured ceramics possess much higher loss in comparison with doped 〈001〉 and 〈111〉 textured counterparts. The simulation results in Fig. 5e–g and Fig. S2 (ESI†) show the effect of different magnitudes and different types of loss on phase angle θZ of 〈001〉 and 〈111〉 textured ceramics, respectively. It was found that both dielectric loss tan![[thin space (1/6-em)]](https://www.rsc.org/images/entities/char_2009.gif) δ, and piezoelectric loss tan
δ, and piezoelectric loss tan![[thin space (1/6-em)]](https://www.rsc.org/images/entities/char_2009.gif) θ have minimal effect on phase angle θZ, while mechanical loss tan
θ have minimal effect on phase angle θZ, while mechanical loss tan![[thin space (1/6-em)]](https://www.rsc.org/images/entities/char_2009.gif) γ = 1/Qm shows the significant effect on θZ in both 〈001〉 and 〈111〉 textured ceramics. A lower mechanical loss tan
γ = 1/Qm shows the significant effect on θZ in both 〈001〉 and 〈111〉 textured ceramics. A lower mechanical loss tan![[thin space (1/6-em)]](https://www.rsc.org/images/entities/char_2009.gif) γ (high Qm) will lead to higher phase angle θZ, which is consistent with our experimental results where doped textured ceramics show higher θZ value than undoped counterparts due to the reduced mechanical loss tan
γ (high Qm) will lead to higher phase angle θZ, which is consistent with our experimental results where doped textured ceramics show higher θZ value than undoped counterparts due to the reduced mechanical loss tan![[thin space (1/6-em)]](https://www.rsc.org/images/entities/char_2009.gif) γ (high Qm). The doped 〈001〉 textured ceramics still exhibits much higher piezoelectric response d33 in comparison with doped 〈111〉 textured counterparts due to the orientation dependent behavior of d33 as discussed before.
γ (high Qm). The doped 〈001〉 textured ceramics still exhibits much higher piezoelectric response d33 in comparison with doped 〈111〉 textured counterparts due to the orientation dependent behavior of d33 as discussed before.
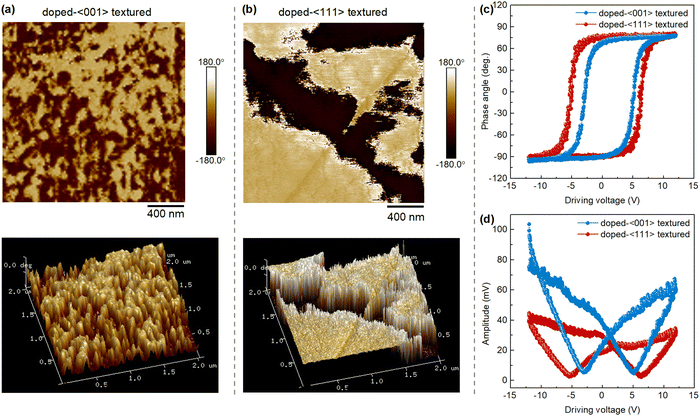
In addition to the intrinsic contribution from the piezoelectric anisotropy, it is known that the domain size and morphology can strongly affect the piezoelectric properties.41–43 Thus, piezoresponse force microscopy (PFM) was applied to observe the domain structures for both doped 〈001〉 and 〈111〉 textured ceramics. As shown in Fig. 6a and b, both doped 〈001〉 and 〈111〉 textured ceramics have an island-type domain structure, while the doped 〈001〉 textured ceramic exhibits a smaller and homogeneous domain than that of doped 〈111〉 textured counterpart. The domain size D is proportional to the domain wall energy γ based on the relationship D ∝  .44 The smaller domains with reduced domain wall energy in doped 〈001〉 textured ceramic can facilitate the domain wall motion and domain switching under the external electric field, leading to the enhanced extrinsic piezoelectric contributions. Thus, the domain size may be a factor responsible for the high piezoelectric response of doped 〈001〉 textured ceramic. Previous domain size studies on Pb(Zr,Ti)O3 and BaTiO3 systems find that the domain size increases with increasing grain size.45 We also observe the similar grain-domain size relation in textured ceramics where doped 〈111〉 textured ceramics with larger grain size can exhibit larger domain size in comparison with doped 〈001〉 textured counterparts. In addition, it has been reported that the strain induced by the template-matrix interface in textured ceramics constrains the domain size, leading to the fine domain structure.24,46 Based on SEM results, the 〈111〉 BT templates have lower frequency inside the PIN–PMN–PT matrix than 〈001〉 BT templates. Thus, the strain effect on domain structure induced by the template-matrix interface is smaller in doped 〈111〉 textured ceramics compared to doped 〈001〉 textured ceramics.
To further understand the effect of crystallographic orientation on microscopic piezoresponse, both phase-voltage hysteresis loops and amplitude-voltage butterfly curves were measured at local positions in 〈001〉 and 〈111〉 textured grains by applying a sequence of DC voltage from −12 V to 12 V with a superimposed AC signal of 5V to the PFM tip (Fig. 6c and d). The phase hysteresis loops exhibit nearly 180° phase reversal, indicating the sufficient polarization switching of doped 〈001〉 and 〈111〉 textured ceramics. However, the average amplitude of piezoresponse in doped 〈001〉 textured ceramic is much higher than that of doped 〈111〉 textured ceramic (Fig. 6d), which is consistent with the trend of measured macroscopic piezoresponse for doped 〈001〉 and 〈111〉 textured ceramics.
3.3. Crystallographic orientation dependence of high-power properties
The mechanical quality factor for doped textured ceramics also exhibits anisotropic behavior, where the 〈111〉 textured ceramics possess much higher Qm value of 1495 in comparison with doped 〈001〉 textured ceramics exhibiting Qm value of 716 (Table 1). As shown in Table 1, the enhancement of Qm after MnO2 doping can be found in both 〈001〉 and 〈111〉 textured ceramics. For MnO2-doped piezoelectric ceramics, acceptor ions like Mn2+ or Mn3+ will substitute on B-site of perovskite structure, replacing higher valent Ti4+ and Nb5+ due to the similar ionic radius, resulting in the formation of defect dipoles consisting of negatively charged acceptor ions and positively charged oxygen vacancies, .28,35 The formation of defect dipoles in MnO2-doped textured ceramics can restrain the oxygen vacancy
  migration (higher activation energy Ea of the conduction) and decrease in the electrical conductivity, as shown in Fig. 7, leading to the lower dielectric loss tan δ in doped 〈001〉 and 〈111〉 textured ceramics (Table 1).
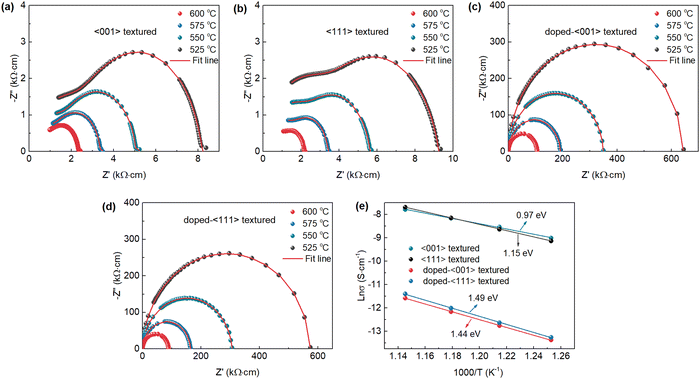 | ||
| Fig. 7 (a)–(d) Temperature dependent complex impedance spectra and (e) corresponding Arrhenius plots of ionic conductivities for 〈001〉 and 〈111〉 textured, and doped 〈001〉 and 〈111〉 textured ceramics. | ||
On the other hand, the  defect dipoles will induce defect polarization PD, which can be represented by:
 | (2) |
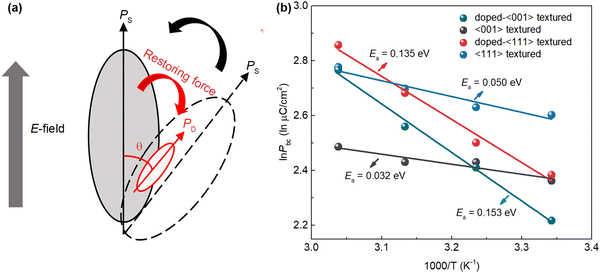
 and V is the lattice volume. The defect polarization PD will prefer to align in the same direction of spontaneous polarization PS based on the symmetry conforming short-range ordering (SC-SRO).47,48 When an external electric field E is applied to the sample, the spontaneous polarization PS prefers to switch to the same direction of E, while the defect dipole induced polarization PD will remain along its original direction since the PD switching requires
  diffusion, and the polarization switching under electric field is diffusion-less process.17 The PD will then generate a restoring force to constrain the PS switching under electric field, as shown in Fig. 8a. To further confirm the constrained PS switching in MnO2-doped textured ceramics, the activation energy Ea for polarization switching for both undoped and MnO2-doped textured ceramics is calculated and compared. For piezoelectric ceramics, the back-switching polarization Pbc will increase with temperature following the Arrhenius Law:35,49,50
 | (3) |
In addition to the hardening effects induced by MnO2 dopant, the different engineered domain configurations can also play an important role in affecting Qm value. The poled 〈111〉 oriented sample exhibits monodomain configuration (1R), thus, the low mechanical loss and high Qm can be expected. For poled 〈001〉 oriented sample, it exhibits four equivalent engineered domains (4R), leading to the enhanced polarization rotation and higher mechanical loss (lower Qm). Thus, the doped 〈111〉 textured ceramics will possess much higher Qm value in comparison with doped 〈001〉 textured ceramics (Fig. 9a). As shown in Fig. 9b, the doped 〈001〉 textured ceramics exhibit the high d33 and moderate Qm value in comparison with 〈111〉 textured ceramics exhibiting low d33 and high Qm. Since the 〈110〉 oriented sample exhibits the two equivalent engineered domains (2R), lying between 〈001〉 and 〈111〉 oriented samples (4R and 1R, respectively), it is expected that the doped 〈110〉 textured ceramics can exhibit good combination of d33 and Qm.
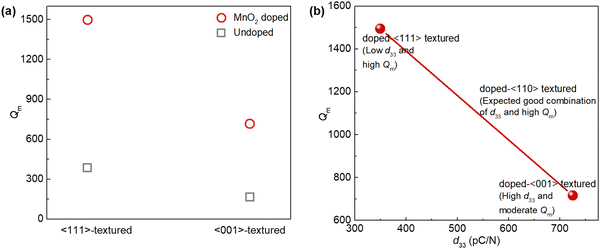 | ||
| Fig. 9 (a) Qm values of undoped and doped 〈001〉 and 〈111〉 textured ceramics. (b) Qmvs. d33 for doped 〈001〉 and 〈111〉 textured ceramics. | ||
3.4. Enhanced high-power vibration characteristics in 〈001〉 and 〈111〉-textured ceramics
To demonstrate the effectiveness of doped 〈001〉 and 〈111〉 textured ceramics in high-power applications, we measured the high-power piezoelectric vibration characteristics for both doped 〈001〉 and 〈111〉 textured ceramics under the transverse length (31) mode using a laser vibrometer, as shown in Fig. 10a. These vibration characteristics were then compared with that of the commercial hard PZT ceramic (APC 841). Fig. 10c and d show the vibration velocity as a function of the measured frequencies under the constant driving voltage of 5 Vp–p, 10 Vp–p and 20 VP–P for doped 〈001〉 and 〈111〉 textured ceramics and APC 841 sample, respectively. The peak values of the measured vibration velocity at 5 Vp–p, 10 Vp–p and 20 VP–P for these samples were compared in Fig. 10b. Under the same driving voltage, the maximum vibration velocity vmax of both 〈001〉 and 〈111〉 textured ceramics is much higher than that of the APC 841 sample. Specifically, the doped 〈001〉 textured ceramic can exhibit around 1.5× higher vmax (∼0.90 m s−1) in comparison with commercial hard PZT samples (∼0.62 m s−1) at 20 VP–P. The enhanced vibration velocity in doped 〈001〉 textured ceramic can be understood in terms of its combinatory soft and hard piezoelectric properties, as shown in Table 1. Interestingly, a slightly higher vmax (∼0.94 m s−1) can be obtained in doped 〈111〉 textured ceramic. Compared to both doped 〈001〉 ceramic and APC 841 sample, the higher vibration velocity in doped 〈111〉 textured ceramic should be attributed to its high Qm and low elastic compliance s11 (Table 1) since the vibration velocity of piezoelectric ceramics is proportional to the figure of merit .13 It is known that the output power of high-power device is proportional to v2. Thus, both doped 〈001〉 and 〈111〉 textured ceramics will show over 2× higher output power in comparison with APC 841 sample. The experimental results here clearly demonstrate the promise of doped 〈001〉 and 〈111〉 textured piezoelectric ceramics for replacing conventional random ceramics in high-power applications.
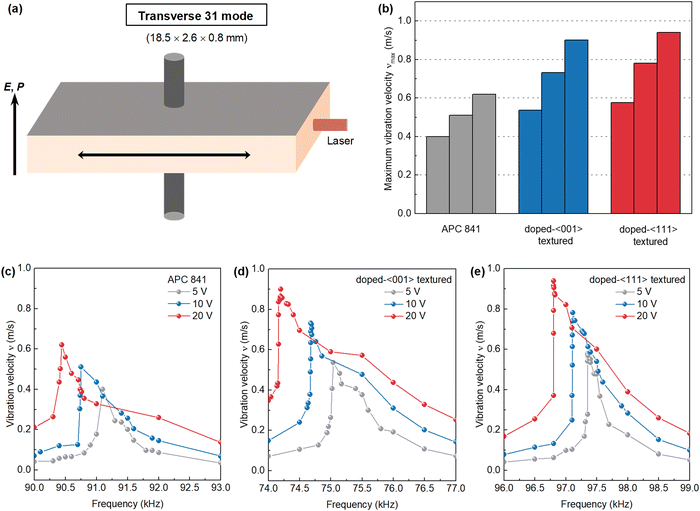 | ||
| Fig. 10 (a) Schematics of the measured piezoelectric sample geometries (k31 mode), where electric field E, polarization P, and vibrometer laser beam directions are indicated by arrows. (b) Comparison of maximum vibration velocities at 5 Vp–p, 10 Vp–p and 20 VP–P for APC 841, doped 〈001〉 and 〈111〉 textured ceramics. (c–e) Vibration velocity as a function of the measured frequency under the constant driving voltage of 5 Vp–p, 10 Vp–p and 20 VP–P for APC 841, doped 〈001〉 and 〈111〉 textured ceramics, respectively (the measured vibration velocities of APC 841 are from ref. 18). | ||
4. Conclusion
In summary, both 〈001〉 and 〈111〉 textured PIN–PMN–PT ceramics were successfully fabricated though TGG method to investigate the effects of the crystallographic orientation on high-power properties of PIN–PMN–PT ceramics. Interestingly, we found that both piezoelectric properties and mechanical quality factor exhibit crystallographic orientation dependent behavior in PIN–PMN–PT ceramics. The 〈001〉 textured PIN–PMN–PT ceramics possess higher piezoelectric constant d33 and coupling factors k31 in comparison with both random and 〈111〉 textured counterparts, while the mechanical quality factor Qm was enhanced in 〈111〉 textured ceramics due to the less favored polarization rotation in 〈111〉 oriented sample with monodomain configuration (1R). The d33 of 〈001〉 textured ceramics can be further improved from 412 pC N−1 to 725 pC N−1 because of the improved 〈001〉 texturing degree and poling degree induced by MnO2 doping. In addition, the Qm values for 〈001〉 and 〈111〉 textured ceramics were significantly improved by MnO2 doping effect. The doped 〈001〉 textured ceramics exhibit high d33 and moderate Qm (d33 = 725 pC N−1, Qm = 716) in comparison with 〈111〉 textured ceramics exhibiting low d33 and high Qm (d33 = 350 pC N−1, Qm = 1495). Compared to commercial hard PZT samples, the doped 〈001〉 textured ceramics exhibit around 1.5× higher vibration velocity (∼ 0.90 m s−1), which is mainly attributed to its high soft and hard piezoelectric properties. In addition, owing to the high Qm and low elastic compliance s11, the doped 〈111〉 textured ceramics possess higher vibration velocity (∼ 0.94 m s−1). Our experimental results demonstrate the promise of textured piezoelectric ceramics to replace conventional random ceramics in high-power applications.Conflicts of interest
There are no conflicts to declare.Acknowledgements
Y. Y. and H. L. acknowledge the financial support from DARPA through award number HR00111920001. X. L. acknowledges the support through National Science Foundation through the award number DMR-1936432. S. K. K. acknowledges the support through National Science Foundation through the award number 1904811. S. P. acknowledges the support through USDA NIFA through grant number 2019-67021-28991.References
- Y. Chang, S. F. Poterala, Z. Yang, S. Trolier-McKinstry and G. L. Messinge, J. Mater. Res., 2010, 25, 687–694 CrossRef CAS.
- L. Chen, H. Liu, H. Qi and J. Chen, Prog. Mater. Sci., 2022, 127, 100944 CrossRef CAS.
- F. Li, S. Zhang, Z. Xu, X. Wei and T. R. Shrout, Adv. Funct. Mater., 2011, 2118–2128 CrossRef CAS PubMed.
- S. Zhang, F. Li, X. Jiang, J. Kim, J. Luo and X. Geng, Prog. Mater. Sci., 2015, 68, 1–66 CrossRef CAS PubMed.
- F. Li, S. Zhang, T. Yang, Z. Xu, N. Zhang, G. Liu, J. Wang, J. Wang, Z. Cheng, Z. G. Ye, J. Luo, T. R. Shrout and L. Q. Chen, Nat. Commun., 2016, 7, 1–9 CrossRef.
- X. Li, Z. Wang, C. He, X. Long and Z. G. Ye, J. Appl. Phys., 2012, 111, 034105 CrossRef.
- S. Zhang, F. Li, N. P. Sherlock, J. Luo, H. Jae Lee, R. Xia, R. J. Meyer, W. Hackenberger and T. R. Shrout, J. Cryst. Growth, 2011, 318, 846–850 CrossRef CAS PubMed.
- X. Liu, S. Zhang, J. Luo, T. R. Shrout and W. Cao, Appl. Phys. Lett., 2010, 96, 2008–2011 Search PubMed.
- Y. Chang, B. Watson, M. Fanton, R. J. Meyer and G. L. Messing, Appl. Phys. Lett., 2017, 111, 232901 CrossRef.
- F. H. Schader, G. A. Rossetti, J. Luo and K. G. Webber, Acta Mater., 2017, 126, 174–181 CrossRef CAS.
- M. Slabki, J. Wu, M. Weber, P. Breckner, D. Isaia, K. Nakamura and J. Koruza, J. Am. Ceram. Soc., 2019, 102, 6008–6017 CrossRef CAS.
- K. Uchino, Adv. Piezoelectr. Mater., 2010, 1–678 CAS.
- H. Nagata and T. Takenaka, Electron. Commun. Jpn., 2013, 96, 53–58 CrossRef.
- Y. Yan, K. H. Cho, D. Maurya, A. Kumar, S. Kalinin, A. Khachaturyan and S. Priya, Appl. Phys. Lett., 2013, 102, 0–5 Search PubMed.
- S. Yang, J. Li, Y. Liu, M. Wang, L. Qiao, X. Gao, Y. Chang, H. Du, Z. Xu, S. Zhang and F. Li, Nat. Commun., 2021, 12, 1–10 CrossRef PubMed.
- D. D. Wei, Q. Bin Yuan, G. Q. Zhang and H. Wang, J. Mater. Res., 2015, 30, 2144–2150 CrossRef CAS.
- H. Leng, Y. Yan, H. Liu, M. Fanton, R. J. Meyer and S. Priya, Acta Mater., 2021, 206, 116610 CrossRef CAS.
- B. H. Watson, M. J. Brova, M. A. Fanton, R. J. Meyer and G. L. Messing, J. Am. Ceram. Soc., 2020, 103, 6319–6329 CrossRef CAS.
- E. Sun, R. Zhang, F. Wu, B. Yang and W. Cao, J. Appl. Phys., 2013, 113, 0–4 CAS.
- H. Leng, Y. Yan, B. Wang, T. Yang, H. Liu, X. Li, R. Sriramdas, K. Wang, M. Fanton, R. J. Meyer, L.-Q. Chen and S. Priya, Acta Mater., 2022, 234, 118015 CrossRef CAS.
- Y. Yan, L. Yang, Y. Zhou, K. H. Cho, J. S. Heo and S. Priya, J. Appl. Phys., 2015, 118, 104101 CrossRef.
- S. Su, R. Zuo, D. Lv and J. Fu, Powder Technol., 2012, 217, 11–15 CrossRef CAS.
- F. K. Lotgering, J. Inorg. Nucl. Chem., 1960, 16, 100–108 CrossRef CAS.
- Y. Chang, J. Wu, Z. Liu, E. Sun, L. Liu, Q. Kou, F. Li, B. Yang and W. Cao, ACS Appl. Mater. Interfaces, 2020, 12, 38415–38424 CrossRef CAS PubMed.
- H. Y. Park, C. H. Nam, I. T. Seo, J. H. Choi, S. Nahm, H. G. Lee, K. J. Kim and S. M. Jeong, J. Am. Ceram. Soc., 2010, 93, 2537–2540 CrossRef CAS.
- J. Padilla and D. Vanderbilt, Phys. Rev. B: Condens. Matter Mater. Phys., 1997, 56, 1625–1631 CrossRef CAS.
- G. L. Messing, S. Trolier-McKinstry, E. M. Sabolsky, C. Duran, S. Kwon, B. Brahmaroutu, P. Park, H. Yilmaz, P. W. Rehrig, K. B. Eitel, E. Suvaci, M. Seabaugh and K. S. Oh, Templated grain growth of textured piezoelectric ceramics, Crit. Rev. Solid State Mater. Sci., 2004, 29, 45–96 CrossRef CAS.
- Z. Li, H. C. Thong, Y. F. Zhang, Z. Xu, Z. Zhou, Y. X. Liu, Y. Y. S. Cheng, S. H. Wang, C. Zhao, F. Chen, K. Bi, B. Han and K. Wang, Adv. Funct. Mater., 2021, 31, 2005012 CrossRef CAS.
- Q. Li, M. H. Zhang, Z. X. Zhu, K. Wang, J. S. Zhou, F. Z. Yao and J. F. Li, J. Mater. Chem. C, 2017, 5, 549–556 RSC.
- F. Z. Yao, K. Wang, W. Jo, J. S. Lee and J. F. Li, J. Appl. Phys., 2014, 116, 114102 CrossRef.
- M. Cheng, Z. Fang, F. Li, Y. Zhang, Y. Qin, X. Wang, K. Zhang and X. Tian, Ceram. Int., 2020, 46, 13324–13330 CrossRef CAS.
- F. Li, L. Jin and R. Guo, Appl. Phys. Lett., 2014, 105, 0–4 Search PubMed.
- F. Li, D. Lin, Z. Chen, Z. Cheng, J. Wang, C. Li, Z. Xu, Q. Huang, X. Liao, L. Q. Chen, T. R. Shrout and S. Zhang, Nat. Mater., 2018, 17, 349–354 CrossRef CAS PubMed.
- F. Li, L. Jin, Z. Xu and S. Zhang, Appl. Phys. Rev., 2014, 1, 011103 Search PubMed.
- L. Zheng, L. Yang, Y. Li, X. Lu, D. Huo, W. Lü, R. Zhang, B. Yang and W. Cao, Phys. Rev. Appl., 2018, 9, 64028 CrossRef CAS.
- N. Luo, S. Zhang, Q. Li, Q. Yan, Y. Zhang, T. Ansell, J. Luo and T. R. Shrout, J. Mater. Chem. C, 2016, 4, 4568–4576 RSC.
- G. Liu, S. Zhang, W. Jiang and W. Cao, Mater. Sci. Eng., R, 2015, 89, 1–48 CrossRef PubMed.
- K. Uchino, J. H. Zheng, Y. H. Chen, X. H. Du, J. Ryu, Y. Gao, S. Ural, S. Priya and S. Hirose, J. Mater. Sci., 2006, 41, 217–228 CrossRef CAS.
- Y. Yan, L. D. Geng, L. F. Zhu, H. Leng, X. Li, H. Liu, D. Lin, K. Wang, Y. U. Wang and S. Priya, Adv. Sci., 2022, 2105715, 1–10 Search PubMed.
- A. M. González, Á. García, C. Benavente-Peces and L. Pardo, Materials, 2016, 9, 72 CrossRef PubMed.
- J. Fu, R. Zuo and Z. Xu, Appl. Phys. Lett., 2011, 99, 14–17 Search PubMed.
- J. Ma, K. Zhu, D. Huo, X. Qi, E. Sun and R. Zhang, Appl. Phys. Lett., 2021, 118, 3–8 Search PubMed.
- P. Li, Y. Huan, W. Yang, F. Zhu, X. Li, X. Zhang, B. Shen and J. Zhai, Acta Mater., 2019, 165, 486–495 CrossRef CAS.
- Y. M. Jin, Y. U. Wang, A. G. Khachaturyan, J. F. Li and D. Viehland, Phys. Rev. Lett., 2003, 91, 1–4 Search PubMed.
- W. Cao and C. A. Randall, J. Phys. Chem. Solids, 1996, 57, 1499–1505 CrossRef CAS.
- Y. Yan, Y. Zhou and S. Priya, Appl. Phys. Lett., 2014, 104, 1–6 Search PubMed.
- Z. Feng and X. Ren, Phys. Rev. B: Condens. Matter Mater. Phys., 2008, 77, 1–6 Search PubMed.
- X. Ren, Nat. Mater., 2004, 3, 91–94 CrossRef CAS PubMed.
- B. Ma, Z. Hu, S. Liu, M. Narayanan and U. Balachandran, Appl. Phys. Lett., 2013, 102, 0–4 Search PubMed.
- R. Nie, Q. Zhang, Y. Yue, H. Liu, Y. Chen, Q. Chen, J. Zhu, P. Yu and D. Xiao, J. Appl. Phys., 2016, 119, 124111 CrossRef.
Footnote |
| † Electronic supplementary information (ESI) available. See DOI: https://doi.org/10.1039/d2tc03786f |
| This journal is © The Royal Society of Chemistry 2023 |

