
 Open Access Article
 This Open Access Article is licensed under a
 Creative Commons Attribution 3.0 Unported Licence
Donor–acceptor polymer complex formation in solution confirmed by spectroscopy and atomic-scale modelling†
Ishita
Jalan
 a,
Cleber F. N.
Marchiori
b,
Zewdneh
Genene
c,
André
Johansson
b,
C. Moyses
Araujo
b,
Ergang
Wang
c,
Jan
van Stam
a and
Ellen
Moons
*b
a,
Cleber F. N.
Marchiori
b,
Zewdneh
Genene
c,
André
Johansson
b,
C. Moyses
Araujo
b,
Ergang
Wang
c,
Jan
van Stam
a and
Ellen
Moons
*b
aDepartment of Engineering and Chemical Sciences, Karlstad University, SE-65188 Karlstad, Sweden
bDepartment of Engineering and Physics, Karlstad University, SE-65188 Karlstad, Sweden. E-mail: Ellen.Moons@kau.se
cDepartment of Chemistry and Chemical Engineering, Chalmers University of Technology, SE-412 96 Göteborg, Sweden
First published on 16th June 2023
Abstract
In all-polymer solar cells, high performance is attributed to the fine-grained morphology of the film in the active layer. However, the mechanism by which this fine-grained morphology is achieved remains unknown. Polymeric non-fullerene acceptors have the potential to restrict the self-aggregation, typical of non-fullerene small molecule acceptors. Here we employed a blend of the polymeric acceptor PF5-Y5 and the donor polymer PBDB-T to investigate the balance between molecular interactions in solution. Temperature-dependent absorption spectra show evidence of temperature-induced disaggregation of both donor and acceptor polymers, where the donor polymer disaggregation depends on the solvent polarity. Concentration-dependent fluorescence spectra of blend solutions display blue-shifted acceptor emission upon dilution, similar to that observed in acceptor solutions, and a decreased tendency for charge transfer from donor to acceptor upon dilution. Excitation spectra of dilute blend solutions contain an increased contribution to the long-wavelength acceptor emission, as compared to pure acceptor solutions, from a chromophore that absorbs in a region where the donor does not absorb. These observations can be explained by donor–acceptor complexation in dilute blend solutions, that is stabilized in more polar solvents. Moreover, the near IR-region of the absorption spectrum could be matched with the calculated electronic excitations of donor–acceptor complexes of PBDB-T and PF5-Y5 oligomers. The results corroborate that the interaction between segments of the donor and acceptor polymer chains favours the formation of donor–acceptor charge transfer complexes, stabilized by hybridization of the molecular orbitals, which reduces the electronic energy. The proposed donor–acceptor complex formation competes with the donor and acceptor self-aggregation and is influenced by the solvent environment. These pre-formed donor–acceptor complexes in low-concentration solutions can be expected to have important consequences on the film morphology of all-polymer blends. The results from this joint experimental–theoretical spectroscopy study provide insights that can guide the design of compatible donor and acceptor polymers for future high-performance organic solar cells.
Introduction
The development of non-fullerene electron acceptors (NFA) has significantly increased the power conversion efficiencies (PCE) of organic solar cells, with record values above 18%.1 Their broader absorption spectra, tuneable energy levels, and higher photochemical stability compared to the fullerene-based electron acceptors, have promoted organic photovoltaics to a convincing, high efficiency, and scalable technology. NFA-based solar cells with PCEs exceeding 20% can be foreseen in the near future.2 It is furthermore worth noting that blends of NFAs with electron donor polymers tend to form bulk heterojunction films with very fine-structured morphologies, which is believed to be key to their superior photovoltaic performance, along with their broad absorption spectra and their low voltage loss. How this fine morphology is formed is, however, not well understood.The morphologies of polymer:fullerene and polymer:polymer blend films have been studied extensively in the field of organic photovoltaics. While the formation of donor-rich and acceptor-rich domains by liquid–liquid phase separation during solvent extraction and film drying is well understood for amorphous polymers blends, this knowledge cannot be translated easily to blends with NFAs. Their planar shape and tendency to aggregate requires a new approach. Aggregation is known to compete with liquid–liquid phase separation, and hence hinder the formation of excessively large domains.3 When aggregates or crystallites are formed of one of the blend components, the remaining blend ratio changes, which can hinder the mixture from reaching the two-phase region in the phase diagram, as was demonstrated for polymer:fullerene blends in solvents with low fullerene solubility4 This may appear beneficial, but the growth of the aggregates can be hard to control. Too strong self-aggregation leads to large aggregates that limit charge generation, and are detrimental for device performance. Most NFAs are small molecules with fused rings, which have strong tendencies to crystallize through π–π stacking, leading to poor miscibility with the polymer donor,5 as well as poor morphological stability.6 Also the donor polymer PBDB-T is known to aggregate, as observed from the evolution of its absorption spectrum during film formation.7,8
To achieve the highest cell performances for NFA-based solar cells, complex processing conditions, such as high-temperature coating, have been used to suppress the tendency of small molecule acceptors to develop large crystals.9 The addition of nucleating agents and the use of ternary mixtures containing two co-crystallizing small-molecule NFAs is one successful approach to maintain a fine-grained morphology with good thermal stability.10 Solvent additives is an alternative method to control aggregate formation and film morphology. The presence of solvent additives affects the absorption spectrum of the donor polymer PBDB-T in solution and in blade-coated films, as was shown by in situ spectroscopy during film drying.11
An alternative way to avoid excessive aggregation, while keeping the high extinction coefficient and broad absorption spectra of small molecule acceptors, has been the synthesis of polymeric electron-acceptors12 One strategy, explored in the literature, to achieve acceptor polymers with a good miscibility with electron-donating polymers is the incorporation of moieties in the acceptor copolymer backbone, that are structurally similar to moieties in the donor polymer, together with a high-performance small molecule acceptor unit.5 The polymer acceptor PF5-Y5, based on thienyl-benzodithiophene (BDT-T) and small molecule acceptor (Y5), has proven to be an efficient electron-acceptor, reaching PCE of 14.5% in all-polymer solar cells with donor polymer PBDB-T.13 Good results have also been reported for similar polymeric acceptors with PBDB-T as donor.14 For the PF5-Y5, the self-aggregation, observed in blends with the Y5, could be limited. The molecular compatibility of the PF5-Y5 acceptor and the PBDB-T donor polymer architectures make them structurally favourable to interact. Additionally, polymeric non-fullerene acceptors have a high thermal stability6 and superior mechanical flexibility, advantages that make them promising for large-area and flexible devices.15,16
Nevertheless, such polymers, donors as well as acceptors, can be aggregated in solution at room temperature due to strong π–π stacking and disaggregate at high temperatures. Temperature dependent aggregation in solution has been reported for several kinds of organic semiconductors and conjugated polymers.17 Some examples are donor polymers PBDB-T,18,19 PBDTBDD,20 PffBT4T-2OD and their derivatives, PTzBi,21 as well as the acceptor polymer P(NDI2OD-T2), also called N2200.22,23 The effect of temperature on the absorption spectra of polymer solutions visualizes the transition from aggregated to dissolved single polymer chains clearly by a blue-shift of the absorption maximum with increasing temperature, which can be accompanied by changes in the spectral shape. This temperature-induced disaggregation has been used to control the disorder–order transition of the polymer during solution processing. Coating the photoactive layers from hot solutions or on heated substrates was found to have impact on the film morphology, and even the molecular ordering or stacking type could be controlled.8,24 This technique has proven particularly beneficial for the fabrication of thicker active layers with favourable morphologies and solar cells with PCEs above 10%.9 Heating/cooling cycles of the solutions were found to affect the device performance of PBDBDD/fullerene solar cells.20 Moreover, it has been shown that this temperature-controlled morphology engineering applied to blends of donor polymers with NFAs can yield solar cells with low voltage losses.9 Even in the case of PBDB-T:PF5-Y5, hot solution coating was needed to achieve all-polymer solar cells with high power conversion efficiencies.13
The motivation of this work is to explain the mechanism that limits the donor or acceptor self-aggregation, leading to the fine morphology observed in spin-coated active layers of polymeric NFA-based solar cells. We find that D–A complexes are formed in dilute solutions that can be observed by absorption and emission spectroscopies in the UV-vis-NIR range.
Possible driving forces for donor–acceptor complex formation in dilute solutions, e.g., structural similarity of units in donor and acceptor polymers and electrostatic interactions between the donor and acceptor chains, are discussed. The presence of structurally identical or similar units, e.g., the BDT unit, between the donor copolymer and the acceptor copolymer, has been suggested by others5,25 as the main driving force for donor–acceptor interaction. Structural similarity is, however, not a necessary criterion for the donor–acceptor complex formation that we observe. Indeed, we show here that the polymer architecture and distribution of charges in the chains make it more favourable for donor and acceptor chains to interact with each other than to self-aggregate. The donor and acceptor chains come close to one another, leading to electronic coupling that lowers the free energy and favours the complex formation. Our calculations show that this favourable interaction is the main reason why complexes between donor and acceptor polymers are formed and the HOMO can, as a consequence of that, be delocalized across the donor–acceptor complex, stabilizing it. Further, we show that these donor–acceptor complexes can be directly excited and contribute to the absorption onset of the blend, even in solution. It is reasonable to expect that both the morphology and the optical properties of solid films prepared from more concentrated solutions of this donor–acceptor blend will be influenced by the behaviour of these donor–acceptor complexes. Hence, we expect that a contribution to the charge generation in an all-polymer solar cell will originate from the long-wavelength light absorbed by the complex.
Experimental
Materials
The molecular structures of the donor and acceptor polymers are shown in Fig. 1. The donor polymer PBDB-T (also referred to as PCE12) was purchased from Ossila, UK. The Mw is 142![[thin space (1/6-em)]](https://www.rsc.org/images/entities/char_2009.gif) 700 g mol−1 and the polydispersity index PDI = 2.37. The acceptor polymer PF5-Y5 was synthesized at Chalmers University of Technology, Sweden, as described elsewhere.13 The Mw is 13600 g mol−1 and the PDI = 1.95. The degree of polymerisation is approximately 120 for PBDB-T and 6–7 for PF5-Y5. The solvents chlorobenzene (CB, 99.9%), ortho-dichlorobenzene (o-DCB, 99%), cyclohexane (c-Hex, 99%), all three from Sigma-Aldrich, ortho-xylene (o-Xyl, 99%), from Alfa Aesar, and methylcyclohexane (Met-c-Hex, 99%), from Acros, were used as received.
700 g mol−1 and the polydispersity index PDI = 2.37. The acceptor polymer PF5-Y5 was synthesized at Chalmers University of Technology, Sweden, as described elsewhere.13 The Mw is 13600 g mol−1 and the PDI = 1.95. The degree of polymerisation is approximately 120 for PBDB-T and 6–7 for PF5-Y5. The solvents chlorobenzene (CB, 99.9%), ortho-dichlorobenzene (o-DCB, 99%), cyclohexane (c-Hex, 99%), all three from Sigma-Aldrich, ortho-xylene (o-Xyl, 99%), from Alfa Aesar, and methylcyclohexane (Met-c-Hex, 99%), from Acros, were used as received.
 | ||
| Fig. 1 Molecular structures of PF5-Y5 and PBDB-T. | ||
Stock solutions (3 mg ml−1) of PBDB-T and PF5-Y5 were prepared in amber glass vials. To ensure complete dissolution, the stock solutions were gently heated, well below the boiling point of the actual solvent, and stirred overnight. Solutions for measurements on the unblended polymers were prepared by dilution of the relevant stock solution with the appropriate solvent to the desired concentration. Blend solutions of the two polymers were prepared by mixing the stock solutions with the PBDB-T:PF5-Y5 ratio equal to 4:3 w/w and diluting to the desired concentration by adding the appropriate solvent. Both single component and blend solutions were gently heated and stirred overnight, equal to the stock solution treatment, to ensure homogeneous solutions. All spectra were measured within one day after preparation.
Solutions of unblended polymers and blend solutions were prepared in the concentration range from 0.512 to 40 μg ml−1.
Methods
The absorption spectroscopy measurements were carried out on an Agilent Cary 5000 UV/Vis-NIR spectrophotometer, purchased from GammaData, Sweden. The temperature was controlled by a dual cell Peltier accessory. For measurements at 25 °C, 5 × 5 mm quartz cuvettes were used, while 1 × 1 cm quartz cuvettes were used for the temperature dependent spectroscopy experiments. In these measurements, spectra were recorded between 25 °C and 90 °C. All measurements were performed in double beam mode with background correction and a bandwidth of 2 nm with reduced slit height, which decreases the light intensity by a factor 4, and therefore reduces the S/N by .
.
The emission and excitation spectroscopy measurements were carried out on a Horiba Duetta combined absorption and fluorescence spectrometer, purchased from GammaData, Sweden. Quartz cuvettes of 5 × 5 mm were used for the measurements. All measurements were carried out at 20 °C (ambient temperature) with both the excitation and the emission band pass set to 5 nm and with an integration time of 0.05 s. All cuvettes were cleaned by rinsing with the appropriate solvent, followed by rinsing two times with acetone.
Computational methods
To provide the theoretical assessment for the optical properties of the copolymers discussed in this study, we build-up oligomeric models containing two repetitions units (2-mers) of PBDB-T and PF5-Y5. Two different conformations were considered for the PBDB-T oligomer models (Fig. SI-1, ESI†) and three different conformations for the PF5-Y5 (Fig. SI-2, ESI†). The oligomer models were constructed in a symmetric fashion in order to avoid spurious end-chain effects due to the finite length of the structures.26 This procedure is often used and has shown to be a reasonable way to model polymeric materials as oligomers, reproducing quite well experimental data.27,28 We also assembled dimer models consisting in two oligomeric chains of PBDB-T (D–D dimers, Fig. SI-1, ESI†) and PF5-Y5 (A–A dimers, Fig. SI-2, ESI†), as well as donor–acceptor complexes (D–A complexes), aiming to provide a first assessment regarding the aggregation of such materials and its impact on the materials’ absorption spectrum. For the PF5-Y5 dimer, two different conformations regarding the chain's alignment were considered and shown in Fig. SI-2 (ESI†): one crossed, where the two chains interact through one intersection and a π-stacked dimer, where the two chains are parallel to each order in a face-to-face conformation. For the PBDB-T only the π-stacked dimer was considered. For the D–A complexes three configurations were assembled and shown in Fig. SI-3 (ESI†): the crossed one, the π-stacked one, and an intermediate twisted configuration, in which the PBDB-T and PF5-Y5 oligomers are entangled. All the structures are shown in Fig. SI-1–SI-3 in the ESI† file. The structures were optimized before calculating the properties of interest.All the first-principles calculations were performed within the density functional theory (DFT) framework employing the M0629–31 as exchange–correlation functional, the Grimme D3 method to include dispersive interactions and 6-31G* as basis-set.32,33 The electronic transition in the visible range were calculated using Time-Dependent DFT (TD-DFT). For the single chains the first 60 singlet electronic transitions were calculated and for the dimers and complexes the 10 first singlet electronic transitions were computed. Furthermore, the electronic transition calculations were performed using the Poisson-Boltzmann (PBF) implicit solvation models and chlorobenzene as solvent. All the calculations were performed using the Jaguar version 11 software.34,35 The total and partial density of states were obtained using the fragment orbital framework as implemented in the AOMix code.36,37 For this analysis the DFT calculation were performed using the software Gaussian09 and M06/6-31G38 theory level.
Results and discussion
The normalized absorption spectra of PBDB-T solutions, PF5-Y5 solutions, and PBDB-T:PF5-Y5 (4:3) blend solutions in CB at a concentration of 40.0 μg ml−1, measured at temperatures 25, 50, 70, and 90 °C, are shown in Fig. 2. The corresponding unnormalized spectra are found in Fig. SI-4 (ESI†).
 | ||
| Fig. 2 Normalized absorption spectra for (a) PBDB-T, (b) PF5-Y5, (c) PBDB-T:PF5-Y5 (4:3) blend solutions in CB at a concentration of 40.0 μg ml−1 at temperatures 25, 50, 70, and 90 °C. | ||
The PBDB-T solution spectrum at room temperature shows the typical double peak at long wavelengths, which has been assigned to 0–0 and 0–1 transitions.39 As seen in Fig. 2(a), the absorption maximum of PBDB-T in CB blue-shifts by 42 nm from 609 nm at 25 °C to 567 nm at 90 °C. Moreover, a change in the shape of the main absorption band is also observed with increasing temperature; the double peak seen at lower temperature turns gradually into a single peak by lowering the contribution of the bathochromic peak. The thermally induced colour change of the solution is visible by the eye and reversible (Fig. SI-5, ESI†). This observed blue-shift of the absorption maximum and the change of the shape of the main absorption peak with increasing temperature are in line with earlier reports and are indicative of the temperature-induced disaggregation of PBDB-T aggregates in solution.18,40 We note that another weaker absorption band is found at 350 nm, which is less affected by temperature, as best seen in the unnormalized spectra in Fig. SI-4 and SI-6 (ESI†). Furthermore, the level of the hypsochromic shift of the main absorption band is solvent dependent. As shown in Fig. SI-6 (ESI†), the shift of the main absorption peak of PBDB-T in o-DCB of 60 nm, from 609 nm at 25 °C to 549 nm at 90 °C, is slightly larger than that in CB, while a smaller shift of 31 nm from 612 nm at 25 °C to 581 nm at 90 °C is observed in o-Xyl. In c-Hex and Met-c-Hex hardly any shift is observed, nor a change in peak shape. These observations can be correlated to the polarity of the solvents: o-DCB has a dipole moment of 2.14 D, while that of CB is 1.54 D and that of o-Xyl is 0.45 D.41 The two hexane solvents are both completely apolar. Such a correlation between solvent polarity and peak shifts is expected for intermolecular electrostatic interactions. Hence, the observed hypsochromic shift with increasing temperature on the one hand and its correlation with solvent polarity on the other hand are indicative of the presence of PDBD-T aggregates in solution that dissociate at elevated temperatures.
TD-DFT calculations were performed aiming to gain insight in the nature of the electronic transitions that compose the absorption spectrum. The calculated electronic transitions for a PDBD-T oligomer are shown in Fig. SI-7 (ESI†). For the single chain oligomer, the lowest-energy transition is found at 573 nm (conformation 1) and at 533 nm (conformation 2). The electronic transitions for the separate single chain conformations and the spatial distribution of their orbitals can be seen in Fig. SI-7 (ESI†). Additionally, we have calculated the electronic transitions of a π-stacked dimer of the PBDB-T oligomer. This model displays additional transitions at longer wavelength region covering better of the measured absorption spectrum in CB (see Fig. SI-7, ESI†). Here, the lowest-energy transition was found at around 630 nm. It should be pointed out that such better agreement between theory and experimental outcomes does not necessarily support the solution aggregation of the PBDB-T polymer. First, the calculated low-energy electronic transitions have very low oscillator strengths. Second, transitions at this spectral region could also be obtained by including thermal-induced dynamical effects, which may display even higher oscillator strengths. To assess those effects, much more time-consuming molecular dynamics simulations would need to be carried out, which is beyond the scope of the current study.
The absorption spectrum of the electron-acceptor polymer PF5-Y5 in CB shows an absorption maximum at approximately 750 nm and a broad and rather high absorption tail throughout the entire visible range, as seen in Fig. 2(b). With increasing temperature, the absorption onset blue-shifts and the main absorption peak becomes narrower from the long wavelength side, leading to a blue-shift of the absorption maximum from 746 nm at 25 °C to 735 nm at 90 °C. This shift by 11 nm is significantly smaller than that observed in PBDB-T in CB (42 nm). Unlike the donor polymer, the acceptor polymer does not exhibit any significant solvent dependence of the absorption spectrum. The temperature-driven blue-shift, seen in Fig. SI-8 (ESI†), is comparable in CB, o-Xyl, and o-DCB. Hence, the absorption spectra of the electron acceptor polymer show signs of aggregation of PF5-Y5 in solution at room temperature, aggregates that gradually break up at elevated temperatures.
Once again, the calculated electronic transitions for a PF5-Y5 oligomeric dimers display some contribution to the long wavelength part of the spectrum, as shown in Fig. SI-9 (ESI†). Three different conformations of the single chain PF5-Y5 oligomer were calculated (Fig. SI-2, ESI†). Their separate contributions to the absorption spectrum, as well as the spatial distributions of the orbitals corresponding with the first singlet electronic transitions are shown in Fig. SI-9 (ESI†). The lowest-energy transitions for these three conformations of the single chain PF5-Y5 oligomer are found at 683 nm, 706 nm, and 766 nm. Hence, the single chain contributions on their own seem not to be sufficient to reproduce the broad absorption band, between 700 and 800 nm, of the experimental spectrum of PF5-Y5. Consequently, the electronic transitions for two different dimers of the PF5-Y5 oligomer were also calculated, i.e., the π-stacked and the crossed (X) dimer conformations (Fig. SI-2, ESI†). Their lowest-energy transitions were found at 743 nm and 822 nm, respectively (Fig. SI-9, ESI†). Although the electronic transitions of the dimers contribute to the low-energy part of the PF5-Y5 absorption spectrum, one should again keep in mind the other possible contributions as mentioned above. In Fig. SI-9 (ESI†) the Natural Transition Orbitals are also depicted. This is an illustrative way to represent the electronic transition density matrix that brings information about the spatial distribution of the excited electron (as well as the hole distribution).42 It can be seen that, for the PF5-Y5 oligomer, the electron and hole have a separated spatial distribution, which is the signature of internal charge transfer (ICT), typically between electron-rich and electron-deficient units in a donor–acceptor copolymer. This is also one of the most widely used design strategies to obtain low-energy-gap polymers.43 Clearly this is not the case for PBDB-T, where the electronic transitions always present a considerable overlap of the electron and hole distributions, as shown in Fig. SI-7 (ESI†). Upon the PF5-Y5 dimer formation, the hole distribution is prone to delocalize over the BDT units of neighbouring chains (Fig. SI-9, ESI†). This change in the electronic structure strengthens the ICT character, reducing the energy gap. In this regard, a similar behaviour can be observed for PBDB-T, that means, for PBDB-T the delocalization of electron and hole over the two oligomers is observed but the electron and hole display an overlapping spatial distribution over two neighbouring oligomers.
Turning now to the absorption spectra of the PBDB-T:PF5-Y5 blend in CB at temperatures 25, 50, 70, and 90 °C, shown in Fig. 2(c), clearly distinct and complementary absorption bands of the donor polymer (at about 610 nm) and the acceptor polymer (at approx. 740 nm) can be seen. The peak at 610 nm contains contributions from both donor and acceptor absorption. Upon heating the blend solution, the absorption maxima of both absorption bands show a weak, but clear blue-shift, more pronounced in solvents with higher dipole moment. Just like in the pure acceptor solutions, the low-energy side of the main acceptor peak shows a weak blue-shift with increasing temperature. As most clearly seen in the blend spectra normalised to the acceptor peak (Fig. SI-8, ESI† bottom row) this shift is about equally strong compared to that seen for the pure acceptor solutions (second row). It is also about equally strong in all solvents, as was the case for the pure acceptor solutions. The absorption peak at 610 nm undergoes a change in shape with increasing temperature, apart from the blue-shift of the maximum, most clearly seen in the spectra normalised to the donor absorption peak (Fig. SI-8, ESI† third row). This is less obvious in o-Xyl, but in CB, and even more developed in o-DCB, where the peak around 610 nm develops a stronger absorption shoulder at about 550 nm with increasing temperature.
Interestingly, the absorption spectra of the PBDB-T:PF5-Y5 blend recorded at different temperatures, show two isosbestic points, at 540 nm and 700 nm in o-DCB, CB, and o-Xyl (Fig. SI-4 and SI-8, ESI†). The position of the isosbestic points is about the same for all three solvents. Isosbestic points are an indication for a ground-state equilibrium reaction. In the present study, this allows us to view the donor aggregates and donor–acceptor complexes as rather flexible entities, continuously exchanging polymer molecules. This, in turn, points to the fact that the blend solution will host unaggregated polymers, as well as donor–donor and acceptor–acceptor aggregates, beside the proposed donor–acceptor complexes.
The electronic transitions for the donor–acceptor complexes formed by the PBDB-T oligomer and the PF5-Y5 oligomer were calculated and match the measured absorption spectrum of the blend solution well (Fig. SI-10, ESI†). In particular, the red part of the blend spectrum can be matched well by considering contributions from the calculated donor–acceptor complexes. The lowest-energy transitions for three different conformations of this complex are shown in Fig. SI-3 and SI-10 (ESI†). Several of the low-energy transitions of the complex show a charge transfer character. Just like in the case of the dimers mentioned earlier, we cannot unambiguously assign the low energy transitions to the complex formation, because the limitation of the model concerning the treatment of the dielectric environment and the absence of chain dynamics due to thermal effects should be kept in mind. However, it is worth to mention that the higher intensity of oscillator strength for the complex, when compared to dimers, might be an indication that the hybridization of electronic states is impacting on the optical properties.
This charge transfer character is a strong indication for the presence of D–A complexes in solution, even at low concentrations. Direct excitation of the complex can result in separated charges as the electrons will be localized at the electron-withdrawing moiety (viz. the Y5) of the acceptor copolymers whilst the hole can be fully delocalized over the donor copolymer in a hybrid orbital formed by overlapping the orbital of the PBDB-T and the electron-rich moiety of the PF5-Y5 (i.e., BDT unit) (see Fig. SI-10, ESI†). These separated charges that are mutually attracted by Coulomb interaction consist in what is called a CT state. The solution will of course also contain single acceptor and donor chains, as well as possibly aggregates of those (contributions seen in Fig. 2(a) and (b)). However, the absorption onset and long wavelength region above 750 nm is the region where the donor–acceptor complex contributes to the absorption. Moreover, from the modelling point of view the assessment of the formation energy of the complexes is the main indication for the formation of D:A structures, as will be discussed later.
Turning to the fluorescence spectra, we note that the shape of the donor PBDB-T's emission is rather insensitive to the concentration, as well as the position of the emission maximum (Fig. 3(a)). This might seem contradictory, as we expect less aggregate formation at lower concentrations than at higher concentrations. This can be understood, however, if the donor–donor aggregates form an excimer upon excitation and this excimer either self-quenches, i.e., does not show any emission at all, or emits at a wavelength out of the range of the spectrometer. If so, the emission recorded in the fluorescence spectra emanates from unaggregated donor polymers only, and no dependence on concentration is expected for the shape of the spectra.
 | ||
| Fig. 3 Concentration dependent fluorescence spectra of (a) PBDB-T solutions, (b) PF5-Y5 solutions, and (c) PBDB-T:PF5-Y5 4:3 blend solutions in CB at 25 °C. Concentrations are given in the figure legend. All PBDB-T and PBDB-T:PF5-Y5 (4:3) blend solutions were excited at 610 nm. PF5-Y5 solutions were excited at 730 nm. | ||
For the emission intensity, however, a clear dependence on the concentration is expected. A careful inspection of the unnormalized fluorescence spectra recorded at different concentrations (Fig. SI-11, ESI†), corrected for the absorption at the excitation wavelength, reveal that the recorded emission intensity is conditional to a strong inner filter effect at higher concentrations, independent of whether it is the donor, the acceptor, or a donor:acceptor blend that is studied. This is expected for the higher concentrations, where the high absorption yields an obvious inner filter effect on the emission intensity. Diluting the solutions decreases this inner filter effect, as can be seen in Fig. SI-11 (ESI†) and for all solvents used. Instead, the dilution causes the intensity to increase, most obviously in the case of CB as solvent. This observation is further support for the hypothesis that the emission stems from unaggregated PBDB-T polymers. Upon dilution, the degree of aggregation will decrease and, consequently, the amount of emitting, unaggregated, and excited PBDB-T chromophores will increase, yielding an increased emission intensity upon dilution. At the very lowest concentrations, the dissociation rate seems to level off, as can be expected.
For the fluorescence spectra of acceptor PF5-Y5 (Fig. 3(b)), in contrast to the observations of PDBD-T, the emission clearly shows a hypsochromic shift upon dilution, in favour of the conclusion that this polymer forms aggregates in solution. As the hypsochromic shift is about equal for o-DCB, CB, and o-Xyl, (Fig. SI-11 and SI-12, ESI†) it is not possible from these observations only to conclude that the aggregate is of charge transfer kind. One should remember, though, that the PF5-Y5 monomer carries both donor and acceptor units, allowing the hypothesis that the aggregate to some extent forms a charge transfer state upon excitation.
The fluorescence spectra of the PBDB-T:PF5-Y5 (4:3) blends, presented in Fig. 3(c), further strengthen the hypothesis that this donor–acceptor pair forms complexes in solution. We observe two emission peaks when the blend solution is excited at 610 nm, one at 700 nm and another one at approximately 800 nm. The former emanates from the unaggregated donor polymers in solution, while the latter has its origin in the donor–acceptor complexes of charge transfer kind, together with contributions from acceptor and acceptor–acceptor aggregates. The unaggregated donor polymers will not transfer their excited electron to the acceptor, as they are too far away from the acceptor, thus not leading to a complete quenching of the donor emission.
Upon dilution, some of the formed donor–acceptor complexes will dissociate and the relative contribution from the donor emission (I700/I800) increases, e.g., from 0.22 at the highest concentration to 0.40 at the lowest concentration when CB is the solvent. While the ratio is relatively constant at about 0.2 at the highest concentration for o-DCB, CB, and o-Xyl, (Fig. SI-11 and SI-12, ESI†) there is a clear correlation between the solvent dipole moment and the intensity ratio at the lowest concentration: 0.61 in o-DCB and 0.30 in o-Xyl. This underpins the ability of the donor–acceptor complexes to form charge transfer states and that the formation of these complexes is an equilibrium process.
From the excitation spectra, shown in Fig. 4, more support for this hypothesis is obtained. The PBDB-T excitation spectra in CB (Fig. 4(a)), recorded at the emission wavelengths 690 nm and 750 nm, respectively, resemble the shape of the absorption spectra, judging by the peak positions. The short wavelength peak, i.e., the high energy transition, at 350–360 nm is found at an almost identical position to the corresponding peak in the absorption spectrum. The longer wavelength peak, however, does not show the same perfect matching with the absorption process. The low energy peaks of the excitation spectra, centred around 550 nm, show a hypsochromic shift and a broadening compared to the absorption spectrum. The reasons for this can be coupled to the hypothesis that charge transfer complexes are formed in an equilibrium process. The absorption spectra show the part of the process when an electron is excited from its ground state to its excited state, while the excitation spectra show the relaxation of the excited electron from the state reached after the charge transfer state is formed. This latter process will also influence the conformation of the donor polymer, resulting in a slightly shorter wavelength and a clear broadening of the peak. One important difference to the absorption is that the strongest relative contribution to the emission, at both emission wavelengths, stems from the absorption at approximately 350 nm. This absorption is indicative for singlet excited state formation.
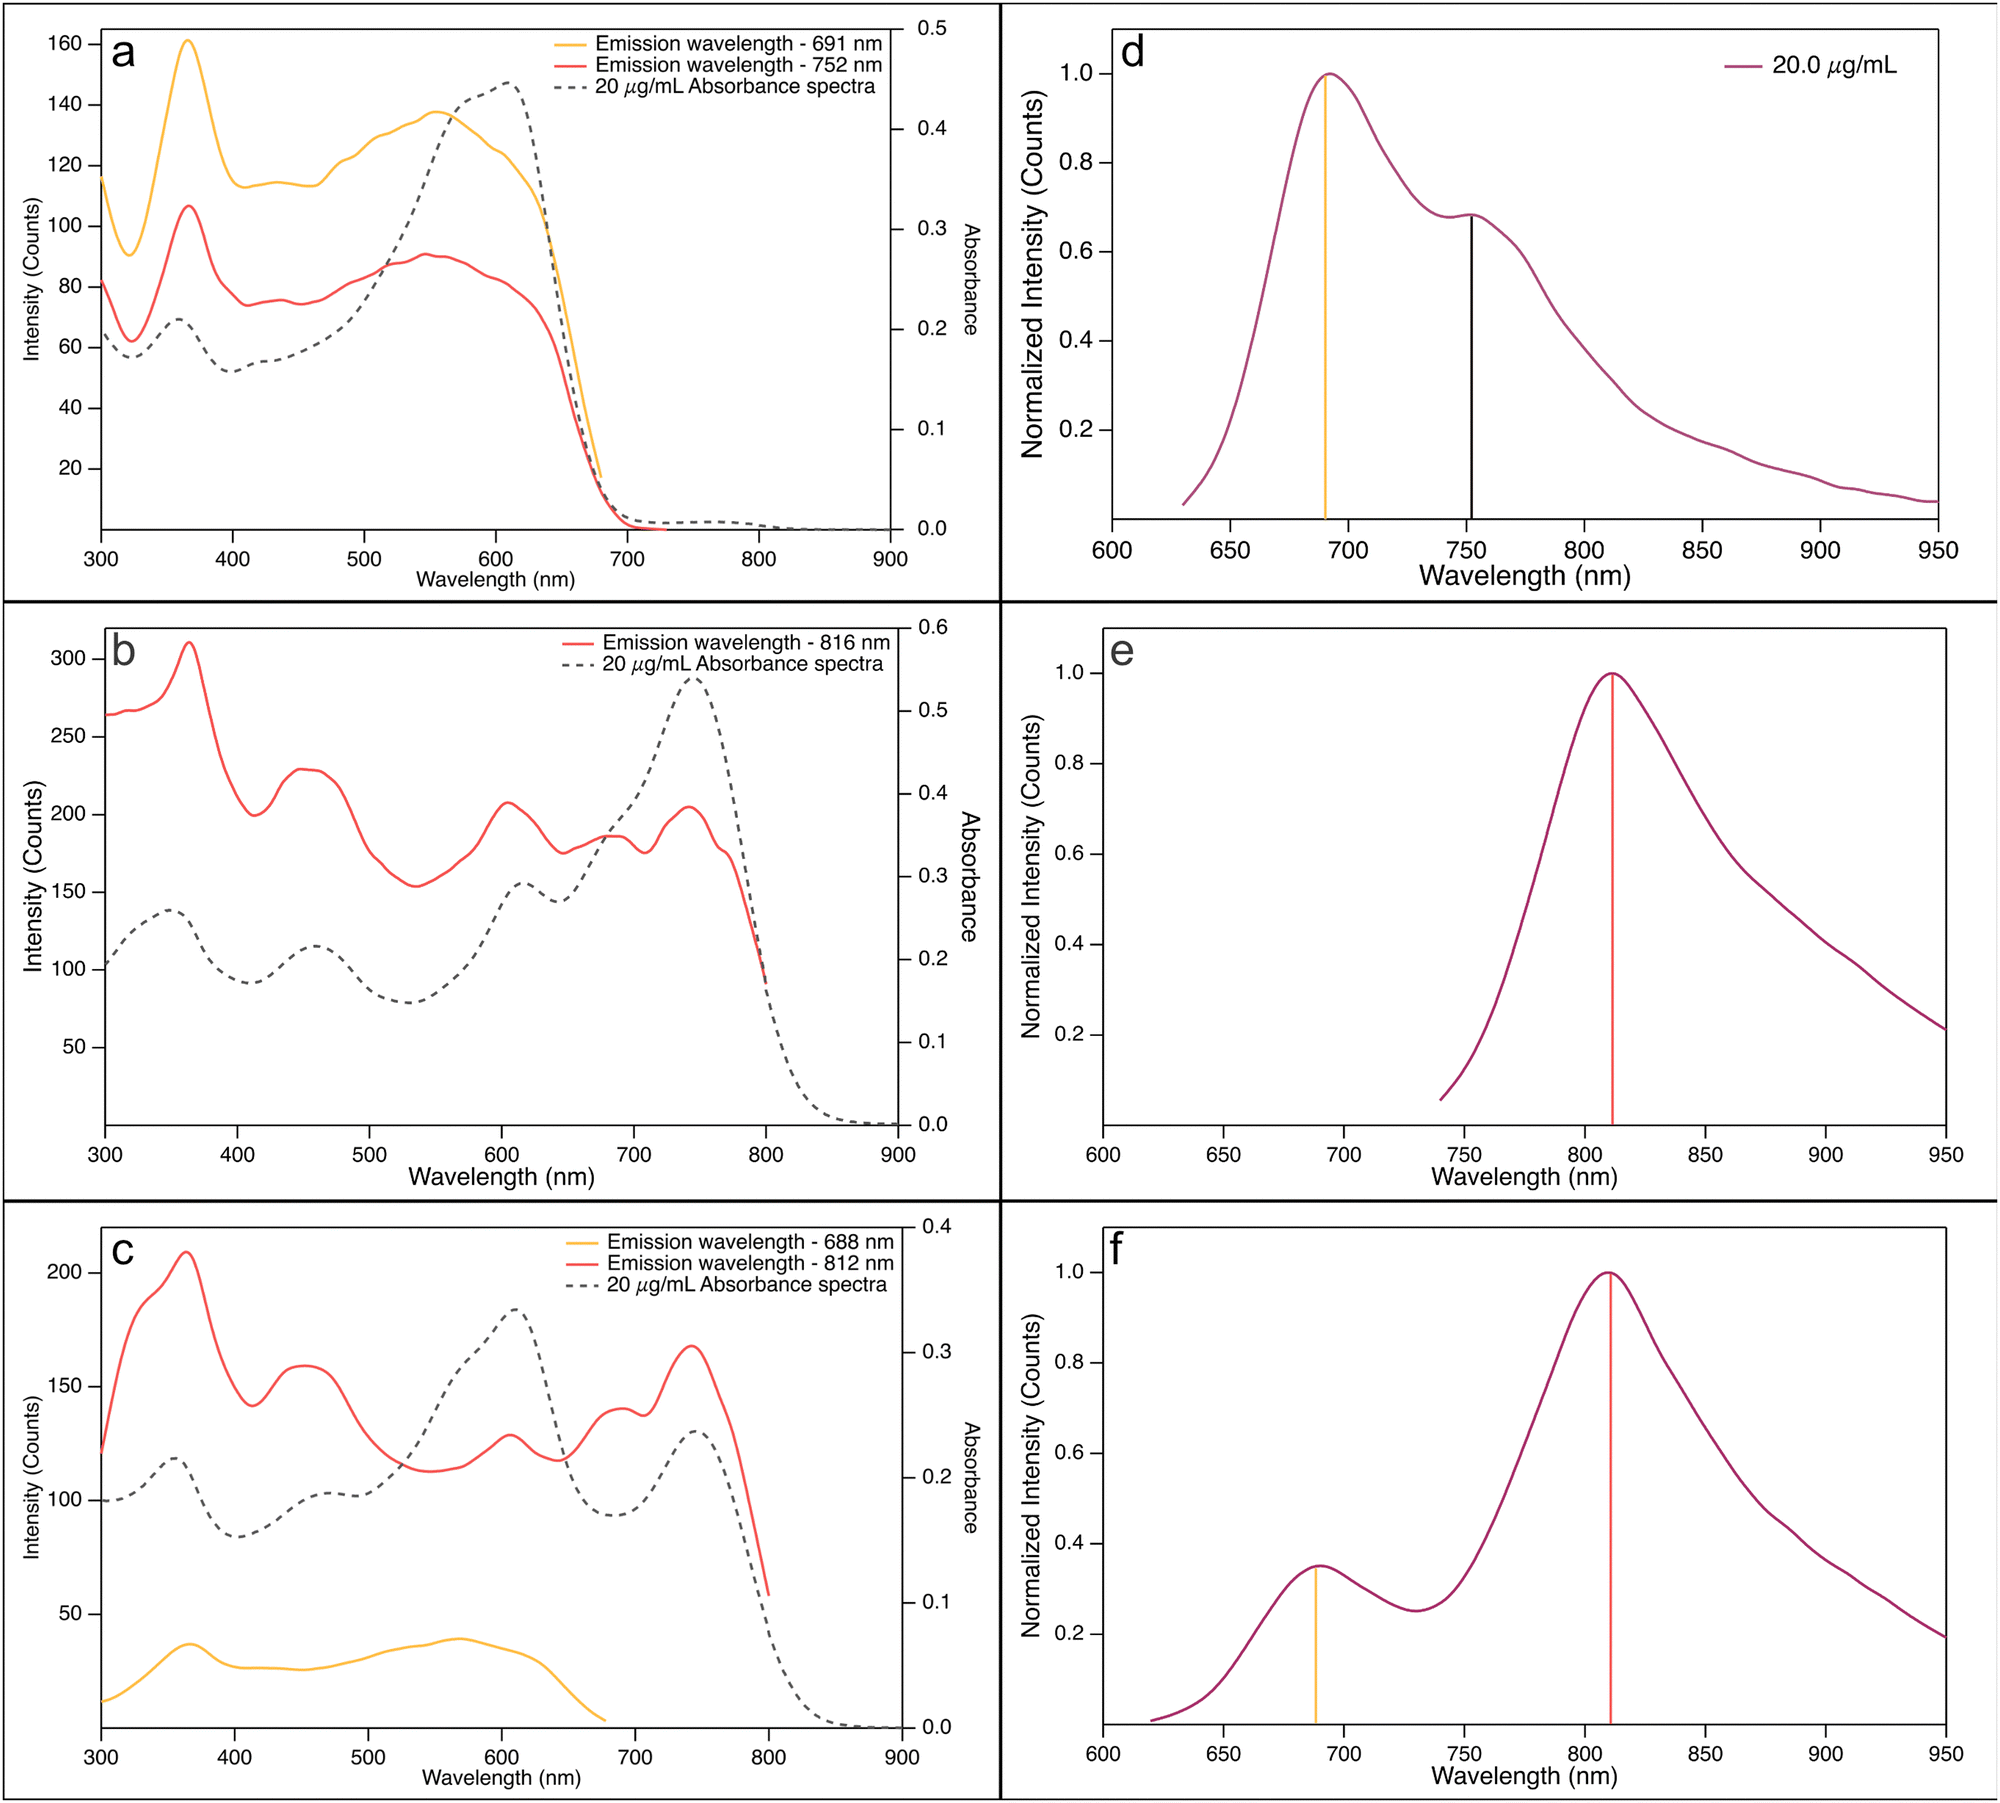 | ||
| Fig. 4 Excitation spectra (not normalized) (a)–(c) and corresponding fluorescence spectra (d)–(f) of (a) and (d) PBDB-T solutions, (b) and (e) PF5-Y5 solutions, and (c) and (f) PBDB-T:PF5-Y5 (4:3) blend solutions of 20 μg ml−1 in CB at 25 °C. The corresponding emission wavelengths for the excitation spectra are indicated by vertical lines in the fluorescence spectra. | ||
The excitation spectrum of the acceptor PF5-Y5 in CB (Fig. 4(b)), recorded at 810 nm, is, comparable to what was seen for PBDB-T, in the same way similar in shape with the corresponding absorption spectrum. Again, the peaks of the excitation spectrum match the peaks of the absorption spectrum very well. As was the case for the donor PBDB-T, the strongest relative contribution to the emission comes from absorption at 350 nm, in contrast to what was found for the absorption process. The picture that evolves, taken the information from absorption and fluorescence spectroscopy into account – and supported by atomic scale modelling – is that PF5-Y5 creates a singlet locally excited state upon excitation that relaxes to an internal charge transfer state. It is also clear from the excitation spectrum that this is not the only process at hand, as we also see contributions to the emission from excitation of acceptor–acceptor aggregates.
Turning to the excitation spectrum of the PBDB-T:PF5-Y5 (4:3) blend, finally, very interesting excitation patterns were obtained when recorded at 690 nm and 810 nm, respectively (Fig. 4(c)). The emission at 690 nm evidently stems solely from excited donors, as the excitation spectrum does not show any features of the acceptor. The emission at 810 nm, on the other hand, is emanating from the acceptor only – the excitation spectrum is similar to that of the acceptor solution. There is one important difference, though, and that is the change in relative contributions at different wavelengths for the blend, as compared to the pure acceptor solutions in different solvents (Fig. SI-13 and SI-14, ESI†). In Fig. SI-13 (ESI†), the emission measured at about 690 nm, one sees that the contribution from the broad peak centred at around 550 nm has a higher maximum intensity compared to the peak at 350 nm, even though the difference is much less pronounced than what is seen in the absorption spectrum. This holds for all three solvents: o-Xyl, CB, and o-DCB. When examining the spectrum measured at about 810 nm, however, the relative contributions from the two peaks, at about 350 nm and 740 nm, are shifted. Furthermore, when comparing these spectra with the corresponding spectra for the acceptor PF5-Y5, one finds that the relative contribution from the 740 nm peak is always more distinct in the blend compared to the acceptor. We suggest that a part of the observed increase from the bathochromic absorption comes from excited donor–acceptor complexes that transfer their energy to an emitting chromophore. This increase is more pronounced in more polar solvents, again pointing to a complex of charge transfer character.
Aiming to gain insight on the thermodynamics of the D–A complex formation we have conducted an assessment of the formation energy by evaluating the difference in total energy of the complex (oligomers’ distance ∼3 Å) and the separated (∼30 Å) PBDB-T and PF5-Y5 oligomers (Fig. 5). We find that the complex formation energy (Ef) is −1.48 eV, indicating that the complex formation is energetically more favourable than separated (solvated) chains. As depicted in Fig. SI-15 (ESI†) the two materials have a distinct charge distribution, as can be seen from the electrostatic potential surfaces of the separated oligomers. For the PBDB-T the electron-rich units, formed by thiophene–benzodithiophene–thiophene (T-BDT-T), are larger than the electron withdrawing (electron-poor) moiety, in this case benzo[1,2-c:4,5-c′]dithiophene-4,8-dione (BDD). While for the PF5-Y5 the electron-withdrawing unit (Y5) is larger than the electron-rich moiety (BDT). This difference in charge distributions can be a reason why those two molecules are prone to come close to one another. Moreover, what is clear from the calculation is that this lowering in energy that stabilized the complex comes from the molecular orbital overlap that gives rise to a new set of hybrid orbitals for the complex delocalizing the electrons over the donor backbone and the BDT units of the acceptor. This can be seen from the calculated partial density of states (DOS) of the complex, depicted in Fig. 6. Here, the partial DOS is obtained by spatially projecting the total DOS on the PF5-Y5 and PBDB-T oligomers. Thus, the contribution of each of these moieties to the electronic structure can be assessed. The occupied frontier orbitals (from HOMO−4 until HOMO) clearly display an intermixed nature further corroborating with the electronic delocalization picture, which in turn contributes to the stabilization of the D:A complex.
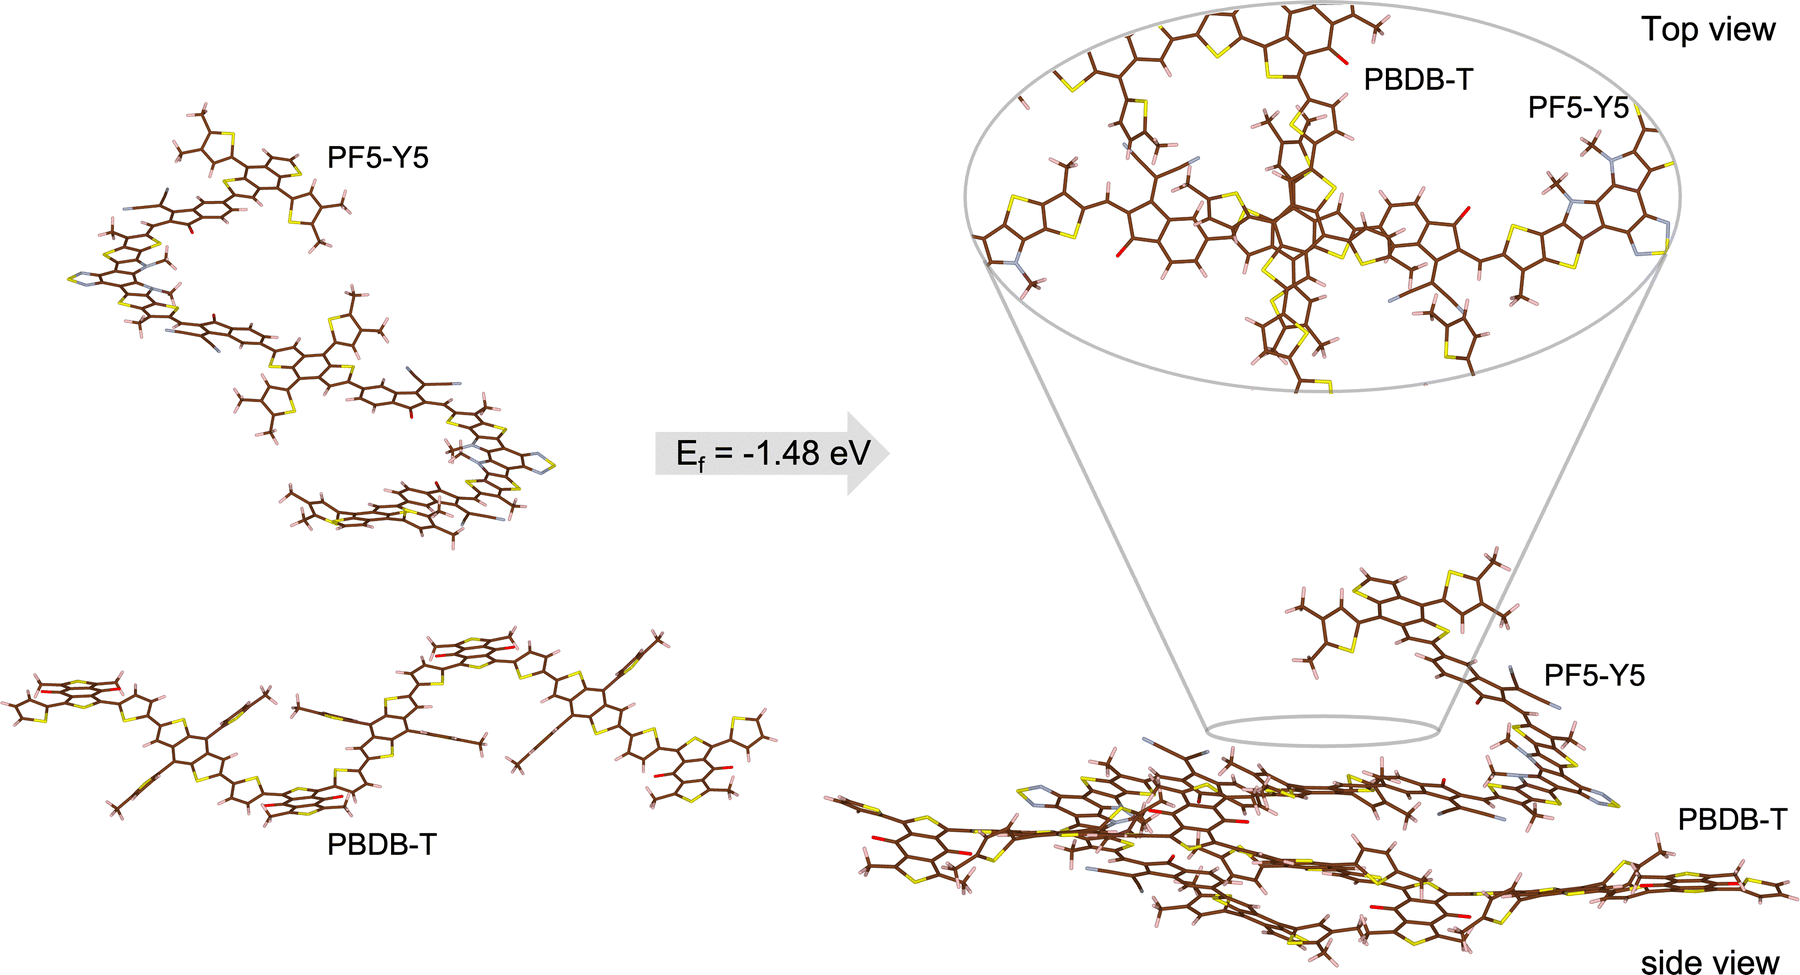 | ||
| Fig. 5 Schematic representation of the complex formation. Structures of separated (∼30 Å) donor oligomer of PBDB-T and acceptor oligomer of PF5-Y5 (left) and structure of donor and acceptor oligomers in close proximity of one another (∼3 Å) forming the donor:acceptor complex. The top view section shows a zoom-in on the interaction area. The formation energy was obtained from DFT calculations at M06/6-311G** theory level. | ||
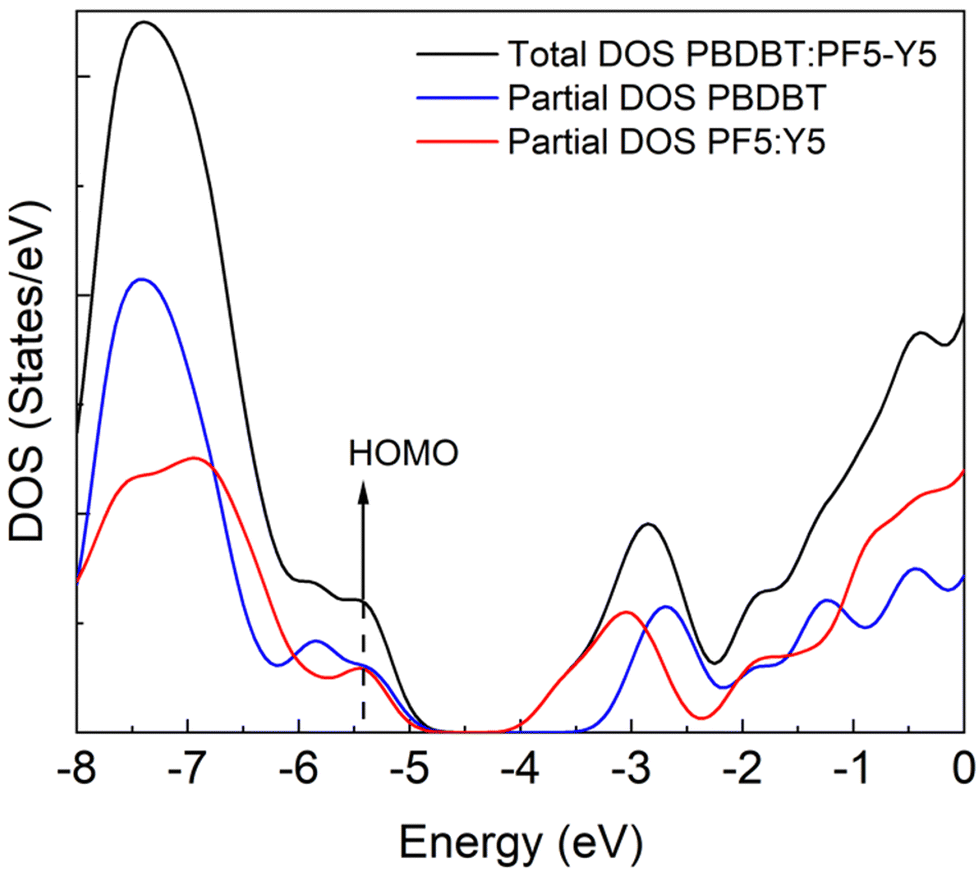 | ||
| Fig. 6 Total and partial DOS for the donor:acceptor complex. | ||
Conclusions
We have investigated dilute solutions of the polymers PBDB-T and PF5-Y5, an effective donor–acceptor pair for all-polymer solar cells, and their blends in a selection of solvents, by a combination of absorption, fluorescence, and excitation spectroscopy. The aim is to get insights in the molecular interactions leading to self-aggregation, disaggregation, and donor/acceptor mixing, processes that are relevant in coating solutions and determine the resulting bulk heterojunction morphology in such solar cells.The evolution of absorption spectra recorded at different temperatures of PBDB-T and PF5-Y5 in solution confirm the presence of both donor and acceptor aggregates at room temperature that are broken up at elevated temperatures, a process that is facilitated in polar solvents. The presence of donor and acceptor aggregates in single-component solutions is further confirmed by calculated low-energy electronic excitations for PBDB-T dimers and PF5-Y5 dimers.
From the good agreement between the absorption spectra of the PBDB-T:PF5-Y5 blend solutions and the calculated electronic transitions of donor–acceptor oligomer complexes we conclude that a PBDB-T:PF5-F5 complex is present in dilute solutions. It is likely that this donor–acceptor complex contributes to the near-IR region of the absorption spectra of PBDB-T:PF5-Y5 blend solutions. The presence of isosbestic points in these spectra at different temperatures, allows us to view the donor–acceptor complexes as rather flexible entities, continuously exchanging polymers with the solution bulk. This, in turn, points to the fact that the blend solution hosts solitary polymers, as well as donor–donor and acceptor–acceptor aggregates, beside the donor–acceptor complexes. The solitary donor polymers dominate the donor fluorescence and are in an equilibrium with non-emitting donor aggregates. The acceptor fluorescence, on the other hand, undergoes a blue-shift upon dilution, indicating that the disaggregation of acceptor aggregates occurs even at room temperature, in acceptor solutions, as well as in blends. Interestingly, the evolution of fluorescence spectra of PBDB-T:PF5-Y5 blend solutions upon dilution suggest that energy transfer occurs from an absorbing chromophore to an emitting acceptor, which further proves the proximity of donor and acceptor chains. Moreover, the excitation spectra of the blend solution show an increased contribution to the acceptor emission (at about 810 nm), from a chromophore that absorbs at around 750 nm, compared to that of the pure acceptor solution with the same concentration. We propose that this chromophore is a donor–acceptor complex that is formed in dilute blend solutions.
From the structures of the calculated complexes, we conclude that the driving force initiating the donor–acceptor complex formation in PBDB-T:PF5-Y5 is the local distribution of charges over the donor and the acceptor polymer chains. Attractive interactions between the partially negatively charged Y5 unit of the acceptor polymer and the partially positively charged T-BDT-T unit of the donor polymer brings these moieties closer to each other. When the distance is close enough and the complex is formed, our model predicts that a delocalization of the HOMO takes place over the donor–acceptor complex. The new molecular orbitals favour charge delocalization, which in turn lowers the free energy. This charge delocalization advances therefore as the true driving force for the stabilization of the donor–acceptor complexes in blend solutions. The lowest-energy electronic transitions of this complex are red-shifted and the donor–acceptor complexes contribute, hence, to the absorption in the IR-region of the blend solution. This implies that donor–acceptor complex formation is not necessarily driven by structurally identical units in donor and acceptor, but rather by polymer segments that can make electrostatic interactions favourable.
Author contributions
IJ and AJ performed all the spectroscopy experiments and acquired the data. CM performed the calculations. ZG synthesized the acceptor polymer. IJ and CM prepared the figures in the manuscript and SI. All authors participated in the discussions of the results. EM and JvS wrote the first draft of the manuscript, with contributions from CM and CMA. All authors contributed to the final version of the manuscript. EM, JvS and EW acquired the funding.Conflicts of interest
The authors declare no conflicts of interest.Acknowledgements
This work was funded by the Knut and Alice Wallenberg Foundation (grant number 2016.0059). EM acknowledges the funding from the Swedish Energy Council (grant number 48598-1). JvS acknowledges the funding from the Swedish National Space Agency (grant numbers 174/19 and 137/21). CM and CMA thank the Swedish National Infrastructure for Computing (SNIC) at the PDC Center for High-Performance Computing and National Supercomputer Centre at Linköping University (NSC), The Swedish Research Council (VR) (grant number 2014-05984), Swedish Energy Agency (grant number 45420-1) and STandUP for Energy collaboration.References
- Q. Liu, Y. Jiang, K. Jin, J. Qin, J. Xu, W. Li, J. Xiong, J. Liu, Z. Xiao, K. Sun, S. Yang, X. Zhang and L. Ding, Sci. Bull., 2020, 65, 272–275 CrossRef CAS PubMed.
- Z. C. Wen, H. Yin and X. T. Hao, Surf. Interfaces, 2021, 23, 100921 CrossRef CAS.
- S. Kouijzer, J. J. Michels, M. Van Den Berg, V. S. Gevaerts, M. Turbiez, M. M. Wienk and R. A. J. Janssen, J. Am. Chem. Soc., 2013, 135, 12057–12067 CrossRef CAS PubMed.
- S. Nilsson, A. Bernasik, A. Budkowski and E. Moons, Macromolecules, 2007, 40, 8291–8301 CrossRef CAS.
- J. W. Lee, C. Sun, B. S. Ma, H. J. Kim, C. Wang, J. M. Ryu, C. Lim, T. S. Kim, Y. H. Kim, S. K. Kwon and B. J. Kim, Adv. Energy Mater., 2021, 11, 2003367 CrossRef CAS.
- Q. Fan, W. Su, S. Chen, T. Liu, W. Zhuang, R. Ma, X. Wen, Z. Yin, Z. Luo, X. Guo, L. Hou, K. Moth-Poulsen, Y. Li, Z. Zhang, C. Yang, D. Yu, H. Yan, M. Zhang and E. Wang, Angew. Chem., Int. Ed., 2020, 59, 19835–19840 CrossRef CAS PubMed.
- Y. Liu, A. Yangui, R. Zhang, A. Kiligaridis, E. Moons, F. Gao, O. Inganäs, I. G. Scheblykin and F. Zhang, Small Methods, 2021, 5, 2100585 CrossRef CAS PubMed.
- N. Yao, Q. Fan, Z. Genene, H. Liu, Y. Xia, G. Wen, Y. Yuan, E. Moons, J. van Stam, W. Zhang, X. Lu, E. Wang and F. Zhang, Sol. RRL, 2023, 7, 2201134 CrossRef CAS.
- H. Hu, P. C. Y. Chow, G. Zhang, T. Ma, J. Liu, G. Yang and H. Yan, Acc. Chem. Res., 2017, 50, 2519–2528 CrossRef CAS PubMed.
- S. Hultmark, S. H. K. Paleti, A. Harillo, S. Marina, F. A. A. Nugroho, Y. Liu, L. K. E. Ericsson, R. Li, J. Martín, J. Bergqvist, C. Langhammer, F. Zhang, L. Yu, M. Campoy-Quiles, E. Moons, D. Baran and C. Müller, Adv. Funct. Mater., 2020, 30, 2005462 CrossRef CAS.
- Y. Liu, Q. Fan, H. Liu, I. Jalan, Y. Jin, J. Van Stam, E. Moons, E. Wang, X. Lu, O. Inganäs and F. Zhang, J. Phys. Chem. Lett., 2022, 13, 11696–11702 CrossRef CAS PubMed.
- D. Chen, J. Yao, L. Chen, J. Yin, R. Lv, B. Huang, S. Liu, Z. G. Zhang, C. Yang, Y. Chen and Y. Li, Angew. Chem., Int. Ed., 2018, 57, 4580–4584 CrossRef CAS PubMed.
- Q. Fan, Q. An, Y. Lin, Y. Xia, Q. Li, M. Zhang, W. Su, W. Peng, C. Zhang, F. Liu, L. Hou, W. Zhu, D. Yu, M. Xiao, E. Moons, F. Zhang, T. D. Anthopoulos, O. Inganäs and E. Wang, Energy Environ. Sci., 2020, 13, 5017 RSC.
- A. Tang, J. Li, B. Zhang, J. Peng and E. Zhou, ACS Macro Lett., 2020, 9, 706–712 CrossRef CAS PubMed.
- F. Peng, K. An, W. Zhong, Z. Li, L. Ying, N. Li, Z. Huang, C. Zhu, B. Fan, F. Huang and Y. Cao, ACS Energy Lett., 2020, 5, 3702–3707 CrossRef CAS.
- Q. Fan, W. Su, S. Chen, W. Kim, X. Chen, B. Lee, T. Liu, U. A. Méndez-Romero, R. Ma, T. Yang, W. Zhuang, Y. Li, Y. Li, T. S. Kim, L. Hou, C. Yang, H. Yan, D. Yu and E. Wang, Joule, 2020, 4, 658–672 CrossRef CAS.
- B. Du, J. Yi, H. Yan and T. Wang, Chem. – Eur. J., 2021, 27, 2908–2919 CrossRef CAS PubMed.
- Z. Zheng, H. Yao, L. Ye, Y. Xu, S. Zhang and J. Hou, Mater. Today, 2020, 35, 115–130 CrossRef CAS.
- W. Zhao, D. Qian, S. Zhang, S. Li, O. Inganäs, F. Gao and J. Hou, Adv. Mater., 2016, 28, 4734–4739 CrossRef CAS PubMed.
- D. Qian, L. Ye, M. Zhang, Y. Liang, L. Li, Y. Huang, X. Guo, S. Zhang, Z. Tan and J. Hou, Macromolecules, 2012, 45, 9611–9617 CrossRef CAS.
- B. Fan, L. Ying, Z. Wang, B. He, X.-F. F. Jiang, F. Huang and Y. Cao, Energy Environ. Sci., 2017, 10, 1243–1251 RSC.
- R. Steyrleuthner, M. Schubert, I. Howard, B. Klaumünzer, K. Schilling, Z. Chen, P. Saalfrank, F. Laquai, A. Facchetti and D. Neher, J. Am. Chem. Soc., 2012, 134, 18303–18317 CrossRef CAS PubMed.
- M. Schubert, D. Dolfen, J. Frisch, S. Roland, R. Steyrleuthner, B. Stiller, Z. Chen, U. Scherf, N. Koch, A. Facchetti and D. Neher, Adv. Energy Mater., 2012, 2, 369–380 CrossRef CAS.
- W. Li, M. Chen, J. Cai, E. L. K. Spooner, H. Zhang, R. S. Gurney, D. Liu, Z. Xiao, D. G. Lidzey, L. Ding and T. Wang, Joule, 2019, 3, 819–833 CrossRef CAS.
- S. Huang, P. Cong, Z. Liu, F. Wu, C. Gong, L. Chen and Y. Chen, Sol. RRL, 2021, 5, 2100019 CrossRef CAS.
- K. G. Jespersen, W. J. D. Beenken, Y. Zaushitsyn, A. Yartsev, M. Andersson, T. Pullerits and V. Sundström, J. Chem. Phys., 2004, 121, 12613 CrossRef CAS PubMed.
- G. Damas, C. F. N. Marchiori and C. M. Araujo, J. Phys. Chem. C, 2018, 122, 26876–26888 CrossRef CAS.
- G. B. Damas, C. F. N. Marchiori and C. M. Araujo, J. Phys. Chem. C, 2019, 123, 25531–25542 CrossRef CAS.
- Y. Zhao and D. G. Truhlar, Theor. Chem. Acc., 2007, 120(1), 215–241 Search PubMed.
- S. Grimme, J. Antony, S. Ehrlich and H. Krieg, J. Chem. Phys., 2010, 132, 154104 CrossRef PubMed.
- L. Goerigk and S. Grimme, Phys. Chem. Chem. Phys., 2011, 13, 6670–6688 RSC.
- R. Krishnan, J. S. Binkley, R. Seeger and J. A. Pople, J. Chem. Phys., 2008, 72, 650 CrossRef.
- M. J. Frisch, J. A. Pople and J. S. Binkley, J. Chem. Phys., 1998, 80, 3265 CrossRef.
- Jaguar, Schrödinger Release 2020-4, Schrödinger, LLC, New York, 2020, https://www.schrodinger.com/products/jaguar Search PubMed.
- A. D. Bochevarov, E. Harder, T. F. Hughes, J. R. Greenwood, D. A. Braden, D. M. Philipp, D. Rinaldo, M. D. Halls, J. Zhang and R. A. Friesner, Int. J. Quantum Chem., 2013, 113, 2110–2142 CrossRef CAS.
- S. I. Gorelsky, AOMix: Program for Molecular Orbital Analysis, http://www.sg-chem.net/ Search PubMed.
- S. I. Gorelsky and A. B. P. Lever, J. Organomet. Chem., 2001, 635, 187–196 CrossRef CAS.
- M. J. Frisch, G. W. Trucks, H. B. Schlegel, G. E. Scuseria, M. A. Robb, J. R. Cheeseman, G. Scalmani, V. Barone, G. A. Petersson, H. Nakatsuji, M. C. X. Li, A. Marenich, J. Bloino, B. G. Janesko, R. Gomperts, B. Mennucci, H. P. Hratchian, J. V. Ortiz, A. F. Izmaylov, J. L. Sonnenberg, D. Williams-Young, F. Ding, F. Lipparini, F. Egidi, J. Goings, B. Peng, A. Petrone, T. Henderson, D. Ranasinghe, V. G. Zakrzewski, N. R. J. Gao, G. Zheng, W. Liang, M. Hada, M. Ehara, K. Toyota, R. Fukuda, J. Hasegawa, M. Ishida, T. Nakajima, Y. Honda, O. Kitao, H. Nakai, T. Vreven, K. Throssell, J. A. MontgomeryJr., J. E. Peralta, F. Ogliaro, M. Bearpark, J. J. Heyd, E. Brothers, K. N. Kudin, V. N. Staroverov, T. Keith, R. Kobayashi, J. Normand, K. Raghavachari, A. Rendell, J. C. Burant, S. S. Iyengar, J. Tomasi, M. Cossi, J. M. Millam, M. Klene, C. Adamo, R. Cammi, J. W. Ochterski, R. L. Martin, K. Morokuma, O. Farkas, J. B. Foresman and D. J. Fox, Gaussian 09, Revision A.02 Search PubMed.
- J. Clark, C. Silva, R. H. Friend and F. C. Spano, Phys. Rev. Lett., 2007, 98, 206406 CrossRef PubMed.
- Y. Cui, S. Zhang, N. Liang, J. Kong, C. Yang, H. Yao, L. Ma and J. Hou, Adv. Mater., 2018, 30, 1802499 CrossRef PubMed.
- J. A. Dean and N. A. Lange, Lange's Handbook of Chemistry, McGraw-Hill, 15th edn, 1999 Search PubMed.
- R. L. Martin, J. Chem. Phys., 2003, 118, 4775 CrossRef CAS.
- E. Wang, Z. Ma, Z. Zhang, P. Henriksson, O. Inganäs, F. Zhang and M. R. Andersson, Chem. Commun., 2011, 47, 4908–4910 RSC.
Footnote |
| † Electronic supplementary information (ESI) available. See DOI: https://doi.org/10.1039/d1tc03853b |
| This journal is © The Royal Society of Chemistry 2023 |