
Strontium-doped mesoporous bioglass nanoparticles for enhanced wound healing with rapid vascularization†
Juan
Du
a,
Linpeng
Fan
*a,
Joselito M.
Razal
 a,
Sihao
Chen
b,
Hongmei
Zhang
*b,
Hongjun
Yang
c,
Haiyan
Li
d and
Jingliang
Li
*a
a,
Sihao
Chen
b,
Hongmei
Zhang
*b,
Hongjun
Yang
c,
Haiyan
Li
d and
Jingliang
Li
*a
aInstitute for Frontier Materials, Deakin University, Geelong, Victoria 3216, Australia. E-mail: plfanc@163.com; jingliang.li@deakin.edu.au
bSchool of Chemistry and Chemical Engineering, Multidisciplinary Center for Advanced Materials, Shanghai Engineering Research Center for Pharmaceutical Intelligent Equipment, Shanghai University of Engineering Science, Shanghai 201620, P. R. China. E-mail: hongmei_zhang97@163.com
cKey Laboratory of Green Processing and Functional New Textile Materials of Ministry of Education, Wuhan Textile University, Wuhan 430200, P. R. China
dChemical and Environment Engineering Department, School of Engineering, STEM College, RMIT University, Melbourne, VIC 3001, Australia
First published on 5th July 2023
Abstract
Tissue engineered skin and its substitutes have a promising future in wound healing. However, enabling fast formation of blood vessels during the wound healing process is still a huge challenge to the currently available wound substitutes. In this work, active mesoporous bioglass nanoparticles with a high specific surface area and doped with strontium (Sr) were fabricated for rapid microvascularization and wound healing. The as-prepared bioglass nanoparticles with Sr ions significantly promoted the proliferation of fibroblasts and microvascularization of human umbilical vein endothelial cells in vitro. Silk fibroin sponges encapsulating the nanoparticles accelerated wound healing by promoting the formation of blood vessels and epithelium in vivo. This work provides a strategy for the design and development of active biomaterials for enhancing wound healing by rapid vascularization and epithelial reconstruction.
1. Introduction
Wound healing is a complex process, which involves four stages: hemostasis, inflammation, proliferation and remodeling.1–4 Apart from proper management of inflammation, fast vascularization is crucial to rapid and high-quality healing. Currently, the wound dressing market is dominated by the conventional dressing materials (e.g., alginate foams, hydrogels, hydrocolloids and collagen), which are mainly for extrudate and infection management, with limited function for promoting tissue regeneration.5 Therefore, it is urgently needed to develop more effective dressing materials that can promote rapid healing of wounds. To this end, excellent biocompatibility, suitable microstructure and effective cell inductivity of the materials are the key requirements.6–8 Furthermore, to facilitate wound healing, the materials should be able to induce rapid angiogenesis, as sufficient blood vessels are needed to effectively transport nutrients and oxygen, recruit tissue cells, and metabolize tissue waste.9–11Currently, the most effective factors for promoting angiogenesis include vascular endothelial growth factor (VEGF), epidermal growth factor (EGF), fibroblast growth factor (FGF), and Arg-Glu-Asp-Val (REDV Peptide).12 However, maintaining the biological activity of these biological molecules is a big challange, and suitable encapsulating materials are generally needed to control their release into the wounds. Bioactive glass (bioglass), originally developed and extensively used for bone repair,13–15 has demonstrated a positive role in wound healing in recent years.16,17 A multitude of research studies have demonstrated that bioglass holds promise as a wound healing promoter due to its remarkable potential to significantly enhance and activate the cellular behaviors of inflammatory cells, fibroblasts, and endothelial cells, as well as their intricate interplay.17,18 Human umbilical vein endothelial cells (HUVECs) and fibroblasts are the main types of cells involved in wound healing. Studies have demonstrated that bioglass can regulate endothelial cell behavior, stimulate its mitotic response, and promote angiogenesis to improve wound healing.18 Bioglass has been shown to exert its wound healing effects by facilitating cell contact and modulating the wound microenvironment, which results in the regulation of various wound factors and promotion of the expression of vascular factors, including VEGF and FGF, etc. The release kinetics of bioactive ions is controlled by the degradation of bioglass which eliminates the necessity to use additional encapsulating materials, and the activity of bioglass can be maintained in long-term under ambient conditions, due to its inorganic nature.19 Nevertheless, the traditional bioglass that basically contains the elements of silicon (Si), calcium (Ca), sodium (Na) and phosphor (P) are not sufficiently active to promote angiogenesis rapidly.20 To enhance the bioactivity of bioglass, elements doping, in particular copper (Cu) and magnesium (Mg), has been generally used.21,22 However, the toxicity of these elements, in particular Cu, is a major concern. In addition, non-porous bioglass particles (micro-meter sized bioglass powders) have been largely used.23–26 Those particles with a low specific surface area and hence a slow degradation rate are not optimal for the regeneration of soft tissues, which takes a shorter time than hard tissues. Apart from bioglass particles, bioactive ions, obtained by dissolution of bioglass, have also been used for tissue engineering.27 Nevertheless, some matrix materials such as hydrogels have to be designed to control the release of the ions.28
Mesoporous bioglass materials have unique advantages in biomechanics and biocompatibility, especially in various tissue repair applications.29,30 Many studies have shown that regulating the chemical composition and microstructure of bioglass could promote not only the growth of cells, but also the regeneration of various tissues in particular hard tissues (e.g., bones).31,32 These recent developments have inspired the design and development of new tissue engineering materials. In this work, mesoporous bioglass nanoparticles with a multi-channel pore structure and a large specific surface area (hence faster degradation than non-porous bioglass powders) were developed. The function of bioglass was further enhanced by incorporation of bioactive strotium (Sr) ions. Sr has demonstrated very positive effects on rapid vascularization and has been generally used in engineering of hard tissues.19,25–27 Compared to other doping element such as Cu, Sr is more biocompatible.33,34 The Sr-doped mesoporous bioglass nanoparticles demonstrated excellent biocompatibility and pre-vascularization (tube formation) in vitro. A full-thickness circular skin replacement model (rats) was used to examine the efficiency of the bioglass nanoparticles for in vivo wound healing. The nanoparticles were loaded into silk fibroin (SF) sponges, obtained by freeze-drying of silk fibroin solution, as a wound dressing material. The sponges were not crystallized so it degraded quickly to release the bioglass particles into wounds. The use of this dressing material was based on the excellent biocompatibility of SF.35–37 The bioglass nanoparticles released into the wounds were then degraded/dissolved to release the bioactive ions. It was observed that the Sr doping significantly improved the efficiency of the bioglass nanoparticles for wound healing through rapid vascularization and epithelial reconstruction.
2. Materials and methods
2.1. Materials
B. mori silk cocoons were purchased from Titan Technology Co., Ltd (Shanghai, China). Cetyltrimethyl Ammonium Bromide (CTAB, 99.0%), triethanolamine (TEA, 99.0%), CaNO3 (98.0%), tetraethyl orthosilicate (TEOS, ≥99.0%), hexamethylene (99.9%), triethyl phosphate (TEP, ≥99.8%) and SrNO3 (98.0%) were purchased from Sigma-Aldrich.Cells (NIH-3T3 and human umbilical vein endothelial cells (HUVECs)) were purchased from Shanghai Institute of Biochemistry and Cell Biology (SIBCB, CAS, China). Dulbecco's modified Eagle's medium (DMEM), fetal bovine serum (FBS), and antibiotic-antibacterial medicine (penicillin/streptomycin) were obtained from Hyclone Trading Co., Ltd (Shanghai, China). Additionally, phosphate-buffered saline (PBS) and cell counting kit (CCK-8) was obtained from Solarbio® Life Science (Beijing, China). Matrigel was obtained from Corning Incorporated Co., Ltd (#356234, USA). For in vivo studies, the Sprague Dawley (SD) rats (8 weeks old, 250 g) were purchased from Chedun Animal Experimental Center in Shanghai.
2.2. Preparation of mesoporous bioglass nanoparticles
The mesoporous bioglass nanoparticles were prepared following a reported method with modifications.38 3.6 g of CTAB was dissolved in deionized (DI) water (40 mL) in a flask. 0.1 mL of TEA was used to adjust the pH of the solution to alkaline. After stirring for 30 min, 0.6 g of CaNO3 and TEP were added into the flask and stirred for 1 h. In the meantime, 1 mL of TEOS was dissolved into an appropriate volume of cyclohexane, and homogenized by magnetic stirring. The TEOS/cyclohexane mixture was then added to the flask and reacted at 60 °C for 48 h. The samples were then centrifuged at 12![[thin space (1/6-em)]](https://www.rsc.org/images/entities/char_2009.gif) 000 rpm, washed with ethanol three times, and then freeze-dried. Then, the samples were calcinated in a muffle furnace at 550 °C for 3 h (to remove CTAB) to get target mesoporous bioglass (rMBG) nanoparticles. To prepare Sr-doped rMBG (rMBG/Sr) nanoparticles, SrNO3 was added to the mixture after TEP was added.
000 rpm, washed with ethanol three times, and then freeze-dried. Then, the samples were calcinated in a muffle furnace at 550 °C for 3 h (to remove CTAB) to get target mesoporous bioglass (rMBG) nanoparticles. To prepare Sr-doped rMBG (rMBG/Sr) nanoparticles, SrNO3 was added to the mixture after TEP was added.
2.3. Preparation of porous SF-bioglass sponges
SF was extracted from B. mori silk cocoons following a reported method.39,40 Regenerated SF was obtained by degumming, dialysis and freeze-drying. Briefly, B. mori silk cocoons were boiled in a 0.5% Na2CO3 solution for 30 min and washed with deionized water to remove the sericin coating of the silk fibers. This process was repeated three times. The resultant SF fibers were dried overnight in an oven at 60 °C. Then, the fibers were dissolved in 9.3 M LiBr solution for 4 h at 60 °C. The resultant SF solution was dialyzed against deionized water for 3 days and freeze-dried to obtain regenerated SF. After that, SF was dissolved in DI water to prepare a clear aqueous solution with a SF concentration of 4%. 10 mL of the SF solution was then mixed with 10 mL of rMBG or rMBG/Sr dispersions in DI water (particle concentration 200 μg mL−1), and the mixtures were freeze-dried for 48 h to obtain sponges (SF/rMBG and SF/rMBG/Sr). Sponges without rMBG or rMBG/Sr were also prepared as controls.2.4. Characterization of mesoporous bioglass nanoparticles and sponges
The morphology of bioglass nanoparticles were characterized with transmission electron microscopy (TEM, JEM-2100F, JEOL, Japan). The bioglass samples were diluted with ethanol to a concentration of 5 μg mL−1 and aliquots of the dispersions were dropped onto copper grids, which were then placed at room temperature to allow ethanol to evaporate before TEM characterization. The morphologies of SF sponges without and with bioglass were characterized with a scanning electron microscope (SEM, JSM-5600, JEOL, Japan). Furthermore, the chemical compositions (C, N, O, Si, P, Ca, Sr) of the bioglass nanoparticles were determined by energy dispersive spectroscopy (EDS), attached to a scanning electron microscope (S-4800, Hitachi).The mesoporous structure of bioglass nanoparticles was characterized by a high-performance multi-channel automatic specific surface and porosity analyzer (Tristar II 3020, Micromeritics, America). By analyzing the N2 adsorption–desorption curve of the bioglass nanoparticles, the specific surface area, average pore size and size distribution of the nanoparticles were calculated. The size distribution of the bioglass nanoparticles was characterized by a particle size & zeta potential analyzer (Zetasizer NanoZS, Malvern, England).
2.5. Degradation properties of bioglass nanoparticles
Briefly, 100 mg of rMBG or rMBG/Sr was dispersed into a phosphate buffer saline (PBS) solution (10 mL, pH = 7.4) in a beaker which was sealed and placed in a shaker (100 rpm) at 37 °C. Aliquots of the mixtures were taken at different time intervals, centrifuged, and freeze-dried to obtain the degradation products, which were then examined by TEM and SEM.2.6. In vitro cell activity of bioglass nanoparticles
2.7. Tube formation assay
The influence of bioglass nanoparticles on the degree of vascularization was tested by HUVECs tube formation assay.18,41 Briefly, 48-well plates were pre-cultured with Matrigel (100 μL per well) at 0 °C. The plates were kept in the incubator for 30 min. Then, HUVECs were seeded into plates at a density of 3 × 10⁴ cells per well and co-cultured with the samples (control/blank, rMBG and rMBG/Sr). After 8 h, the cells were stained with calcein and observed with the inverted fluorescence microscope. Tubular length and branch points were measured with ImageJ.2.8. Effect of bioglass nanoparticles on wound healing
A rat wound model was designed to evaluate the effect of bioglass nanoparticles on wound healing. All animal operations were approved by the Animal Ethics Committee of the Sixth People's Hospital affiliated to the School of Medicine, Shanghai Jiao Tong University (Shanghai, China) (The ethics approval number: SYXK2021-0028).A full-thickness circular skin replacement model was adopted in this work.42,43 Firstly, the rats were anesthetized with isoflurane (5%) (inhalation) and their back hair was shaved. A scalpel was used to create a circular skin wound (d = 12 mm) on the dorsal side of each rat. Then, the artificial wound surfaces were covered with gauze (control) or SF sponges (pure silk, silk/rMBG and silk/rMBG/Sr). The wound dressings were changed every two days. Photos of the wound area were taken at 3, 7, 10, and 14 days, and the wound area ratio (S/S0 × 100%) was calculated as the percentage of the healed wound area (S) relative to the original wound area (S0).
Tissue samples were taken on days 7 and 14 after transplantation and fixed with 4% paraformaldehyde. The samples were stained through hematoxylin eosin (HE), and Masson stain. They were the commonly used histological staining techniques in pathology and biomedical research.44 Additionally, as collagen I (Col I) is the main component of the skin, specific staining of Col I was performed to evaluate the regeneration of collagen during wound healing.45 For fluorescence staining, CD31 (red) and α-SMA (green) were performed to evaluate wound angiogenesis.9 The numbers of new blood vessels on 7 and 14 days were calculated from the CD31/α-SMA staining images using ImageJ.
2.9. Statistical analysis
All the tests were performed in triplicates and the data were expressed as mean ± standard deviation. The significance of differences was analyzed by one-way analysis of variance (ANOVA). Difference with p < 0.05 was considered to be statistically significant, * stands for p < 0.05, ** stands for p < 0.01, and *** stands for p < 0.001.3. Results and discussion
The primary goal of wound healing therapy is to make the wound close quickly. The regeneration of capillary system is an important factor in the rapid healing of skin tissue.17,42,46 The regeneration of capillaries can improve the function of cells under hypoxic condition and improve the feeding condition of the whole traumatic tissue.44,47 Based on this, this study prepared mesoporous bioglass particles with multi-channel pore structure and rapid vascularization function, which could recruit cells during the wound healing process, accelerate the angiogenesis process and promote wound repair (Fig. 1).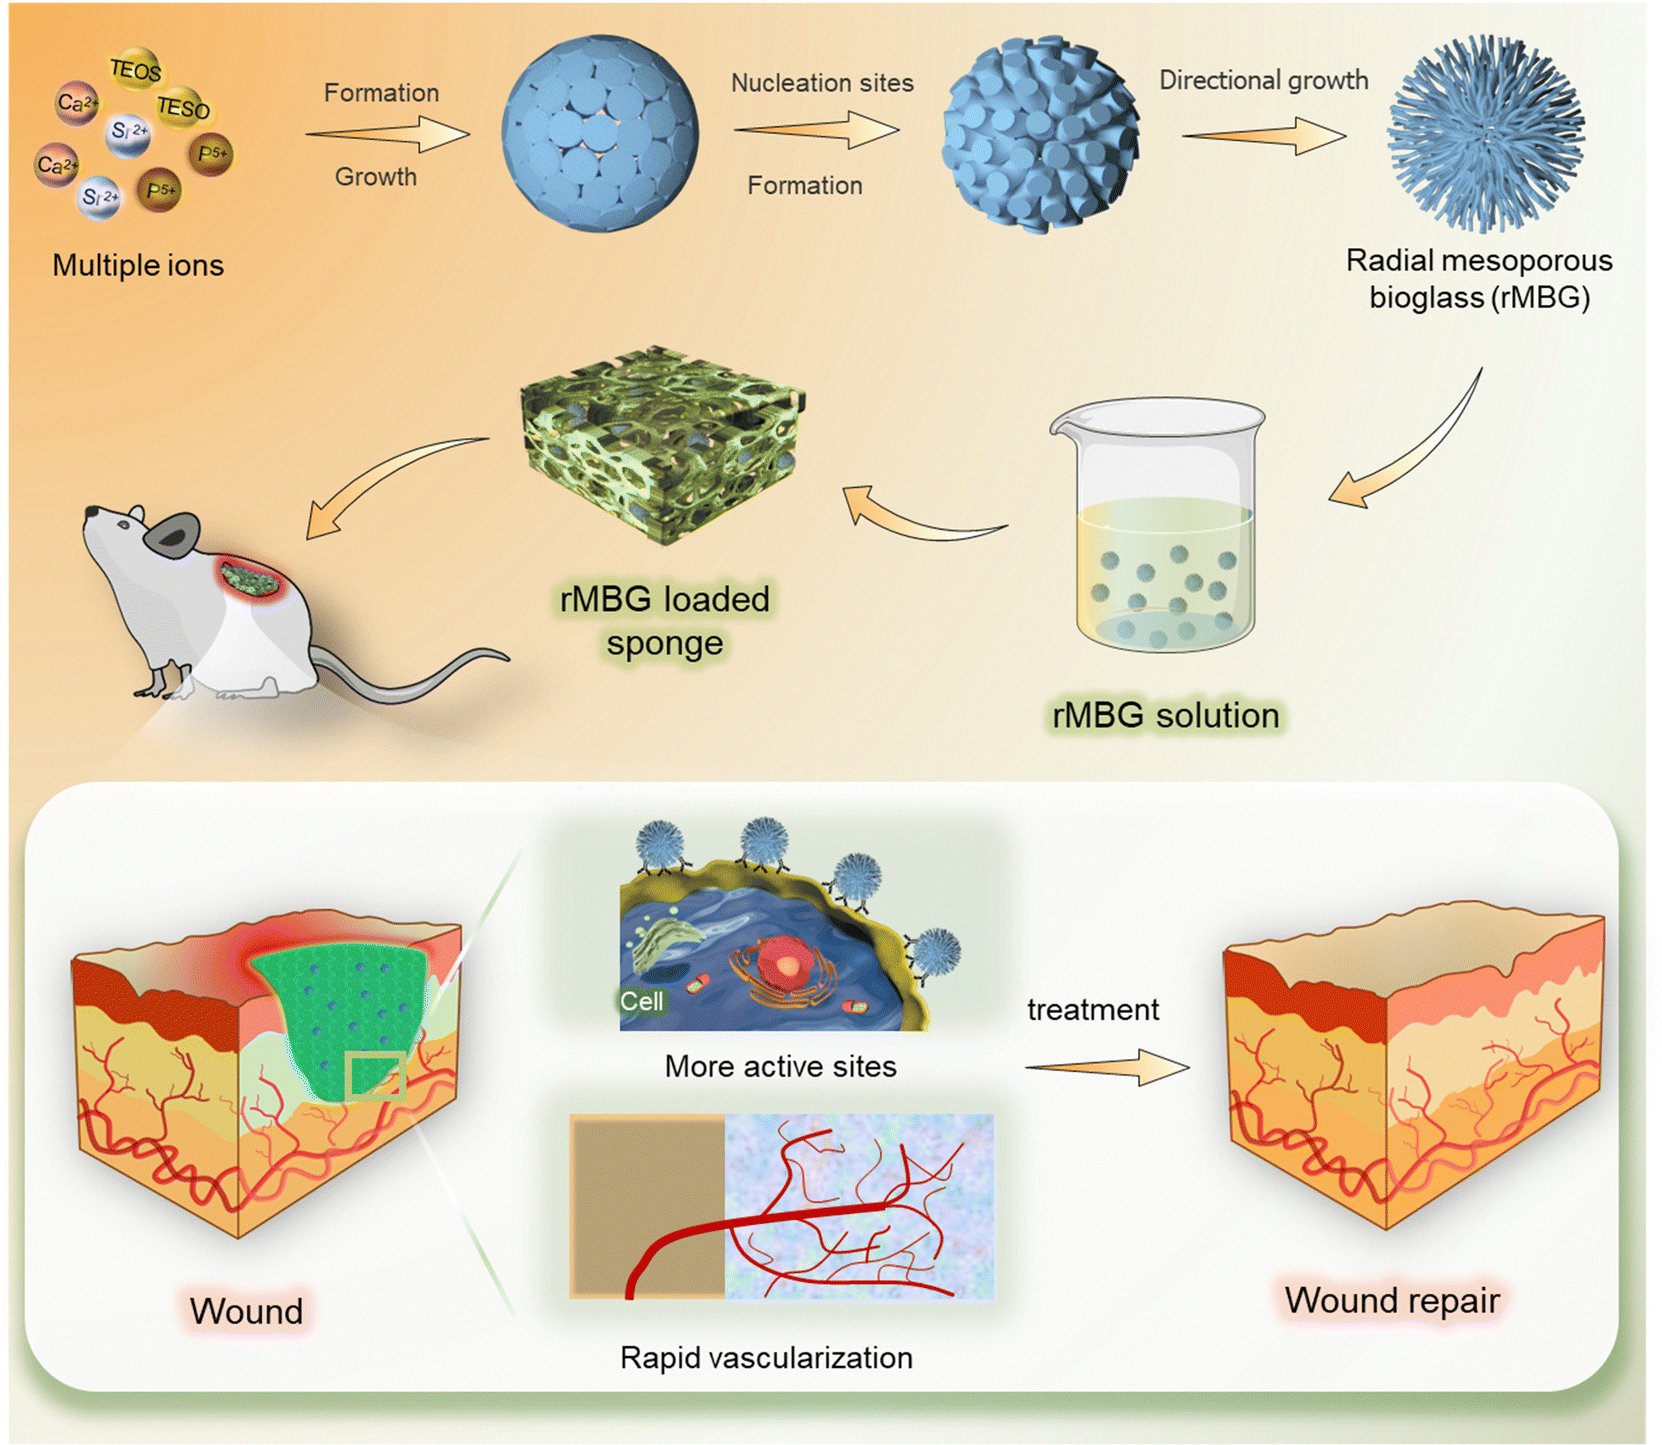 | ||
| Fig. 1 A schematic diagram of wound healing using biofunctionalized mesoporous bioglass nanoparticles. | ||
3.1. The surface properties of bioglass nanoparticles
The morphology of the rMBG was tuned by controlling the reaction durations (24–72 h). Fig. 2A is a digital photo of rMBG particle powder obtained after 48 h of reaction. The corresponding micro/nano morphologies of the rMBG and rMBG/Sr are shown in Fig. 2B and C, respectively. Both the rMBG and rMBG/Sr clearly show a radially dendritic structure and the radial slit mesopores on their surface compared with those prepared under other reaction conditions (i.e., 24 and 72 h, Fig. S1, ESI†). They have an obvious radial and dendritic structure, and with an extension of reaction time, the dendritic structure was more branched, leading to formation of smaller pores. The dendritic radiation morphology of rMBG-24 h and rMBG-48 h was obvious, and the radial slit mesoporous structure on the surface of the nanoparticles was clearly visible. The particles were well dispersed with a uniform particle size distribution, with most of the particles having a diameter of 200 and 270 nm, respectively. With an increase of reaction time to 72 h, the particles became larger (most particles were more than 300 nm) and less uniform in diameter, the radial morphology of the nanoparticles was less obvious and porous structure was less discernible due to the high degree of branching. The TEM image of both rMBG and rMBG/Sr demonstrates that the addition of Sr did not change the morphology (branching density and particle size) of rMBG significantly.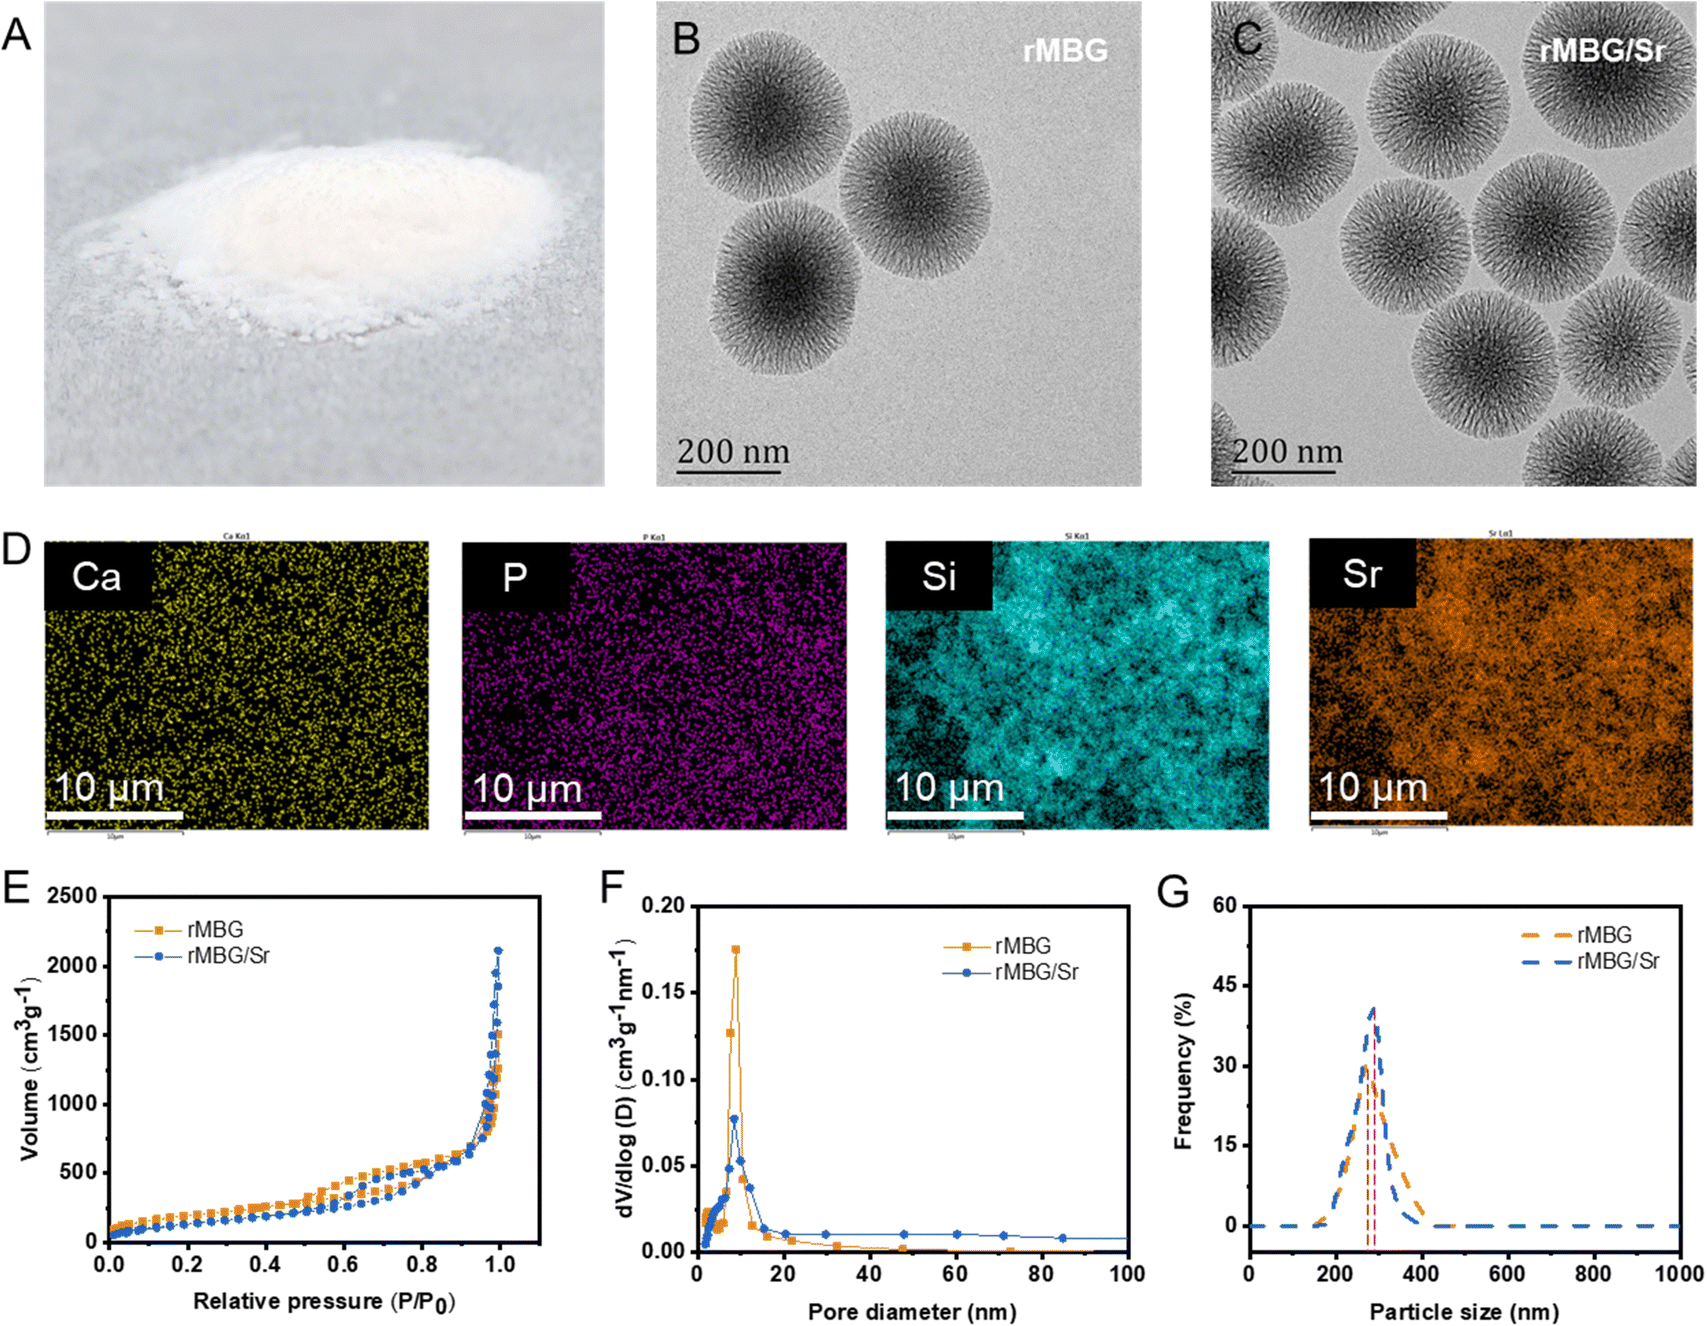 | ||
| Fig. 2 Characterization of bioglass nanoparticles. (A) A photo of rMBG powders; (B) and (C) TEM morphologies of rMBG and rMBG/Sr, respectively; (D) EDS mapping of rMBG/Sr; (E) N2 absorption–desorption isotherms, (F) pore diameter distribution and (G) particles size distribution of rMBG and rMBG/Sr, respectively. | ||
EDS analysis shows that rMBG contains six elements, which are C, N, O, Ca, P and Si (Fig. S2, ESI†). Apart from these six elements, the presence of Sr in rMBG was demonstrated (Fig. 2D, the elements of C, N, and P in rMBG/Sr are shown in Fig. S3, ESI†), suggesting that Sr was successfully doped into rMBG. According to previous research, Sr could promote the formation of vascular networks by enhancing the expression of a variety of vascularized genes, which was very important for accelerating tissue repair.48–50Fig. 2E–G shows the mesoporous structure and size distribution of rMBG and rMBG/Sr nanoparticles. Both the N2 adsorption and desorption curves of rMBG and rMBG/Sr (Fig. 2E) belong to type IV isotherms and have type H3 hysteresis rings, indicating that they both have a narrow mesoporous structure, which is consistent with the morphology shown in the TEM images (Fig. 2B and C). Calculated from the N2 adsorption and desorption curves, rMBG/Sr has a specific surface area of 692 m2 g−1 and an average pore size of 17.14 nm while traditional meso-porous silicon has only about 400 m2 g−1.51,52 The rMBG/Sr had no significant difference in specific surface area compared with the rMBG (713 m2 g−1). However, the pore size of the rMBG/Sr (17.14 nm) had a significant increase compared with the rMBG (9.76 nm). The sizes of rMBG and rMBG/Sr nanoparticles are quite homogeneous, as shown by their narrow size distributions, with an average particle size of 270 and 290 nm, respectively. Additionally, Fig. S4A (ESI†) exhibited the morphology of SF sponges without and with bioglass nanoparticles. Obviously, the pore structure of SF sponge without the loading of nanoparticles was random. With the addition of rMBG and rMBG/Sr, the sponges show lamellar stacking, and the nanostructure is more regular than that of pure SF sponge. EDS analysis further proved that rMBG/Sr was loaded in SF/rMBG/Sr sponges successfully (Fig. S4B, ESI†).
3.2. The degradation properties of bioglass nanoparticles
Bioglass can be biodegraded to release ions in the in vivo environment by a series of chemical reactions with body fluids, which can promote the repair process of defect tissue.53,54 Therefore, the degradation speed of bioglass can affect its bioactivity. Fig. 3 shows morphological characteristics of the samples after being incubated in PBS buffer at 37 °C for different periods of time. Before degradation, the morphologies of rMBG and rMBG/Sr nanoparticles were uniform, and their boundaries were clear. After being incubated for 3 days, the boundaries of rMBG and rMBG/Sr nanoparticles began to blur and the microstructure of the nanoparticles became fluffier (Fig. 3A). After 7 days, the morphological changes were more obvious, and the dendritic structure started to collapse. After 14 days, the profiles of the nanoparticles were completely lost and they clumped together.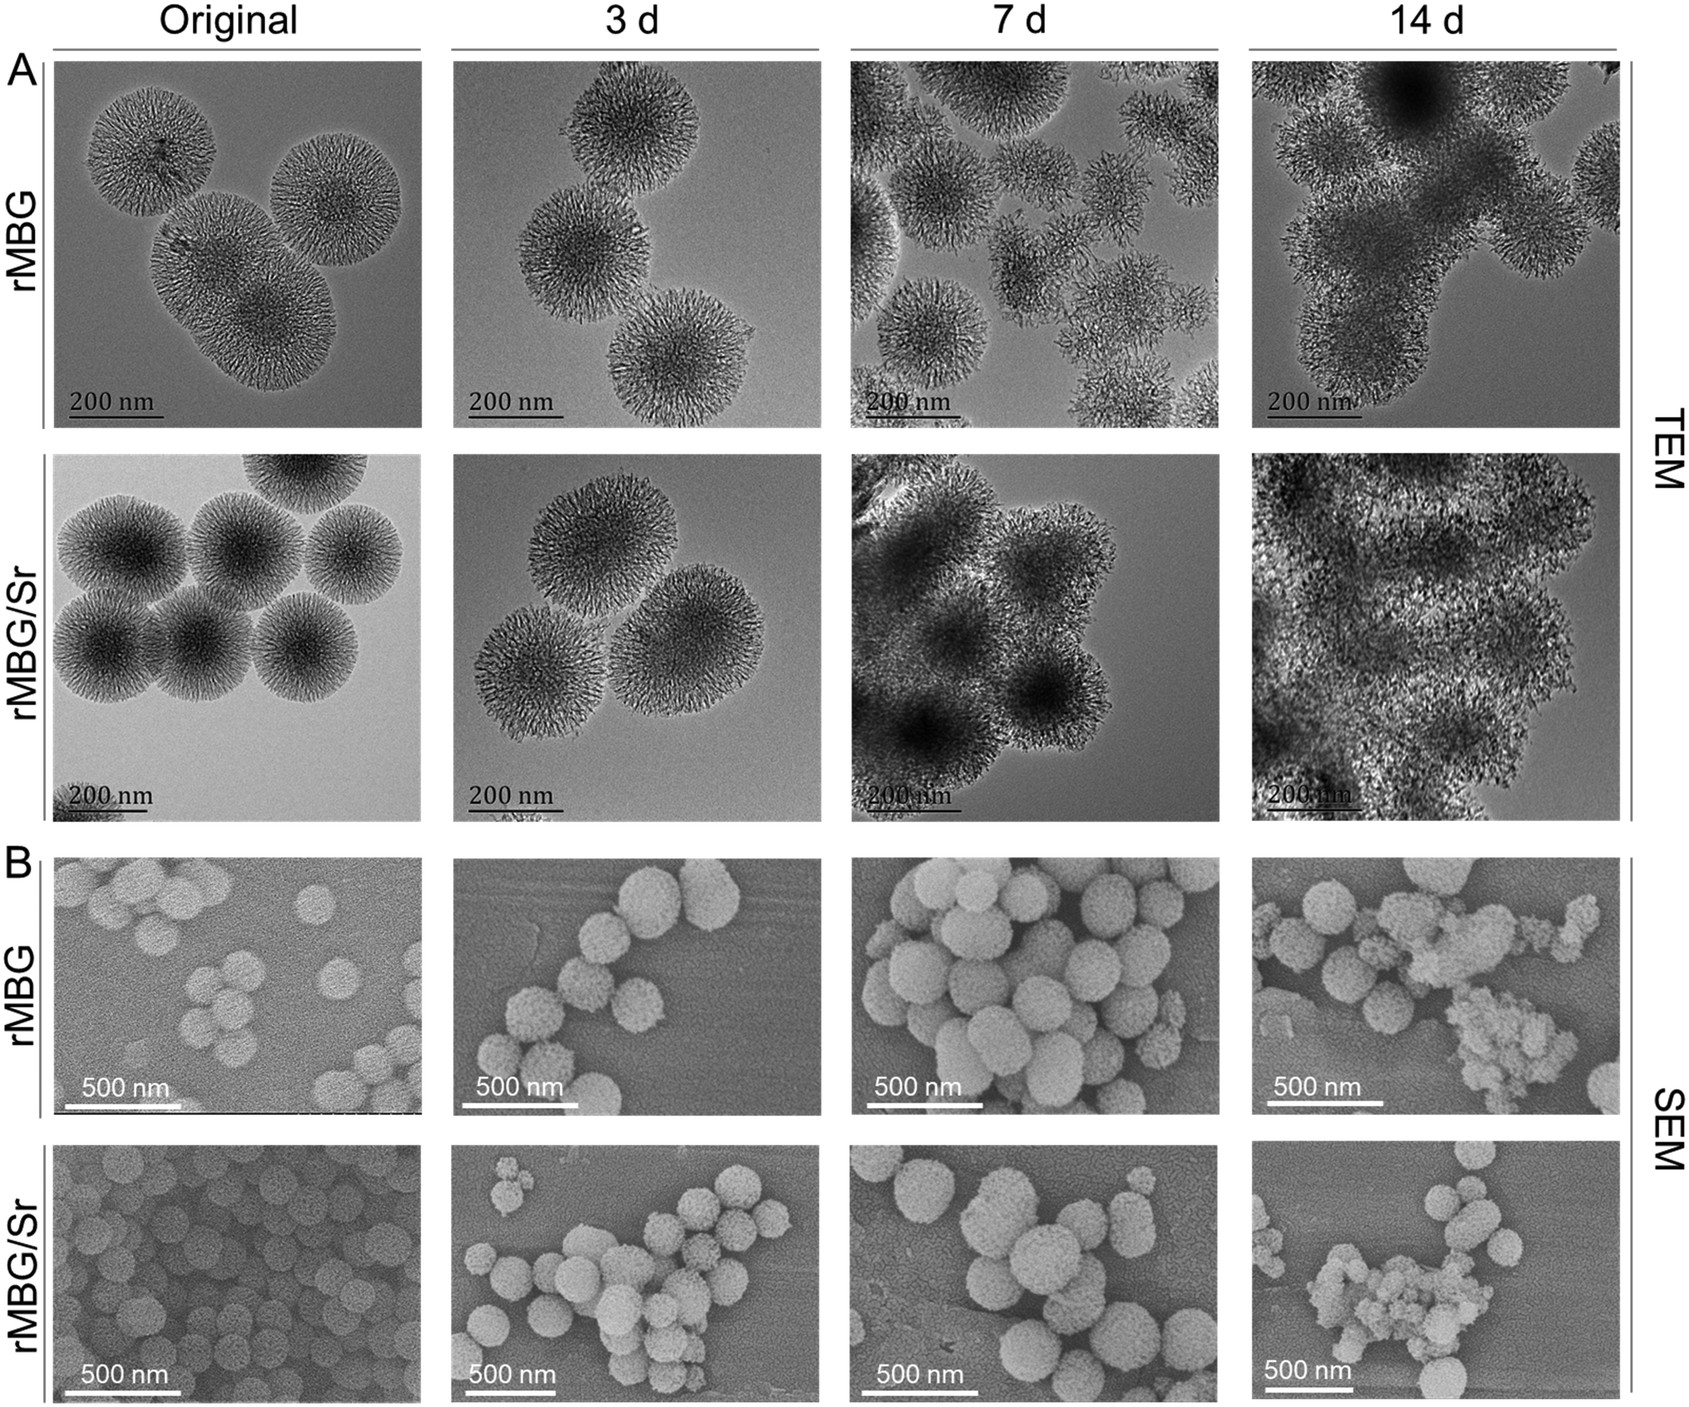 | ||
| Fig. 3 Morphological characterization of rMBG and rMBG/Sr after degradation for 3, 7 and 14 days. (A) TEM images. (B) SEM images. | ||
As shown in Fig. 3B, the SEM results were consistent with the TEM results. Both rMBG and rMBG/Sr showed a regular spherical shape, and their profiles were very clear before degradation. However, the size of the nanoparticles was smaller after 3 days of incubation, indicating that some nanoparticles were degraded. After 7 days, the surface patterns of the nanoparticles began to collapse and decompose, leading to a fluffier nanostructure. Most rMBG/Sr were degraded after 14 days, and only a small number of nanoparticles remained their morphology. The results proved that the bioglass nanoparticles prepared in this study were degradable. When used for the repair of damaged tissues in vivo, the bioglass particles can be degraded to release bioactive ions that promote the growth of cells and tissues.
3.3. Influence of bioglass nanoparticles on in vitro cell viability
Many studies have shown that the ions released from bioactive glass can stimulate cell growth and the expression of related factors, and thus promote the regeneration of tissues.53,54 In this study, the in vitro biological activity of the as-synthesized bioglass nanoparticles was evaluated. Here, three concentrations, i.e., 50, 100 and 150 μg mL−1, of rMBG were used and were denoted as rMBG-50, rMBG-100 and rMBG-150, respectively.Fig. 4A shows the cell morphology with different concentrations of rMBG after 5 days of culture. The rMBG enhanced the cell activity and most of the cells presented obvious pseudopodia even at a low rMBG concentration (50 μg mL−1 or 100 μg mL−1). Furthermore, the cells cultured with rMBG (50 and 100 μg mL−1) well-spread, bridged and interacted with each other, while compared with the blank group (without nanoparticles). However, when the concentration of the rMBG was increased to 150 μg mL−1, some cells presented round profiles with less pseudopodia compared to those at lower concentrations (50 or 100 μg mL−1), suggesting that rMBG-150 was not favorable to cell growth. Fig. 4B gives the cell viability at 1, 3 and 5 days. When different concentrations of the rMBG were co-cultured with cells, significant difference was not observed in cell viability at the initial stage (day 1). One day 5, the cell viability, particularly with the rMBG-150, was significantly lower than those with lower concentrations of the rMBG and the control. This indicates that the rapid accumulation of a larger amount of ions released by bioglass might not be beneficial to cell growth. The results were further confirmed by the NSI analysis of cells, which was done through the fluorescence images of cells on day 5 (Fig. 4C). The lower the NSI value, the more fusiform or polygonal cells tend to be, indicating the higher cell viability. The results revealed that the NSI of cells incubated with the rMBG-150 was much higher than those of cells incubated with the rMBG at lower concentrations. Based on these results, 50 μg mL−1 and 100 μg mL−1 of the rMBG were used in the migration studies.
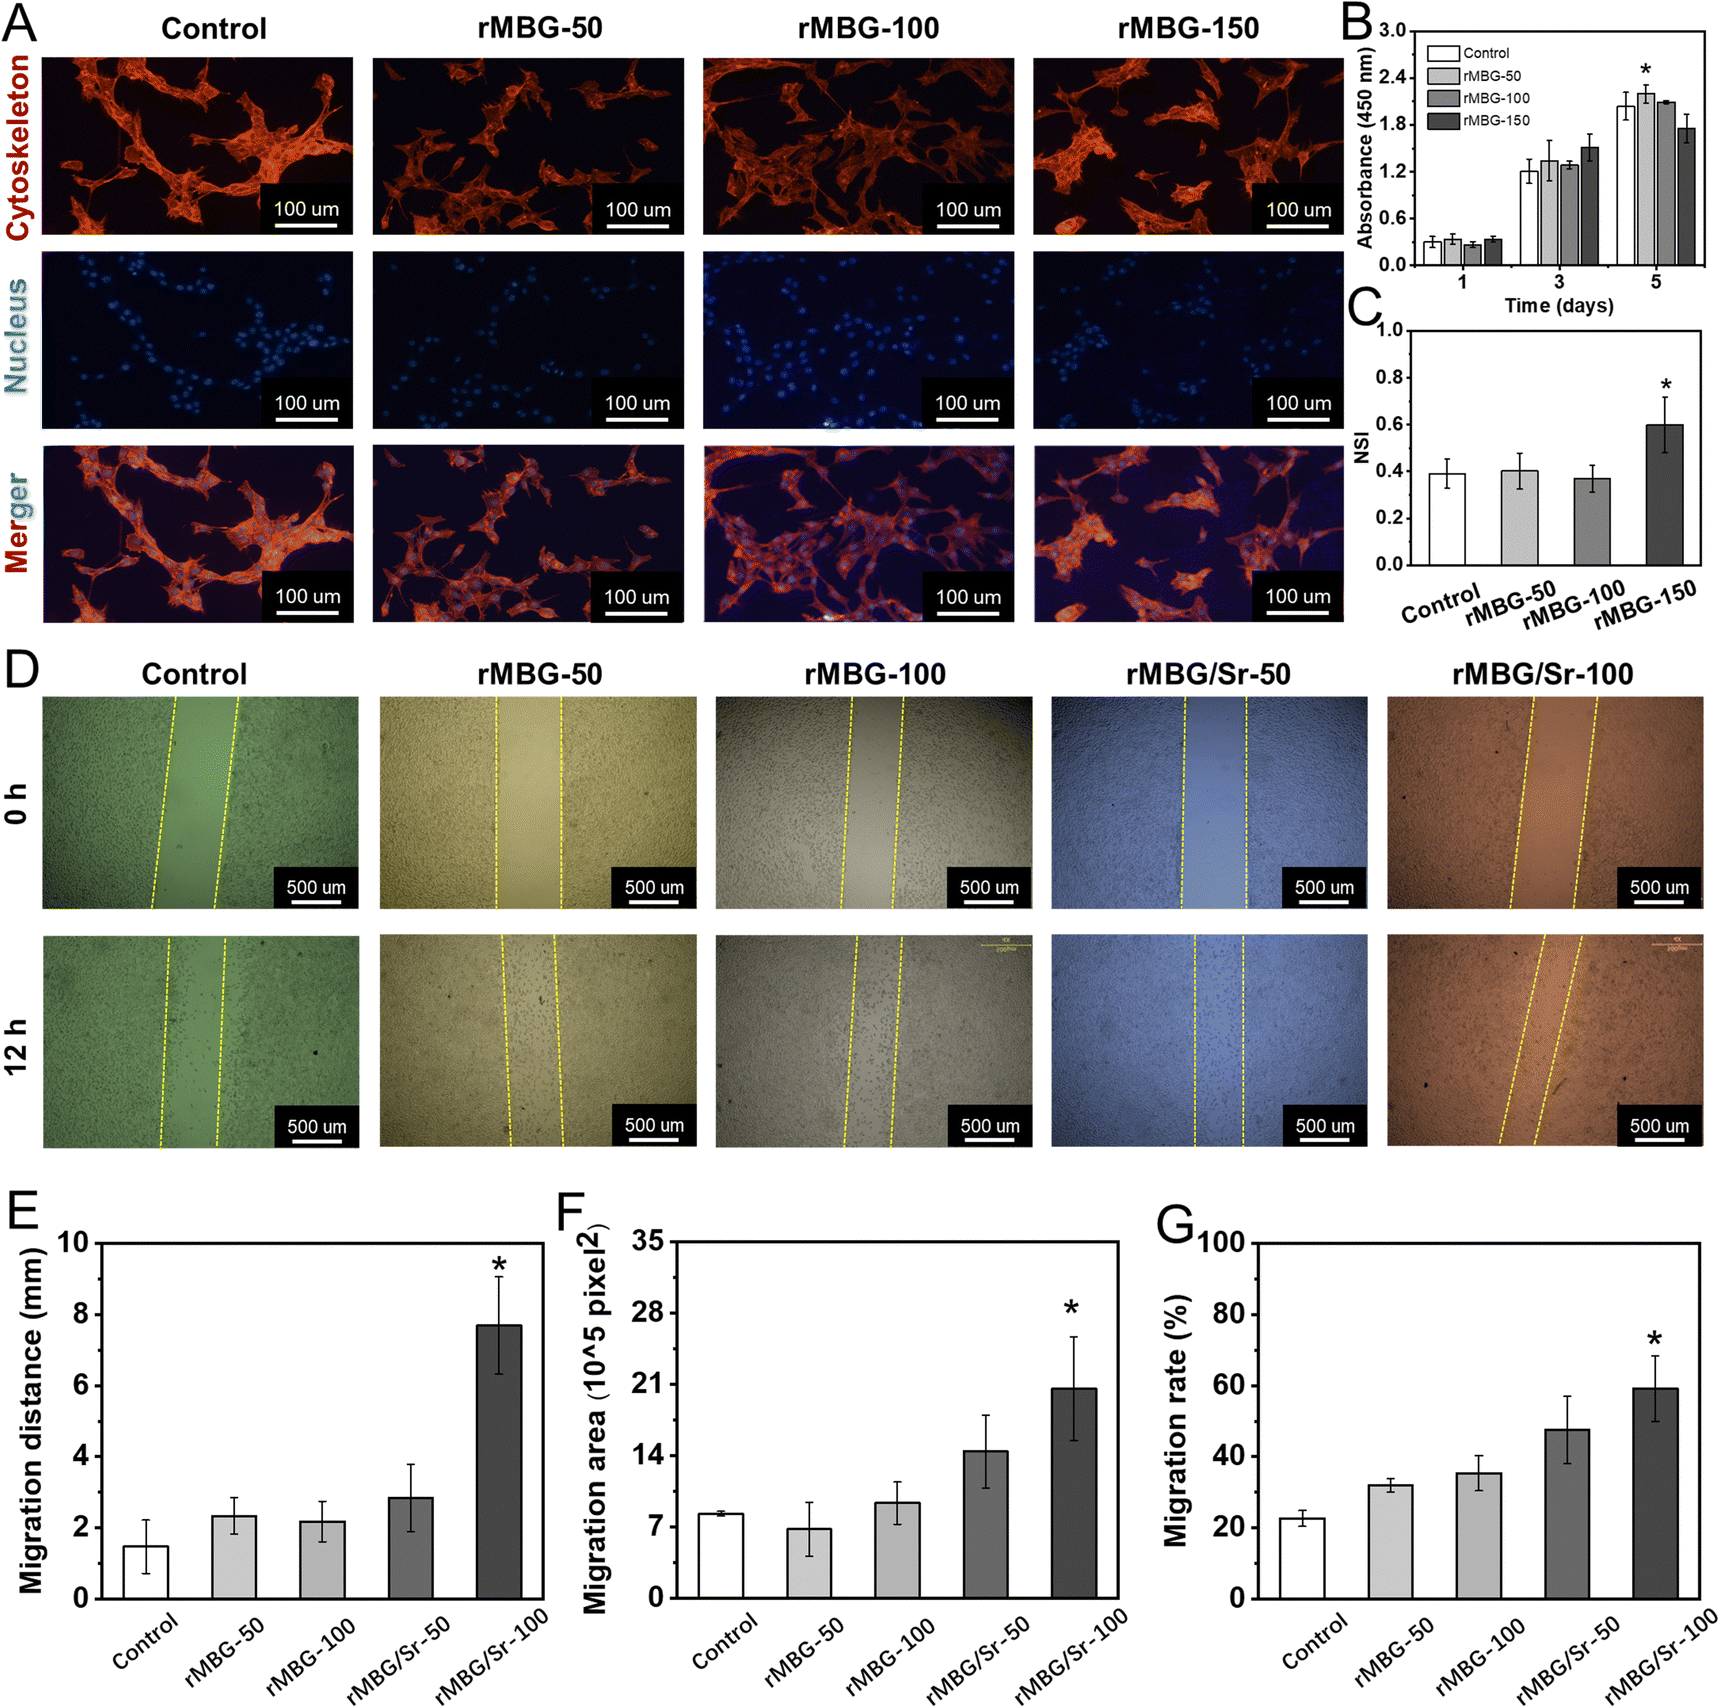 | ||
| Fig. 4 Proliferation of cells co-cultured with rMBG at different concentrations. (A) Immunofluorescent staining of NIH-3T3 after cultured for 5 days; (B) the viability of NIH-3T3 cells in the medium supplemented with different concentrations of rMBG; (C) nuclear shape index (NSI); (D) images of cell migration with bioglass nanoparticles at different concentrations; (E) migration distance, (F) migration area and (G) migration rate. * p < 0.05. | ||
Fig. 4D–G shows the migration activity of NIH-3T3 after different culture times. Compared with the control group (without bioglass), the blank areas of the culture plates with the rMBG or rMBG/Sr were significantly reduced, confirming they promoted cells to grow into the blank area. Fig. 4D showed that the cells with bioglass, either rMBG or rMBG/Sr, at a concentration of 100 μg mL−1 had higher migration activity than cells with the bioglass at a lower concentration (50 μg mL−1). Compared with the undoped rMBG, Sr doping significantly improved the migration activity, with the rMBG/Sr-100 group showing the smallest blank area after 12 h of culture. Fig. 4E–G summarizes the migration distance, migration area and migrate rate, respectively. Fig. 4E demonstrated that the migration distance of cells with rMBG-50 and rMBG-100 was about 2 mm. The migration distance was significantly larger when the bioglass nanoparticles were doped with Sr, and it reached 7.5 mm when the rMBG/Sr concentration was 100 μg mL−1. The migration area (Fig. 4F) and migration rate (Fig. 4G) of cells with rMBG/Sr were larger than those incubated with rMBG. The results confirmed that the introduction of Sr could significantly improve the activity of bioglass, which would enable it to recruit cells in the process of tissue repair, and provide a microenvironment more suitable for cell growth.
According to the cell proliferation activity, rMBG led to better cell viability at a concentration of 100 μg mL−1, and thus, this concentration was selected for further in vitro evaluation of the effects of Sr. As shown in Fig. 5A, the rMBG or rMBG/Sr was co-cultured with NIH-3T3 cells to evaluate their influence on the cellular behavior. Cells with rMBG displayed the similar pseudopodia and cell morphology to the control, while cells with rMBG/Sr were agglomerated and multiple cytoskeletons overlapped with each other. This may be explained by the fact that the release of Sr could promote the expression of cell-related genes and thus enhance intercellular connectivity, paracrine and other interactions, leading to fast growth and proliferation of cells.55,56 Cluster growth is beneficial to cell proliferation and function recovery.57 The observations indicated that doping of Sr enhanced the bioactivity of the rMBG.
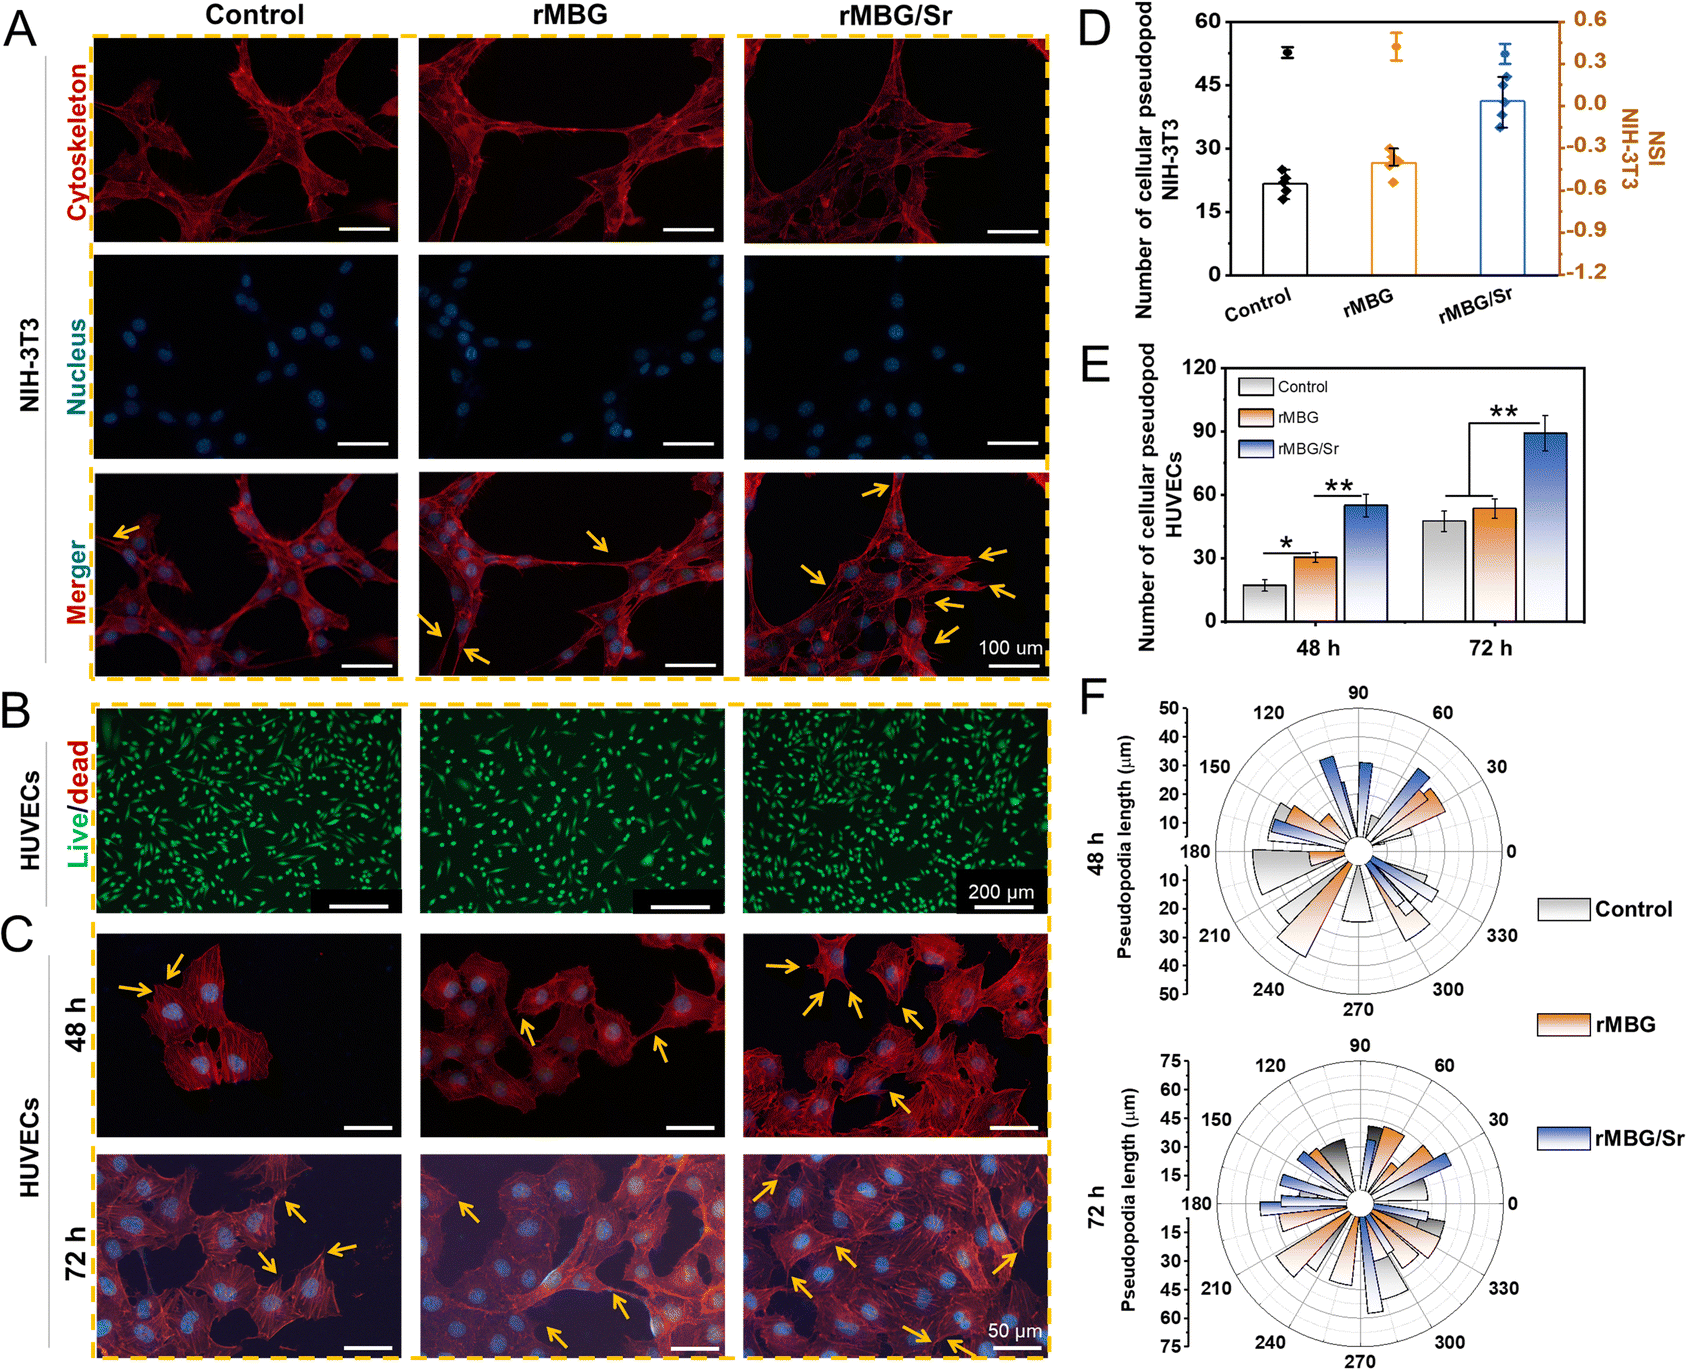 | ||
| Fig. 5 Morphology of NIH-3T3 cells and HUVECs co-cultured with rMBG and rMBG/Sr. (A) Fluorescence images of NIH-3T3 co-cultured for 12 h with rMBG or rMBG/Sr, all the scale bars represent 100 μm; (B) live/dead cell staining of HUVECs after culture for 3 days, all the scale bars represent 200 μm; (C) fluorescence images of HUVECs co-cultured for 48 h and 72 h, all the scale bars represent 50 μm; (D) number of cellular pseudopod and NSI of NIH-3T3 co-culture with control, rMBG and rMBG/Sr; (E) number of cellular pseudopod of HUVECs; (F) The extension direction and length of pseudopodia of HUVECs co-culture with control, rMBG and rMBG/Sr. * p < 0.05, ** p < 0.01. | ||
Fluorescence staining was used to evaluate further the influence of Sr on the viability of HUVECs (one of the most important cell lines in wound repair), with the concentration of rMBG and rMBG/Sr being fixed at 100 μg mL−1 (Fig. 5B and C).58 Cell live/dead staining results demonstrated that the cells in control, rMBG and rMBG/Sr groups maintained high viability after 3 days of culture, demonstrating the excellent cytocompatibility of the rMBG and rMBG/Sr. Further, a large number of cell pseudopodia were observed in the rMBG and rMBG/Sr groups, which were not seen clearly in the control group after 2 and 3 days of culture, as shown in the fluorescence images (Fig. 5C).
Quantitative statistical analysis of pseudopodia of NIH-3T3 and HUVECs are shown in Fig. 5D and E, respectively. It is well known that pseudopodia are very important for the change of cell polarity, improvement of cell growth, and division ability.59 Generally, a high number and better morphology of pseudopods is an indicator of the higher viability of a cell.6 According to the statistical results, the number of pseudopods of cells cultured with rMBG/Sr was much bigger than those of the control group and the cells with rMBG, and the NSI of cells with the rMBG/Sr was lower. These results indicated that cells with the rMBG/Sr group had better morphology and higher viability. To further verify the effect of Sr on cell growth and behavior, the extension direction and length of pseudopodia of HUVECs were calculated at different time points (Fig. 5F). The results showed that the length of cell pseudopodia increased with a longer culture time. At the initial stage of culture, the pseudopodia of the three groups tended to grow in the same direction, rather than extending uniformly in all directions. However, with an increase in the culture time, cell pseudopodia spread more evenly in both rMBG and rMBG/Sr groups. This indicated that rMBG and rMBG/Sr could promote cell spreading and be more conducive to cell growth through cell endocytosis effect (Fig. S5, ESI†).60,61
3.4. Tube formation in vitro
It is very important to promote the microvascularization for essential nutrient supply for fast wound healing. Tube formation assay (Fig. 6) reflects the early process of microvascular formation and is a primary indicator of endothelial cell function in vitro.61,62Fig. 6A shows that, compared with the control group, the rMBG and rMBG/Sr groups showed more tube-like structures, where cells formed a network with an increase in the culture time. Notably, many tube-like structures were clearly observed in the rMBG/Sr group after only 2 h of culture. After 8 h of culture, the networks of tube-like structures were observed clearly, especially in the rMBG/Sr group (Fig. 6B). The results demonstrated that Sr promoted the HUVEC microvascularization, which is very important for the healing of wounds.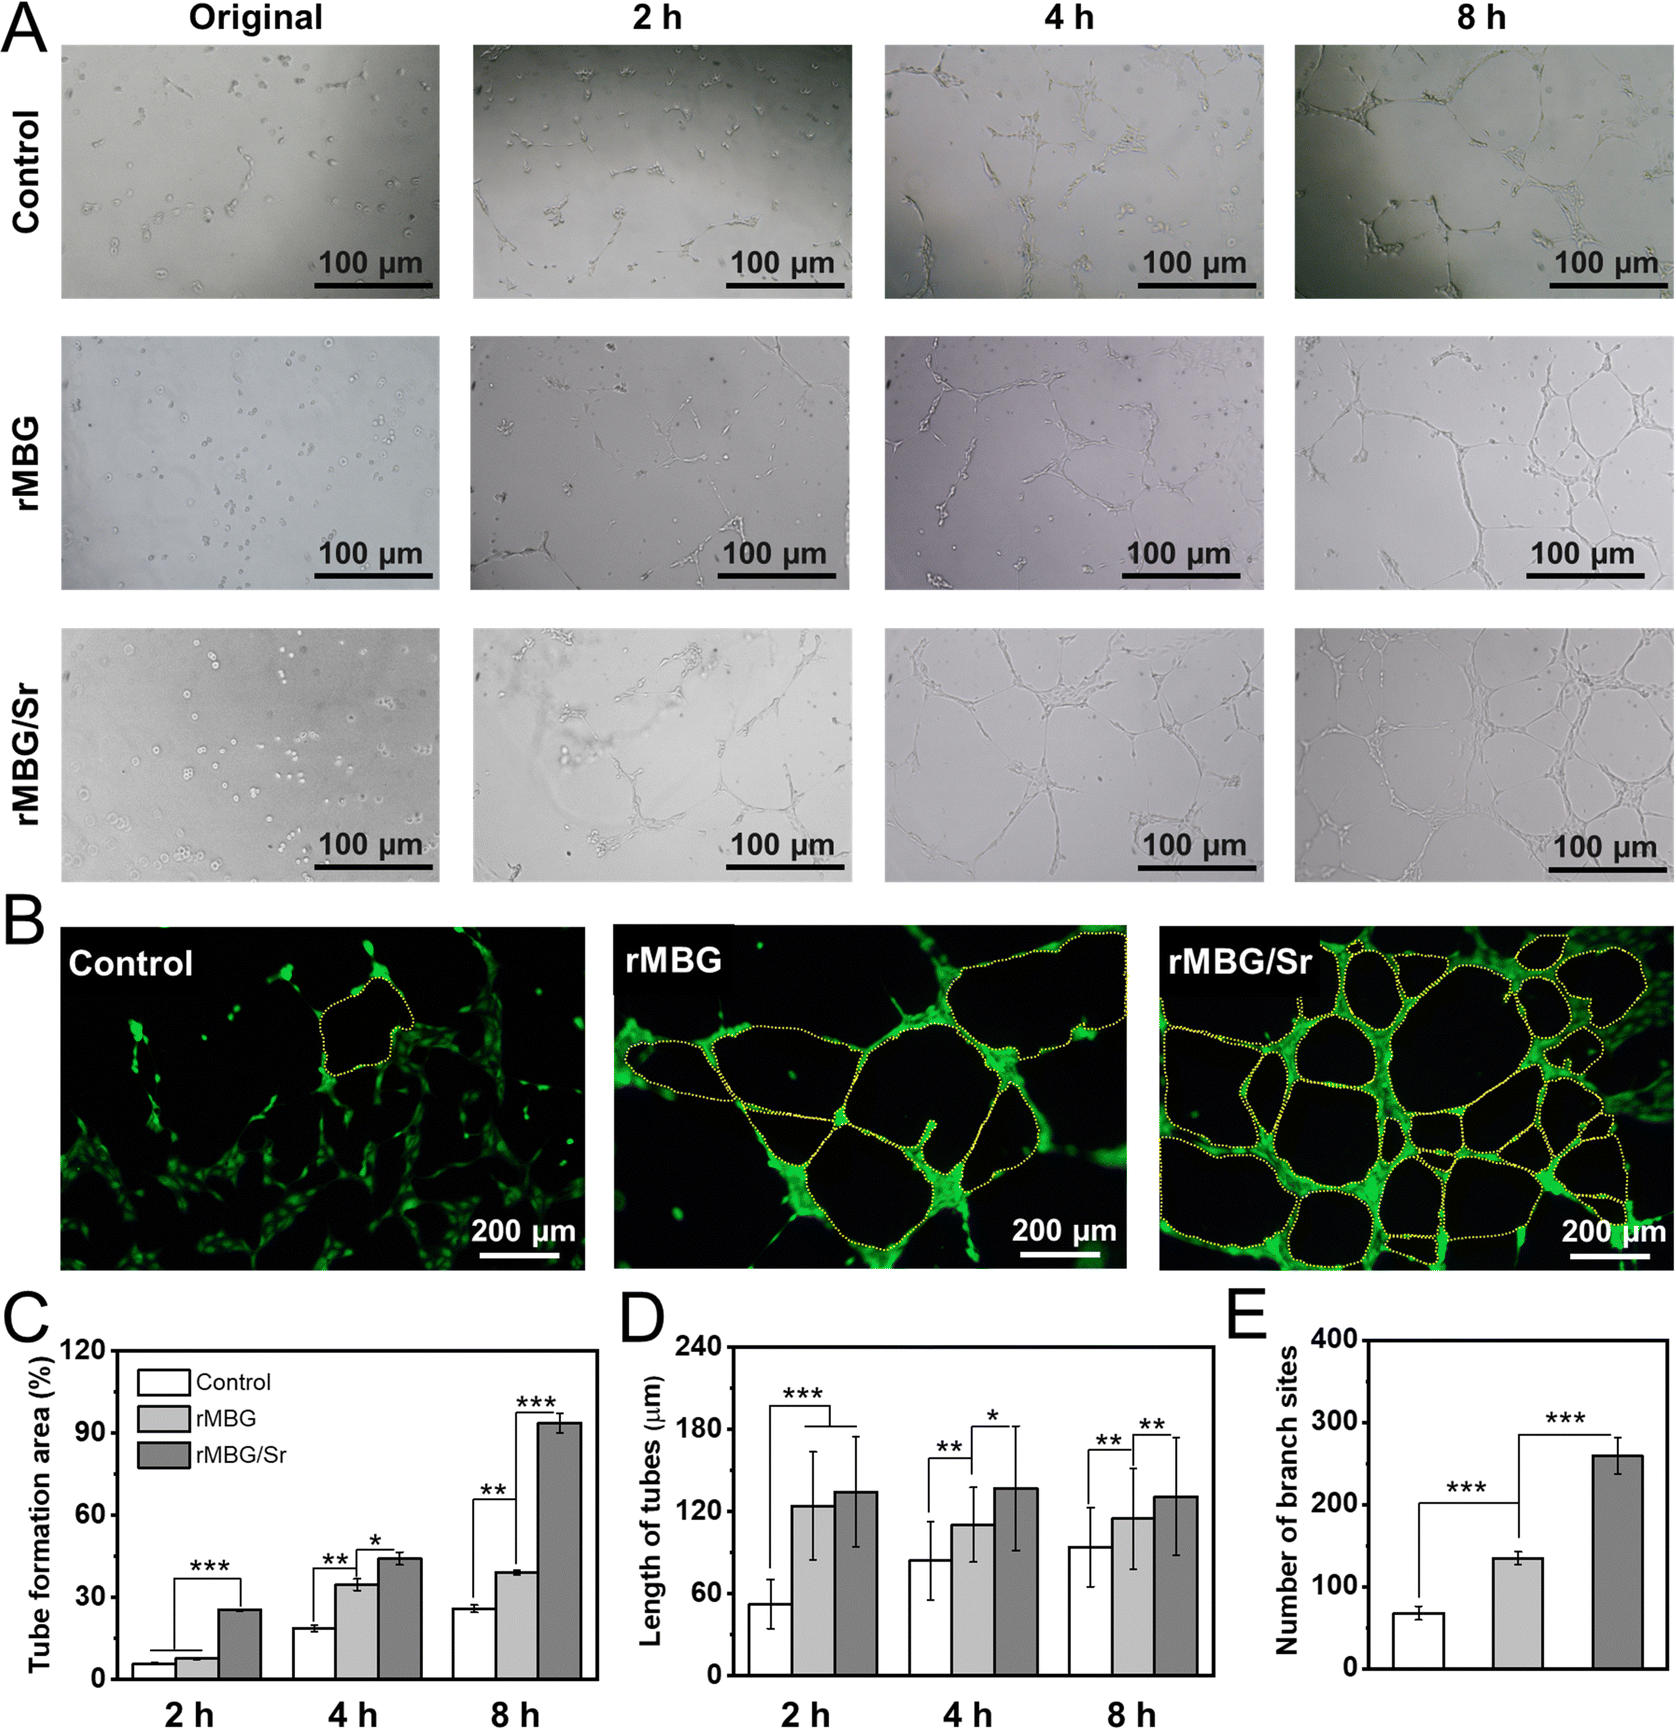 | ||
| Fig. 6 Effect of bioglass on tube formation of HUVECs. (A) Images of tube formation of cells with different culture time; (B) immunofluorescent staining of HUVECs tube formation after culturing for 8 h; (C) quantitative analysis of tube formation area; (D) quantitative analysis of HUVECs tube length and (E) number of branch sites. * p < 0.05, ** p < 0.01, *** p < 0.001. | ||
The quantitative statistics of tube formation further confirmed the observations above (Fig. 6C–E). The tube area and tube length of both bioglass groups, in particular the rMBG/Sr group, were larger compared with the control group. The area of tube formation in the rMBG/Sr group was around 93% after 8 h of culture. Notably, cells with the rMBG/Sr showed more branch sites of tubes, suggesting that the rMBG/Sr might provide more active sites to promote endothelial cell recruitment during the wound repair process in vivo.
3.5. In vivo wound healing assay
With the potential for promoting in vitro microvascularization demonstrated above, the ability of the bioglass nanoparticles to promote wound healing was examined using a full-thickness skin defect model, where the bioglass nanoparticles was loaded into SF porous sponges for preparation of wound dressings. The healing process of wounds within 14 days was shown in Fig. 7. The wound area of each group gradually decreased over time, and the SF/rMBG/Sr had the smallest wound area with thinnest scab on days 3, 7, 10 and 14, indicating the fastest healing rate (Fig. 7A and C). With the rapid degradation of SF sponge, bioglass nanoparticles were released into the wounds to accelerate the healing process. On day 14, the ratio of unclosed wound area was less than 5% in the SF/rMBG/Sr group, and there was no significant difference between the regenerated skin on the wound and the surrounding skin (Fig. 7A, C and Fig. S6, ESI†). In contrast, the SF/rMBG group showed a smaller unhealed wound area on days 7, 10 and 14, compared to the control and SF groups. These results demonstrated the important role of loaded rMBG in promoting wound healing, and the introduction of Sr into the rMBG could significantly accelerate the healing process.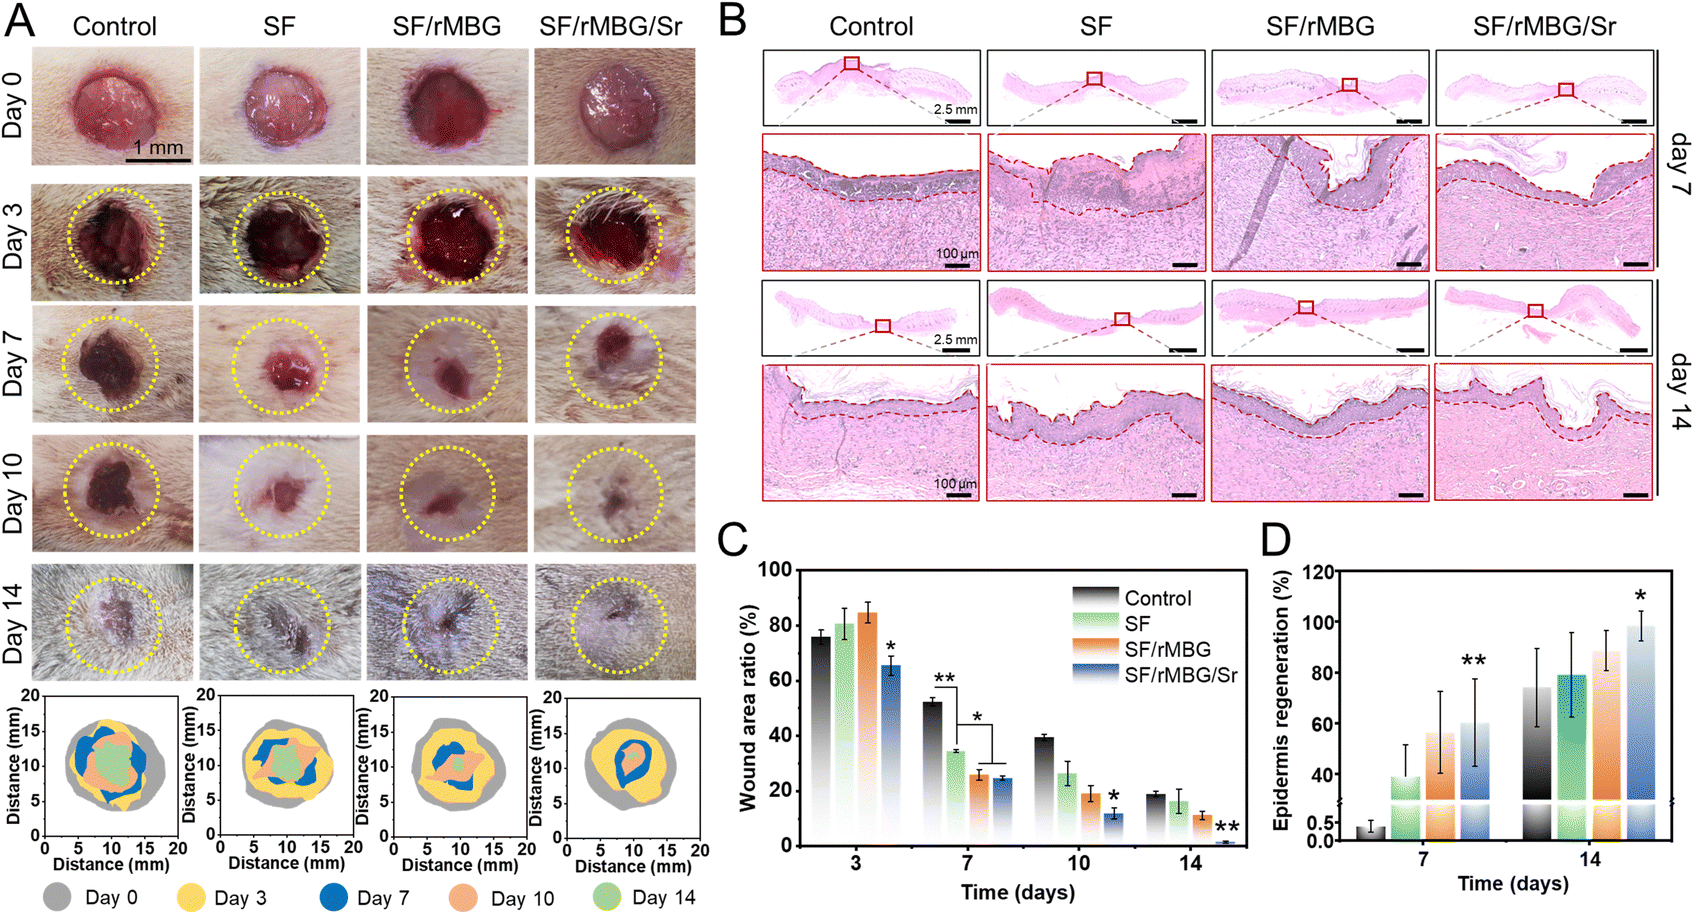 | ||
| Fig. 7 The effects of silk fibroin sponge loaded with bioglass nanoparticles on in vivo skin wound healing. (A) Photograph of in vivo wound healing on day 0, 3, 7, 10 and 14, the bottom of images exhibited the wound traces of the healing process; (B) HE staining after implantation on day 7 and 14, all the images are on the same scale; (C) analysis healing area of wounds; (D) epidermis regeneration of wounds. * p < 0.05, ** p < 0.01, *** p < 0.001. | ||
Wound healing consists of multiple stages including hemostasis, inflammation, proliferation and remodeling.63–65 Hematoxylin and eosin (HE) staining, one of the most widely used histological techniques, was utilized in this study to observe wound repair and evaluate the ability of the bioglass nanoparticles to promote tissue regeneration (Fig. 7B). On day 7, there were a large number of inflammatory cells (indicated by the dark purple color) and thick layers of fibroblasts in the control and SF groups. It is noteworthy that there was no obvious inflammatory cell infiltration in both SF/rMBG and SF/rMBG/Sr groups, indicating that they had transitioned from the inflammatory stage to the proliferation stage and the cuticle began to form. On day 14, the wounds in all groups had scab healed and the upper cortex tended to be complete. For the SF/rMBG/Sr group, the regenerated epithelium of the wound site was more regular than those of the other groups, and the regeneration rate of defect epithelium was up to around 100% (Fig. 7B). In addition, the epithelium thickness of SF/rMBG/Sr was similar with an autogenous tissue (Fig. S6, ESI†), further confirming the effective repair of wounds. Fig. 7C and D show the proportion of the wound area and the regenerated wound epithelium at different times. The results in Fig. 7 demonstrated that the SF/rMBG/Sr enabled the fastest repair and the best epidermis regeneration at different time points, and thus, have a great potential for wound healing application. This could be attributed to the bioactive ions, in particular Sr2+ released from the biodegraded bioglass.
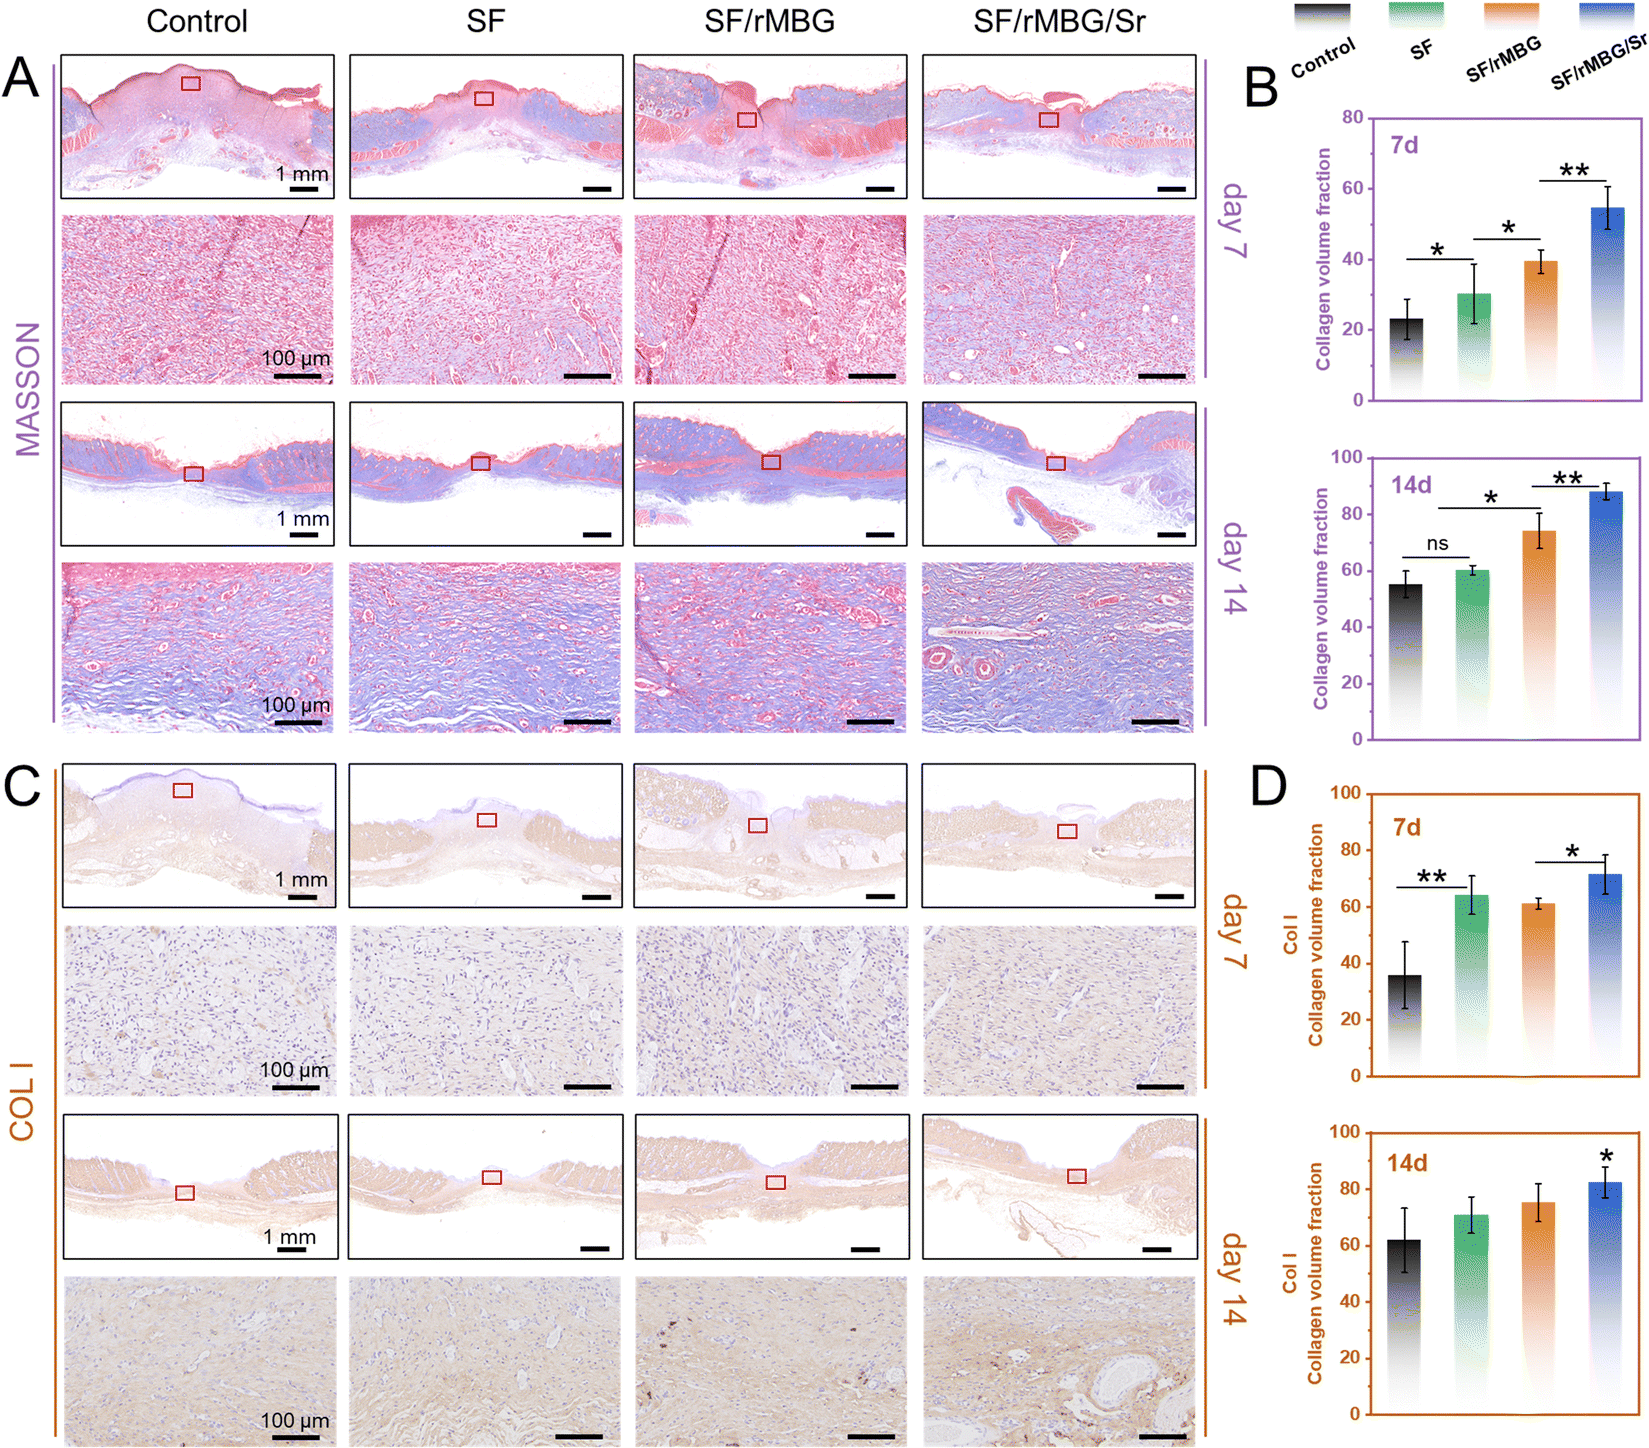
The formation and arrangement of collagen are crucial to wound repair.45 The collagen of regenerated tissues in the wound sites was evaluated by Masson and immunohistochemical staining in this study, where collagen was stained in blue (Fig. 8). As shown in Fig. 8A and B, the deposition of collagen was observed in the SF/rMBG/Sr group while it was not clear in the other groups on day 7. After 14 days, the deposition of collagen was clearly shown in all groups, whereas more typically packed collagen fibers with ordered arrangement were presented in the SF/rMBG/Sr group. Quantitative statistics also showed that an increase in the collagen volume fraction (CVF) with incorporation of bioglass, and the SF/rMBG/Sr group presented the highest CVF, significantly different from the other groups. As the most important collagen type in skin, Col I is the main structural protein of skin tissue, accounting for more than 80% of the total collagen. The deposition of Col I is an important indicator of the wound repair process.66,67Fig. 8C and D showed the immunohistochemical staining results and qunatitative statistics of Col I, respectively. Clearly, the collagen content increased with time, and the Col I arrangement in the SF/rMBG/Sr group was similar to that of autologous tissues after 14 days (Fig. S7, ESI†), which proved that Sr had a positive effect on tissue repair.
 | ||
| Fig. 8 Collagen staining of tissues for epithelialization analysis. (A) Masson's trichrome staining of the untreated defects (control) and the defects treated with SF, SF/rMBG and SF/rMBG/Sr at 7 and 14 days, the images on each row are on the same scale. (B) Quantitative statistics of collagen volume fraction (CVF) at day 7 and 14. (C) Immumohistochemical staining (Col I) of the untreated defects (control) and the defects treated with SF, SF/rMBG and SF/rMBG/Sr at 7 and 14 days, the images on each row are on the same scale. (D) Quantitative statistics of Col I at day 7 and 14. * p < 0.05, ** p < 0.01. | ||
Vascularization is an important process of wound repair, and promoting rapid vascularization plays a crucial role in wound healing.68 In this study, the formation of vascularization marker CD31/α-SMA was observed by fluorescence staining to evaluate the effect of the rMBG/Sr on angiogenesis (Fig. 9). At the early stage of remodeling, granulation tissue and epidermal cells will appear hyperplasia and transition with the degradation of rMBG/Sr, and the number of capillaries in the damaged tissue will increase rapidly.7,10Fig. 9A shows the new capillaries of regenerated tissue in the wound site on days 7 and 14. The growth of new blood vessels in the SF/rMBG/Sr group was the most dense compared with other groups. In addition, the size of blood vessels increased significantly on day 14 compared with that on day 7, and the morphology of blood vessels was more prominent. These differences are likely due to the release of a large amount of VEGF from inflammatory cells in the early stage of wound healing, which accelerated the division and proliferation of endothelial cells and forms lumen. As a result, the degree of hypoxia in the wound tissue would be relieved with capillary angiogenesis, and endothelial cells would reconnect and reshape the new blood vessels.
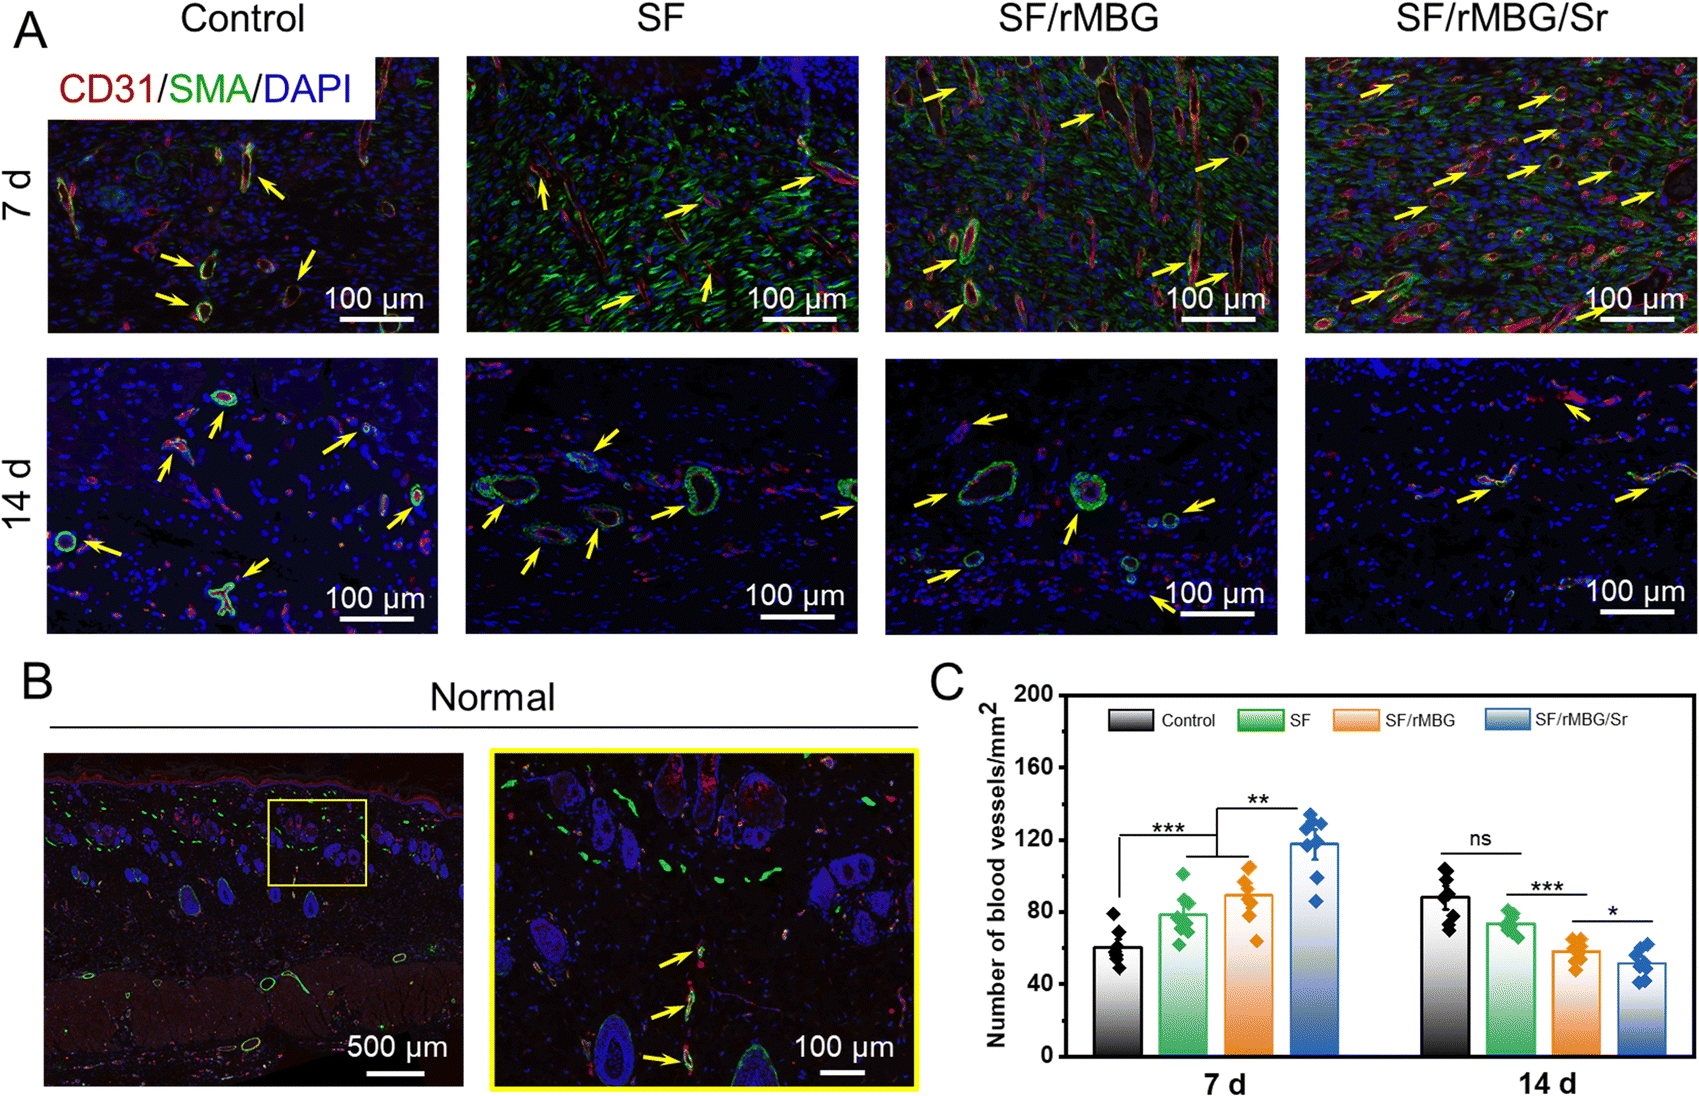 | ||
| Fig. 9 Immunofluorescence staining of tissue for angiogenesis analysis. (A) Immunofluorescence staining for CD31/α-SMA after implantation on day 7 and 14. (B) Immunofluorescence staining of normal tissue. (C) Quantitative statistics of vessel area and number after implantation on day 7 and 14. The yellow arrows point to the micro blood vessel. * p < 0.05, ** p < 0.01, *** p < 0.001. | ||
After 14 days, apart from the gauze control group, the number of blood vessels in other groups was significantly reduced compared with that of on day 7 (Fig. 9B and C). This is probably because the rapid vascularization process during the proliferative period had been completed. The wound healing entered the remodeling stage after 7 days, and the number of blood vessels gradually stabilized during this process. Moreover, the vascular morphology of the SF/rMBG/Sr group was more like that of autologous normal tissue (Fig. 9B), which proved the ability of Sr to promote angiogenesis.
4. Conclusions
This work explored the potential of a new type of functional mesoporous bioglass nanoparticles for wound healing applications. The morphology and physicochemical properties of mesoporous bioglass nanoparticles were manipulated by controlling the reaction conditions. In vitro cell studies demonstrated that a low concentration of the bioglass nanoparticles could promote cell growth, while Sr doping further improved the biological activity of the nanoparticles. Silk fibroin sponge carrying the bioglass nanoparticles, especially those doped with Sr, significantly promoted the deposition of collagen, regeneration of blood vessels and epithelial reconstruction, and thus, accelerated the healing of wounds. This work provides a strategy for the design and development of functional bioactive dressings for wound healing.Author contributions
Juan Du: conceptualization, methodology, data curation, investigation, writing – orginal draft, writing – review & editing. Linpeng Fan: supervision, writing – review & editing. Joselito M. Razal: writing – review & editing. Sihao Chen: supervision. Hongmei Zhang: supervision, writing – review & editing, funding acquisition. Hongjun Yang: writing – review & editing. Haiyan Li: writing – review & editing. Jingliang Li: conceptualization, supervision, project administration, writing – review & editing.Conflicts of interest
There are no conflicts to declare.Acknowledgements
Support from the Science and Technology Commission of Shanghai Municipality (20DZ2255900) is acknowledged.References
- P. Pleguezuelos-Beltran, P. Galvez-Martin, D. Nieto-Garcia, J. A. Marchal and E. Lopez-Ruiz, Bioact. Mater., 2022, 16, 187–203 CrossRef CAS PubMed.
- M. Sheikholeslam, M. E. E. Wright, M. G. Jeschke and S. Amini-Nik, Adv. Healthcare Mater., 2018, 7, 270–295 CrossRef PubMed.
- J. Zhu, H. Zhou, E. M. Gerhard, S. Zhang, F. I. Parra Rodriguez, T. Pan, H. Yang, Y. Lin, J. Yang and H. Cheng, Bioact. Mater., 2023, 19, 360–375 CrossRef PubMed.
- Z. Wang, W. Hu, W. Wang, Y. Xiao, Y. Chen and X. Wang, Adv. Fiber Mater., 2022, 5, 107–129 CrossRef.
- J. Qin, M. Li, M. Yuan, X. Shi, J. Song, Y. He, H. Mao, D. Kong and Z. Gu, ACS Appl. Mater. Interfaces, 2022, 14, 22426–22442 CrossRef CAS PubMed.
- H. Li, Y. Guo, B. Ma, Y. Qian, W. Sun and X. Zhou, J. Appl. Polym. Sci., 2023, 140, e53352 CrossRef CAS.
- Y. Lu, C. Jia, C. Gong, H. Wang, Q. Xiao, J. Guo, D. Ni and N. Xu, Nano Res., 2023, 16, 5368–5375 CrossRef CAS.
- J. Mao, L. Chen, Z. Cai, S. Qian, Z. Liu, B. Zhao, Y. Zhang, X. Sun and W. Cui, Adv. Funct. Mater., 2021, 32, 2111003 CrossRef.
- L. Fan, C. Xiao, P. Guan, Y. Zou, H. Wen, C. Liu, Y. Luo, G. Tan, Q. Wang, Y. Li, P. Yu, L. Zhou and C. Ning, Adv. Healthcare Mater., 2022, 11, e2101556 CrossRef PubMed.
- H. R. Moreira and A. P. Marques, Curr. Opin. Biotechnol, 2022, 73, 253–262 CrossRef CAS.
- G. Theocharidis, H. Yuk, H. Roh, L. Wang, I. Mezghani, J. Wu, A. Kafanas, M. Contreras, B. Sumpio, Z. Li, E. Wang, L. Chen, C. F. Guo, N. Jayaswal, X. L. Katopodi, N. Kalavros, C. S. Nabzdyk, I. S. Vlachos, A. Veves and X. Zhao, Nat. Biomed. Eng., 2022, 6, 1118–1133 CrossRef CAS PubMed.
- Y. Duan, S. Yu, P. Xu, X. Wang, X. Feng, Z. Mao and C. Gao, Acta Biomater., 2019, 96, 137–148 CrossRef CAS PubMed.
- Y. Cheng, G. Cheng, C. Xie, C. Yin, X. Dong, Z. Li, X. Zhou, Q. Wang, H. Deng and Z. Li, Adv. Healthcare Mater., 2021, 10, e2001646 CrossRef PubMed.
- F. Zhao, Z. Yang, H. Xiong, Y. Yan, X. Chen and L. Shao, Bioact. Mater., 2023, 22, 201–210 CrossRef CAS PubMed.
- X. Sheng, C. Li, Z. Wang, Y. Xu, Y. Sun, W. Zhang, H. Liu and J. Wang, Mater. Today Bio., 2023, 100636 CrossRef CAS.
- G. A. Filip, M. Achim, P. Mihalte, M. O. Miclaus, C. Cristea, G. Melinte, B. Gheban, D. M. Munteanu, O. Cadar, I. Simon, O. Pana, L. Barbu Tudoran, S. Clichici and R. Stefan, J. Trace Elem. Med. Biol., 2021, 68, 126846 CrossRef CAS PubMed.
- X. Wei, P. Zhuang, K. Liu, W. Hou, Y. Zhao, W. Wei, R. Tu, H. Li and H. Dai, J. Mater. Chem. B, 2022, 10, 10139–10149 RSC.
- H. Li, J. He, H. Yu, C. R. Green and J. Chang, Biomaterials, 2016, 84, 64–75 CrossRef CAS PubMed.
- Y. Su, M. Cappock, S. Dobres, A. J. Kucine, W. C. Waltzer and D. Zhu, Eng. Reg., 2023, 4, 170–182 Search PubMed.
- H. Li, Z. Wu, Y. Zhou and J. Chang, Biomaterials for Skin Repair and Regeneration, Elsevier, 2019, pp. 225–250 Search PubMed.
- Q. Dai, Q. Li, H. Gao, L. Yao, Z. Lin, D. Li, S. Zhu, C. Liu, Z. Yang, G. Wang, D. Chen, X. Chen and X. Cao, Biomater. Sci., 2021, 9, 5519–5532 RSC.
- M. Liao, S. Zhu, A. Guo, X. Han, Q. Li, Y. Chen, Y. Liu, D. Chen, X. Chen, S. Mo and X. Cao, Composites, Part B, 2023, 254, 110582 CrossRef CAS.
- M. T. Matter, F. Starsich, M. Galli, M. Hilber, A. A. Schlegel, S. Bertazzo, S. E. Pratsinis and I. K. Herrmann, Nanoscale, 2017, 9, 8418–8426 RSC.
- A. Younas, Z. Dong, Z. Hou, M. Asad, M. Li and N. Zhang, Carbohydr. Polym., 2023, 306, 120593 CrossRef CAS PubMed.
- X. Yu, X. Wang, D. Li, R. Sheng, Y. Qian, R. Zhu, X. Wang and K. Lin, Chem. Eng. J., 2022, 433, 132799 CrossRef CAS.
- X. Zhang, J. Cui, L. Cheng and K. Lin, J. Mater. Chem. B, 2021, 9, 3489–3501 RSC.
- Y. Liu, B. Zhang, F. Liu, Y. Qiu, W. Mu, L. Chen, C. Ma, T. Ye and Y. Wang, Eng. Reg., 2022, 3, 339–351 Search PubMed.
- Y. Li, X. Zhang, D. He, Z. Ma, K. Xue and H. Li, Acta Biomater., 2022, 145, 372–389 CrossRef CAS PubMed.
- N. S. Kajave, T. Schmitt, T. U. Nguyen, A. K. Gaharwar and V. Kishore, Biomed. Mater., 2021, 16, 035003 CrossRef CAS PubMed.
- B. Karakuzu-Ikizler, P. Terzioglu, Y. Basaran-Elalmis, B. S. Tekerek and S. Yucel, Bioact. Mater., 2020, 5, 66–73 CrossRef PubMed.
- A. K. Singh, K. Pramanik and A. Biswas, Mater. Technol., 2019, 34, 818–826 CrossRef CAS.
- R. Ravarian, X. Zhong, M. Barbeck, S. Ghanaati, C. J. Kirkpatrick, C. M. Murphy, A. Schindeler, W. Chrzanowski and F. Dehghani, ACS Nano, 2013, 7, 8469–8483 CrossRef CAS.
- P. Naruphontjirakul, S. Li, A. Pinna, F. Barrak, S. Chen, A. N. Redpath, S. M. Rankin, A. E. Porter and J. R. Jones, Biomater. Adv., 2022, 133, 112610 CrossRef PubMed.
- Y. Chen, M. Ye, X. Wang, W. Li and W. Chen, Biomater. Adv., 2022, 136, 212803 CrossRef CAS.
- M. Xie, L. Lian, X. Mu, Z. Luo, C. E. Garciamendez-Mijares, Z. Zhang, A. Lopez, J. Manriquez, X. Kuang, J. Wu, J. K. Sahoo, F. Z. Gonzalez, G. Li, G. Tang, S. Maharjan, J. Guo, D. L. Kaplan and Y. S. Zhang, Nat. Commun., 2023, 14, 210 CrossRef CAS PubMed.
- L. Xu, Z. Zhang, A. M. Jorgensen, Y. Yang, Q. Jin, G. Zhang, G. Cao, Y. Fu, W. Zhao, J. Ju and R. Hou, Mater. Today Bio., 2023, 18, 100550 CrossRef CAS PubMed.
- L. Fan, J. L. Li, Z. Cai and X. Wang, Nat. Commun., 2021, 12, 2375 CrossRef CAS PubMed.
- S. J. Kim, Y. Choi, K. T. Min and S. Hong, Pharmaceutics, 2022, 14, 985 CrossRef CAS PubMed.
- J. Du, T. Zhu, H. Yu, J. Zhu, C. Sun, J. Wang, S. Chen, J. Wang and X. Guo, Appl. Surf. Sci., 2018, 447, 269–278 CrossRef CAS.
- L. Fan, J. L. Li, Z. Cai and X. Wang, ACS Nano, 2018, 12, 5780–5790 CrossRef CAS PubMed.
- J. Javadi, G. Heidari-Hamedani, A. Schmalzl, T. Szatmari, M. Metintas, P. Aspenstrom, A. Hjerpe and K. Dobra, Cancers, 2021, 13, 655 CrossRef CAS PubMed.
- M. Luo, Y. Wang, C. Xie and B. Lei, Adv. Healthcare Mater., 2022, 11, e2200722 CrossRef PubMed.
- B. Cui, C. Zhang, B. Gan, W. Liu, J. Liang, Z. Fan, Y. Wen, Y. Yang, X. Peng and Y. Zhou, Mater. Sci. Eng., C, 2020, 109, 110611 CrossRef CAS PubMed.
- J. Yang, W. Zeng, P. Xu, X. Fu, X. Yu, L. Chen, F. Leng, C. Yu and Z. Yang, Acta Biomater., 2022, 140, 206–218 CrossRef CAS PubMed.
- D. Cai, S. Chen, B. Wu, J. Chen, D. Tao, Z. Li, Q. Dong, Y. Zou, Y. Chen, C. Bi, D. Zu, L. Lu and B. Fang, Mater. Today Bio., 2021, 12, 100127 CrossRef CAS PubMed.
- S. Zhu, Q. Dai, L. Yao, Z. Wang, Z. He, M. Li, H. Wang, Q. Li, H. Gao and X. Cao, Composites, Part B, 2022, 231, 109569 CrossRef CAS.
- Y. Lu, Y. Yang, L. Xiao, S. Li, X. Liao and H. Liu, BioMed Res. Int., 2021, 2021, 6695663 Search PubMed.
- M. F. M. A. Zamri, R. Bahru, R. Amin, M. U. Aslam Khan, S. I. A. Razak, S. A. Hassan, M. R. A. Kadir and N. H. M. Nayan, J. Cleaner Prod., 2021, 290, 125792 CrossRef CAS.
- S. K. Arepalli, H. Tripathi, S. K. Hira, P. P. Manna, R. Pyare and S. P. Singh, Mater. Sci. Eng., C, 2016, 69, 108–116 CrossRef CAS PubMed.
- J. Ma, C. Qin, J. Wu, H. Zhang, H. Zhuang, M. Zhang, Z. Zhang, L. Ma, X. Wang, B. Ma, J. Chang and C. Wu, Adv. Healthcare Mater., 2021, 10, e2100523 CrossRef PubMed.
- M. Vallet-Regi and A. J. Salinas, Mater. Today Bio., 2021, 11, 100121 CrossRef CAS PubMed.
- S. Malekmohammadi, R. U. R. Mohammed, H. Samadian, A. Zarebkohan, A. García-Fernández, G. R. Kokil, F. Sharifi, J. Esmaeili, M. Bhia, M. Razavi, M. Bodaghi, T. Kumeria and R. Martínez-Máñez, Mater. Today Chem., 2022, 26, 101144 CrossRef CAS.
- S. B. Im, G. Tripathi, T. T. T. Le and B. T. Lee, Biomed. Mater., 2021, 16, 045034 CrossRef CAS PubMed.
- A. Obata, N. Iwanaga, A. Terada, G. Jell and T. Kasuga, J. Mater. Sci., 2017, 52, 8942–8956 CrossRef CAS.
- K. Lu, L. Jensen, L. Lei and Y. M. Yamashita, Trends Genet., 2017, 33, 971–978 CrossRef CAS PubMed.
- M. Mandal, B. Ghosh, M. Rajput and J. Chatterjee, Biochim. Biophys. Acta, Mol. Cell Res., 2020, 1867, 118784 CrossRef CAS PubMed.
- X. Gong, R. Buckalew, T. Young and E. Boczko, J. Biol. Dyn., 2014, 8, 79–98 CrossRef PubMed.
- J. Liu, Z. Yan, F. Yang, Y. Huang, Y. Yu, L. Zhou, Z. Sun, D. Cui and Y. Yan, Stem Cell Rev. Rep., 2021, 17, 305–317 CrossRef CAS PubMed.
- R. Allena, Bull. Math. Biol., 2013, 75, 288–316 CrossRef PubMed.
- Q.-q Yi, P.-c Liang, D.-y Liang, J.-f Shi, S. Sha and Q. Chang, Ceram. Int., 2021, 47, 8133–8141 CrossRef CAS.
- T. Lv, W. Liang, L. Li, X. Cui, X. Wei, H. Pan and B. Li, J. Biomed. Mater. Res., Part B, 2019, 107, 19–28 CrossRef CAS PubMed.
- Y. Bai, L. Bai, J. Zhou, H. Chen and L. Zhang, Cell. Immunol., 2018, 323, 19–32 CrossRef CAS PubMed.
- L. Liu, Z. Ding, Y. Yang, Z. Zhang, Q. Lu and D. L. Kaplan, Biomater. Sci., 2021, 9, 5227–5236 RSC.
- G. Sandri, S. Rossi, M. C. Bonferoni, D. Miele, A. Faccendini, E. Del Favero, E. Di Cola, A. Icaro Cornaglia, C. Boselli, T. Luxbacher, L. Malavasi, L. Cantu and F. Ferrari, Carbohydr. Polym., 2019, 220, 219–227 CrossRef CAS PubMed.
- Y. Wang, Z. Cao, Q. Wei, K. Ma, W. Hu, Q. Huang, J. Su, H. Li, C. Zhang and X. Fu, Acta Biomater., 2022, 147, 342–355 CrossRef CAS PubMed.
- K. M. McAndrews, T. Miyake, E. A. Ehsanipour, P. J. Kelly, L. M. Becker, D. J. McGrail, H. Sugimoto, V. S. LeBleu, Y. Ge and R. Kalluri, EMBO J., 2022, 41, e109470 CrossRef CAS PubMed.
- M. Qiu, B. Li, D. Geng, Q. Xiang, Y. Xin, Q. Ding and S. Tang, Int. J. Biol. Macromol., 2022, 221, 193–203 CrossRef CAS PubMed.
- S. Li, L. Li, C. Guo, H. Qin and X. Yu, Int. J. Biol. Macromol., 2017, 104, 969–978 CrossRef CAS PubMed.
Footnote |
| † Electronic supplementary information (ESI) available. See DOI: https://doi.org/10.1039/d3tb01256e |
| This journal is © The Royal Society of Chemistry 2023 |