Enzyme/inorganic nanoparticle dual-loaded animal protein/plant protein composite nanospheres and their synergistic effect in cancer therapy†
Qiaolin
Chen‡
,
Mi
Wu‡
,
Jinrong
Yao
 ,
Zhengzhong
Shao
 and
Xin
Chen
 *
*
State Key Laboratory of Molecular Engineering of Polymers, Department of Macromolecular Science, Shanghai Stomatological Hospital & School of Stomatology, Laboratory of Advanced Materials, Fudan University, Shanghai, 200433, People's Republic of China. E-mail: chenx@fudan.edu.cn
First published on 24th April 2023
Abstract
It is a viable strategy to develop a safer and tumor-specific method by considering the tumor microenvironment to optimize the curative effect and reduce the side effects in cancer treatment. In this study, glucose oxidase (GOx) and Fe3O4 nanoparticles were successfully loaded inside regenerated silk fibroin/zein (RSF/zein) nanospheres to obtain dual-loaded Fe3O4/GOx@RSF/zein nanospheres. The unique structure of the RSF/zein nanospheres reported in our previous work was favorable to loading sufficient amounts of GOx and Fe3O4 nanoparticles in the nanospheres. For Fe3O4/GOx@RSF/zein nanospheres, GOx depletes endogenous glucose via an enzyme-catalyzed bioreaction, simultaneously generating plenty of H2O2in situ. It was further catalyzed through a Fe3O4-mediated Fenton reaction to form highly toxic hydroxyl free radicals (˙OH) in the acidic tumor microenvironment. These two successive reactions made up the combination of starvation therapy and chemodynamic therapy during cancer treatment. The catalytic activity of GOx loaded in the RSF/zein nanospheres is similar to that of the pristine enzyme. It was maintained for more than one month due to the protection of the RSF/zein nanospheres. The methylene blue degradation results confirmed the sequential reaction by GOx and Fe3O4 from Fe3O4/GOx@RSF/zein nanospheres. The in vitro experiments demonstrated that the Fe3O4/GOx@RSF/zein nanospheres entered MCF-7 cells and generated ˙OH free radicals. Therefore, these Fe3O4/GOx@RSF/zein nanospheres exhibited a considerable synergistic therapeutic effect. They showed more efficient suppression in cancer cell growth than either single-loaded GOx@RSF/zein or Fe3O4@RSF/zein nanospheres, achieving the design goal for the nanospheres. Therefore, the Fe3O4/GOx@RSF/zein nanospheres cut off the nutrient supply due to the strong glucose dependence of tumor cells and generated highly toxic ˙OH free radicals in tumor cells, effectively enhancing the anticancer effect and minimizing side effects. Therefore, in future clinical applications, the Fe3O4/GOx@RSF/zein nanospheres developed in this study have significant potential for combining starvation and chemodynamic therapy.
Introduction
In cancer treatment, it is critical to avoid damage to healthy tissues and organs caused by non-specific therapies.1 Recently, several novel treatment methods, including photodynamic,2,3 photothermal,4 and microwave5 therapies, have emerged to enhance the therapeutic effect and decrease the side effects. However, despite the high-efficiency treatment performance, these strategies could also damage normal tissues and induce tumor metastasis.6 Therefore, researchers have shifted their attention to exploring the tumor microenvironment to develop a safer and more tumor-specific method.7–10 Significant differences exist between normal and tumor sites in cell metabolism and the physical environment. The tumor sites possess complex microenvironments with unique characteristics.11 For instance, the tumor site is weakly acidic due to the strong metabolism of tumor cells, producing excessive amounts of lactic acid and other metabolites.12 Additionally, the tumor cells indicate certain reducibility since the glutathione concentration is about four times larger than in normal cells.13,14 Moreover, in the tumor sites, the H2O2 level is also higher than that in normal tissues because of rapid metabolism and insufficient blood supply.15 Therefore, the therapeutic effect on tumours would be significantly improved, and the side effects on normal tissues would be minimized if these non-toxic and biocompatible substances in the tumor microenvironment could be converted into toxic substances in situ.Chemodynamic therapy (CDT) generates highly toxic ˙OH free radicals for killing tumor cells.16–18 Endogenous H2O2 molecules are directly converted into ˙OH free radicals during the CDT process via Fenton or Fenton-like reactions mediated by metal ions (including Fe2+, Cu+, Mn2+, Cr4+, and V2+).16,19–21 CDT can avoid the toxic and side effects of traditional chemotherapy and resolve the limitation of light penetration due to photothermal/photodynamic therapy. Among various catalysts, ferromagnetic nanoparticles (γ-Fe2O3 or Fe3O4) demonstrate a dual pH-response enzyme activity in vivo and in vitro. Under neutral conditions, these iron oxide nanoparticles (IONPs) catalyze H2O2 to decompose into non-toxic water and oxygen (catalase-like activity). However, under acidic conditions, they generate highly cytotoxic ˙OH free radicals (peroxidase-like activity).22 Therefore, IONPs can specifically generate ˙OH free radicals within a weakly acidic tumor environment and then trigger the apoptosis of tumor cells without damaging the normal cells. However, the H2O2 concentration is relatively low in tumor cells. Therefore, the number of ˙OH free radicals is insufficient for killing tumor cells, thereby limiting the further application of CDT.23
The direct encapsulation of exogenous H2O2 into tumor cells is a standard solution to the problem of low endogenous H2O2 at the tumor site. However, it could lead to H2O2 leakage that may damage normal tissues.6,24,25 Therefore, stimulating endogenous H2O2 in tumor cells is a preferred method. Glucose oxidase (GOx) is a common enzyme catalysing β-D-glucose to produce gluconic acid and H2O2,26–28 meeting the requirements for in situ generation of H2O2. Additionally, GOx consumes the glucose in the tumor site by blocking the energy supply of the tumor cells and leads to metabolic disorders called starvation therapy.29,30 Moreover, a low concentration of endogenous H2O2 induces the malignant transformation of normal cells, but a high concentration kills tumor cells.31 Therefore, the combination of CDT with GOx-catalysed starvation therapy blocks the supply of glucose for tumor cells and increases the concentration of endogenous H2O2 in tumor cells, which may directly kill tumor cells. However, it is more beneficial to generate highly toxic ˙OH free radicals through the Fenton reaction to induce apoptosis in tumor cells.
Liposomes, polymer micelles, polymer nanospheres, metal-organic frameworks, and mesoporous silica nanoparticles are often observed as enzyme carriers.32–35 Regenerated silk fibroin (RSF), an easily sourced and relative cheap natural polymer derived from Bombyx mori silkworm silk, has been extensively studied as a drug delivery carrier in cancer treatments. These silk-based carriers mainly include nanospheres36 and nanofibers.37,38 Previously, we developed RSF/zein nanospheres with a single central hole successfully prepared via a one-step method under mild conditions.39 Our method was relatively simple and environmentally friendly compared to other porous materials, which utilized complicated template methods under harsh conditions.40–42 The as-prepared RSF/zein nanospheres had excellent biocompatibility and biodegradability, thereby becoming the ideal enzyme carriers. This study prepared ferroferric oxide (Fe3O4) and GOx dual-loaded silk fibroin/zein (Fe3O4/GOx@RSF/zein) nanospheres based on this method. Moreover, the catalytic activities and the stability of the related nanospheres were thoroughly investigated. Finally, inhibiting Fe3O4/GOx@RSF/zein on breast cancer cells (MCF-7) through starvation therapy and CDT was evaluated.
Experimental
Materials
Cocoons of B. mori silkworm were collected from Jiangsu Province, China. Zein powder (≥97%), GOx, and glucose were procured from Sigma-Aldrich. All the other chemical reagents, such as ethanol, Na2CO3, LiBr, NaOH, FeCl2, and FeCl3, were of analytical grade and utilized without further purification.Preparation of RSF aqueous solution
According to an established method from our previous work, the RSF aqueous solution was prepared from B. mori silkworm cocoons.43 In brief, the cocoons were degummed by boiling in 0.5% (w/v) Na2CO3 for 45 min and then washing thoroughly using de-ionized water. The degummed silk was dissolved in an aqueous LiBr (9.3 mol L−1) solution at 45 °C for 1 h after drying at 40 °C for 24 h. Then, the solution was dialyzed against de-ionized water with a dialysis membrane (12–14 kDa MWCO) for three days to remove the salt at room temperature. The concentration of the resulting RSF solution was measured by the weighing method.Preparation of RSF/zein nanospheres
Powdered zein was dissolved in 70% ethanol to obtain a solution with a 0.625 mg mL−1 concentration. RSF aqueous solution was diluted using de-ionized water to 0.75 mg mL−1. Afterward, 5 mL of RSF aqueous solution was introduced into 2 mL of zein solution dropwise under gentle stirring for 3 min. Then, the mixture was incubated in a freezer at −20 °C for 24 h and thawed at room temperature. The suspension was centrifuged at 10![[thin space (1/6-em)]](https://www.rsc.org/images/entities/char_2009.gif) 000 rpm for 10 min. Then, for future use, the obtained RSF/zein nanospheres were re-dispersed in de-ionized water.
000 rpm for 10 min. Then, for future use, the obtained RSF/zein nanospheres were re-dispersed in de-ionized water.
Preparation of Fe3O4 nanoparticles
4 g FeCl3 and 4.5 g FeCl2 were dissolved in 300 mL of de-ionized water. Then, the mixture was transferred into a 500 mL flask. After replacing the air with nitrogen in the flask and stabilizing it for 30 min, 15 mL of ammonia was added to the mixture. Then, it was stirred for 2 h in a nitrogen atmosphere to develop Fe3O4 nanoparticles. The obtained Fe3O4 nanoparticles were washed five times using de-ionized water, dried in an oven at 40 °C for 12 h, and placed in a desiccator for further use.Preparation of GOx@RSF/zein nanospheres
The as-prepared RSF/zein nanospheres were dispersed in 2 mL of de-ionized water at 1 mg mL−1. Then, 2 mL of GOx solution was added to the RSF/zein nanosphere dispersion, amounting to a final GOx concentration of 1.25 mg mL−1. The mixture was stirred at 100 rpm for 24 h at room temperature. The developed nanospheres were collected by centrifuging and washed thrice using de-ionized water. Finally, the as-prepared GOx@RSF/zein nanospheres were dispersed in de-ionized water and kept in a refrigerator at 4 °C for further use.Preparation of Fe3O4@RSF/zein nanospheres
The Fe3O4 nanoparticles and zein powders were dispersed and dissolved in 70% ethanol at 0.5 mg mL−1 and 1.25 mg mL−1 concentrations, respectively. Then, 1 mL Fe3O4 nanoparticle dispersion and 1 mL zein solution were mixed. Afterward, 5 mL RSF solution (0.75 mg mL−1) was added dropwise into the Fe3O4/zein mixture. The mixture was gently stirred for 3 min and quickly transferred to a −20 °C freezer for 24 h. The Fe3O4@RSF/zein nanospheres were collected with a magnet after thawing at room temperature, washing with 20% ethanol thrice and de-ionized water thrice, and dispersed in de-ionized water.Preparation of Fe3O4/GOx@RSF/zein nanospheres
2 mL GOx solution (2.5 mg mL−1) was mixed with a 2 mL Fe3O4@RSF/zein dispersion (1 mg mL−1) at room temperature by gently stirring for 24 h. The precipitate was collected using a magnet and washed with de-ionized water thrice. Finally, the magnetic Fe3O4/GOx@RSF/zein nanospheres were dispersed in de-ionized water and placed in a refrigerator at 4 °C.Morphology observations
All the nanosphere solutions were diluted to 100 μg mL−1 before observation under a scanning electroscope microscope (SEM). SEM images were obtained with a Hitachi S-4800 high-resolution SEM at 1 kV. The nanosphere solutions were diluted to 50 μg mL−1 and dropped on carbon-coated copper grids before observing with transmission electroscope microscopy (TEM). TEM images were obtained with a Tecnai G2 TEM at 200 kV.Size and zeta potential
A Zetasizer Nano ZS 90 (Malvern Inst. Ltd, UK) was used to analyze the size and zeta potential of all nanospheres. The as-prepared nanosphere solution was diluted before each analysis to satisfy the requirements of the equipment and then filtered over an 800 nm filter to remove the dust.X-ray diffraction
Fe3O4 nanoparticles, RSF/zein nanospheres, and Fe3O4@RSF/zein nanospheres were tested with an X'Pert Pro X-ray powder diffractometer (PANalytical, Netherlands) using CuKα radiation. The working voltage was 40 kV, the current was 40 mA, and the scanning range was between 10–80°.Thermogravimetric analysis
A Pyris 1 thermogravimetric analyzer (PerkinElmer, USA) was utilized to test RSF/zein and Fe3O4@RSF/zein nanospheres under an air atmosphere. The heating rate was 10 °C min−1, and the temperature range was 50–800 °C.The catalytic activity of GOx
The pristine GOx was dissolved, and the GOx@RSF/zein nanospheres were dispersed in de-ionized water with a 50 μg mL−1 GOx concentration. Then, 1 mL GOx solution or the GOx@RSF/zein nanosphere dispersion was mixed with 4 mL glucose solution under different concentrations (100, 200, 400, 800, 1000, and 1250 μg mL−1) at room temperature. The pH of the GOx solution or the GOx@RSF/zein nanosphere dispersion and the H2O2 concentration was monitored after 1 h. H2O2 production in the solution was characterized using classical colorimetry.41Stability of GOx@RSF/zein nanospheres
To study the long-time stability of GOx@RSF/zein nanospheres, the dispersion was stored in a refrigerator at 4 °C for 1, 7, 15, 30, and 60 days before testing. To determine the catalytic activity of GOx@RSF/zein nanospheres stored for different periods of time, the abovementioned method was applied at room temperature. After 1 h of reaction with glucose, the GOx@RSF/zein nanospheres were obtained and re-dispersed in a fresh glucose solution to react for another 1 h to evaluate the cycle stability. The process was repeated five times.Degradation ability test
GOx@RSF/zein, Fe3O4@RSF/zein, and Fe3O4/GOx@RSF/zein nanosphere dispersions were added into the glucose solution. Then, methylene blue solution was added to prepare the final glucose concentration of 1 mg mL−1 and the methylene blue concentration of 10 μg mL−1. The absorbance was used to determine the degradation of methylene blue at 644 nm, which was measured using a UV-vis spectrophotometer (Hitachi U-2910, Japan).In vitro cytotoxicity
The in vitro cytotoxicity was determined as the cell viability using the CCK-8 assay. Human breast cancer MCF-7 cells were grown in DMEM culture medium with 10% fetal bovine serum (FBS) and 1% penicillin-streptomycin. Next, the cells were seeded into 96-well plates at a density of 1![[thin space (1/6-em)]](https://www.rsc.org/images/entities/char_2009.gif) ×
× ![[thin space (1/6-em)]](https://www.rsc.org/images/entities/char_2009.gif) 104 cells per well and were grown for 24 h at 37 °C. Then, varying concentrations of GOx@RSF/zein, Fe3O4@RSF/zein, and Fe3O4/GOx@RSF/zein nanospheres were introduced into the medium solutions. The cells were cultured for another 24 h and washed with PBS. Subsequently, a medium with 10% CCK-8 solution was added to each well and further incubated for 2 h. The absorbance of each well was determined at 450 nm using a microplate reader (Bio-Tek, ELx800, USA). The relative cell viability (%) was calculated as follows:
104 cells per well and were grown for 24 h at 37 °C. Then, varying concentrations of GOx@RSF/zein, Fe3O4@RSF/zein, and Fe3O4/GOx@RSF/zein nanospheres were introduced into the medium solutions. The cells were cultured for another 24 h and washed with PBS. Subsequently, a medium with 10% CCK-8 solution was added to each well and further incubated for 2 h. The absorbance of each well was determined at 450 nm using a microplate reader (Bio-Tek, ELx800, USA). The relative cell viability (%) was calculated as follows:where [A]test is the absorbance of the test sample and [A]control is the absorbance of the control sample incubated without any drugs or nanospheres within the medium solution.
In vitro cellular uptake of nanospheres
The cellular uptake of RSF/zein, GOx@RSF/zein, Fe3O4@RSF/zein, and Fe3O4/GOx@RSF/zein nanospheres into MCF-7 cells was observed under a C2 confocal laser scanning microscope (CLSM) (Nikon, Japan). The MCF-7 cells were incubated in a confocal dish at 2 × 10⁵ cells per dish density for 24 h at 37 °C. The cells were washed thrice using PBS and then fixed with 4% (w/w) glutaraldehyde for 15 min inside an ice bath after incubating with RITC-labelled nanospheres for an additional 4 h. After washing another three times with PBS, DAPI was added to stain the nucleus of the cells for 10 min. The excess DAPI was removed by washing with PBS. Then, 2 mL PBS was added to regulate the cell morphology.Production of reactive oxygen species (ROS) in cells
MCF-7 cells were incubated at 2 × 10⁵ cells per dish density in a confocal dish for 24 h at 37 °C. RSF/zein, GOx@RSF/zein, Fe3O4@RSF/zein, and Fe3O4/GOx@RSF/zein nanospheres were diluted using serum-free media. Then, 2 mL of nanosphere solution were co-incubated with MCF-7 cells for 4 h. After rinsing thrice with PBS, 2′,7′-dichlorofluorescein diacetate (DCFH-DA) fluorescent probes were added to incubate for another 1 h. The excess DCFH-DA was washed using PBS, and then 2 mL PBS was added to regulate the cell morphology. The green fluorescence inside the cells was observed with a C2 confocal laser microscope (Nikon, Japan)Results and discussion
Preparation and catalytic performance of GOx@RSF/zein nanospheres
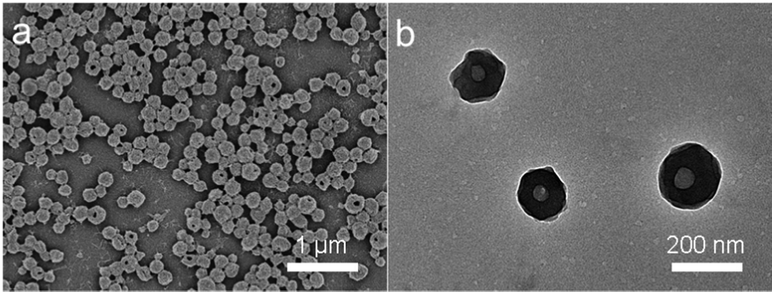
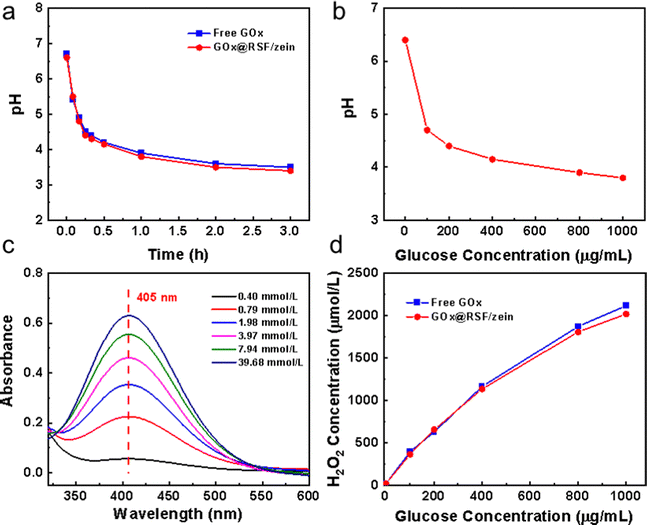
In our previous work, RSF/zein nanospheres with excellent biocompatibility were successfully prepared via a one-step method.39 They had a narrow size distribution and good dispersibility within water. More importantly, the RSF/zein nanosphere had a unique structure with a single central hole of 26 nm average size. RSF/zein nanospheres were more suitable for loading macromolecules, including nucleic acids and proteins compared with the traditional mesoporous silica nanoparticles (with a pore size of about 5 nm).42 Therefore, GOx, with a size of 6.0 × 5.2 × 7.7 nm, could be a good candidate for loading, with a capacity as high as 7.4%. Fig. 1 shows the SEM and TEM images of GOx@RSF/zein nanospheres, which seldom indicate morphological changes compared with the pristine RSF/zein nanospheres.39 Additionally, the size of the nanospheres did not change significantly before and after GOx loading. However, the zeta potential was increased from −26.2 to −22.1 mV (Table S1, ESI†). This established the successful loading of GOx, consistent with a literature report.6The glucose decomposes into H2O2 and gluconic acid due to GOx catalysis.45 Therefore, the glucose solution pH decreases during the reaction process. Fig. 2a shows that the pH dropped rapidly from 6.7 to 4.8 within 10 min after adding the GOx@RSF/zein nanospheres to the glucose solution. The reaction reached equilibrium at about 3 h, and the final pH was approximately 3.4. Meanwhile, the catalytic behaviour of the GOx@RSF/zein nanospheres was similar to the pristine GOx, indicating that its catalytic activity is unaffected by the loading of GOx in the RSF/zein nanospheres. In addition, the pH of the glucose solution decreased more significantly with the increase in glucose concentration. Fig. 2b indicates that, after 1 h of reaction, the pH of the solution decreased from 4.7 to 3.8 when the glucose concentration was elevated from 100 to 1000 μg mL−1.
The H2O2 concentration in the glucose solution can be monitored by the colour change (Fig. 2c) since titanium oxysulfate forms a yellow precipitation titanium peroxide complex (Ti(IV)O22+) with the presence of H2O2.44Fig. 2d represents the H2O2 concentration generated in the glucose solution after an hour reaction using GOx. It shows that the H2O2 concentration enhanced almost linearly with the increase in glucose concentration within the catalytic system. Moreover, there is minimal difference between the H2O2 concentration–glucose concentration curve from pristine GOx and GOx@RSF/zein nanospheres. Therefore, it is further proved that the GOx loaded in the RSF/zein nanospheres has similar catalytic activity as its original form.
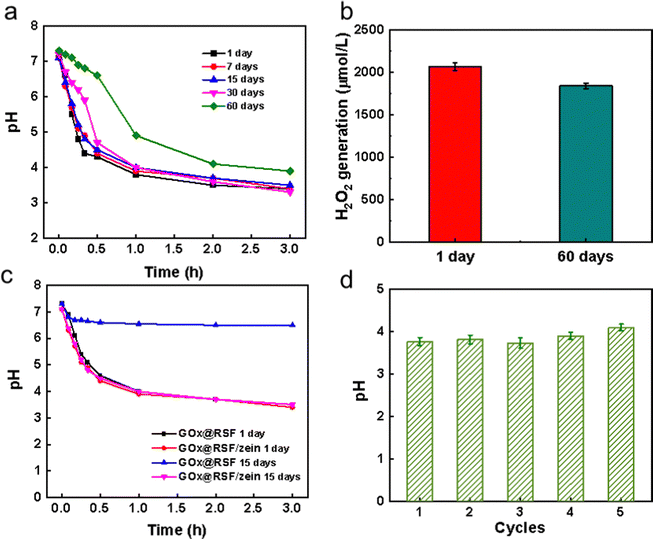
The stability of GOx@RSF/zein nanospheres was evaluated by monitoring their catalytic activities after storing them for 1, 7, 15, 30, and 60 days at 4 °C. Fig. 3a revealed the pH changes at different time points when GOx@RSF/zein nanospheres were introduced in 1 mg mL−1 glucose solution. The pH change of these nanospheres stored for 30 days achieved equilibrium at about pH = 3.5 after following the same trend. Only the nanospheres kept for 60 days had a smaller pH change at each time point than other storage times, and the equilibrium pH was elevated to 3.8. H2O2 generated by the GOx@RSF/zein nanospheres showed the same trend as the pH change. In the glucose solution, the H2O2 concentration was about 2000 μmol L−1 for those GOx@RSF/zein nanospheres stored for 1 to 30 days. However, it decreased to about 1800 μmol L−1 after 60 days of storage while maintaining 90% of catalytic activity (Fig. 3b). This clearly indicates that the RSF/zein nanospheres kept the activity of GOx for at least one month. After a longer time, for example two months, the GOx activity could be lost a little due to the partial degradation of the RSF/zein nanospheres.
The stability of the GOx catalytic activity was also compared after loading in pristine RSF nanospheres and RSF/zein nanospheres. As depicted in Fig. 3c, GOx@RSF and GOx@RSF/zein nanospheres demonstrated similar catalytic activity on the first day. Under these circumstances, the pH of the glucose solution reduced to 3.4 after 3 h of reaction. However, the GOx@RSF/zein nanospheres still showed similar excellent catalytic activity after storing for 15 days, but the GOx@RSF nanospheres almost lost their catalytic activity. This suggests that the unique structure of the RSF/zein nanospheres can protect the GOx from inactivation.
The cyclic stability test of the GOx@RSF/zein nanospheres was performed by collecting the nanospheres in a glucose solution after reacting for 1 h. Later, the nanospheres were transferred into a fresh glucose solution for another hour of catalysis. Fig. 3d indicates no significant reduction in catalytic activity after five cycles. This further suggested that the RSF/zein nanospheres protected the catalytic activity of GOx.
Rapid tumor site metabolism leads to a special tumor microenvironment. The fast proliferation of tumor cells depends on the extensively constructed blood vessels in the tumor to provide nutrition for them, with glucose being an essential nutrient.46 Based on the Warburg effect, tumor cell proliferation primarily depends on aerobic glycolysis, making tumor cells very sensitive to glucose alteration.47 Therefore, changing the glucose metabolism pathway inside the tumor cells is a safe and efficient strategy.48 The above results demonstrated that RSF/zein nanospheres effectively protect the catalytic activity of GOx. The active GOx consumes glucose at tumor sites, cuts off the nutrient supply, and generates a high H2O2 concentration. Therefore, it promotes the subsequent Fenton reaction to cause tumor cell apoptosis.
Construction of Fe3O4/GOx@RSF/zein nanospheres
The X-ray diffraction pattern of the Fe3O4 nanoparticles is demonstrated in Fig. S1a (ESI†). The prominent diffraction peaks are at 30.1°, 35.5°, 43.1°, 57.0°, and 62.6°, corresponding to the (220), (311), (400), (511), and (440) planes, respectively. Thus, the product is a typical inverse cubic spinel Fe3O4,49 with an average size of 28 nm and a narrow distribution based on the DLS measurement (Fig. S1b, ESI†).During the preparation process of the RSF nanospheres, Fe3O4 nanoparticles can be loaded inside these nanospheres by directly adding them.50 Fe3O4@RSF/zein nanospheres were successfully prepared following this method. Fig. 4a shows the X-ray diffraction pattern before and after loading the Fe3O4 in RSF/zein nanospheres. The characteristic diffraction peaks of Fe3O4, including 35.5° and 62.6°, were seen in Fe3O4@RSF/zein nanospheres. In addition, the mass fraction of Fe3O4 loaded in the RSF/zein nanospheres was about 10% through TGA analysis (Fig. 4b). The size of Fe3O4@RSF/zein and Fe3O4/GOx@RSF/zein nanospheres could be a little larger than the pristine RSF/zein nanospheres. However, the average sizes were around 300 nm (Fig. S1c, ESI†). Moreover, the zeta potential of the Fe3O4@RSF/zein nanospheres increased from −26.2 to −22.9 mV compared with the pristine RSF/zein nanospheres, which further enhanced to −20.6 mV for Fe3O4/GOx@RSF/zein nanospheres (Fig. 4c). This is consistent with the literature report,6 confirming the successful loading of Fe3O4 and GOx within the RSF/zein nanospheres at the same time.
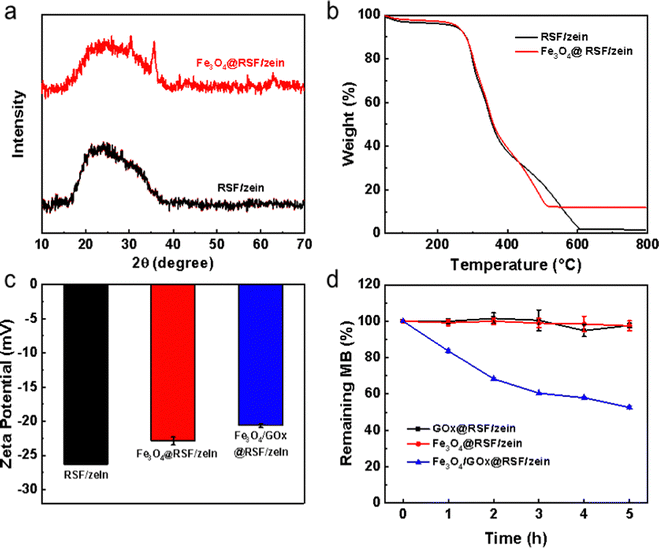 | ||
| Fig. 4 The characterization of Fe3O4@RSF/zein and Fe3O4/GOx@RSF/zein nanospheres. (a) XRD pattern, (b) TGA curve, (c) zeta potential, and (d) degradation of methylene blue. | ||
Fe3O4 nanoparticles can react with H2O2 to generate ˙OH free radicals through the Fenton reaction. Therefore, methylene blue was chosen as an indicator to explore the in vitro generation of ˙OH free radicals.19 Only the Fe3O4/GOx@RSF/zein nanospheres significantly degraded the methylene blue (Fig. 4d). This indicated that only in Fe3O4/GOx@RSF/zein nanospheres, GOx catalysed glucose to generate H2O2, then the H2O2 reacted with Fe3O4 to generate ˙OH free radicals, and thereby degraded methylene blue.
In vitro cytotoxicity of Fe3O4/GOx@RSF/zein nanospheres
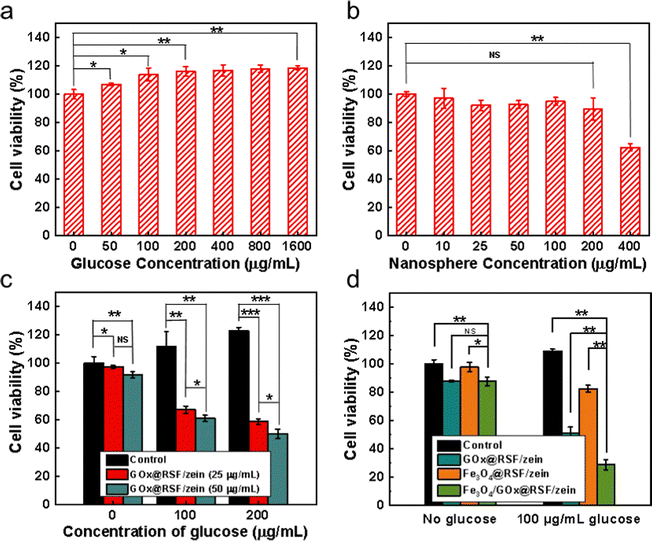
Glucose is the primary energy source for tumor growth, and its concentration increase enhanced MCF-7 cell proliferation (Fig. 5a). Meanwhile, Fe3O4@RSF/zein nanospheres revealed no toxicity toward the cells at the concentration range between 10–200 μg mL−1 (Fig. 5b). Fe3O4 toxicity in the cells is mainly derived from the Fenton reaction with endogenous H2O2 generating cytotoxic ˙OH free radicals. However, the effect of Fe3O4@RSF/zein nanospheres on cytotoxicity is limited due to the low concentration of endogenous H2O2 in the cells. Thus, it almost does not depend on the Fe3O4 concentration. Therefore, the elevated cytotoxicity observed at a high Fe3O4@RSF/zein nanosphere concentration (400 μg mL−1) was primarily attributed to the high concentration of the nanospheres rather than the generation of more ˙OH free radicals.The starvation therapy depending on GOx, primarily relies on consuming glucose and generating a high concentration of H2O2 to induce cell apoptosis. It has a stronger anticancer performance than traditional starvation therapy while cutting off the glucose supply.29Fig. 5c indicates the cytotoxicity of GOx@RSF/zein nanospheres with two different concentrations. It shows the cell viability increases with the increase in glucose concentration if there are no GOx@RSF/zein nanospheres. However, the cell viability significantly decreases with the increase in glucose concentration if there are GOx@RSF/zein nanospheres. This decrease was observed with the increase in GOx@RSF/zein nanosphere concentration, confirming the curative effect of the GOx@RSF/zein nanospheres.
Finally, the effect of Fe3O4/GOx@RSF/zein nanospheres on cell viability was determined and compared with GOx@RSF/zein and Fe3O4@RSF/zein nanospheres (Fig. 5d). This revealed the synergistic effect of starvation therapy and CDT for Fe3O4/GOx@RSF/zein nanospheres to kill or inhibit cancer cells.
The silk fibroin was labelled with RITC, so the nanospheres show red fluorescence. Then, they were used to determine whether the GOx@RSF/zein, Fe3O4@RSF/zein, and Fe3O4/GOx@RSF/zein nanospheres could enter MCF-7 cells or not. The cell nucleus was further stained using DAPI after co-incubating the RITC-labelled nanospheres with MCF-7 cells for 4 h. Fig. 6 shows that RSF/zein, GOx@RSF/zein, Fe3O4@RSF/zein, and Fe3O4/GOx@RSF/zein nanospheres enter the cell very well. In addition, a series of nine-step z-stack confocal fluorescence images of MCF-7 cell after incubating with Fe3O4/GOx@RSF/zein nanospheres was shown in Fig. S2 (ESI†), which further indicated that Fe3O4/GOx@RSF/zein nanospheres entered MCF-7 cells.
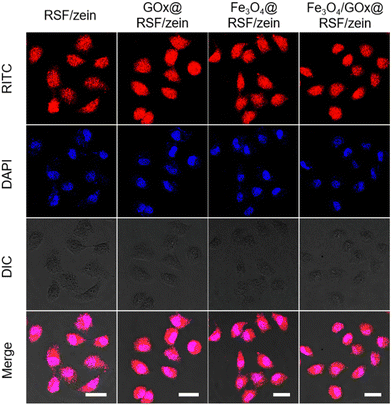 | ||
| Fig. 6 The cellular uptake of RSF/zein, GOx@RSF/zein, Fe3O4@RSF/zein, and Fe3O4/GOx@RSF/zein nanospheres within MCF-7 cells after incubating for 4 h at 37 °C. Scale bar: 20 μm. | ||
Finally, the catalytic performance of GOx@RSF/zein, Fe3O4@RSF/zein, and Fe3O4/GOx@RSF/zein nanospheres in MCF-7 cells was evaluated. The nanospheres were stained with a 2′,7′-dichlorofluorescein yellow diacetate (DCFH-DA) fluorescent probe (DCFH-DA is oxidized to 2′,7′-dichlorofluorescein (DCF) with the ROS, depicting green fluorescence51) after co-incubating them with MCF-7 cells for 4 h. As shown in Fig. 7, only weak green fluorescence was observed in the cells with RSF/zein and GOx@RSF/zein nanospheres. This mainly results from a small number of ROS due to cell metabolism. The green fluorescence was slightly enhanced in the cells with Fe3O4@RSF/zein nanospheres, indicating the generation of ROS was slightly increased. The green fluorescence was significantly enhanced in those cells with Fe3O4/GOx@RSF/zein nanospheres. Therefore, a large number of ROS were generated in the cells because of the synergistic effect of GOx and Fe3O4. The ROS observed in the cells were assumed mainly to be the ˙OH free radicals according to the experiment results shown above, but this will be further confirmed in future studies. These results indicate that GOx and Fe3O4 undergo the same outstanding catalytic function in a complicated cellular environment, first by decomposing glucose to generate H2O2 and then developing the highly cytotoxic ˙OH free radicals through the Fenton reaction.
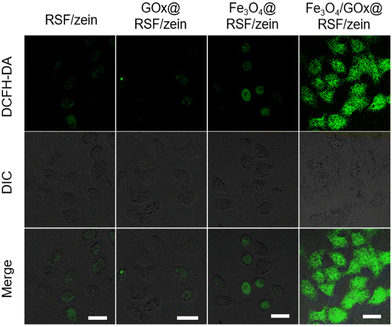 | ||
| Fig. 7 The intracellular ˙OH detection in MCF-7 cells after incubating using RSF/zein, GOx@RSF/zein, Fe3O4@RSF/zein, and Fe3O4/GOx@RSF/zein nanospheres. Scale bar: 20 μm. | ||
Conclusions
The current work introduced Fe3O4 nanoparticles and GOx to the RSF/zein nanospheres that were previously developed in our laboratory for preparing dual-loaded animal protein/plant protein composite nanospheres. Immobilizing GOx in RSF/zein nanospheres did not alter its catalytic activity. The catalytic activity was maintained after the nanospheres were stored at 4 °C for at least one month. Additionally, the catalytic activity of GOx loaded in the RSF/zein nanospheres remained nearly the same after five catalytic reaction cycles. This suggests that the RSF/zein nanosphere could be an efficient and safe nano-carrier for GOx. Methylene blue was significantly degraded within 5 h after placing the dual-loaded nanospheres (i.e., Fe3O4/GOx@RSF/zein nanospheres) in glucose/methylene blue solution. In contrast, the single-loaded nanospheres (either GOx@RSF/zein or Fe3O4@RSF/zein nanospheres) did not show the same phenomenon, indicating the co-existence of Fe3O4 and GOx in the RSF/zein nanosphere led to a continuous catalytic reaction. First, GOx decomposed the glucose into H2O2 and gluconic acid and reduced the pH of the glucose solution. Then, Fe3O4 reacted with H2O2 to generate highly cytotoxic ˙OH free radicals under acidic conditions through the Fenton reaction.After co-loading GOx and Fe3O4, they indicated significant cytotoxicity toward cancer cells (MCF-7 cells) despite the excellent biocompatibility of pristine RSF/zein nanospheres. Additionally, the antiproliferative activity of Fe3O4/GOx@RSF/zein nanospheres towards MCF-7 cells was higher than that of either GOx@RSF/zein or Fe3O4@RSF/zein nanospheres. Therefore, this indicates that the combination of starvation therapy and CDT has a synergistic effect during cancer treatment. Finally, the Fe3O4/GOx@RSF/zein nanospheres were taken by MCF-7 cells, and the highly cytotoxic ˙OH free radicals existed within the cells. Therefore, the combination of starvation therapy and CDT provided by the Fe3O4/GOx@RSF/zein nanospheres in the tumor microenvironment exhibits a significant synergistic anticancer effect with less toxic side effects to normal tissues. Therefore, it shows excellent promise for utilization in further clinical applications.
Conflicts of interest
There are no conflicts to declare.Acknowledgements
This work was supported by the National Natural Science Foundation of China (No. U2032123, 21935002, and 21574023). We thank Dr Bingjiao Zhao at Shanghai Stomatological Hospital, Fudan University for her valuable suggestions and discussions.References
- H. Lin, Y. Chen and J. L. Shi, Chem. Soc. Rev., 2018, 47, 1938–1958 RSC.
- D. Dolmans, D. Fukumura and R. K. Jain, Nat. Rev. Cancer, 2003, 3, 380–387 CrossRef CAS PubMed.
- E. Secret, M. Maynadier, A. Gallud, A. Chaix, E. Bouffard, M. Gary-Bobo, N. Marcotte, O. Mongin, K. El Cheikh, V. Hugues, M. Auffan, C. Frochot, A. Morere, P. Maillard, M. Blanchard-Desce, M. J. Sailor, M. Garcia, J. O. Durand and F. Cunin, Adv. Mater., 2014, 26, 7643–7648 CrossRef CAS PubMed.
- L. Cheng, J. Liu, X. Gu, H. Gong, X. Shi, T. Liu, C. Wang, X. Wang, G. Liu, H. Xing, W. Bu, B. Sun and Z. Liu, Adv. Mater., 2014, 26, 1886–1893 CrossRef CAS PubMed.
- D. Long, T. Liu, L. Tan, H. Shi, P. Liang, Q. Wu, J. Yu and J. Dou, ACS Nano, 2016, 10, 9516–9528 CrossRef CAS PubMed.
- M. Huo, L. Wang, Y. Chen and J. L. Shi, Nat. Commun., 2017, 8, 357 CrossRef PubMed.
- Y. Dai, C. Xu, X. Sun and X. Chen, Chem. Soc. Rev., 2017, 46, 3830–3852 RSC.
- J. Liu, Z. Luo, J. Zhang, T. Luo, J. Zhou, X. Zhao and K. Cai, Biomaterials, 2016, 83, 51–65 CrossRef CAS PubMed.
- S. Wang, G. Yu, Z. Wang, O. Jacobson, R. Tian, L.-S. Lin, F. Zhang, J. Wang and X. Chen, Adv. Mater., 2018, 30, 1803926 CrossRef PubMed.
- W. Zhu, Z. Dong, T. Fu, J. Liu, Q. Chen, Y. Li, R. Zhu, L. Xu and Z. Liu, Adv. Funct. Mater., 2016, 26, 5490–5498 CrossRef CAS.
- F. R. Balkwill, M. Capasso and T. Hagemann, J. Cell Sci., 2012, 125, 5591–5596 CrossRef CAS PubMed.
- P. Liang, X. Huang, Y. Wang, D. Chen, C. Ou, Q. Zhang, J. Shao, W. Huang and X. Dong, ACS Nano, 2018, 12, 11446–11457 CrossRef CAS PubMed.
- M. H. Lee, Z. Yang, C. W. Lim, Y. H. Lee, S. Dongbang, C. Kang and J. S. Kim, Chem. Rev., 2013, 113, 5071–5109 CrossRef CAS PubMed.
- B. A. Webb, M. Chimenti, M. P. Jacobson and D. L. Barber, Nat. Rev. Cancer, 2011, 11, 671–677 CrossRef CAS PubMed.
- T. P. Szatrowski and C. F. Nathan, Cancer Res., 1991, 51, 794–798 CAS.
- L.-S. Lin, J. Song, L. Song, K. Ke, Y. Liu, Z. Zhou, Z. Shen, J. Li, Z. Yang, W. Tang, G. Niu, H.-H. Yang and X. Chen, Angew. Chem., Int. Ed., 2018, 57, 4902–4906 CrossRef CAS PubMed.
- Z. Tang, Y. Liu, M. He and W. Bu, Angew. Chem., Int. Ed., 2019, 58, 946–956 CrossRef CAS PubMed.
- C. Zhang, W. Bu, D. Ni, S. Zhang, Q. Li, Z. Yao, J. Zhang, H. Yao, Z. Wang and J. Shi, Angew. Chem., Int. Ed., 2016, 55, 2101–2106 CrossRef CAS PubMed.
- L.-H. Fu, Y.-R. Hu, C. Qi, T. He, S. Jiang, C. Jiang, J. He, J. Qu, J. Lin and P. Huang, ACS Nano, 2019, 13, 13985–13994 CrossRef CAS PubMed.
- Y. Liu, W. Zhen, Y. Wang, J. Liu, L. Jin, T. Zhang, S. Zhang, Y. Zhao, S. Song, C. Li, J. Zhu, Y. Yang and H. Zhang, Angew. Chem., Int. Ed., 2019, 58, 2407–2412 CrossRef CAS PubMed.
- H. Ranji-Burachaloo, P. A. Gurr, D. E. Dunstan and G. G. Qiao, ACS Nano, 2018, 12, 11819–11837 CrossRef CAS PubMed.
- Z. Chen, J.-J. Yin, Y.-T. Zhou, Y. Zhang, L. Song, M. Song, S. Hu and N. Gu, ACS Nano, 2012, 6, 4001–4012 CrossRef CAS PubMed.
- Z. Tang, H. Zhang, Y. Liu, D. Ni, H. Zhang, J. Zhang, Z. Yao, M. He, J. Shi and W. Bu, Adv. Mater., 2017, 29, 1701683 CrossRef PubMed.
- W.-P. Li, C.-H. Su, Y.-C. Chang, Y.-J. Lin and C.-S. Yeh, ACS Nano, 2016, 10, 2017–2027 CrossRef CAS PubMed.
- A. van der Vliet and Y. M. W. Janssen-Heininger, J. Cell. Biochem., 2014, 115, 427–435 CrossRef CAS PubMed.
- S.-Y. Li, H. Cheng, B.-R. Xie, W.-X. Qiu, J.-Y. Zeng, C.-X. Li, S.-S. Wan, L. Zhang, W.-L. Liu and X.-Z. Zhang, ACS Nano, 2017, 11, 7006–7018 CrossRef CAS PubMed.
- W. Tai, R. Mo, J. Di, V. Subramanian, X. Gu, J. B. Buse and Z. Gu, Biomacromolecules, 2014, 15, 3495–3502 CrossRef CAS PubMed.
- C. Wang, Y. Ye, G. M. Hochu, H. Sadeghifar and Z. Gu, Nano Lett., 2016, 16, 2334–2340 CrossRef CAS PubMed.
- W. Fan, N. Lu, P. Huang, Y. Liu, Z. Yang, S. Wang, G. Yu, Y. Liu, J. Hu, Q. He, J. Qu, T. Wang and X. Chen, Angew. Chem., Int. Ed., 2017, 56, 1229–1233 CrossRef CAS PubMed.
- J. Li, A. Dirisala, Z. Ge, Y. Wang, W. Yin, W. Ke, K. Toh, J. Xie, Y. Matsumoto, Y. Anraku, K. Osada and K. Kataoka, Angew. Chem., Int. Ed., 2017, 56, 14025–14030 CrossRef CAS PubMed.
- M. Lopez-Lazaro, FASEB J., 2006, 20, 828–832 CrossRef CAS PubMed.
- W. Ke, J. Li, F. Mohammed, Y. Wang, K. Tou, X. Liu, P. Wen, H. Kinoh, Y. Anraku, H. Chen, K. Kataoka and Z. Ge, ACS Nano, 2019, 13, 2357–2369 CAS.
- X. Lian, Y. Huang, Y. Zhu, Y. Fang, R. Zhao, E. Joseph, J. Li, J.-P. Pellois and H.-C. Zhou, Angew. Chem., Int. Ed., 2018, 57, 5725–5730 CrossRef CAS PubMed.
- R. A. Perez, R. K. Singh, T.-H. Kim and H.-W. Kim, Mater. Horiz., 2017, 4, 772–799 RSC.
- R. Zhang, X. Song, C. Liang, X. Yi, G. Song, Y. Chao, Y. Yang, K. Yang, L. Feng and Z. Liu, Biomaterials, 2017, 138, 13–21 CrossRef CAS PubMed.
- Y. Tian, X. Jiang, X. Chen, Z. Shao and W. Yang, Adv. Mater., 2014, 26, 7393–7398 CrossRef CAS PubMed.
- L. Xiao, Z. Ding, X. Zhang, X. Wang, Q. Lu and D. Kaplan, ACS Biomater. Sci. Eng., 2012, 8, 140–150 CrossRef PubMed.
- X. Wang, K. Liu, S. Fu, X. Wu, L. Xiao, Y. Yang, Z. Zhang and Q. Lu, ACS Appl. Bio Mater., 2023, 6, 74–82 CrossRef CAS PubMed.
- M. Lu, M. Wu, Y. Huang, J. Yao, Z. Shao and X. Chen, J. Mater. Chem. B, 2022, 10, 3798–3807 RSC.
- X. Li, L. Zhou, Y. Wei, A. M. El-Toni, F. Zhang and D. Zhao, J. Am. Chem. Soc., 2015, 137, 5903–5906 CrossRef CAS PubMed.
- Y. Si, M. Chen and L. Wu, Chem. Soc. Revi., 2016, 45, 690–714 RSC.
- S. Wang, M. Chen and L. Wu, ACS Appl. Mater. Interfaces, 2016, 8, 33316–33325 CrossRef CAS PubMed.
- M. Wu, W. Yang, S. Chen, J. Y. Ao, Z. Shao and X. Chen, J. Mater. Chem. B, 2018, 6, 1179–1186 RSC.
- R. Zhang, L. Feng, Z. Dong, L. Wang, C. Liang, J. Chen, Q. Ma, R. Zhang, Q. Chen, Y. Wang and Z. Liu, Biomaterials, 2018, 162, 123–131 CrossRef CAS PubMed.
- R. Buiculescu, D. Stefanakis, M. Androulidaki, D. Ghanotakis and N. A. Chaniotakis, Analyst, 2016, 141, 4170–4180 RSC.
- H. Ying, A. C. Kimmelman, C. A. Lyssiotis, S. Hua, G. C. Chu, E. Fletcher-Sananikone, J. W. Locasale, J. Son, H. Zhang, J. L. Coloff, H. Yan, W. Wang, S. Chen, A. Viale, H. Zheng, J.-H. Paik, C. Lim, A. R. Guimaraes, E. S. Martin, J. Chang, A. F. Hezel, S. R. Perry, J. Hu, B. Gan, Y. Xiao, J. M. Asara, R. Weissleder, Y. A. Wang, L. Chin, L. C. Cantley and R. A. DePinho, Cell, 2012, 149, 656–670 CrossRef CAS PubMed.
- N. C. Denko, Nat. Rev. Cancer, 2008, 8, 705–713 CrossRef CAS PubMed.
- C. Zhang, D. Ni, Y. Liu, H. Yao, W. Bu and J. Shi, Nat. Nanotechnol, 2017, 12, 378–386 CrossRef CAS PubMed.
- R.-Y. Hong, J.-H. Li, S.-Z. Zhang, H.-Z. Li, Y. Zheng, J.-M. Ding and D.-G. Wei, Appl. Surf. Sci., 2009, 255, 3485–3492 CrossRef CAS.
- Y. Tian, X. Jiang, X. Chen, Z. Shao and W. Yang, Adv. Mater., 2014, 26, 7393–7398 CrossRef CAS PubMed.
- L. Zhang, S.-S. Wan, C.-X. Li, L. Xu, H. Cheng and X.-Z. Zhang, Nano Lett., 2018, 18, 7609–7618 CrossRef CAS PubMed.
Footnotes |
| † Electronic supplementary information (ESI) available. See DOI: https://doi.org/10.1039/d3tb00402c |
| ‡ Q. C. and M. W. contributed equally to this work. |
| This journal is © The Royal Society of Chemistry 2023 |


