Cancer-associated fibroblast-targeted nanodrugs reshape colorectal tumor microenvironments to suppress tumor proliferation, metastasis and improve drug penetration†
Wenqi
Shen
ab,
Ping-an
Yao
c,
Wenjing
Li
 b,
Changji
Gu
a,
Tian
Gao
 b,
Yi
Cao
 b,
Zheng
Wang
 *b,
Renjun
Pei
*b and
Chungen
Xing
*a
aDepartment of General Surgery, Second Affiliated Hospital of Soochow University, Suzhou, 215004, P. R. China. E-mail: xingcg@suda.edu.cn
bCAS Key Laboratory for Nano-Bio Interface, Suzhou Institute of Nano-Tech and Nano-Bionics, Chinese Academy of Sciences, Suzhou, 215123, P. R. China. E-mail: zwang2021@sinano.ac.cn; rjpei2011@sinano.ac.cn
cDepartment of Gastrointestinal Surgery, Shanghai East Hospital (East Hospital Affiliated to Tongji University), 150 Jimo Road, Shanghai, 200120, China
First published on 22nd November 2022
Abstract
Cancer-associated fibroblasts (CAFs) produce a critical tumor-promoting effect by cellular crosstalk with cancer cells and remodel the extracellular matrix (ECM) to form a protective physical barrier. The simple elimination of CAFs is not sufficient to govern the CAF-shaped aggressive tumor microenvironment (TME) because of the complexity of tumors. Herein, a CAF-targeted poly (lactic-co-glycolic acid) (PLGA) nanoemulsion is tailored to simultaneously deliver doxorubicin (DOX) and small interfering RNA (siRNA) targeting hepatocyte growth factor (HGF) for the combination of chemotherapy and gene therapy. The nanoemulsion (apt-Si/DNPs) shows a high specificity towards CAFs due to the aptamer modification and efficiently induces the apoptosis of CAFs, thus decreasing ECM deposition in the TME. Importantly, the delivered siRNA reduces the expression of the HGF in the remaining CAFs, which overcomes chemotherapy-induced upregulation of HGF mRNA and prevents the reproduction of CAFs through the autocrine HGF closed-loop. Owing to these synergetic effects, tumor proliferation, migration and invasion are prominently inhibited and tumor permeability is improved significantly. Overall, these results emphasize the potential of CAF-targeted combination treatments to inhibit tumor progression and metastasis, as well as overcome therapeutic resistance.
1. Introduction
Colorectal cancer (CRC) is one of the most prevalent malignancies worldwide, characterized by high metastasis and formidable mortality.1 Conventional therapeutic options, including surgical resection, radiotherapy and chemotherapy, remain unsatisfactory which spurs intensive efforts to develop more advanced therapeutic approaches.2,3 Although genetic alterations in cancer cells are essential for tumorigenesis, they are insufficient to bestow cancer cells with malignancies. The TME as fertilizing tumor “soil” plays a vital role in tumor progression and metastasis, and profoundly influences therapeutic responses.4–7 In this context, the tumor microenvironment (TME) has been the focus of interest in the scope of cancer treatment.The TME contains various cell types (endothelial cells, fibroblasts and inflammatory cells, etc.) and extracellular components such as cytokines, chemokines, extracellular matrix (ECM), etc. Among these heterogeneous components, activated fibroblasts, often called cancer-associated fibroblasts (CAFs), are among the most critical stromal cells. Accumulating evidence shows that CAFs are capable of cross-talking with tumor cells through various cytokines to create an appropriate microenvironment for tumor cell thriving.5,6,8,9 Hepatocyte growth factor (HGF), a key cytokine secreted by CAFs, is found to promote the proliferation, migration and invasion of CRC by activating the HGF/c-MET signaling pathway.10–13 Furthermore, CAFs, as the main producers of the ECM, produce a guarding barrier and dense scaffold for tumor cells through the surrounding tumor cells and secretion of the ECM, thus inhibiting drug penetration and interaction with cancer cells.14–17 Therefore, CAFs contribute to tumor progression, metastasis and even therapeutic resistance both structurally and functionally.18–23 In this context, destroying or modifying CAFs to renounce their fealty toward tumors has become a highlight for the treatment of CRCs.24
Chemotherapy, which involves the use of chemotherapeutic agents to inhibit the growth of CAFs, is a powerful strategy to induce the apoptosis of CAFs and reduce ECM production to remodel the TME. However, the non-selective cytotoxicity of chemotherapeutic agents often results in ineffective chemotherapy to completely eliminate CAFs.25,26 Importantly, residual CAFs are capable of secreting a surge of HGF owing to chemotherapy-induced upregulation of HGF mRNA, which promotes cancer cell proliferation and even reproduces CAFs through the autocrine HGF closed-loop.26,27
Accordingly, single-modality chemotherapy is suboptimal, whereas combination therapies have been recommended for their synergistic effects.28 Since small interfering RNA (siRNA) specifically knocks down the expression of target genes,29 which paves the way for eradicating HGF secretion to block the interplay between CAFs and cancer cells.30 The combination of chemotherapy with the effects of siRNA on target genes has great promise as a new strategy to regulate the CAF-induced malignant TME. However, the application of chemotherapeutic drugs and siRNAs still present many limitations. Chemotherapeutic drugs are generally hydrophobic and non-specific and siRNAs are vulnerable to physiological conditions.31 Therefore, the development of nano-drug delivery systems to simultaneously deliver chemotherapeutic drugs and siRNA toward CAFs is particularly important for the pursuit of highly efficient and safe cancer therapies.
Aptamers, known as short single-stranded DNA or RNA oligonucleotide segments, can target objects including small molecules and cells with high selectivity and affinity via folding into unique structures. N-cadherin aptamers (NC3S) possess high selectivity and affinity with a high expression of N-cadherin protein on the surface of CAFs.32 In this study, poly(lactic-co-glycolic acid) (PLGA) nanoemulsions with NC3S were developed to simultaneously deliver doxorubicin (DOX) and siRNA (Scheme 1). Due to the high CAF-targeting ability and the synergistic effect of chemotherapy with HGF gene silencing, the prepared nanoemulsions (apt-Si/DNPs) not only inhibited CAF-induced cancer cell proliferation, migration, and invasion, but also remodeled the architecture of the TME to improve tumor penetrability. Therefore, tumor growth and metastasis were effectively controlled and nanodrug accumulation was markedly improved. Our study provides a promising strategy for the regulation of the TME for highly efficient and safe treatment of CRC.
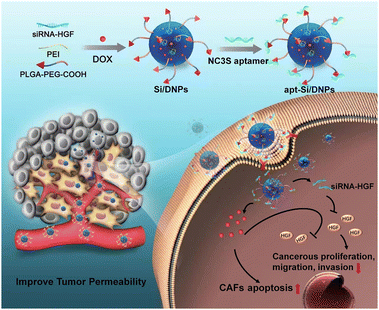 | ||
| Scheme 1 Schematic of cancer-associated fibroblast-targeted nanodrugs for remodeling tumor microenvironments to suppress tumor malignancy and improve tumor permeability. | ||
2. Experimental section
2.1 Materials and reagents
PLGA (10![[thin space (1/6-em)]](https://www.rsc.org/images/entities/char_2009.gif) 000) (LA
000) (LA![[thin space (1/6-em)]](https://www.rsc.org/images/entities/char_2009.gif) :
:![[thin space (1/6-em)]](https://www.rsc.org/images/entities/char_2009.gif) GA = 50
GA = 50![[thin space (1/6-em)]](https://www.rsc.org/images/entities/char_2009.gif) :
:![[thin space (1/6-em)]](https://www.rsc.org/images/entities/char_2009.gif) 50)-PEG (2000)-COOH was obtained from Yusi Medicine. PLGA (ester terminated, Mw 7000-17
50)-PEG (2000)-COOH was obtained from Yusi Medicine. PLGA (ester terminated, Mw 7000-17![[thin space (1/6-em)]](https://www.rsc.org/images/entities/char_2009.gif) 000, LA
000, LA![[thin space (1/6-em)]](https://www.rsc.org/images/entities/char_2009.gif) :
:![[thin space (1/6-em)]](https://www.rsc.org/images/entities/char_2009.gif) GA = 50
GA = 50![[thin space (1/6-em)]](https://www.rsc.org/images/entities/char_2009.gif) :
:![[thin space (1/6-em)]](https://www.rsc.org/images/entities/char_2009.gif) 50), poly (vinyl alcohol) (PVA, 30–70 kDa), and PEI (average Mw 25
50), poly (vinyl alcohol) (PVA, 30–70 kDa), and PEI (average Mw 25![[thin space (1/6-em)]](https://www.rsc.org/images/entities/char_2009.gif) 000) were purchased from Sigma Aldrich. DOX was purchased from Aladdin. N-Hydroxysulfosuccinimide (Sulfo-NHS) and 1-ethyl-3-(3-(dimethylamino) propyl) carbodiimide (EDC) were both obtained from Aladdin. DiR Iodide and DiI were obtained from Yeasen Biotechnology (Shanghai). All oligonucleotides were provided by Sangon Biotech (Shanghai, China). NH2-modified NC3S aptamer: 5′-NH2-TGCACTATGTTTTAGCTAGGGTTCCCTCCGGAGATAGTAAGTGCAA-3′.
000) were purchased from Sigma Aldrich. DOX was purchased from Aladdin. N-Hydroxysulfosuccinimide (Sulfo-NHS) and 1-ethyl-3-(3-(dimethylamino) propyl) carbodiimide (EDC) were both obtained from Aladdin. DiR Iodide and DiI were obtained from Yeasen Biotechnology (Shanghai). All oligonucleotides were provided by Sangon Biotech (Shanghai, China). NH2-modified NC3S aptamer: 5′-NH2-TGCACTATGTTTTAGCTAGGGTTCCCTCCGGAGATAGTAAGTGCAA-3′.
2.2 Cell lines, collection of conditioned media and RNA interference
2.3 Preparation of Si/DNPs and apt-Si/DNPs
Si/DNPs were formulated according to the solvent evaporation method.34 In short, 2.5 nmol siRNA-HGF was mixed with 16.5 μg PEI in RNase-free H2O and reacted at room temperature for 30 min with intermittent vortexing; 200 μg DOX was dissolved in 10 μL water, then, 0.4 μL triethylamine was added for 2 h to extract DOX. 3.75 mg PLGA and 1.25 mg PLGA-PEG-COOH (PLGA/PLGA-PEG-COOH ratio 3![[thin space (1/6-em)]](https://www.rsc.org/images/entities/char_2009.gif) :
:![[thin space (1/6-em)]](https://www.rsc.org/images/entities/char_2009.gif) 1) were dissolved in 500 μL dichloromethane (DCM). This aqueous solution (50 μL) (0.2 mg extracted DOX and 2.5 nmol siRNA in 50 μL RNase-free water) was added into the above DCM solution (500 μL) drop by drop to form the first emulsion using a probe sonicator for 10 s on ice. Then, the first emulsion was put into 3.0 mL of 2% PVA drop by drop and sonicated again for a double emulsion. The final emulsion was acquired by stirring overnight to remove DCM. The particles were collected by centrifugation (4 °C, 20 min, 12
1) were dissolved in 500 μL dichloromethane (DCM). This aqueous solution (50 μL) (0.2 mg extracted DOX and 2.5 nmol siRNA in 50 μL RNase-free water) was added into the above DCM solution (500 μL) drop by drop to form the first emulsion using a probe sonicator for 10 s on ice. Then, the first emulsion was put into 3.0 mL of 2% PVA drop by drop and sonicated again for a double emulsion. The final emulsion was acquired by stirring overnight to remove DCM. The particles were collected by centrifugation (4 °C, 20 min, 12![[thin space (1/6-em)]](https://www.rsc.org/images/entities/char_2009.gif) 000 rpm) and then washed with ddH2O three times and resuspended in ddH2O. For Coumarin-6, DiR, DiD or DiI-NPs, 100 μg dye were put into the DCM and the others were the same with the protocol for the preparation of Si/DNPs.
000 rpm) and then washed with ddH2O three times and resuspended in ddH2O. For Coumarin-6, DiR, DiD or DiI-NPs, 100 μg dye were put into the DCM and the others were the same with the protocol for the preparation of Si/DNPs.
Before aptamer coupling, the carboxyl groups on the surface of Si/DNPs were activated by excess EDC (100 mM) and NHS (25 mM) coupling reaction in ddH2O for 15 min with gentle shaking at room temperature. The nonreactive reactants were removed by ultrafiltration (10![[thin space (1/6-em)]](https://www.rsc.org/images/entities/char_2009.gif) 000; Millipore) with deionized water three times. And then, the NC3S aptamer was denatured at 90 °C for 15 min and formed the 3D structure after fast cooling. The resultant N-hydroxysuccinimide-activated particles were covalently linked to 10 μL 5′-NH2 modified N-cadherin aptamer (NC3S) (100 μM). After reacting for 6 h with gentle stirring, apt-Si/DNPs were acquired after purifying with deionized water 3 times, then resuspended with ddH2O and stored at 4 °C.
000; Millipore) with deionized water three times. And then, the NC3S aptamer was denatured at 90 °C for 15 min and formed the 3D structure after fast cooling. The resultant N-hydroxysuccinimide-activated particles were covalently linked to 10 μL 5′-NH2 modified N-cadherin aptamer (NC3S) (100 μM). After reacting for 6 h with gentle stirring, apt-Si/DNPs were acquired after purifying with deionized water 3 times, then resuspended with ddH2O and stored at 4 °C.
2.4 Characterization of the nanoemulsions
Dynamic light scattering (DLS, Malvern) was used in the analysis of the average size and zeta-potential of the prepared nanoemulsions. The morphological examination of the Si/DNPs and apt- Si/DNPs was implemented by transmission electron microscopy (TEM; HitachiHT7700, Japan).The bonding of PLGA nanoemulsions (NPs) with aptamers was investigated by the absorption of DNA at 260 nm by UV. The absorption of free NPs was used as the control group.
The amount of free Cy5-siRNA that remained in the NP wash solution was detected using a fluorescence spectrophotometer to calculate the EE % of Cy5-siRNA.35 DOX loaded into NPs was calculated according to the amount of free DOX in the filtrate collected by ultrafiltration using UV at a wavelength of 480 nm.
In vitro release behavior was performed using Cy5-Si/DNPs and apt-Cy5-Si/DNPs. Briefly, 5.0 mg mL−1 prepared NPs were suspended in PBS solution (pH 5.0 and 7.4) containing 150 mM NaCl with gentle shaking (100 rpm, 37 °C). The NP suspension was centrifuged at predetermined time intervals, 200 μL supernatant was collected to quantitate the Cy5-siRNA using a fluorescence spectrophotometer and the remaining solution was replaced with an equal amount (200 μL) of fresh PBS. The percentage of released Cy5-siRNA was normalized to the total Cy5-siRNA trapped in NPs. The DOX release performance from Cy5-Si/DNPs and apt-Cy5-Si/DNPs was measured using the dialysis bag method. Dialysis tubes (MWCO 3400 Da) including 5 mg mL−1 of sample were placed into PBS solution (pH 5.0 and 7.4) with 150 mM NaCl with gentle shaking. 200 μL released medium was collected to detect the concentration of released DOX using UV at 480 nm and then another 200 μL of fresh PBS was added back. Samples were collected and detected in triplicates at a fixed time point.
2.5 Cytotoxicity assay
A cell proliferation assay was performed to estimate the biocompatibility of NPs. In brief, HCT116 or CAFs cells (5000 cells per well) were cultured overnight in 96 well plates. NPs and apt-NPs were added to each well at concentrations of 0, 25, 75, 150, 300, and 600 μg mL−1. After 72 h, Cell Counting Kit-8 (Beyotime) was used to detect the cell viability following the protocol. The absorbance at 450 nm was read via a microplate reader (Bio-Rad, Hercules, CA, USA).2.6 In vitro cellular uptake evaluated by flow cytometry and confocal studies
DiI-labeling NPs and apt-NPs were used to investigate the cellular uptake of NPs in CAFs and HCT116 cells using flow cytometry analysis. 5 × 10⁵ CAFs and HCT116 cells were seeded and cultured overnight, respectively. Next, FBS-free medium containing DiI-NPs and apt-DiI-NPs (at a dose of DiI 10 ng mL−1) was used to treat the cells for 1 h. The cells were washed twice to separate the free NPs. Then, flow cytometry analysis (BD Biosciences) was used to quantitate the trapped NPs in the cells. Moreover, the targeting ability of apt-NPs to CAFs was verified by confocal microscopy. CAFs cells were cultured on confocal dishes overnight and then incubated with DiI-NPs and apt-DiI-NPs for 1 h. The nucleus was stained with 5 μmol mL−1 Hoechst for 15 min and then rinsed twice with PBS for CLSM analysis. HCT116 cells were used as negative controls.To estimate the ability of Si/DNPs and apt-Si/DNPs to deliver both agents simultaneously, siRNA labelled with Cy5 and DOX were co-loaded into the nanoemulsions. The next steps were the same with above.
2.7 Toxicity analysis
The toxicity of different NP formulations on HCT116 and CAFs was also detected using CCK8 respectively. Briefly, 5000 HCT116 or CAFs cells were seeded into 96 well plates for 24 h. Then, 0.1 mL of medium including free siRNA, free DOX, SiNPs, DNPs, Si/DNPs, apt-SiNPs, apt-DNPs, and apt-Si/DNPs (DOX 0.5 μg mL−1, siRNA 40 pmol L−1) was added into the well. 10% CCK8 reagent was added after 72 h incubation and cultured for another 2 h. A microplate reader was used to detect the absorbance at 450 nm.2.8 Cell proliferation assay
A short-term cell proliferation assay was tested using CCK8 reagents according to the manufacturer's protocols. Briefly, CAFs were treated with fresh medium, NPs, apt-NPs, free siRNA, free DOX, SiNPs, DNPs, Si/DNPs, apt-SiNPs, apt-DNPs, and apt-Si/DNPs (DOX 0.5 μg mL−1, siRNA 40 pmol L−1) for 12 h, and CAFs conditioned medium was obtained after a 36 h transfection. 5000 HCT116 cells were seeded into 96 well plates and cultured for 24 h. Then, the cells were treated with FBS-free DMEM medium, CAF CM, or CAF CM collected after treatment with various nanoemulsions. Then, DMEM with 10% CCK8 reagent (100 μL) was added at 24, 48, and 72 h and cultured for another 2 h. A microplate reader was used to detect the absorbance at 450 nm.2.9 Clonogenic assay
300 HCT116 cells were inoculated and treated with FBS-free DMEM medium, CAF CM, or CAF CM (collected after treating with various nanoemulsions) for 24 h. Then the cells were grown for another 10–12 d. Next, a crystal violet solution was used to dye the cells. Colonies forming from 50 or more cells were considered as a clone.2.10 Migration and invasion assay
The migration assay was accomplished with an 8.0 μm insert (Corning, USA). First, the HCT116 cells were starved in serum-free DMEM; then, 4 × 10⁴ HCT116 cells in FBS-free DMEM were placed in the upper transwell chambers. Next, the chambers were inserted into a suitable 24 well plate containing FBS-free DMEM/F-12, CAF-CM, or CAF-CM (collected after treating with various nanoemulsions). After 48 h treatment, the cells were dyed with crystal violet solution after fixing with 4% PFA for 15 min, and the cells in the inside surfaces of the membrane were removed gently. The invading cells were viewed via microscopy. For each group, at least five random fields were observed. For the invasion assay, Matrigel (Corning, USA) was pro-coated on the inner surface of the transwell insert 12 h before the experiment.2.11 Efficiency of gene silencing by nanoemulsions via rt-PCR
CAFs were treated with fresh medium, NPs, apt-NPs, free siRNA, free DOX, SiNPs, DNPs, Si/DNPs, apt-SiNPs, apt-DNPs, and apt-Si/DNPs (DOX 0.5 μg mL−1, siRNA 40 pmol L−1) for 12 h respectively. Total RNA was extracted at 36 h post-transfection and qRT-PCR was performed according to Section 2.3. The relative transcription efficiency was calculated using a ΔΔCt method, and the standardized reference gene was GAPDH. The following HGF specific primer was used: (forward: 5′-CTGCAGACCAATGTGCTAATAGA3′, reverse: 5′-TGCTATTGAAGGGGAACCAG3′).2.12 Penetration of NPs in vitro and in vivo
![[thin space (1/6-em)]](https://www.rsc.org/images/entities/char_2009.gif) :
:![[thin space (1/6-em)]](https://www.rsc.org/images/entities/char_2009.gif) 200).
200).
![[thin space (1/6-em)]](https://www.rsc.org/images/entities/char_2009.gif) :
:![[thin space (1/6-em)]](https://www.rsc.org/images/entities/char_2009.gif) 50).
50).
2.13 In vivo antitumor study
Female nude Balb/c nu mice were obtained from Nanjing Skorui Biotechnology Co., Ltd (6–8 weeks, 18–22 g). HCT116 cells (3 × 10⁶ cells) and CAFs (1 × 10⁶ cells) were mixed and injected into the right flank of nude mice. Then, mice were administered with PBS, apt-NPs, free DOX, Si/DNPs, apt-SiNPs, apt-DNPs and apt-Si/DNPs (siRNA 1 mg kg−1, DOX 2 mg kg−1) intravenously every two days for six injections. Tumors were gauged by a caliper to record the longest diameter (A) and the shortest diameter (B) to calculate the tumor volumes using the following formula: π/6 × A × B2. Tumors were excised to prepare sections including HE stains, TUNEL assay, and IHC analysis.For the metastasis model, 1 × 10⁶ cells (HCT116/CAFs cells 3![[thin space (1/6-em)]](https://www.rsc.org/images/entities/char_2009.gif) :
:![[thin space (1/6-em)]](https://www.rsc.org/images/entities/char_2009.gif) 1) in 100 μL PBS were intravenously injected into the nude mice. 25 d after injection, mice were intravenously treated with PBS, apt-NPs, free DOX, Si/DNPs, apt-SiNPs, apt-DNPs, and apt-Si/DNPs (siRNA 1 mg kg−1, DOX 2 mg kg−1) every two days for seven injections in total. The lungs were excised and photographed after a 40 d experiment. Tumors were excised to prepare sections including HE staining and IHC analysis.
1) in 100 μL PBS were intravenously injected into the nude mice. 25 d after injection, mice were intravenously treated with PBS, apt-NPs, free DOX, Si/DNPs, apt-SiNPs, apt-DNPs, and apt-Si/DNPs (siRNA 1 mg kg−1, DOX 2 mg kg−1) every two days for seven injections in total. The lungs were excised and photographed after a 40 d experiment. Tumors were excised to prepare sections including HE staining and IHC analysis.
To appraise the biosafety of nanoemulsions, creatine kinase (CK), white blood cell (WBC) count, aspartate transaminase (AST), and alanine aminotransferase (ALT) were tested. Major organs were resected for preparing histological sections and imaged with microscopy. All experiments were performed in compliance with the relevant laws and institutional guidelines, and were approved by the ethics committee of CAS Key Laboratory for Nano-Bio Interface, Suzhou Institute of Nano-Tech and Nano-Bionics, Chinese Academy of Sciences. The experimental operation was carried out in accordance with the National Institute of Health Guide for the Care and Use of Laboratory Animals.
2.14 In vivo biodistribution studies
Living-body fluorescence images were assessed via IVIS at a fixed time point after intravenous administration with DiR-NPs or apt-DiR-NPs (DiR: 0.4 mg kg−1). Tumors and major organs were collected at the end of the experiment for ex vivo imaging for the tissue distribution study.2.15 Statistical analysis
All studies were implemented three times and Prism 8.0 was used to analyze the statistics. All the results are exhibited with the mean ± standard deviation (SD). The considered significance was set at P < 0.05.3. Results and discussion
3.1. Preparation and characterization of apt-Si/DNPs
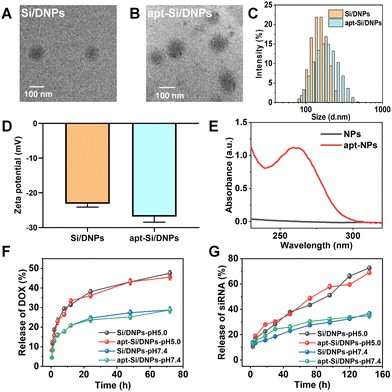
SiRNA/DOX-loaded poly (lactic-co-glycolic acid) nanoemulsions (Si/DNPs) were formulated using the double-emulsion solvent evaporation method. To improve siRNA encapsulation, a small amount of the cationic polymer PEI was added during the formulation of NPs. Subsequently, the resulting Si/DNPs were conjugated to the NC3S aptamer through peptide linkage to form NC3S aptamer-modified Si/DNPs (apt-Si/DNPs). Transmission electron microscope (TEM) imaging revealed that both Si/DNPs and apt-Si/DNPs possessed spherical structures (Fig. 1A and B). Additionally, apt-Si/DNPs displayed a slightly larger hydrodynamic size and more negative surface charge than Si/DNPs (Fig. 1C and D). Furthermore, the average diameter of Si/DNPs and apt-Si/DNPs displayed no significant differences after 7 days storage in PBS (Fig. S3, ESI†), indicating the good long-term stability of our nanoparticles. The characteristic absorption peak of the aptamer at 260 nm appeared in the UV-vis spectrum of the apt-Si/DNPs (Fig. 1E). These results indicated the successful conjugation of the NC3S aptamer onto the Si/DNPs. We also prepared doxorubicin (DOX)-loaded nanoemulsions (DNPs) and siRNA-loaded nanoemulsions (SiNPs) as well as the corresponding NC3S aptamer-modified nanoemulsions (apt-DNPs and apt-SiNPs) as control groups for subsequent experiments. All these nanoemulsions showed negative surface charge and good monodispersity (Fig. S2, ESI†).After structural characterization, the drug-loading capacity and release behavior were investigated. Both DOX and siRNA were encapsulated in single- or dual-agent-loaded nanoemulsions. The encapsulation efficiency (EE%) of siRNA and DOX in apt-Si/DNPs was 92.4 ± 1.8% and 62.4 ± 8.1%, respectively, while the drug loading content (DL%) of siRNA and DOX in apt-Si/DNPs were 0.5 ± 0.075% and 2.1 ± 0.7%, respectively (Table S1, ESI†). The pH-dependent release of Si/DNPs and apt-Si/DNPs was due to the accelerated degradation of PLGA polymer under acidic conditions, which was in line with the previous reports.37,38 More than 40% of DOX was released rapidly over the first 24 h at pH 5.0, while the release content of siRNA was also increased under low pH conditions, which was due to the faster dissociation of nanoemulsions. A similar release tendency was observed for the Si/DNPs, indicating that the NC3S aptamer modification had a negligible influence on drug release (Fig. 1F and G). The pH-responsive release property is important in cancer therapy because the extracellular microenvironment of tumor tissues and intracellular lysosomes is acidic.
3.2. Cellular uptake, cytotoxicity, and gene-silencing effect
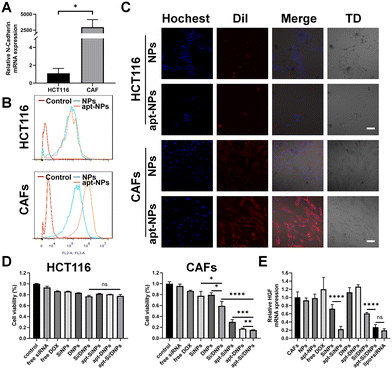
CAFs were generated by inducing the differentiation of UC-MSCs using cancer cell-generated conditioned medium. As illustrated in Fig. S4A and B (ESI†), UC-MSCs exhibited a larger volume and an increase in cytoplasmic content after incubation with cancer cell-generated conditioned medium. Additionally, the expression levels of CAF biomarkers, including FAP, SDF-1, α-SMA and vimentin, were significantly elevated (Fig. S4C, ESI†). These results indicated the successful generation of CAFs. As expected, the expression level of HGF in CAFs was higher than that in UC-MSCs cells and it could be a knockdown through transfecting siRNA-HGF (Fig. S4D and E, ESI†). Furthermore, flow cytometry showed that NC3S had a high binding capacity to CAFs, but was hardly bound to HCT116 and HIEC cells (Fig. S4G–I, ESI†), which was possibly due to the high mRNA expression of N-cadherin on the surface of CAFs, as verified by RT-PCR (Fig. 2A and Fig. S4F, ESI†). We investigated the CAF-targeting ability of NC3S-modified nanoemulsions (apt-NPs). The cellular internalization behavior of DiI-labeled NPs and apt-NPs was detected in HCT116 cells and CAFs using a confocal laser scanning microscope (CLSM) and flow cytometry. As expected, apt-NPs exhibited a higher cellular uptake efficacy than non-targeted NPs in CAFs, whereas both apt-NPs and NPs showed similar cellular uptake in HCT116 cells (Fig. 2B and C). Additionally, the cellular internalization of apt-NPs in CAFs was remarkably higher than that in HCT 116 cells. Consistent tendencies were observed in the apt-Si/DNPs and Si/DNPs. The apt-Si/DNPs were more efficiently internalized by CAF cells than Si/DNPs, whereas there is no observable difference in cellular internalization between apt-Si/DNPs and Si/DNPs in HCT116 cells (Fig. S5, ESI†). These results indicated that the modification of the NC3S improved the CAF-targeted properties.The cytotoxicity of these nanoemulsions was evaluated in CAF and HCT 116 cells. As shown in Fig. 2D and Fig. S6 (ESI†), NPs and apt-NPs didn’t induce observable changes in cell viability compared to the control group, indicating good biocompatibility of the prepared nanoemulsions. Free DOX and siRNA, SiNPs, DNPs, Si/DNPs, apt-SiNPs, apt-DNPs and apt-Si/DNPs showed cytotoxicity toward CAFs and HCT 116 cells. Additionally, the viability of HCT 116 cells after treatment with SiNPs, DNPs and Si/DNPs was not significantly different from that of apt-SiNPs, apt-DNPs and apt-Si/DNPs. In contrast, the aptamer-modified nanoemulsions (apt-SiNPs, apt-DNPs and apt-Si/DNPs) displayed higher cytotoxicity than SiNPs, DNPs and Si/DNPs in CAFs cells, which could be attributed to enhanced endocytosis. In light of its superior CAF-targeting ability, the HGF gene-silencing efficiency of apt-Si/DNPs was subsequently investigated. The knockdown effect of apt-SiNPs was up to 68.47 ± 11.88%, which was remarkably higher than that of SiNPs and even approximate to the commercial transfection reagent Lipofectamine 3000 (lipo + siRNA) (Fig. 2E). Notably, HGF mRNA expression was elevated after treatment with apt-DNPs, which is in line with previous findings that chemotherapy could induce the upregulation of HGF mRNA.27 Interestingly, apt-Si/DNPs achieved 68.47 ± 11.88% of HGF mRNA silencing, suggesting that our apt-Si/DNPs could effectively suppress negative feedback upregulation of mRNA induced by chemotherapy. Consistent with mRNA expression, ELISA results showed that apt-Si/DNPs induced the lowest level of HGF protein expression (Fig. S7, ESI†). These results indicated that apt-Si/DNPs could knock down the upregulated HGF mRNA and decrease the expression of HGF protein in the remaining CAFs after chemotherapy.
3.3. Inhibition of CAF-induced cancer cell proliferation, migration and invasion
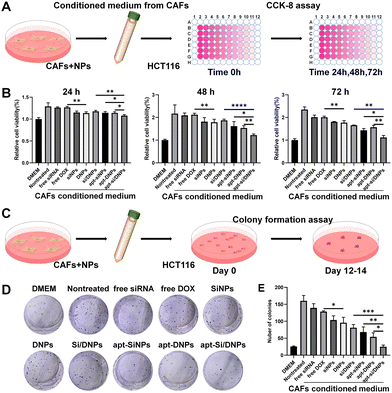
CAFs have been reported to secrete HGF to activate c-MET receptors on the membrane of cancer cells, which can induce the proliferation, migration and invasion of cancer cells.39–41 Our apt-Si/DNPs are expected to reduce the crosstalk between CAFs and cancer cells through the combined effect of directly killing CAFs and reducing HGF secretion, thereby preventing tumor malignancy. To investigate the inhibition of CAF-induced proliferation of cancer cells, HCT 116 cells were incubated with various formulations of CAF-conditioned medium and then the viability of HCT 116 cells was measured by CCK8 assay (Fig. 3A). As shown in Fig. 3B and Fig. S8 (ESI†), HCT116 cells showed obviously accelerated proliferation with 1.29-, 2.17- and 2.35-fold promotion in the CAF-conditioned medium for 24, 48 and 72 h, respectively, compared with that in the free DMEM medium.When CAFs were pretreated with free siRNA, free DOX, SiNPs, DNPs, Si/DNPs, apt-SiNPs, apt-DNPs or apt-Si/DNPs, CAF-induced proliferation was effectively inhibited, indicating that both chemotherapy and siRNA inhibited CAF-induced cancer cell proliferation. Additionally, apt-DNPs showed a higher therapeutic efficiency than free DOX and DNPs and a similar tendency was observed in free siRNA, SiNPs and apt-SiNPs, which was likely due to the higher cellular internalization after aptamer modification. The strongest inhibition of HCT 116 cells was found in the apt-Si/DNP group among all treatment groups.
To evaluate the long-term inhibition, the proliferation of HCT 116 cells was detected in various groups of CAF-conditioned medium using a colony formation assay (Fig. 3C). Corresponding to the CCK8 assay, a significant increase in the number of HCT 116 cell colonies was observed after treatment with the CAF-conditioned medium. In contrast, colony formation was clearly reduced after treatment with various formulations and the number of colonies in the apt-Si/DNPs group was the lowest (Fig. 3D, E and Fig. S9, ESI†). These results confirmed that apt-Si/DNPs inhibited CAF-induced proliferation of HCT116 cells through the combined effect of chemotherapy and gene silencing.
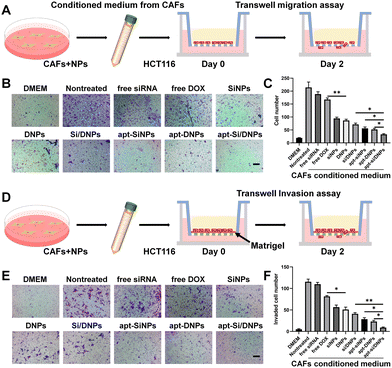
To investigate CAF-induced cancer cell migration, CAF-conditioned media were collected after treatment with various formulations and the migration test of HCT 116 cells was performed using a Transwell migration model (Fig. 4A). As shown in Fig. 4B, C and Fig. S10 (ESI†), the migration of HCT 116 cells was remarkably increased in the CAF-conditioned medium, while CAF-induced migration was obviously decreased by free siRNA, free DOX, SiNPs, DNPs, Si/DNPs, apt-SiNPs, apt-DNPs and apt-Si/DNPs. Additionally, apt-Si/DNPs showed the highest inhibitory effect on CAF-induced cancer cell migration, which was consistent with the above results on proliferation inhibition. The CAF-induced invasion of HCT116 cells was also detected using a Matrigel-covered transwell model (Fig. 4D). With a similar tendency in the migration assay, CAFs promoted HCT 116 cells to invade the lower chamber, whereas the function on promoting the invasion of HCT 116 cells was inhibited in the apt-Si/DNPs group (Fig. 4E, F and Fig. S11, ESI†). These results proved that apt-Si/DNP-mediated therapy disturbed the function of CAFs and slowed down the migration and invasion of tumor cells.
3.4. Improved tumor penetrability ability in vitro and in vivo
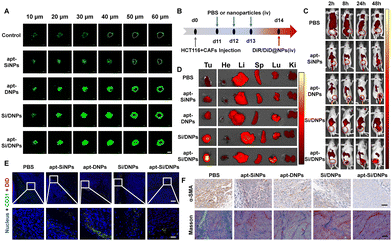
CAFs not only support tumor proliferation, migration and invasion through reciprocal cross-talk with cancer cells but also remodel the ECM and architecture of the TME, often resulting in poor penetration of therapeutic agents.36,42 Therefore, the penetration efficiency was evaluated in cell spheroids containing HCT 116 cells and CAFs after being pretreated with various formulations using CLSM. As shown in Fig. 5A and Fig. S12 (ESI†), the fluorescence signals were mainly located on the periphery of the cell spheroid after incubation with Cou6-labeled NPs. In contrast, when the cell spheroids were pretreated with apt-SiNPs, apt-DNPs, Si/DNPs or apt-Si/DNPs, the NPs were distributed deeper in the cell spheroids compared with the control group. In particular, apt-Si/DNPs had the highest accumulation level in the cell spheroids among all treatment groups.To further investigate tumor penetrability in vivo, HCT 116 tumor-bearing nude mice were established and intravenously injected with PBS, apt-SiNPs, apt-DNPs, Si/DNPs or apt-Si/DNPs. Collagen, one of the most important ECM components secreted by CAFs, was detected using the Masson Trichrome assay. As shown in Fig. 5F and Fig. S15, 16 (ESI†), both collagen and CAFs in tumors decreased significantly after three consecutive treatments with apt-SiNPs, apt-DNPs, Si/DNPs or apt-Si/DNPs. Furthermore, the apt-Si/DNPs showed the best effect in eliminating CAFs and reducing collagen. Abundant collagen and CAFs are critical for abnormally elevated interstitial fluid pressure and solid stress, which play vital roles in the poor penetration of drugs.43 Thus, the biodistribution of DiR-NPs was detected in HCT 116 tumor models pretreated with various formulations (Fig. 5B). As expected, DiR-NPs achieved the highest tumoral accumulation in the apt-Si/DNPs-pretreated tumor models, which was nearly 7-fold higher than in the PBS-pretreated group (Fig. 5C, D and Fig. S13, ESI†). Additionally, in the apt-Si/DNPs-pretreated group, most of the DiD-NPs diffused away from the blood vessels and were distributed in the tumor region (Fig. 5E and Fig. S14, ESI†). These results indicated that apt-Si/DNPs could improve the accumulation and penetration of nanodrugs within solid tumors for alleviating therapeutic resistance. Furthermore, the ECM, as a guarding barrier and dense scaffold through surrounding tumor cells, can inhibit T cell infiltration and reduce the antitumor immune response. Our apt-Si/DNPs efficiently eliminated CAFs and reduced collagen, which might improve the immunotherapy efficacy.
3.5. In vivo antitumor growth and metastasis
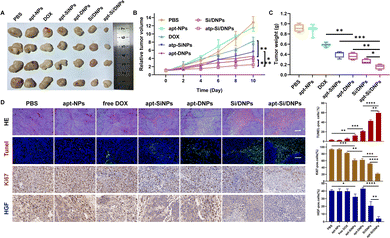
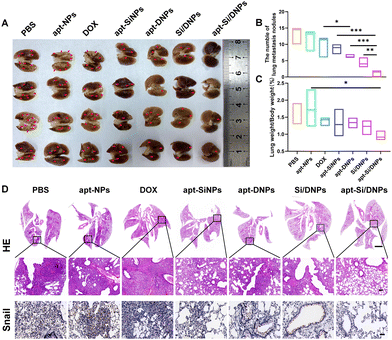
Having demonstrated the combined effects of apt-Si/DNPs, their inhibitory effect on tumor growth and metastasis was evaluated in vivo. The mice in the seven groups were intravenously injected with different PBS, apt-NPs, DOX, apt-SiNPs, apt-DNPs, Si/DNPs and apt-Si/DNPs formulations every 2 days at a fixed DOX dose (2 mg kg−1) and siRNA dose (1 mg kg−1) for a total of six administrations and the experiment was terminated on day 23. As shown in Fig. 6A–C, HCT 116 tumors treated with PBS or apt-NPs grew rapidly, indicating that apt-NPs had no effect on tumor growth. Compared to the control groups, tumor growth inhibition was observed in the DOX-, apt-SiNPs-, apt-DNPs-, Si/DNPs- and apt-Si/DNP-treated groups. In particular, apt-DNP treatment resulted in a lower tumor volume and lower weight than free DOX, which might be attributed to the targeting effect of the aptamer. As expected, apt-Si/DNPs displayed the highest level of tumor growth delay among all the groups. To further exploit the mechanism of the antitumor effect, HE and TUNEL staining of the excised tumors was carried out to evaluate the damage and apoptotic rates, respectively. As shown in Fig. 6D, the degree of tumor damage and apoptosis were in line with that of tumor inhibition. The apt-Si/DNPs induced the largest tumor damage and the highest apoptotic rate compared with the other groups. Notably, both free DOX and apt-DNP failed to decrease the secretion of HGF protein due to chemotherapy-induced upregulation of HGF mRNA, whereas the secreted HGF proteins from CAFs declined in the tumors of mice treated with apt-Si/DNPs, further confirming the superiority of synergistic gene/chemotherapy for regulating TME. Additionally, the expression of Ki-67, a protein that serves as a cellular marker for proliferation, was remarkably inhibited in the tumors by apt-Si/DNPs than those by other groups (Fig. 6D). These results indicated that apt-Si/DNPs could efficiently delay cancer cell proliferation. Subsequently, antimetastatic efficacy was investigated using a pulmonary metastasis model (Fig. 7 and Fig. S17, ESI†). Similar to the results in the xenograft model, the number of pulmonary metastatic nodules was lowest in the apt-Si/DNP group. To explore the metastasis inhibition mechanism, Snail as a key metastatic marker was detected in tumors after various treatments.44 As expected, apt-Si/DNP significantly downregulated the expression of Snail compared with other groups. Overall, these results confirmed that apt-Si/DNPs were effective in inhibiting tumor growth and metastasis.Encouraged by the prominently therapeutic outcomes, we investigated the biodistribution of NPs and apt-NPs in tumors and major organs. As shown in Fig. S18 (ESI†), both apt-NPs and NPs accumulated predominantly in tumor tissues and the reticuloendothelial system of the liver and spleen. Additionally, more apt-NPs were distributed in the tumor tissues than NPs owing to aptamer-mediated tumor targeting in vivo. Importantly, the body weight (Fig. S19, ESI†), serum biochemistry index (Fig. S20 and S21, ESI†) and organ histopathology (Fig. S22 and S23, ESI†) in the apt-Si/DNP groups were not significantly different from those in the control group. These results indicated the low systemic toxicity of apt-Si/DNPs.
4. Conclusions
In conclusion, a CAF-targeted nanodrug delivery system, named apt-Si/DNPs, was successfully developed for the co-delivery of siRNA and DOX. Owing to the modification of the NC3S aptamer, apt-Si/DNPs showed highly specific binding with the N-cadherin protein on the surface of the CAFs, which significantly enhanced the internalization of siRNA and DOX into CAFs. Through targeting of the CAFs and the synergy of chemotherapy with HGF gene silencing, apt-Si/DNPs interfered with the crosstalk between CAFs with colorectal cancer cells significantly and inhibited CAF-induced cancer cell proliferation, migration, and invasion. Importantly, due to the elimination of CAFs, the production of collagen was decreased, and destruction of the physical barrier (CAFs and collagen) was achieved, which improved tumor permeability and alleviated therapeutic resistance. Based on these combination effects, apt-Si/DNPs not only effectively inhibited tumor growth but also suppressed tumor metastasis with no noticeable systemic toxicity. Collectively, our findings provide new perspectives for the development of cancer therapy strategies.Abbreviations
| CAFs | Cancer-associated fibroblasts |
| ECM | Extracellular matrix |
| PLGA | Poly(lactic-co-glycolic acid) |
| HGF | Hepatocyte growth factor |
| TME | Tumor microenvironment |
| CRC | Colorectal cancer |
| NC3S | N-cadherin aptamers |
| FAP | Fibroblast activation protein |
| SDF-1 | Stromal cell-derived factor 1 |
| α-SMA | α-Smooth muscle actin |
Author contributions
WQS, ZW, RJP and CGX designed the experiment. WQS carried out the main research and conducted data analysis. PAY and WJL prepared some of the figures, and CJG, TG and YC prepared some of the references. WQS and ZW wrote the manuscript. WQS, ZW, RJP and CGX co-revised the manuscript. All authors approved the final manuscript.Conflicts of interest
There are no conflicts to declare.Acknowledgements
This work was supported by the National Natural Science Foundation of China (81672970, 81172348, 22177129); the Natural Science Foundation of Jiangsu Province (20220295); Social development project of Jiangsu Provincial Department of Science and Technology (BE2020766, BE2021665); Medical research Key project of Jiangsu Provincial Health Commission (ZD2021045); Suzhou basic research pilot project (SJC 2021004).References
- E. Dekker, P. J. Tanis, J. L. A. Vleugels, P. M. Kasi and M. B. Wallace, Lancet, 2019, 394, 1467–1480 CrossRef.
- F. Petrelli, F. Trevisan, M. Cabiddu, G. Sgroi, L. Bruschieri, E. Rausa, M. Ghidini and L. Turati, Ann. Surg., 2020, 271, 440–448 CrossRef PubMed.
- R. L. Siegel, K. D. Miller and A. Jemal, Ca-Cancer J. Clin., 2020, 70, 7–30 CrossRef.
- D. F. Quail and J. A. Joyce, Nat. Med., 2013, 19, 1423–1437 CrossRef CAS PubMed.
- M. M. Mueller and N. E. Fusenig, Nat. Rev. Cancer, 2004, 4, 839–849 CrossRef CAS.
- Y. Liu, D. Zhang, Z.-Y. Qiao, G.-B. Qi, X.-J. Liang, X.-G. Chen and H. Wang, Adv. Mater., 2015, 27, 5034–5042 CrossRef CAS PubMed.
- A. I. Minchinton and I. F. Tannock, Nat. Rev. Cancer, 2006, 6, 583–592 CrossRef CAS.
- D. Park, E. Sahai and A. Rullan, Cell, 2020, 181, 486 CrossRef CAS.
- C. Gaggioli, S. Hooper, C. Hidalgo-Carcedo, R. Grosse, J. F. Marshall, K. Harrington and E. Sahai, Nat. Cell Biol., 2007, 9, 1392 CrossRef CAS PubMed.
- L. A. Boardman, Genome Med., 2009, 1, 36 CrossRef PubMed.
- T. Yang, H. Zhiheng, W. Zhanhuai, X. Qian, L. Yue, G. Xiaoxu, W. Jingsun, Z. Shu and D. Kefeng, Front. Oncol., 2020, 10, 1747 CrossRef PubMed.
- F. Shojaei, B. H. Simmons, J. H. Lee, P. B. Lappin and J. G. Christensen, Cancer Lett., 2012, 320, 48–55 CrossRef CAS PubMed.
- Z. Shao, H. Pan, S. Tu, J. Zhang, S. Yan and A. Shao, Front. Cell. Dev. Biol., 2020, 8, 801 CrossRef PubMed.
- T. A. Denison and Y. H. Bae, J. Controlled Release, 2012, 164, 187–191 CrossRef CAS PubMed.
- I. A. Khawar, J. H. Kim and H.-J. Kuh, J. Controlled Release, 2015, 201, 78–89 CrossRef CAS.
- Y. Matsumura, Adv. Drug Delivery Rev., 2012, 64, 710–719 CrossRef CAS.
- V. P. Chauhan, T. Stylianopoulos, Y. Boucher and R. K. Jain, in Annu. Rev. Chem. Biomol. Eng. 2, ed. J. M. Prausnitz, 2011, vol. 2, pp. 281–298 Search PubMed.
- I. Primac, E. Maquoi, S. Blacher, R. Heljasvaara, J. Van Deun, H. Y. H. Smeland, A. Canale, T. Louis, L. Stuhr, N. E. Sounni, D. Cataldo, T. Pihlajaniemi, C. Pequeux, O. De Wever, D. Gullberg and A. Noel, J. Clin. Invest., 2019, 129, 4609–4628 CrossRef CAS.
- P.-J. Sung, N. Rama, J. Imbach, S. Fiore, B. Ducarouge, D. Neves, H.-W. Chen, D. Bernard, P.-C. Yang, A. Bernet, S. Depil and P. Mehlen, Cancer Res., 2019, 79, 3651–3661 CrossRef CAS PubMed.
- R. Mishra, S. Haldar, V. Placencio, A. Madhav, K. Rohena-Rivera, P. Agarwal, F. Duong, B. Angara, M. Tripathi, Z. Liu, R. A. Gottlieb, S. Wagner, E. M. Posadas and N. A. Bhowmick, J. Clin. Invest., 2018, 128, 4472–4484 CrossRef PubMed.
- Y. Cao, K. Lei, X. Zhang, L. Xu, C. Lin and Y. Yang, Ecotoxicol. Environ. Saf., 2018, 164, 210–218 CrossRef CAS.
- A. Berndt, P. Richter, H. Kosmehl and M. Franz, Cell Adhes. Migr., 2015, 9, 105–111 CrossRef CAS.
- N. Kubo, K. Araki, H. Kuwano and K. Shirabe, World J. Gastroenterol., 2016, 22, 6841–6850 CrossRef CAS PubMed.
- J. Liu, H. Cabral, B. Song, I. Aoki, Z. Chen, N. Nishiyama, Y. Huang, K. Kataoka and P. Mi, ACS Nano, 2021, 15(8), 13526–13538 CrossRef CAS PubMed.
- E. H. Cheteh, M. Augsten, H. Rundqvist, J. Bianchi, V. Sarne, L. Egevad, V. J. N. Bykov, A. Ostman and K. G. Wiman, Cell Death Dis., 2017, 8, e2848 CrossRef CAS PubMed.
- R. Straussman, T. Morikawa, K. Shee, M. Barzily-Rokni, Z. R. Qian, J. Du, A. Davis, M. M. Mongare, J. Gould, D. T. Frederick, Z. A. Cooper, P. B. Chapman, D. B. Solit, A. Ribas, R. S. Lo, K. T. Flaherty, S. Ogino, J. A. Wargo and T. R. Golub, Nature, 2012, 487, 500–504 CrossRef CAS PubMed.
- Z. F. Karagonlar, D. Koc, E. Iscan, E. Erdal and N. Atabey, Cancer Sci., 2016, 107, 407–416 CrossRef.
- S. P. Pothula, Z. Xu, D. Goldstein, N. Merrett, R. C. Pirola, J. S. Wilson and M. V. Apte, Oncotarget, 2017, 8, 76722–76739 CrossRef PubMed.
- S. M. Elbashir, J. Harborth, W. Lendeckel, A. Yalcin, K. Weber and T. Tuschl, Nature, 2001, 411, 494–498 CrossRef CAS.
- X. Wu, X. Chen, Q. Zhou, P. Li, B. Yu, J. Li, Y. Qu, J. Yan, Y. Yu, M. Yan, Z. Zhu, B. Liu and L. Su, Cancer Lett., 2013, 335, 128–135 CrossRef CAS PubMed.
- L. Aagaard and J. J. Rossi, Adv. Drug Delivery Rev., 2007, 59, 75–86 CrossRef CAS PubMed.
- T. Gao, P. Ding, W. J. Li, Z. L. Wang, Q. Lin and R. J. Pei, Nanoscale, 2020, 12, 22574–22585 RSC.
- N. Beeravolu, C. McKee, A. Alamri, S. Mikhael, C. Brown, M. Perez-Cruet and G. R. Chaudhry, J. Vis. Exp., 2017, 55224, DOI:10.3791/55224.
- C. Xu, W. Liu, Y. Hu, W. Li and W. Di, Theranostics, 2020, 10, 3325–3339 CrossRef CAS PubMed.
- J. Gu, S. Yang and E. A. Ho, Mol. Pharmaceutics, 2015, 12, 2889–2903 CrossRef CAS PubMed.
- B. L. Chen, W. B. Dai, D. Mei, T. Z. Liua, S. X. Li, B. He, B. He, L. Yuan, H. Zhang, X. Q. Wang and Q. Zhang, J. Controlled Release, 2016, 241, 68–80 CrossRef CAS PubMed.
- T. Yu, B. Xu, L. He, S. Xia, Y. Chen, J. Zeng, Y. Liu, S. Li, X. Tan, K. Ren, S. Yao and X. Song, Int. J. Nanomedicine, 2016, 11, 743–759 CAS.
- J. Zhao, H. Yang, J. Li, Y. Wang and X. Wang, Sci. Rep., 2017, 7, 18014 CrossRef.
- Q. Song, J. Jia, X. Niu, C. Zheng, H. Zhao, L. Sun, H. Zhang, L. Wang, Z. Zhang and Y. Zhang, Nanoscale, 2019, 11, 15958–15970 RSC.
- D. P. Wen, Y. H. Wang, Z. H. Zhu, Z. Y. Huang, L. Cui, T. Y. Wu and C. Y. Liu, Biochim. Biophys. Acta, Mol. Basis Dis., 2020, 1866, 165923 CrossRef CAS PubMed.
- Z. Xu, T. C. Y. Pang, A. C. Liu, S. P. Pothula, A. R. Mekapogu, C. J. Perera, T. Murakami, D. Goldstein, R. C. Pirola, J. S. Wilson and M. V. Apte, Br. J. Cancer, 2020, 122, 1486–1495 CrossRef CAS.
- Y. Zhu, F. Yu, Y. Tan, H. Yuan and F. Hu, Pharmacol. Res., 2019, 148, 104401 CrossRef CAS PubMed.
- N. A. Bhowmick, E. G. Neilson and H. L. Moses, Nature, 2004, 432, 332–337 CrossRef CAS PubMed.
- H. Cheng, Z. Jiang, C. Sun, Z. Wang, G. Han, X. Chen, T. Li, Z. Fan, F. Zhang, X. Yang, L. Lv, H. Zhang, J. Zhou and Y. Ding, Chem. Eng. J., 2022, 427 DOI:10.1016/j.cej.2021.131672.
Footnote |
| † Electronic supplementary information (ESI) available: [DETAILS]. See DOI: https://doi.org/10.1039/d2tb02253b |
| This journal is © The Royal Society of Chemistry 2023 |

