
 Open Access Article
 This Open Access Article is licensed under a
 Creative Commons Attribution 3.0 Unported Licence
Enhancement of thermoelectric properties of CuFeS2 through formation of spinel-type microprecipitates†
Sahil
Tippireddy‡
 a,
Feridoon
Azough
b,
Animesh
Bhui
c,
Iuliia
Mikulska
d,
Robert
Freer
b,
Kanishka
Biswas
c,
Paz
Vaqueiro
a and
Anthony V.
Powell
*a
a,
Feridoon
Azough
b,
Animesh
Bhui
c,
Iuliia
Mikulska
d,
Robert
Freer
b,
Kanishka
Biswas
c,
Paz
Vaqueiro
a and
Anthony V.
Powell
*a
aDepartment of Chemistry, University of Reading, Whiteknights, Reading, RG6 6DX, UK. E-mail: a.v.powell@reading.ac.uk
bDepartment of Materials, University of Manchester, Manchester, M13 9PL, UK
cNew Chemistry Unit, Jawaharlal Nehru Centre for Advanced Scientific Research, Jakkur, Bangalore 560064, India
dDiamond Light Source, Harwell Science and Innovation Campus, Didcot, OX11 0DE, UK
First published on 11th October 2023
Abstract
CuFeS2 (chalcopyrite) is a promising n-type thermoelectric candidate for low-grade waste heat recovery. In this work, chromium-containing CuFeS2 materials of general formula Cu1−xCrxFeS2 (0.0 ≤ x ≤ 0.1) were prepared via solid-state synthesis. Efforts to substitute chromium in CuFeS2 leads to the preferential formation of a composite, in which lamellar precipitates of a Cr-rich, spinel-type [Cu,Fe,Cr]3S4 phase, are embedded in the unsubstituted CuFeS2 matrix. X-ray absorption near-edge spectroscopy (XANES) reveals that the electronic structure of copper, iron and sulfur in the principal CuFeS2 phase remains unaltered by chromium incorporation. However, the formation of [Cu,Fe,Cr]3S4 precipitates alters the Cu![[thin space (1/6-em)]](https://www.rsc.org/images/entities/char_2009.gif) :Fe ratio of the CuFeS2 phase, producing a change in the net carrier concentration through reduction of a portion of Fe3+ ions to Fe2+. The chromium content of the spinel precipitates determines the extent of the change in the Cu:Fe ratio of the main CuFeS2 phase, and hence, indirectly affects the electrical properties. The micro/nanometre-sized [Cu,Fe,Cr]3S4 precipitates and nanoscale dislocations enable a broad spectrum of heat-carrying acoustic phonons to be scattered, resulting in a significantly reduced lattice thermal conductivity. Combined with an enhanced power factor, a maximum thermoelectric figure-of-merit, zT of 0.31 at 673 K is achieved for the x = 0.08 sample; a three-fold increase over that of the pristine phase.
:Fe ratio of the CuFeS2 phase, producing a change in the net carrier concentration through reduction of a portion of Fe3+ ions to Fe2+. The chromium content of the spinel precipitates determines the extent of the change in the Cu:Fe ratio of the main CuFeS2 phase, and hence, indirectly affects the electrical properties. The micro/nanometre-sized [Cu,Fe,Cr]3S4 precipitates and nanoscale dislocations enable a broad spectrum of heat-carrying acoustic phonons to be scattered, resulting in a significantly reduced lattice thermal conductivity. Combined with an enhanced power factor, a maximum thermoelectric figure-of-merit, zT of 0.31 at 673 K is achieved for the x = 0.08 sample; a three-fold increase over that of the pristine phase.
Introduction
Thermoelectric materials, capable of converting heat into electricity, have received widespread interest for their ability to generate useful electrical energy from otherwise waste heat in a range of applications.1 The thermoelectric conversion efficiency depends on the figure-of-merit, defined as zT = S2T/ρκ; where S, ρ, κ and T represent the Seebeck coefficient, electrical resistivity, thermal conductivity and temperature, respectively. The thermal conductivity has contributions from both charge carriers (κe) and lattice vibrations (κL). For large-scale applications, it is essential to design and synthesize thermoelectric materials containing cheap, abundant and non-toxic elements. This has motivated a large body of research into binary and higher order copper-sulfides.2–4 Whilst this has resulted in significant improvements in the thermoelectric performance of p-type sulfide materials,5–12 that of n-type analogues remains relatively low.13–16CuFeS2 (chalcopyrite) is a promising n-type thermoelectric material17 which offers a cost-effective and environmentally-friendly alternative to conventional materials such as PbTe,18,19 Bi2Te3 (ref. 20 and 21) and SnSe.22 However, the figure-of-merit of CuFeS2 is relatively low, owing to its moderate power factor and high lattice thermal conductivity.2,23–26 Previous studies have shown that substitution of Cu+ with higher oxidation state cations is an effective means of optimizing the carrier concentration, while reducing the lattice thermal conductivity.23,26–30 In particular, substitution with dipositive transition-metal cations leads to substantial improvements in the power factor (S2/ρ) due to optimization of the carrier concentration.23,26,28 However, with the exception of a few studies,31–33 there has been a general lack of progress in achieving significant reductions in the lattice thermal conductivity. More generally, Liu et al.34 have suggested that glass-like thermal conductivities may be achieved in materials in which there are partially occupied crystallographic sites. A wide range of strategies to effect reductions in thermal conductivity have been reviewed by Ghosh et al.35 In the case of chalcopyrite, it has been shown recently that the substitution of p-block elements such as germanium and indium at the cation sites, introduces a local structural distortion, resulting in enhanced point defect phonon scattering and lattice softening.30–32 Line defects such as dislocations and twinning have also been reported to be beneficial in scattering the heat-carrying acoustic phonons.29,30 Theoretical calculations using density functional theory (DFT) reveal that most of the heat-carrying acoustic phonons in CuFeS2 have mean-free paths in the range of 50 to 500 nm.29,36 Formation of nanocomposites targeting these length scales, therefore, offers an effective strategy for achieving low lattice thermal conductivities. This has been implemented in many materials through a variety of approaches, including spinodal decomposition,37–39 eutectic decomposition,40–42 nucleation and growth,43–45 and matrix encapsulation,46,47 leading to enhanced thermoelectric performance. However, these methods generally require careful heat treatments, rapid cooling/quenching, extensive post synthesis processing, composition tuning or a combination of two or more of these. Although there have been reports of nanostructuring via chemical synthesis48–50 or mechanical alloying,51,52 efforts to achieve multi-phase nano/micro composites in chalcopyrite are generally lacking. However, it has been reported that substitutions of Zn23 and Pd26 at the Cu site in CuFeS2 may lead to the formation of precipitates, enabling lowering of the thermal conductivity.
In this work, we sought to substitute chromium for copper through the preparation of materials of general formula, Cu1−xCrxFeS2 (0.0 ≤ x ≤ 0.1). Chromium is an attractive choice for a substituent as it can adopt a range of oxidation states in transition-metal based sulfides, including +2 (CrS),53 +3 (Cr2S3,53 MCr2S4; M = Cu, Fe, Zn, Cd, Ni, V53–57), mixed +2/+3 (Cr3S4)58 and mixed +3/+4 (CuCr1−xVxS2; x = 0–0.4)59 offering opportunities to effect large changes in carrier concentration. However, results from a variety of state-of-the-art characterization techniques demonstrate that the introduction of chromium preferentially leads to the formation of micro/nano-sized precipitates of a Cr-rich spinel-type phase within a matrix of unsubstituted CuFeS2. The formation of this micro-composite is achieved via standard solid-state synthesis, without the need for any special thermal treatment. The formation of the Cr-rich spinel induces a change in the Cu:Fe ratio of the parent CuFeS2 phase, altering the carrier concentration and therefore, the electrical-transport properties. In addition, the wide range of length scales of the spinel precipitates leads to enhanced scattering of heat-carrying acoustic phonons, resulting in a significant reduction of the lattice thermal conductivity. The changes to the electrical and thermal transport properties, thus, contribute to a significant increase in the figure of merit.
Experimental details
Elemental copper (Sigma-Aldrich, 99.5%), iron (Alfa Aesar, 99%+), chromium (Fisher Scientific, 99.999%) powders and sulfur flakes (Sigma-Aldrich, 99.99%) were mixed in stoichiometric amounts according to the general formula, Cu1−xCrxFeS2 (0.0 ≤ x ≤ 0.1) and sealed in evacuated (∼10−3 mbar) fused silica tubes. The tubes were heated to 723 K, held at this temperature for 150 hours and then cooled at 0.4 K min−1 to room temperature. The products were ground to fine powders using an agate mortar and pestle and re-fired in evacuated fused silica tubes at 1173 K for 48 hours, before cooling to room temperature at 0.4 K min−1. The powders were then re-ground and hot pressed at 873 K for 30 minutes under a pressure of 80 MPa to produce disc shaped pellets (diameter ∼ 13 mm, thickness ∼ 1.5–2 mm). The densities of the hot-pressed pellets determined by the Archimedes method, using an AE Adam PW 184 balance, are >98% of the crystallographic value.Powder X-ray diffraction (PXRD) data for the hot-pressed samples were collected using a Bruker D8 Advance diffractometer (Cu Kα1: λ = 1.5405 Å). Rietveld refinement using the PXRD data was performed using Fullprof software.60 A SIRION FEI FEG-SEM was used to perform scanning electron microscopy (SEM), and energy-dispersive X-ray spectroscopy (EDS) elemental point analysis was carried out using a TESCAN MIRA LC FEG-SEM equipped with an Oxford Instrument SDD energy dispersive detector. High-resolution transmission electron microscopy (HRTEM) and selected area electron diffraction (SAED) was carried out using a FEI Tecnai G2 FEGTEM.
X-ray absorption near edge spectroscopy (XANES) of Cu1−xCrxFeS2 (0 ≤ x ≤ 0.1) was performed on the B18 beamline61 at the Diamond Light Source synchrotron facility, UK. Sulfur (2472 eV), chromium (5989 eV), iron (7112 eV) and copper (8979 eV) K-edge XANES measurements were performed at room temperature using Quick-EXAFS technique. A Si (111) double crystal monochromator was used to select the incident X-ray energy. Chromium, iron and copper K-edge XANES spectra were recorded using a platinum-coated collimating mirror, while for measurements of sulfur K-edge spectra, a collimating mirror with a chromium coating was used. The rejection of higher harmonics was achieved by using two dedicated platinum-coated mirrors in the case of chromium, iron and copper K-edge measurements and nickel-coated mirrors for the sulfur K-edge. Powder samples for chromium, copper and iron K-edge XANES measurements were mixed with cellulose and ground to a fine powder in a mortar and pestle. Ca. 100 mg of each mixture was cold pressed using a stainless-steel die and plunger to make a thin pellet of 13 mm diameter for each composition. For measurements of sulfur K-edge XANES spectra, the powder samples were spread on one side of double-sided adhesive carbon tape and the tape stuck to the aluminium sample holder using the other side of the tape. The copper and iron spectra were collected in transmission mode, whereas chromium spectra were collected in the fluorescence mode using a Canberra 36 pixel Monolithic Segmented Hyper Pure Germanium Detector (HPGe). The sulfur spectra were collected in the total electron yield mode in order to minimize the self-absorption effect. For energy calibration, copper, iron and chromium reference foils and sulfur elemental powder were used. Since chromium is present in very low amounts, a total of 25 data collections were required to collect the chromium spectra for each chromium-containing sample, while 4–6 collections were performed to obtain the copper, iron and sulfur spectra. A set of standards consisting of copper, iron, chromium, sulfur, NiCr2S4, VCr2S4, Cr3S4, LiFeO2, FeS2, Cr2O3, Cu2O and Cr3S4 was also measured (each 5–6 data collections) to aid assignment of oxidation states in the chromium-containing materials. The data calibration, normalization and processing, including merging the data from multiple runs, was performed using the Athena software.62 The absorption edge energies were then extracted and compared with that for pristine CuFeS2 (in which the oxidation states of the elements are well established from X-ray photoelectron spectroscopy),23,29,63–65 and those from the standards, in order to determine the oxidation states of copper, iron, sulfur and chromium in the Cr-containing samples.
Electrical resistivity and Seebeck coefficient measurements (323 ≤ T/K ≤ 723) of hot-pressed pellets of Cu1−xCrxFeS2 were carried out using a Linseis LSR-3 system. An Ecopia HMS-3000 system was used for Hall effect measurements at room temperature. Thermal diffusivity measurements were carried out using a Netzsch LFA-447 NanoFlash (323 ≤ T/K ≤ 573) and an Anter Flashline-3000 (573 ≤ T/K ≤ 673 K). The thermal conductivity was then determined from κ = αCpd, where α denotes the thermal diffusivity, Cp (taken as the Dulong–Petit value of 0.52 J g−1 K−1) is the specific heat capacity, and d is the sample density. The longitudinal (vl) and transverse (vt) sound velocities for disc-shaped hot-pressed pellets were measured using an Epoch 650 Ultrasonic Flaw Detector (Olympus) with a transducer frequency of 5 MHz.
Results and discussion
PXRD data for Cu1−xCrxFeS2 (0 ≤ x ≤ 0.1) (Fig. 1a) can be indexed on the basis of a tetragonal unit cell (space group: I![[4 with combining macron]](https://www.rsc.org/images/entities/char_0034_0304.gif) 2d), confirming the presence of the chalcopyrite-type phase at all compositions. A weak peak, observable as a shoulder on the main (112) peak of the chalcopyrite phase, appears to be consistent with the presence of a secondary [Cu,Fe,Cr]3S4 spinel-type phase, identified by electron microscopy (vide infra). Rietveld refinement (Fig. 1b) reveals that this spinel-type secondary phase is present in very low amounts (<5 vol%) with the majority of the sample consisting of the CuFeS2 chalcopyrite phase. The lattice parameters (inset to Fig. 1b) are relatively invariant as a function of chromium concentration. This provides a first indication that chromium might not be substituting for copper in chalcopyrite but may be forming a secondary phase. The lattice parameter trend also suggests that unlike other transition metals,23,26–28 the solubility limit of chromium in CuFeS2 chalcopyrite is either very low (less than 2 at%) or negligible.
2d), confirming the presence of the chalcopyrite-type phase at all compositions. A weak peak, observable as a shoulder on the main (112) peak of the chalcopyrite phase, appears to be consistent with the presence of a secondary [Cu,Fe,Cr]3S4 spinel-type phase, identified by electron microscopy (vide infra). Rietveld refinement (Fig. 1b) reveals that this spinel-type secondary phase is present in very low amounts (<5 vol%) with the majority of the sample consisting of the CuFeS2 chalcopyrite phase. The lattice parameters (inset to Fig. 1b) are relatively invariant as a function of chromium concentration. This provides a first indication that chromium might not be substituting for copper in chalcopyrite but may be forming a secondary phase. The lattice parameter trend also suggests that unlike other transition metals,23,26–28 the solubility limit of chromium in CuFeS2 chalcopyrite is either very low (less than 2 at%) or negligible.
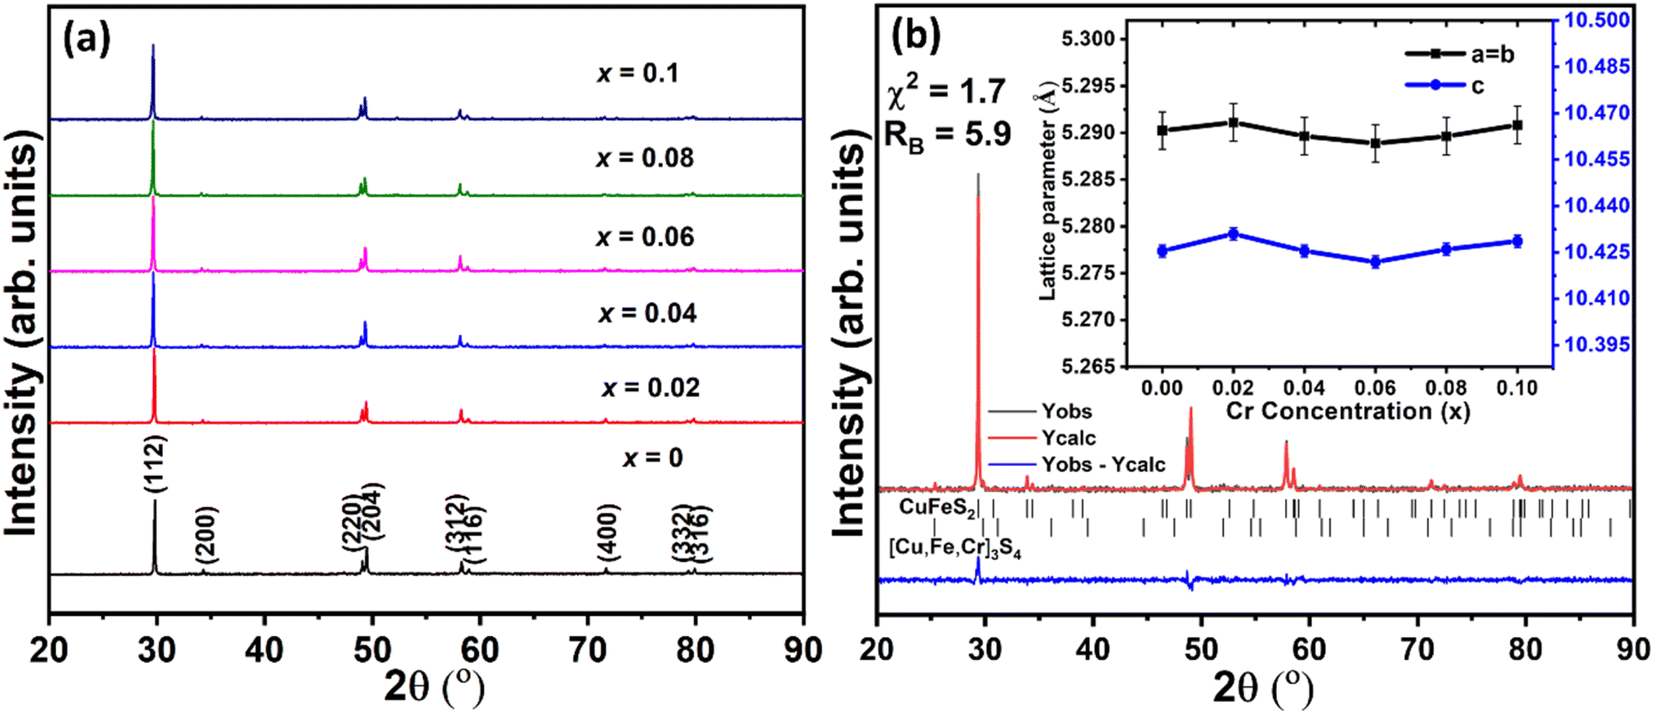 | ||
| Fig. 1 (a) Powder X-ray diffraction (PXRD) data for Cu1−xCrxFeS2 (0 ≤ x ≤ 0.1). (b) Rietveld refinement using data for the x = 0.08 sample. Reflection positions of the main (chalcopyrite) phase and secondary spinel-type phase are marked. The inset illustrates the relative invariance of the lattice parameters of the chalcopyrite phase with chromium concentration. | ||
To investigate further the nature of chromium incorporation in materials of nominal composition Cu1−xCrxFeS2, XANES spectra were collected for each composition (Fig. 2). The absorption edge energies were extracted from the maxima in the derivative of XANES spectra (shown in Fig. S1† for Cu0.92Cr0.08FeS2). The energies of the copper, iron and sulfur absorption edges for all the samples (Table S2†) are similar and, on the basis of comparison with pristine CuFeS2, oxidation states of +1, +3 and −2 can be assigned to Cu, Fe and S, respectively. The similarity of the spectra with a negligible shift in the K-edge energies (Fig. 2) suggests that the introduction of chromium does not significantly alter the oxidation states of the elements in the main chalcopyrite phase. In addition, the similar profiles of the copper, iron and sulfur XANES spectra for all the Cr-containing materials and that of the pristine phase indicates that there is no significant change in the electronic structure or the local bonding and coordination environment in the main chalcopyrite phase on the addition of chromium. However, for the pristine sample, there are additional weak features at 2472 and 2483 eV in the sulfur spectra which can be attributed to a FeS2 secondary phase (Fig. 2c and S2†), the presence of which in the pristine phase has been previously established.29,30 The energy of the absorption edge and the profile of the chromium spectra in the Cr-containing samples (Fig. 1d) is similar to that in the chromium spectrum of the NiCr2S4 standard, suggesting that chromium is present in the +3 oxidation state, in an octahedral coordination with sulfur atoms.57 Together with the identification of a cubic phase by powder X-ray diffraction and TEM (vide infra), this provides strong evidence that the introduction of chromium leads to the formation of a [Cu,Fe,Cr]3S4 spinel-type phase, in preference to a chromium-substituted chalcopyrite phase.
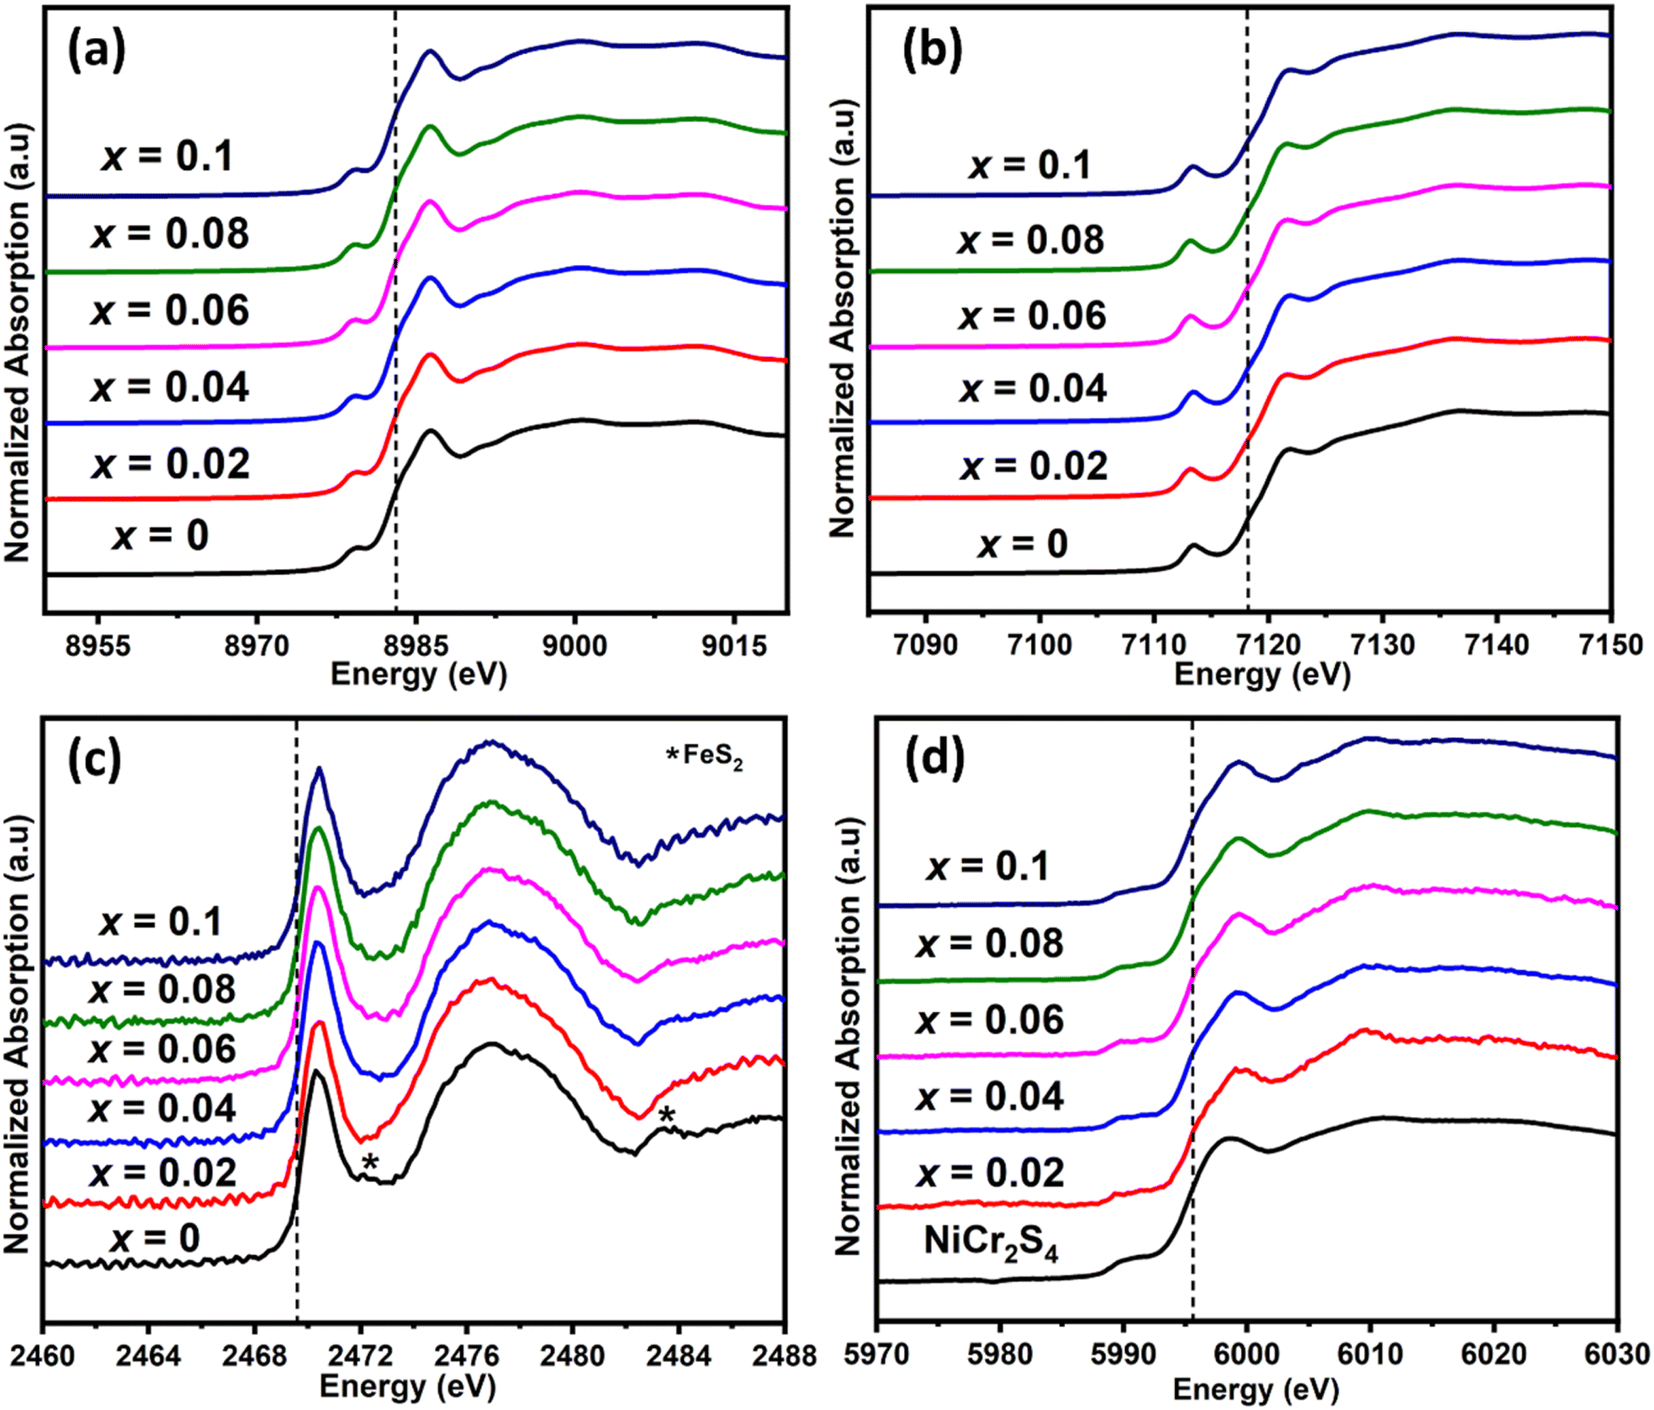 | ||
| Fig. 2 K-edge XANES spectra for (a) copper (b) iron (c) sulfur and (d) chromium in Cu1−xCrxFeS2 (0 ≤ x ≤ 0.1) samples. Spectra are shifted vertically for clarity. | ||
Scanning electron microscopy (SEM) images of all Cr-containing materials, provided in Fig. S3† (the microstructural characterization for x = 0 sample is available in Tippireddy et al.30), show micro-sized precipitates of a secondary phase within the chalcopyrite matrix. These precipitates possess lamellar-like features similar to PbTe-based composites66,67 and have not been observed in other substituted CuFeS2 compounds. Fig. 3 shows the EDS maps for x = 0.04 and 0.08 samples which reveal that these precipitates are composed of a Cr–S rich phase. The EDS maps also reveal that there is negligible chromium present in the main CuFeS2 chalcopyrite phase, confirming that chromium is incorporated into a secondary phase and not as a substituent in the chalcopyrite phase, in agreement with the results of PXRD and XANES. The composition of the secondary phases determined by EDS (Table S3†), reveals an off-stoichiometric Cr-rich M3S4 (M = Cu, Fe, Cr) compound with a varying degree of chromium content. Zub et al.54,55 reported that CumFe1−mCr2S4 (0 ≤ m ≤ 0.1) spinels can retain their structure over a wide range of stoichiometries. The stoichiometry of thiospinels of this type has been shown to be sensitive to cationic substitutions and synthesis conditions, forming off-stoichiometric CumFenCr2−lS4 type compositions (with m, n and l deviating from nominal values),54 similar to the spinel secondary phases in the present work. The HRTEM images of the x = 0.08 compositions (Fig. 4) clearly show the presence of Cr-rich grains within the chalcopyrite matrix. Moreover, the SAED patterns of these Cr-rich grains correspond to the Fd![[3 with combining macron]](https://www.rsc.org/images/entities/char_0033_0304.gif) m cubic structure, again consistent with the formation of a spinel-type phase indicated by PXRD and XANES. Hence, based on the PXRD, SEM, HRTEM, SAED and EDS results, the secondary lamellar-like phase is identified as a Cr-rich [Cu,Fe,Cr]3S4 spinel-type phase, whereas the main phase is unsubstituted CuFeS2. Efforts to substitute chromium for copper in chalcopyrite therefore, result in an unusual phase segregation and formation of a composite containing micro precipitates possessing a different structure to that of the majority-phase matrix. Moreover, this composite formation is induced even at very low levels of chromium substitution (2 at%). Understanding the origin of the tendency for chromium to form microprecipitates in preference to substitution into the chalcopyrite matrix, would require a detailed investigation of the kinetics and thermodynamics of the processes involved, including a comprehensive survey of the quaternary phase diagram. However, it is possible that the presence of chromium in the +3 oxidation state plays a role, as Cr3+ generally occurs in an octahedral geometry, as in the thiospinel microprecipitates, and does not favour the tetrahedral coordination adopted by the cations in chalcopyrite.
m cubic structure, again consistent with the formation of a spinel-type phase indicated by PXRD and XANES. Hence, based on the PXRD, SEM, HRTEM, SAED and EDS results, the secondary lamellar-like phase is identified as a Cr-rich [Cu,Fe,Cr]3S4 spinel-type phase, whereas the main phase is unsubstituted CuFeS2. Efforts to substitute chromium for copper in chalcopyrite therefore, result in an unusual phase segregation and formation of a composite containing micro precipitates possessing a different structure to that of the majority-phase matrix. Moreover, this composite formation is induced even at very low levels of chromium substitution (2 at%). Understanding the origin of the tendency for chromium to form microprecipitates in preference to substitution into the chalcopyrite matrix, would require a detailed investigation of the kinetics and thermodynamics of the processes involved, including a comprehensive survey of the quaternary phase diagram. However, it is possible that the presence of chromium in the +3 oxidation state plays a role, as Cr3+ generally occurs in an octahedral geometry, as in the thiospinel microprecipitates, and does not favour the tetrahedral coordination adopted by the cations in chalcopyrite.
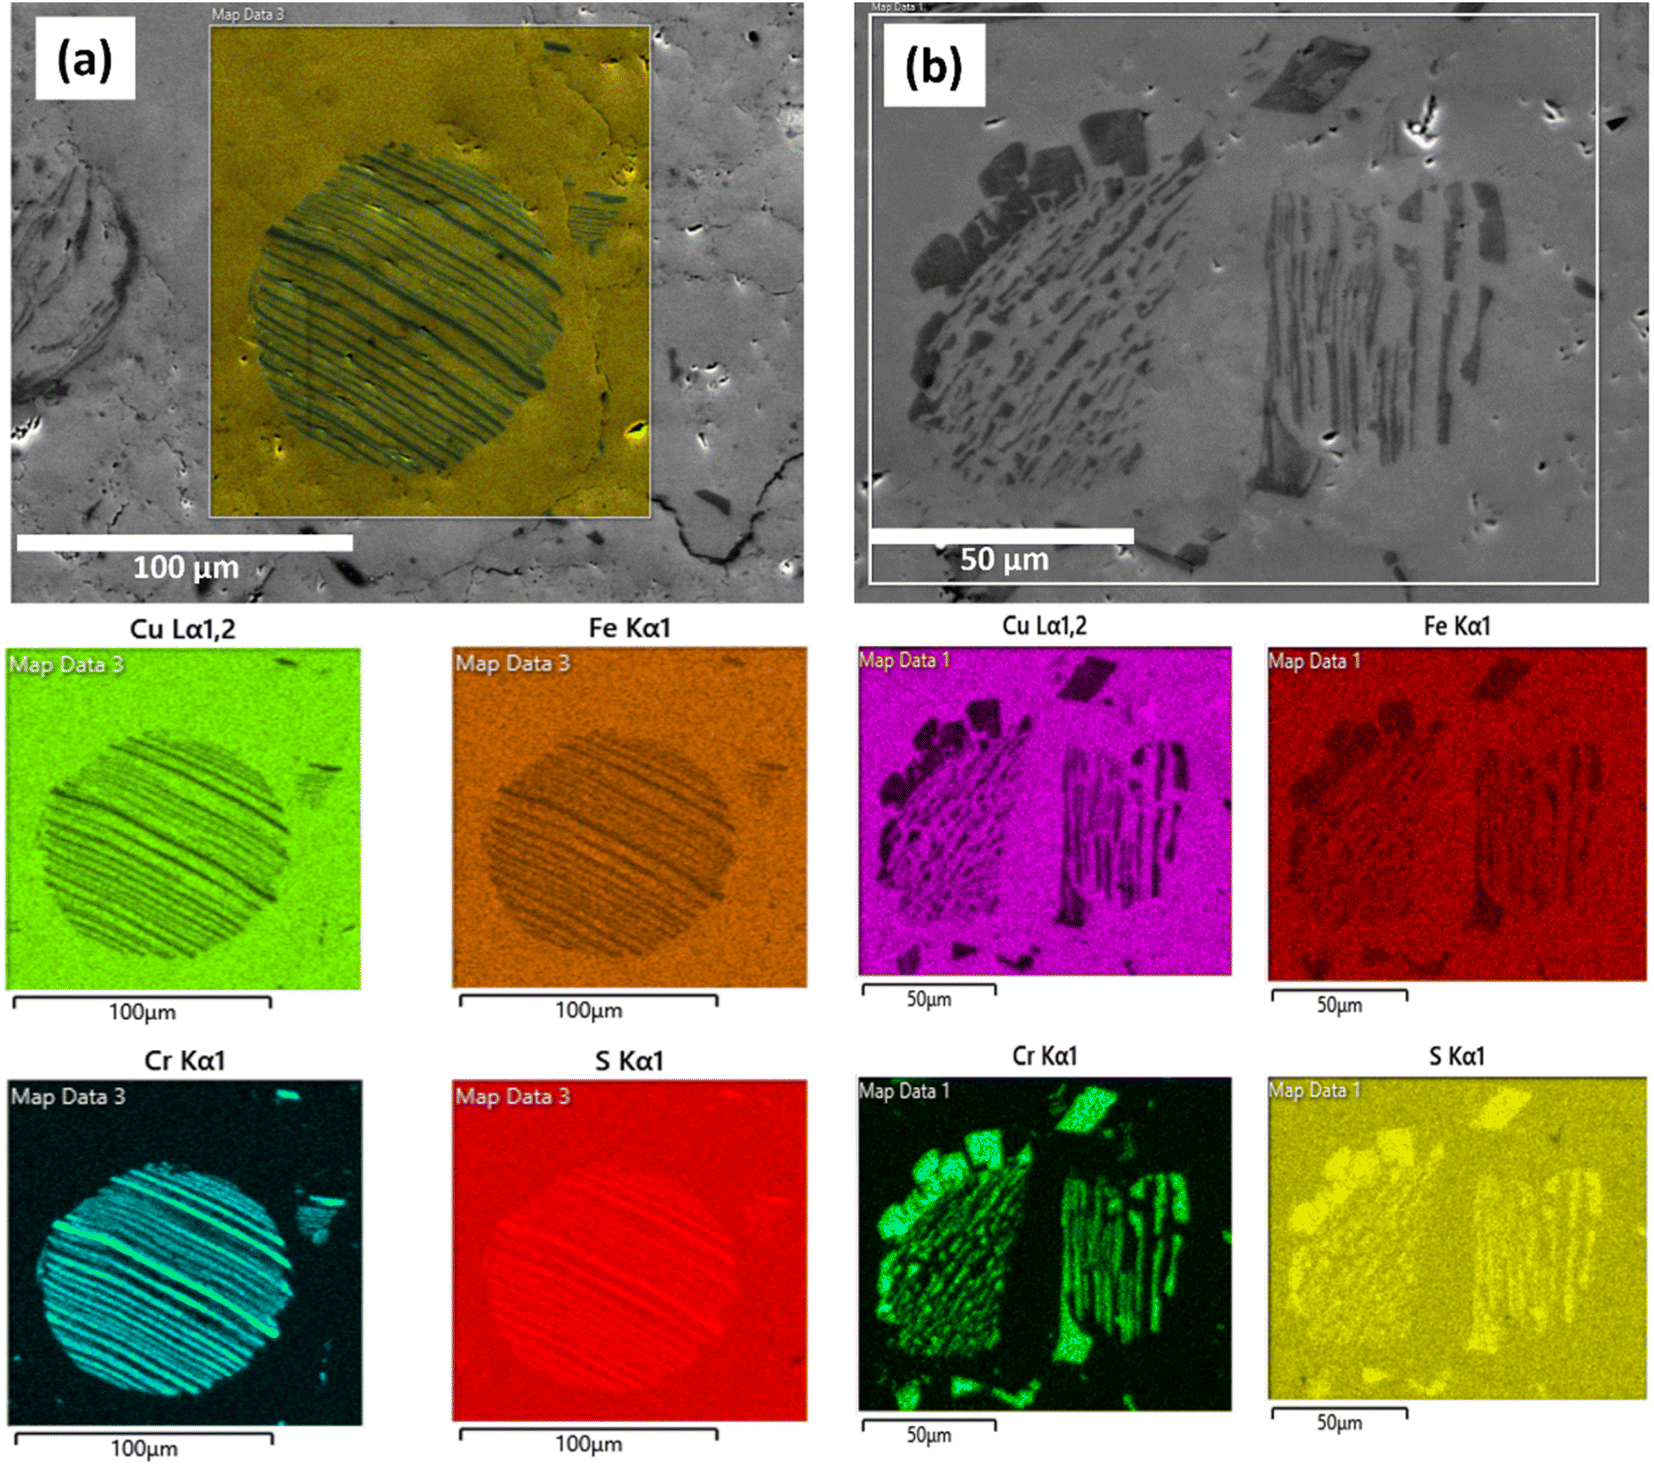 | ||
| Fig. 3 Scanning electron microscopy (SEM) images with corresponding EDS area mapping of (a) x = 0.04 and (b) x = 0.08 compositions. | ||
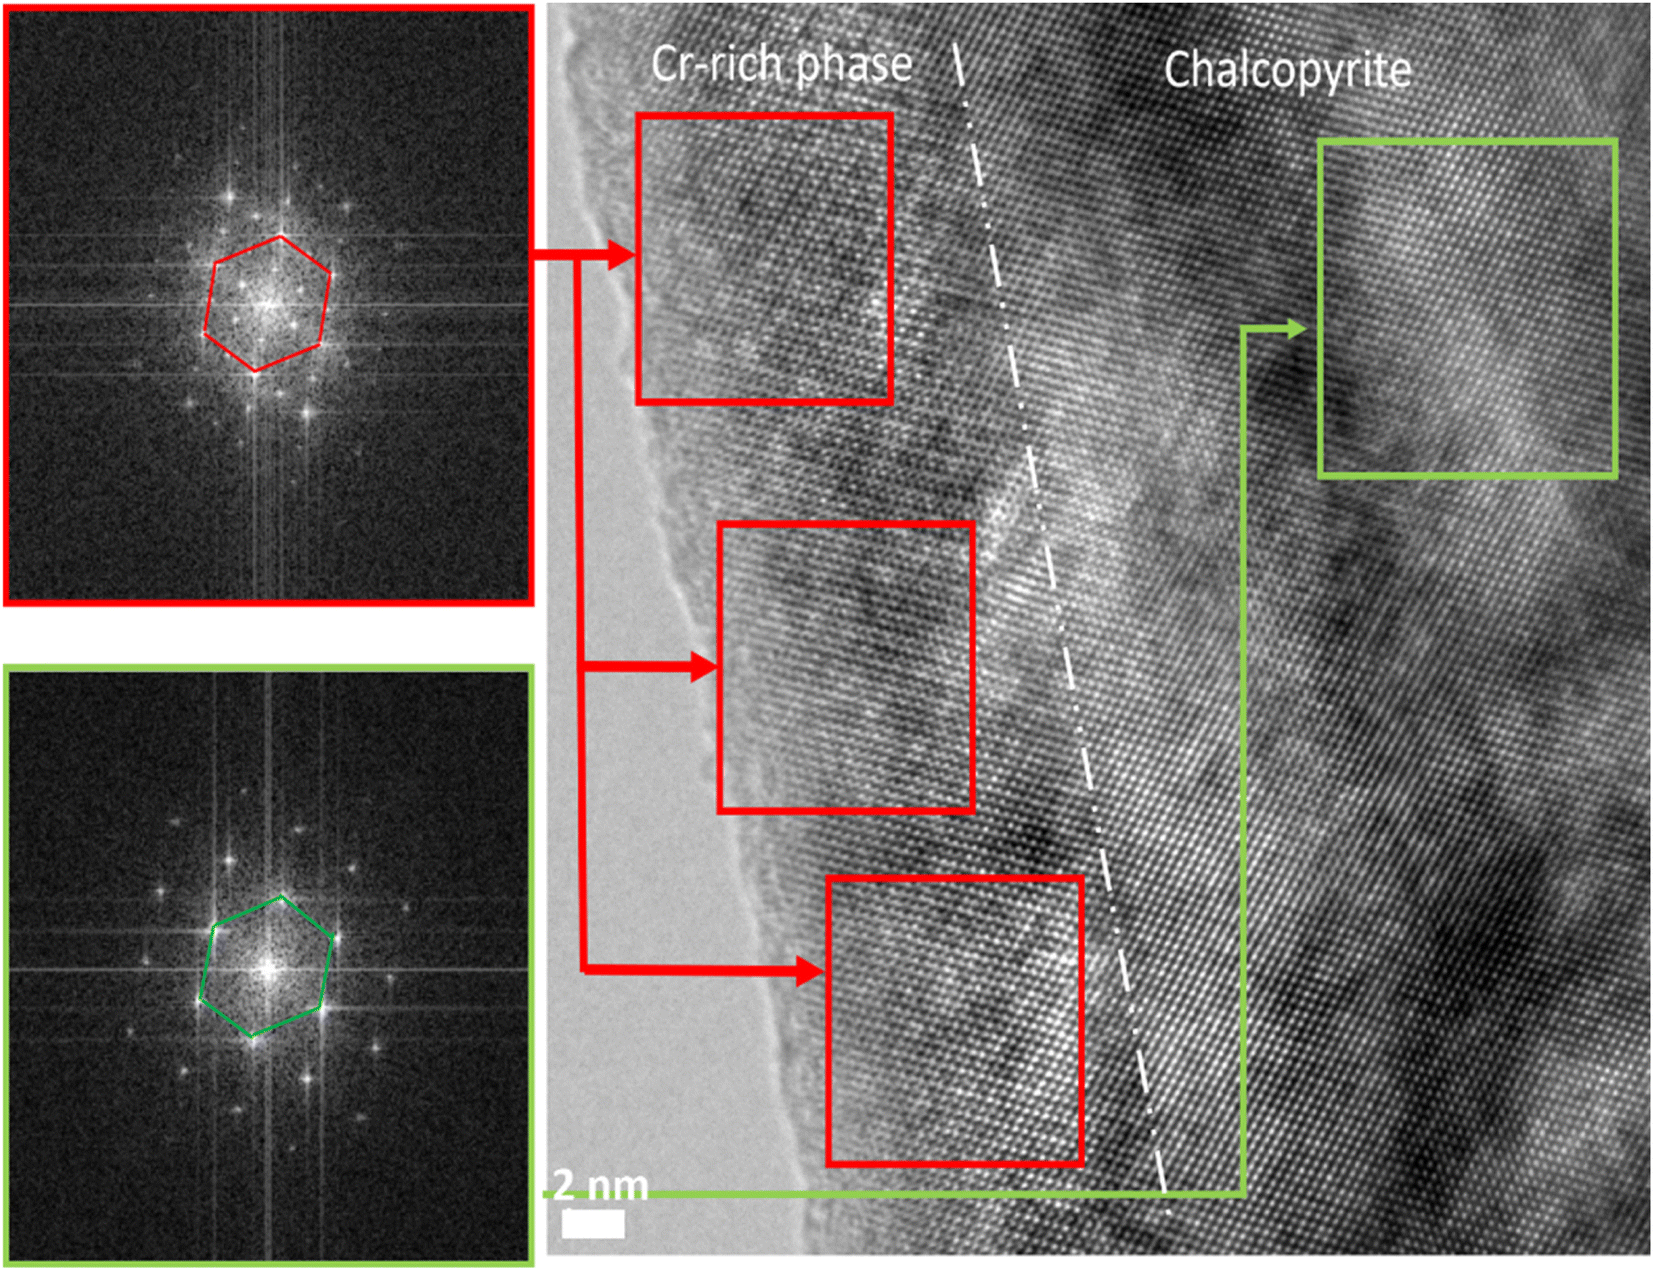 | ||
| Fig. 4 HRTEM image and SAED patterns along the [110] zone axis showing the presence of spinel grains within the chalcopyrite matrix in the sample with x = 0.08. The white dashed line represents the interface between the two phases. | ||
Since the nominal composition of the Cr-containing samples is Cu1−xCrxFeS2 (0 ≤ x ≤ 0.1), the formation of the micro-precipitates requires a slight change in the Cu:Fe ratio of the main CuFeS2 chalcopyrite phase to maintain elemental balance. Based on the characterization results discussed above, a qualitative analysis is performed to understand the change in the Cu:Fe ratio in the main chalcopyrite phase and how it may affect the carrier concentration and transport properties. For example, in the case of the nominal composition of Cu0.98Cr0.02FeS2, which produces a chalcopyrite-type and a spinel-type phase, a balanced equation (assuming stoichiometric sulfur) can be expressed as:
| Cu0.98Cr0.02FeS2 = bCuxFeyS2 + cCuuFevCrwS4 | (1) |
The calculated balanced equations for all Cr-containing Cu1−xCrxFeS2 (0 ≤ x ≤ 0.1) phases are presented in the ESI (Table S3).† Of particular note is that the Cu:Fe ratio in the majority chalcopyrite phase is reduced by between 1 and 9% from the ideal ratio of 1.0, primarily due to a decrease in the copper content. The Cu:Fe ratio initially decreases in the compositional range 0.02 ≤ x ≤ 0.06, increases at x = 0.08, before again decreasing with further addition of Cr (x = 0.1). While such small changes of <9% in the Cu:Fe ratio are not discernible in the experimental EDS data, they are likely to have significant implications for the transport properties, as has been observed previously.48,68 Since the formal oxidation states of copper, iron and sulfur in CuFeS2 are +1, +3 and −2 respectively,23,29,63–65 the partial replacement of copper by iron drives the Cu:Fe ratio below 1.0. This therefore requires reduction of a fraction of the Fe3+ cations to Fe2+ in order to maintain the charge neutrality, similar to what has been observed in CumFe1−mCr2S4 spinels.54,55 This introduces holes, thereby reducing the net charge carrier concentration and affecting the transport properties accordingly. Since only a small fraction of Fe3+ ions are converted to Fe2+, the change in overall oxidation state is below the limit of detection by XANES, although it is sufficient to modify the charge carrier concentration and hence the transport properties.
Hall-effect measurements (Fig. 5) for Cu1−xCrxFeS2 (0 ≤ x ≤ 0.1) reveal that the charge-carrier concentration (n) for the composition with x = 0.02 is increased relative to CuFeS2. However, n decreases in the compositional range 0.02 < x ≤ 0.06, before increasing again for compositions in the range 0.06 < x ≤ 0.1. This apparent non-systematic dependence of carrier concentration on the chromium content can be rationalised in terms of the change in Cu:Fe ratio of the chalcopyrite phase, induced by the precipitation of chromium-rich spinels. A lower Cu:Fe ratio leads to more Fe2+ ions and a larger concentration of holes. This results in a lower net carrier concentration as shown in Fig. 6, where the variation of the Cu:Fe ratio shows a strong correlation with the carrier concentration determined from Hall effect measurements. The carrier concentrations determined here are broadly comparable with those determined by Li et al.68 for Cu1−yFe1+yS2 at similar Cu:Fe ratios. However, the latter reports a much wider range of Cu:Fe ratios obtained by Cu/Fe substitution than those resulting from the formation of microprecipitates. While the carrier concentration reported by Li et al.68 varies monotonically with the nominal value of y, the variation with the analytically determined Cu:Fe ratio is less systematic. At much lower Cu:Fe ratios (≾0.90) the charge-carrier concentration reaches values which are an order of magnitude higher than the maximum value determined here. The carrier mobility has a weaker correlation with the Cu:Fe ratio. This is likely to be due to a combination of the change in the Cu:Fe ratio and the nanometre length scale of the [Cu,Fe,Cr]3S4 precipitates, which may be responsible for scattering electrons with comparable mean-free paths,69 thereby affecting the carrier mobility, and hence resulting in the trends in Hall mobilities presented in Fig. 5. The [Cu,Fe,Cr]3S4 thiospinels are semiconductors, although the magnitude of the resistivity and Seebeck coefficient are highly composition dependent.54,55 The former spans two orders of magnitude and the latter shows a change from n- to p-type behaviour. Since the thiospinel microprecipitates are present at a level of <5 vol%, we believe they have limited impact on the electrical transport properties of the bulk materials, beyond the impact on mobility noted above.
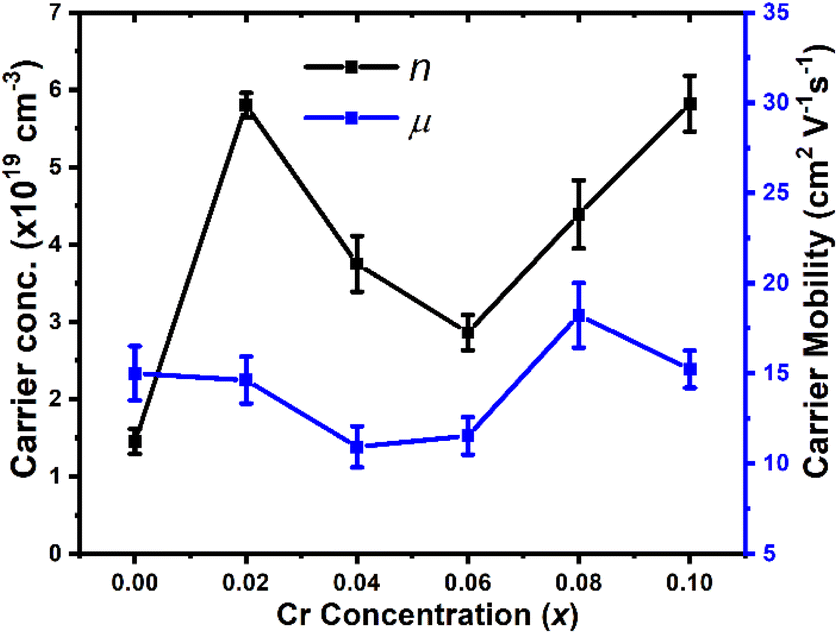 | ||
| Fig. 5 Carrier concentration and mobility as a function of chromium concentration in Cu1−xCrxFeS2 (0 ≤ x ≤ 0.1). | ||
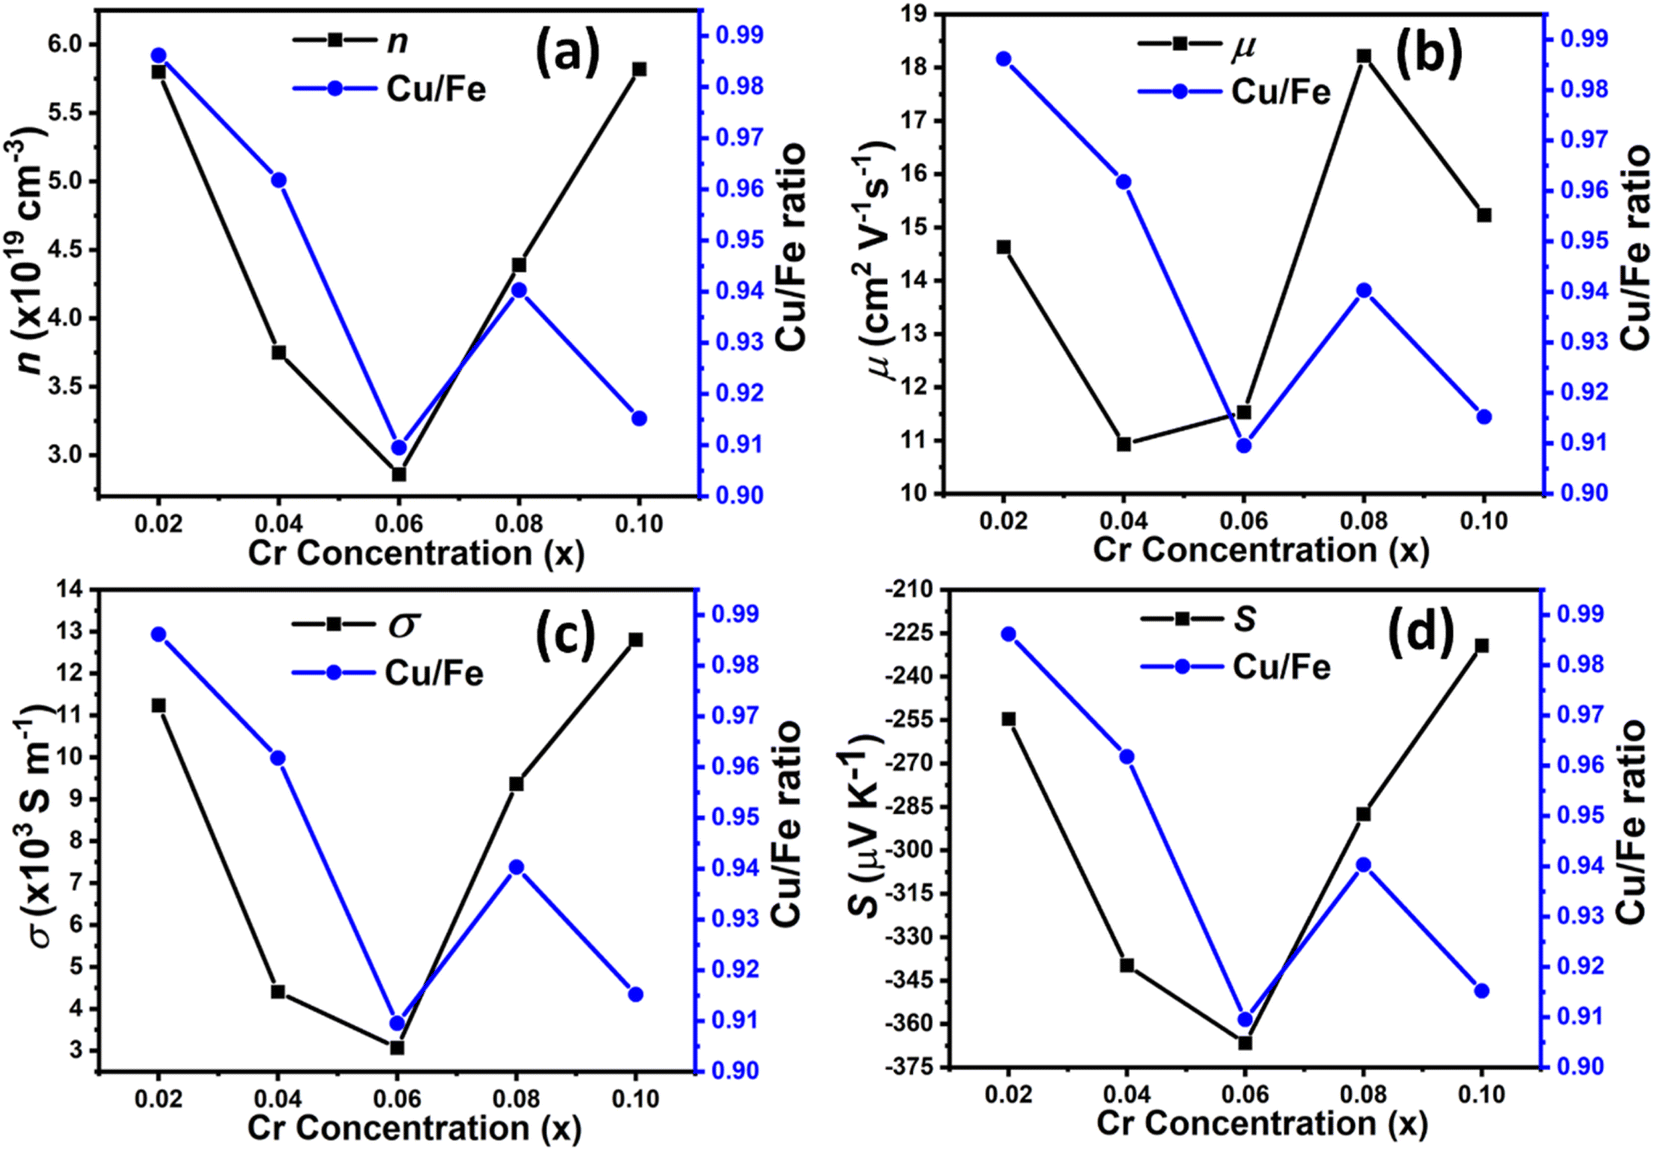 | ||
| Fig. 6 The relationship (at 323 K) between (a) carrier concentration (n), (b) carrier mobility (μ), (c) electrical conductivity (σ = 1/ρ), (d) Seebeck coefficient (S) and the Cu:Fe ratio of the main CuFeS2 phase in samples of nominal composition Cu1−xCrxFeS2, presented as a function of the nominal chromium content (x). | ||
Fig. 7 shows the electrical properties of Cu1−xCrxFeS2 (0 ≤ x ≤ 0.1) as a function of temperature. All the Cr-containing samples show a decrease in the electrical resistivity (ρ) compared to that of CuFeS2. In addition, the temperature dependence of the electrical resistivity of Cu1−xCrxFeS2 (0.02 ≤ x ≤ 0.1) shows a marked change, with ρ(T) becoming flatter compared to the parent CuFeS2. Similar behaviour has been observed previously in substituted chalcopyrites.29,30 The lowest electrical resistivity exhibited by compositions with x = 0.02, 0.08 and 0.1 is reduced by more than 70% from that of CuFeS2. Whilst the resistivity for compositions with x = 0.04 and 0.06 is higher, which appears to be associated with both lower carrier concentration and mobility, it remains below that of the parent phase. The Seebeck coefficient (S) shows a similar behaviour as S is reduced from that of CuFeS2 in all the Cr-containing materials. However, the reduction in the magnitude of the Seebeck coefficients in the Cr-containing materials is less marked than the reductions in the electrical resistivity, particularly for the compositions with x = 0.02 and 0.08. Consequently, the power factor (PF) exhibited by the Cr-containing materials is significantly higher than that of the pristine CuFeS2. The highest PF = 0.77 mW m−1 K−2 at 673 K is exhibited by the composition with x = 0.08. It can be seen from Fig. 6 that the electrical transport properties show a strong correlation with the Cu:Fe ratio, and therefore, the formation of the spinel precipitates. The behaviour of the composition with x = 0.1, is slightly anomalous, which may be the result of complex compositional variations in the main and spinel secondary phases.
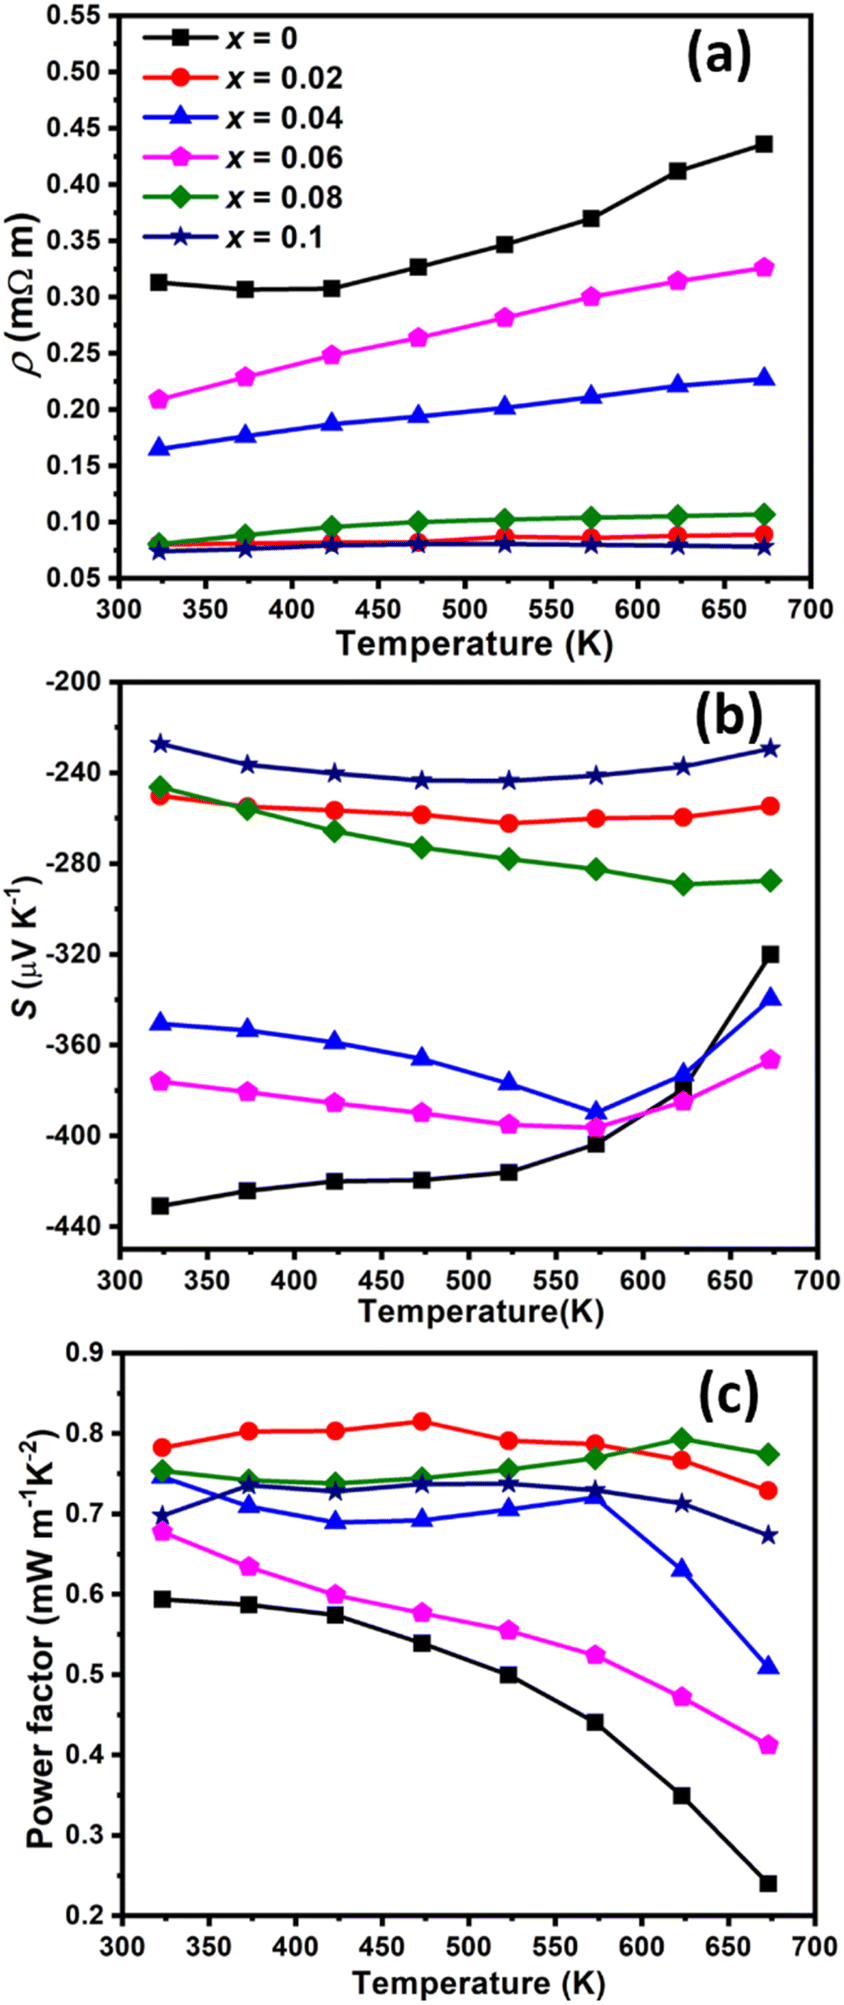 | ||
| Fig. 7 Temperature dependent (a) electrical resistivity (ρ), (b) Seebeck coefficient (S) and (c) power factor of Cu1−xCrxFeS2 (0 ≤ x ≤ 0.1) samples. Uncertainties in electrical resistivity, and Seebeck coefficient are estimated to be ca. 5%. | ||
Fig. 8 presents the thermal conductivity of Cu1−xCrxFeS2 (0 ≤ x ≤ 0.1). The total thermal conductivity (κ) is dominated by the lattice contribution (κL) at all compositions. This is relatively high for the pristine CuFeS2 phase (ca. 6.7 W m−1 K−1 at 323 K), as reflected in the high average sound velocity of 3264 m s−1 (Table 1), facilitated by the strong covalent bonding within the diamond-like structure of the chalcopyrite. On chromium incorporation, there is a marked reduction of ca. 40% in the lattice thermal conductivity for materials with compositions x = 0.02, 0.08 and 0.1. This is also reflected in the average (vavg), mean (vm), longitudinal (vl) and transverse (vt) sound velocities whose dependence on compositions correlates closely with that of the lattice thermal conductivity, as seen in Table 1. Although Li et al.17 have achieved a slightly lower thermal conductivity (κ = 1.83 W m−1 K−1 at 300 K) in the sulfur-deficient phase CuFeS1.75, it has been pointed out by Lefèvre and co-workers28 that this level of sulfur deficiency corresponds to compositions where alternative structure types are stabilized. In particular, the composition CuFeS1.75 is consistent with the formation of cubic talnakhite, which exhibits a low thermal conductivity. The thermal and electrical transport properties presented by Li et al.17 are in close agreement with those in recent reports of talnakhite.70,71
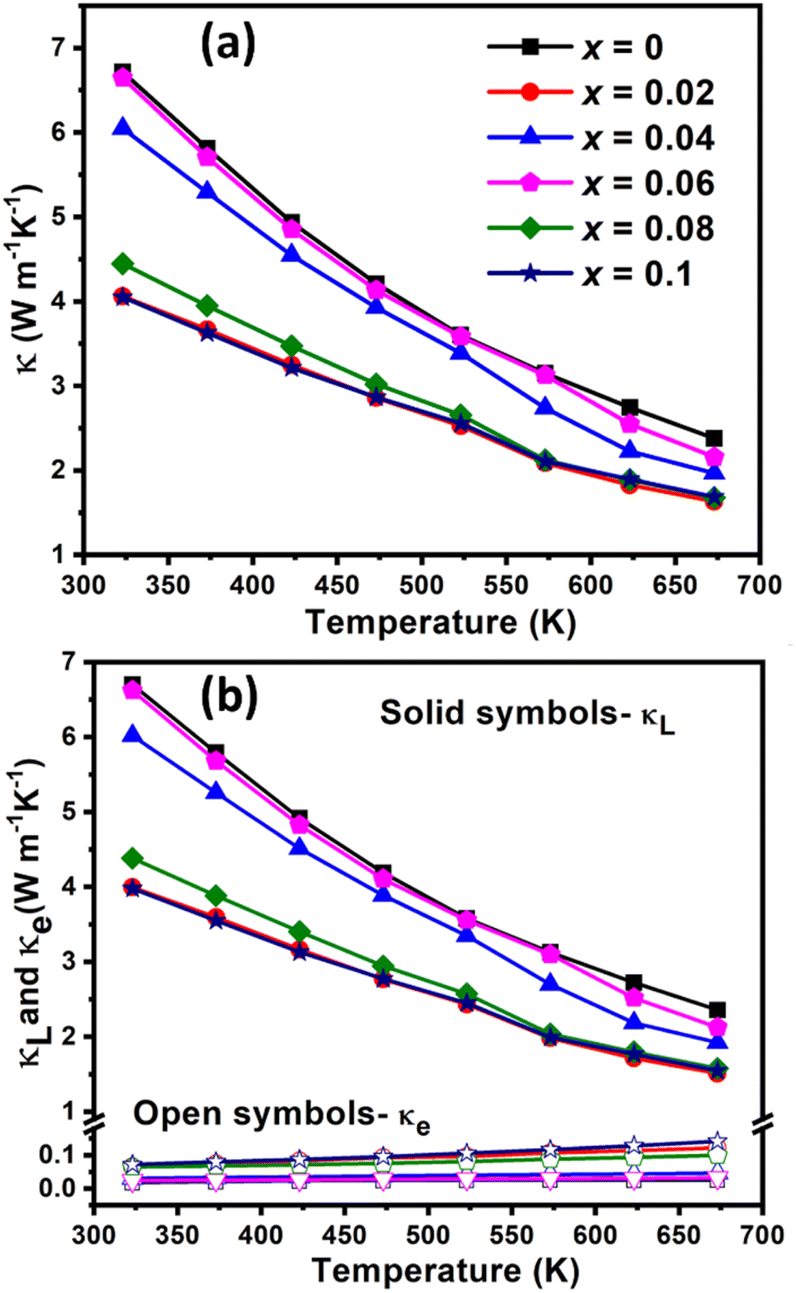 | ||
| Fig. 8 Temperature dependent (a) total thermal conductivity (κ); (b) lattice (κL) and electronic (κe) thermal conductivities of Cu1−xCrxFeS2 (0 ≤ x ≤ 0.1) samples. Uncertainties in the measured thermal conductivity values are estimated to be ca. 10%. | ||
| Sample | κ L at 323 K (W m−1 K−1) | v avg (m s−1) | v m (m s−1) | v l (m s−1) | v t (m s−1) | E (GPa) | G (GPa) | θ D (K) |
|---|---|---|---|---|---|---|---|---|
| x = 0 | 6.7 | 3264 | 2831 | 4720 | 2536 | 69.9 | 26.9 | 319 |
| x = 0.02 | 4 | 2934 | 2579 | 4170 | 2316 | 56.4 | 22.1 | 291 |
| x = 0.06 | 6.6 | 2983 | 2575 | 4342 | 2304 | 56.9 | 21.8 | 291 |
| x = 0.08 | 4.4 | 2645 | 2367 | 3671 | 2133 | 46.8 | 18.8 | 267 |
The elastic moduli and Debye temperature, derived from the sound velocity (calculation details in ESI†) decrease with chromium addition, which can be observed at even the lowest level of chromium incorporation (2 at%). The Young's (E) and shear moduli (G) of the pristine CuFeS2 (x = 0) decrease on the introduction of chromium; that for the composition, x = 0.08, being ca. 30% lower than for the pristine phase. This indicates considerable lattice softening, which may partly contribute to the reduction of the lattice thermal conductivity. It has been shown previously in chalcopyrite-type phases that the mean-free-path of the heat-carrying acoustic phonons lies in the range 50 to 500 nm.29,36 The SEM and HRTEM images (Fig. 3 and 4) show that the [Cu, Fe, Cr]3S4 spinel precipitates have a wide range of length scales ranging between 300 nm and 20 μm. Moreover, the HRTEM images also reveal dislocations with length scales in the range 2–50 nm, similar to those previously observed in substituted chalcopyrites.29,30 A combination of the spinel precipitates and dislocations, therefore, results in the scattering of a wide range of heat-carrying acoustic phonons, leading to a reduced lattice thermal conductivity.
The maximum thermoelectric figure-of-merit of the Cu1−xCrxFeS2 (0 ≤ x ≤ 0.1) materials (Fig. 9) increases from zT = 0.08 for the parent phase (x = 0) to zT = 0.31 for the composition with x = 0.08 at 673 K. This represents a more than a three-fold increase and is comparable to some of the best figures of merit reported in chalcopyrites.23,24,26,28,29,72 This improvement in performance is due to a combination of increases in the power factor arising from changes in charge-carrier concentration, induced by variations in the Cu:Fe ratio, and reductions in thermal conductivity due to the formation of precipitates and dislocations spanning a wide range of length scales. The change in the Cu:Fe ratio of the majority chalcopyrite phase correlates with the amount of chromium present in the secondary spinel-type phase and is inversely proportional to the copper content of the spinel phase (Table S3 and Fig. S4†). The trends in electrical- and thermal-transport properties are, therefore, determined indirectly by Cr-induced composite formation and are not a direct result of modification of the electronic structure of the chalcopyrite phase due to substitution of chromium for copper in CuFeS2.
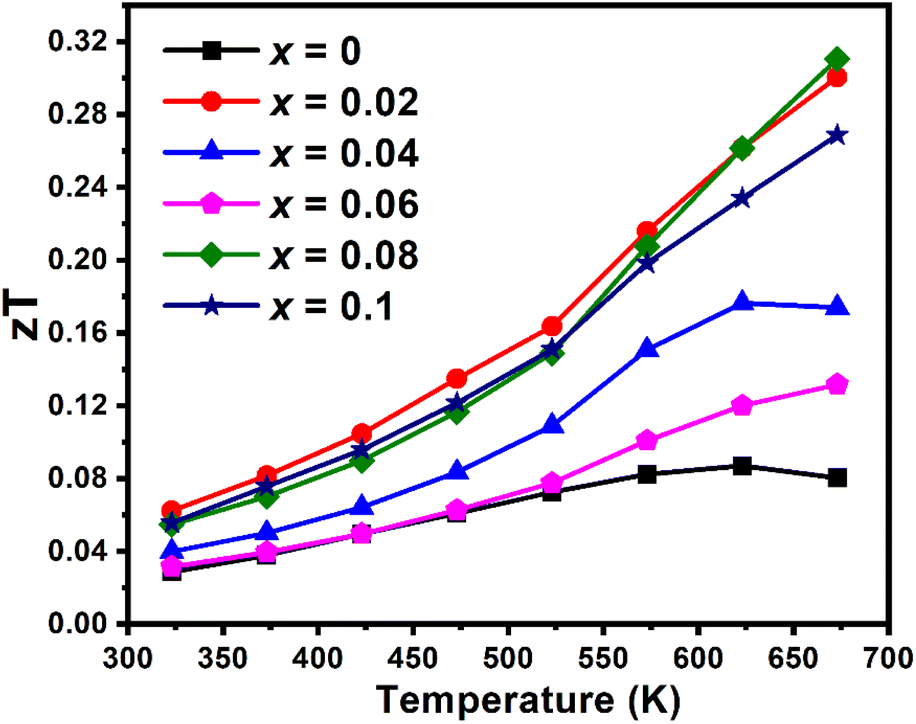 | ||
| Fig. 9 Thermoelectric figure-of-merit as a function of temperature of Cu1−xCrxFeS2 (0 ≤ x ≤ 0.1) samples. Estimated uncertainties in the figures-of-merit (zT) are ca. 15%. | ||
Conclusions
A detailed investigation of Cu1−xCrxFeS2 using a combination of advanced analytical techniques (PXRD, XANES, SEM and TEM) has established that chromium addition leads to the formation of a composite in preference to substitution. This consists of precipitates of a Cr-rich, [Cu, Fe, Cr]3S4 spinel-type phase within a chalcopyrite matrix. The formation of a Cr-rich precipitate, which also contains copper and iron, induces changes to the Cu:Fe ratio of the CuFeS2 chalcopyrite phase. This effects reduction of a fraction of Fe3+ cations to Fe2+, altering the carrier concentration of the majority phase and hence, modifying the electrical-transport properties and increasing the power factor. The spinel-type precipitates occur with a wide range of length scales and together with dislocations, promote scattering of heat-carrying phonons over a correspondingly wide range of the phonon spectra and mean free paths (50 to 500 nm), resulting in a significant reduction in lattice thermal conductivity. This leads to a maximum thermoelectric figure-of-merit zT = 0.31 at 673 K (x = 0.08) that is higher than that of the majority of substituted chalcopyrites, including those containing transition-metal substituents. The present work suggests that the formation within a chalcopyrite matrix, of micro-precipitates involving elements from the parent phase, may offer a means of simultaneously tuning the carrier concentration through modification of the Cu:Fe ratio while increasing phonon scattering by the precipitates. The fact that this may be achieved by standard high-temperature synthesis, without recourse to any special synthesis procedures, such as rapid-cooling/quenching, prolonged thermal treatment or through the intentional addition of a secondary phase/material to form a multi-phasic composite, offers attractions in the development of high-performance thermoelectric materials. However, adjusting the synthesis conditions, including the cooling rate, may offer a means of achieving further enhancements in performance through changes in morphology, dimensions and size distribution of the microprecipitates. Furthermore, double substitution offers opportunities to combine the beneficial impact of microprecipitate formation on thermal conductivity with the capacity to effect changes to electrical-transport properties by varying the charge-carrier concentrations. More detailed studies are required to understand the thermodynamic and kinetic factors that promote precipitation over substitution and in particular, to identify alternative transition-metal cations with limited solubility in chalcopyrite and other complex metal chalcogenides.
Author contributions
The manuscript was written through contributions of all authors. All authors have given approval to the final version of the manuscript.Conflicts of interest
There are no conflicts to declare.Acknowledgements
This work was carried out with the support of the UK Engineering and Physical Sciences Research Council, through the UKRI Global Challenges Research Fund (grant no: EP/T020040/1). The authors acknowledge Diamond Light Source Ltd, UK for beamtime on B18 beamline under proposal no: SP30136. We would also like to thank the Chemical Analysis Facility (CAF) at the University of Reading, Reading, UK.References
- R. Freer and A. V. Powell, J. Mater. Chem. C, 2020, 8, 441–463 RSC.
- A. V. Powell, J. Appl. Phys., 2019, 126, 100901 CrossRef.
- S. Tippireddy, A. V Powell and T. K. S. Wong, in Sulfide and Selenide Based Materials for Emerging Applications, Elsevier, 2022, pp. 329–376 Search PubMed.
- R. Freer, D. Ekren, T. Ghosh, K. Biswas, P. Qiu, S. Wan, L. D. Chen, S. Han, C. Fu, T.-J. Zhu, A. K. M. A. Shawon, A. Zevalkink, K. Imasato, G. J. Snyder, M. Ozen, K. Saglik, U. Aydemir, R. Cardoso-Gil, E. Svanidze, R. Funahashi, A. V. Powell, S. Mukherjee, S. Tippireddy, P. Vaqueiro, F. Gascoin, T. Kyratsi, S. Philipp and T. Mori, J. Phys.: Energy, 2022, 4, 022002 Search PubMed.
- L. Paradis-Fortin, G. Guélou, V. Pavan Kumar, P. Lemoine, C. Prestipino, O. Merdrignac-Conanec, G. R. Durand, S. Cordier, O. I. Lebedev and E. Guilmeau, J. Alloys Compd., 2020, 831, 154767 CrossRef CAS.
- K. Suekuni, F. S. Kim, H. Nishiate, M. Ohta, H. I. Tanaka and T. Takabatake, Appl. Phys. Lett., 2014, 105, 132107 CrossRef.
- C. Candolfi, G. Guélou, C. Bourgès, A. R. Supka, R. A. R. al Orabi, M. Fornari, B. Malaman, G. le Caër, P. Lemoine, V. Hardy, J.-M. Zanotti, R. Chetty, M. Ohta, K. Suekuni and E. Guilmeau, Phys. Rev. Mater., 2020, 4, 025404 CrossRef CAS.
- R. Chetty, Y. Kikuchi, Y. Bouyrie, P. Jood, A. Yamamoto, K. Suekuni and M. Ohta, J. Mater. Chem. C, 2019, 7, 5184–5192 RSC.
- S. O. J. Long, A. V. Powell, P. Vaqueiro and S. Hull, Chem. Mater., 2018, 30, 456–464 CrossRef CAS.
- X. Lu, D. T. Morelli, Y. Xia and V. Ozolins, Chem. Mater., 2015, 27, 408–413 CrossRef CAS.
- S. Tippireddy, R. Chetty, M. H. Naik, M. Jain, K. Chattopadhyay and R. C. Mallik, J. Phys. Chem. C, 2018, 122, 8735–8749 CrossRef CAS.
- S. He, Y. Luo, L. Xu, Y. Wang, Z. Han, X. Li and J. Cui, Inorg. Chem., 2021, 60, 11120–11128 CrossRef CAS PubMed.
- J. Corps, P. Vaqueiro, A. Aziz, R. Grau-Crespo, W. Kockelmann, J. C. Jumas and A. V. Powell, Chem. Mater., 2015, 27, 3946–3956 CrossRef CAS.
- B. Ge, J. Hu, Z. Shi, H. Wang, H. Xia and G. Qiao, Nanoscale, 2019, 11, 17340–17349 RSC.
- B. Du, R. Zhang, K. Chen, A. Mahajan and M. J. Reece, J. Mater. Chem. A, 2017, 5, 3249–3259 RSC.
- C. Bourgès, P. Lemoine, O. I. Lebedev, R. Daou, V. Hardy, B. Malaman and E. Guilmeau, Acta Mater., 2015, 97, 180–190 CrossRef.
- J. Li, Q. Tan and J. F. Li, J. Alloys Compd., 2013, 551, 143–149 CrossRef CAS.
- L. D. Zhao, H. J. Wu, S. Q. Hao, C. I. Wu, X. Y. Zhou, K. Biswas, J. Q. He, T. P. Hogan, C. Uher, C. Wolverton, V. P. Dravid and M. G. Kanatzidis, Energy Environ. Sci., 2013, 6, 3346–3355 RSC.
- Y. Wu, Z. Chen, P. Nan, F. Xiong, S. Lin, X. Zhang, Y. Chen, L. Chen, B. Ge and Y. Pei, Joule, 2019, 3, 1276–1288 CrossRef CAS.
- C. Zhang, M. de la Mata, Z. Li, F. J. Belarre, J. Arbiol, K. A. Khor, D. Poletti, B. Zhu, Q. Yan and Q. Xiong, Nano Energy, 2016, 30, 630–638 CrossRef CAS.
- W. H. Shin, J. W. Roh, B. Ryu, H. J. Chang, H. S. Kim, S. Lee, W. S. Seo and K. Ahn, ACS Appl. Mater. Interfaces, 2018, 10, 3689–3698 CrossRef CAS PubMed.
- C. Chang, M. Wu, D. He, Y. Pei, C. F. Wu, X. Wu, H. Yu, F. Zhu, K. Wang, Y. Chen, L. Huang, J. F. Li, J. He and L. D. Zhao, Science, 2018, 360, 778–783 CrossRef CAS PubMed.
- H. Xie, X. Su, G. Zheng, T. Zhu, K. Yin, Y. Yan, C. Uher, M. G. Kanatzidis and X. Tang, Adv. Energy Mater., 2017, 7, 1601299 CrossRef.
- W. D. Carr and D. T. Morelli, J. Electron. Mater., 2016, 45, 1346–1350 CrossRef CAS.
- N. Tsujii and T. Mori, Appl. Phys. Express, 2013, 6, 043001 CrossRef.
- J. Navratil, J. Kašparová, T. Plecháček, L. Beneš, Z. Olmrová-Zmrhalová, V. Kucek and Č. Drašar, J. Electron. Mater., 2019, 48, 1795–1804 CrossRef CAS.
- B. Ge, J. Hu, Z. Shi, H. Wang, H. Xia and G. Qiao, Nanoscale, 2019, 11, 17340–17349 RSC.
- R. Lefèvre, D. Berthebaud, M. Y. Mychinko, O. I. Lebedev, T. Mori, F. Gascoin and A. Maignan, RSC Adv., 2016, 6, 55117–55124 RSC.
- S. Tippireddy, F. Azough, Vikram, F. T. Tompkins, A. Bhui, R. Freer, R. Grau-crespo, K. Biswas, P. Vaqueiro and A. V. Powell, Chem. Mater., 2022, 34, 5860–5873 CrossRef CAS PubMed.
- S. Tippireddy, F. Azough, Vikram, A. Bhui, P. Chater, D. Kepaptsoglou, Q. Ramasse, R. Freer, R. Grau-Crespo, K. Biswas, P. Vaqueiro and A. V. Powell, J. Mater. Chem. A, 2022, 10, 23874–23885 RSC.
- H. Xie, X. Su, S. Hao, C. Zhang, Z. Zhang, W. Liu, Y. Yan, C. Wolverton, X. Tang and M. G. Kanatzidis, J. Am. Chem. Soc., 2019, 141, 18900–18909 CrossRef CAS PubMed.
- B. Ge, H. Lee, C. Zhou, W. Lu, J. Hu, J. Yang, S.-P. Cho, G. Qiao, Z. Shi and I. Chung, Nano Energy, 2022, 94, 106941 CrossRef CAS.
- D. Zhang, B. Zhang, Z. Zhou, K. Peng, H. Wu, H. Wang, G. Wang, G. Han, G. Wang, X. Zhou and X. Lu, Chem. Mater., 2021, 33, 9795–9802 CrossRef CAS.
- Z. Liu, W. Zhang, W. Gao and T. Mori, Energy Environ. Sci., 2021, 14, 3579–3587 RSC.
- T. Ghosh, M. Dutta, D. Sarkar and K. Biswas, J. Am. Chem. Soc., 2022, 144, 10099–10118 CrossRef CAS PubMed.
- N. Sato, P. S. Gan, N. Tsujii and T. Mori, Appl. Phys. Express, 2021, 14, 087002 CrossRef CAS.
- J. Androulakis, C. H. Lin, H. J. Kong, C. Uher, C. I. Wu, T. Hogan, B. A. Cook, T. Caillat, K. M. Paraskevopoulos and M. G. Kanatzidis, J. Am. Chem. Soc., 2007, 129, 9780–9788 CrossRef CAS PubMed.
- Y. Gelbstein, B. Dado, O. Ben-Yehuda, Y. Sadia, Z. Dashevsky and M. P. Dariel, Chem. Mater., 2010, 22, 1054–1058 CrossRef CAS.
- G. Rogl, A. Grytsiv, M. Falmbigl, E. Bauer, C. Mangler, C. Rentenberger, M. Zehetbauer and P. Rogl, Acta Mater., 2012, 60, 4487–4495 CrossRef CAS.
- J. R. Sootsman, J. He, V. P. Dravid, C. P. Li, C. Uher and M. G. Kanatzidis, J. Appl. Phys., 2009, 105, 083718 CrossRef.
- A. Bhardwaj and D. K. Misra, J. Mater. Chem. A, 2014, 2, 20980–20989 RSC.
- Y. Cheng, J. Yang, Q. Jiang, D. He, J. He, Y. Luo, D. Zhang, Z. Zhou, Y. Ren and J. Xin, J. Mater. Chem. A, 2017, 5, 5163–5170 RSC.
- B. A. Cook, M. J. Kramer, J. L. Harringa, M. K. Han, D. Y. Chung and M. G. Kanatzidis, Adv. Funct. Mater., 2009, 19, 1254–1259 CrossRef CAS.
- S. N. Girard, J. He, C. Li, S. Moses, G. Wang, C. Uher, V. P. Dravid and M. G. Kanatzidis, Nano Lett., 2010, 10, 2825–2831 CrossRef CAS.
- Y. Gelbstein, J. Davidow, S. N. Girard, D. Y. Chung and M. Kanatzidis, Adv. Energy Mater., 2013, 3, 815–820 CrossRef CAS.
- J. R. Scotsman, R. J. Pcionek, H. Kong, C. Uher and M. G. Kanatzidis, Chem. Mater., 2006, 18, 4993–4995 CrossRef.
- A. Bali, E. Royanian, E. Bauer, P. Rogl and R. C. Mallik, J. Appl. Phys., 2013, 113, 123707 CrossRef.
- U. ur Rehman, K. Mahmood, A. Ashfaq, A. Ali, S. Tahir, S. Ikram, A. Rehman, K. ul Sahar, W. Ahmad and N. Amin, Mater. Chem. Phys., 2022, 279, 125765 CrossRef.
- S. Verma, M. Singh, D. Ahuja, H. Shimose, S. Nishino, M. Miyata, D. Mott, M. Koyano and S. Maenosono, Jpn. J. Appl. Phys., 2014, 53, 120301 CrossRef.
- L. Vaure, Y. Liu, D. Cadavid, F. Agnese, D. Aldakov, S. Pouget, A. Cabot, P. Reiss and P. Chenevier, ChemNanoMat, 2018, 4, 982–991 CrossRef CAS.
- P. Baláž, E. Dutková, P. Levinský, N. Daneu, L. Kubíčková, K. Knížek, M. Baláž, J. Navrátil, J. Kašparová, V. Ksenofontov, A. Möller and J. Hejtmánek, Mater. Lett., 2020, 275, 128107 CrossRef.
- P. Baláž, E. Dutková, M. Baláž, R. Džunda, J. Navrátil, K. Knížek, P. Levinský and J. Hejtmánek, ChemistryOpen, 2021, 10, 806–814 CrossRef.
- E. Agostinelli, D. Fiorani, G. Mattogno and M. Noguess, J. Phys. Chem. Solids, 1989, 50, 269–272 CrossRef CAS.
- E. M. Zub and S. V. Sukhvalo, Solid State Commun., 1987, 64, 989–992 CrossRef CAS.
- E. M. Zub, E. V. Kuchis and S. V. Sukhvalo, Phys. Status Solidi A, 1984, 82, 569 CrossRef CAS.
- A. V. Powell and S. Oestreich, J. Mater. Chem. A, 1996, 6, 807–813 RSC.
- A. V. Powell, D. C. Colgan and C. Ritter, J. Solid State Chem., 1997, 134, 110–119 CrossRef CAS.
- H. Groß, D. Groeneveld, M. Poschmann, U. Schürmann, J. D. König, W. Bensch, J. Wöllenstein and L. Kienle, Adv. Eng. Mater., 2023, 25, 2201505 CrossRef.
- E. V. Korotaev, M. M. Syrokvashin, I. Y. Filatova and V. V. Zvereva, Vacuum, 2020, 179, 109390 CrossRef CAS.
- J. Rodríguez-Carvajal, in Abstracts of the Satellite Meeting on Powder Diffraction of the XV Congress of the IUCr, Toulouse, France, 1990, p. 127 Search PubMed.
- A. J. Dent, G. Cibin, S. Ramos, S. A. Parry, D. Gianolio, A. D. Smith, S. M. Scott, L. Varandas, S. Patel, M. R. Pearson, L. Hudson, N. A. Krumpa, A. S. Marsch and P. E. Robbins, J. Phys.: Conf. Ser., 2013, 430, 012023 CrossRef CAS.
- B. Ravel and M. Newville, J. Synchrotron Radiat., 2005, 12, 537–541 CrossRef CAS PubMed.
- H. Xie, X. Su, S. Hao, C. Zhang, Z. Zhang, W. Liu, Y. Yan, C. Wolverton, X. Tang and M. G. Kanatzidis, J. Am. Chem. Soc., 2019, 141, 18900–18909 CrossRef CAS PubMed.
- I. Nakai, Y. Sugitani, K. Nagashima and Y. Niwa, J. Inorg. Nucl. Chem., 1978, 40, 789–791 CrossRef CAS.
- A. Ghahremaninezhad, D. G. Dixon and E. Asselin, Electrochim. Acta, 2013, 87, 97–112 CrossRef CAS.
- S. Gorsse, P. Bellanger, Y. Brechet, E. Sellier, A. Umarji, U. Ail and R. Decourt, Acta Mater., 2011, 59, 7425–7437 CrossRef CAS.
- T. Ikeda, L. A. Collins, V. A. Ravi, F. S. Gascoin, S. M. Haile and G. J. Snyder, Chem. Mater., 2007, 19, 763–767 CrossRef CAS.
- Y. Li, T. Zhang, Y. Qin, T. Day, G. J. Snyder, X. Shi and L. Chen, J. Appl. Phys., 2014, 116, 203705 CrossRef.
- J. Park, Y. Xia and V. Ozoliņš, J. Appl. Phys., 2019, 125, 125102 CrossRef.
- H. Xie, X. Su, X. Zhang, S. Hao, T. P. Bailey, C. C. Stoumpos, A. P. Douvalis, X. Hu, C. Wolverton, V. P. Dravid, C. Uher, X. Tang and M. G. Kanatzidis, J. Am. Chem. Soc., 2019, 141, 10905–10914 CrossRef CAS PubMed.
- S. Mukherjee, A. V. Powell, D. J. Voneshen and P. Vaqueiro, J. Solid State Chem., 2022, 314, 123425 CrossRef CAS.
- H. Xie, X. Su, G. Zheng, Y. Yan, W. Liu, H. Tang, M. G. Kanatzidis, C. Uher and X. Tang, J. Phys. Chem. C, 2016, 120, 27895–27902 CrossRef CAS.
Footnotes |
| † Electronic supplementary information (ESI) available: Lattice parameters; first derivative of the XANES absorption (μ(E)) spectra of Cu, Fe, S, Cr in Cu0.92Cr0.08FeS2 and XANES K-edges of all elements in Cu1−xCrxFeS2 (0 ≤ x ≤ 0.1) samples; sulfur absorption spectra for Cu1−xCrxFeS2 (0 ≤ x ≤ 0.1) and FeS2; SEM images; calculation of the balanced equations and determination of the elemental content and Cu:Fe ratio in the main phase; analytically-determined composition of the main phase; dependence of Cr content and 1/Cu in the spinel secondary phase on the Cu:Fe ratio in the main phase as a function of nominal Cr concentration; room temperature Hall measurement data; calculation details to determine the Lorenz number and resulting values, mean and average sound velocity, shear and Young's moduli and Debye temperature. See DOI: https://doi.org/10.1039/d3ta05011d |
| ‡ Present address: Diamond Light Source, Harwell Science and Innovation Campus, Fermi Ave, Didcot, OX11 0DE, United Kingdom. |
| This journal is © The Royal Society of Chemistry 2023 |