
 Open Access Article
 This Open Access Article is licensed under a Creative Commons Attribution-Non Commercial 3.0 Unported Licence
Tuning reduction conditions to understand and control Ni exsolution from Sr0.8La0.1Ca0.1Ti0.94Ni0.06O3−δ†
Willis
O'Leary
 a,
Livia
Giordano
b and
Jennifer L. M.
Rupp
*acd
a,
Livia
Giordano
b and
Jennifer L. M.
Rupp
*acd
aDepartment of Materials Science and Engineering, Massachusetts Institute of Technology, Cambridge, MA, USA
bDepartment of Materials Science, University of Milano-Bicocca, Milan, Italy
cDepartment of Electrical Engineering and Computer Science, Massachusetts Institute of Technology, Cambridge, MA, USA
dDepartment of Chemistry, Technical University of Munich, Garching, Germany. E-mail: jrupp@tum.de
First published on 27th September 2023
Abstract
Ceramic-supported metal catalysts formed by exsolution of metal nanoparticles from perovskites are promising materials for energy and chemical conversion applications. However, our incomplete understanding of the exsolution mechanism presents a roadblock to engineering exsolution nanoparticle properties. We investigated the influence of reduction conditions on the properties of Ni nanoparticles exsolved on the fracture surfaces of Sr0.8La0.1Ca0.1Ti0.94Ni0.06O3−δ. We first carried out exsolution at 25 different temperatures and oxygen chemical potentials. We found that reduction at lower temperatures and moderate oxygen chemical potentials produced more numerous, smaller nanoparticles. We then fit our data to a LaMer nucleation model where the number of nanoparticles formed depends on Ni surface segregation, reduction of Ni-rich surfaces, and nanoparticle growth. Finally, we demonstrated prediction of the energetics of these processes with density functional theory calculations. Our experiments and modelling build understanding of the exsolution mechanism and are a step towards computational design of supported metal catalysts made via exsolution.
1 Introduction
Supported metal catalysts play a central role in chemical production,1–4 pollution control,5,6 as well as up-and-coming chemical and energy conversion technologies7 including fuel cells,8,9 electrolyzers,10,11 and synthetic fuels.12–14 These materials usually consist of a high-surface-area ceramic decorated with a metal catalyst. By ensuring fine dispersion of the metal catalyst – for example through deposition of metal nanoparticles – a high fraction of the metal can facilitate reactions. The ceramic backbone plays an important role in material stability, as it fixes the metal motifs in place to prevent them from agglomerating. However, metal agglomeration is inevitable at high temperatures due to the shallow interface and weak attraction between ceramics and deposited metals.15 Despite efforts to overcome this limitation, for example by carefully tuning the size of the metal motifs,16,17 metal agglomeration and subsequent catalyst deactivation remain a major issue.Exsolution processing, an alternative synthetic route to obtain agglomeration-resistant ceramic-supported metal catalysts, has gained traction over the past few decades. Rather than depositing a metal phase on a prefabricated ceramic support, exsolution relies on the formation of a solid solution between the support (typically a perovskite, ABO3−δ) and desired metal (as cations) at synthesis. The ceramic support is then reduced, transforming the added cations into metal nanoparticles on the support surfaces (Fig. 1a and b). The term exsolution generally refers to any phase separation of a solid solution.18 However, the term is now used as shorthand to specifically refer to the exsolution of catalytically active metal nanoparticles on the surface of metal oxides. “Exsolved” metal nanoparticles are partially embedded into the ceramic, unlike those in conventional ceramic-supported metal catalysts which simply sit on top of the ceramic surface. This distinct “particle-in-a-pit” morphology is characteristic of exsolved metal nanoparticles and affords higher resistance to agglomeration compared to conventionally deposited metal nanoparticles.19,20
 | ||
| Fig. 1 (a) SEM image of the surface of Sr0.8La0.1Ti0.94Ni0.06O3−δ after reduction in H2. Spherical Ni nanoparticles are distributed over the ceramic surface. (b) Generalized chemical equation for exsolution of cation M2+ from the generic perovskite AB1−xMxO3. Upon reduction (typically by high-temperature treatment under a H2 atmosphere), metal cations are reduced and integrated into the metal phase. To compensate for the loss of the cations, lattice oxygen is released. (c) Exsolution temperatures/atmospheres from selected literature reports compared to those investigated in this work. The most common experiment is to perform exsolution in 5 vol% H2 in an inert carrier gas while varying temperature. | ||
Although exsolution is a very attractive synthetic route to supported metal catalysts, engineering the exsolved metal nanoparticles' size and surface density remains challenging. This limits the performance and commercial feasibility of these materials. So far, several approaches have been developed to control nanoparticle properties by modification of the perovskite support. The influence of the stoichiometry of the perovskite backbone21–28 and strain19,27,29,30 has been thoroughly investigated, and it is now well-established that introduction of vacancies on the perovskite A-site21–26 and strain engineering29–31 can give access to finer distributions of nanoparticles and higher performing exsolution catalysts.
Exsolved nanoparticle properties can also be adjusted simply by tuning the reduction conditions. Here, marked progress has been made in understanding how reduction temperature and the composition of the reducing atmosphere impact the exsolved metal nanoparticle properties. Selected studies from this body of work are listed in Table S1.† The temperatures and reducing atmospheres considered in these studies are compared in Fig. 1c. Most reports exsolve a single perovskite composition at a range of temperatures under a fixed atmosphere (commonly 5 vol% H2 in an inert carrier gas). At higher reduction temperatures, studies on a diverse range of perovskite compositions report an increase in nanoparticle radius accompanied by a decrease in the density of nanoparticles on the perovskite surfaces.27,32–37 Reported tradeoffs between nanoparticle radius and density are most often attributed to competition between nanoparticle nucleation and growth.33,38 Specifically, the theory is that nucleation is favored at lower temperatures while growth outcompetes nucleation at higher temperatures; however, this tradeoff has never been fully quantified by a nucleation and growth model. Considerable evidence for the high resistance of these nanoparticles to agglomeration, even at high temperatures, has accumulated,19,20 so we consider explanations based on nucleation and growth more likely than those invoking nanoparticle agglomeration.39 Other, more complex trends have been reported as well; when exsolving Ni/Fe alloy nanoparticles from La0.5Sr0.5Fe0.8Ni0.1Nb0.1O3−δ at various temperatures, Wu et al. observed relatively constant nanoparticle radius and density from 600 °C to 750 °C followed by a dramatic increase in radius and density at 800 °C. When the temperature was increased to 900 °C, nanoparticle radius continued increasing while nanoparticle density dropped.39 Tang et al. made similar observations when exsolving Rh nanoparticles from La0.43Ca0.37Rh0.01Ti0.99O3−δ. From 500 °C to 700 °C, nanoparticle radius was relatively constant while nanoparticle density increased. At 800 °C, nanoparticle radius increased while nanoparticle density decreased.38
Relatively few studies have examined the influence of the reducing atmosphere on nanoparticle properties. Lindenthal et al. exsolved Co/Fe alloy nanoparticles from Nd0.6Ca0.4Fe0.9Co0.1O3−δ under two Ar/H2/CO2 atmospheres and found that a higher H2/CO2 ratio (more reducing) produced fewer, larger nanoparticles.40 Gao et al. made similar observations when exsolving Ni nanoparticles from La0.4Sr0.4Sc0.9Ni0.1O3−δ under Ar/H2 atmospheres. They found that switching from 20 vol% H2 in Ar to pure H2 resulted in larger nanoparticles. Furthermore, by fitting kinetic models for nanoparticle growth, they concluded that growth is faster under more reducing conditions.27 Kim et al. exsolved Co from Sr0.98Ti0.95Co0.05O3−δ under various temperatures and oxygen partial pressures (pO2). As temperature increased, nanoparticle radius decreased while nanoparticle density increased. As pO2 decreased (more reducing conditions), nanoparticle radius decreased while nanoparticle density increased. These effects were attributed to changes in the nucleation kinetics, described in classical nucleation theory by an Arrhenius rate. Here, it was proposed that more reducing conditions lower the nucleation barrier while higher temperatures increase the nucleation rate.41
Despite a large body of work, no complete, quantitative model for the nucleation and growth of exsolution nanoparticles under variable reducing conditions has been developed. Such a model could provide insight into the exsolution mechanism and serve as a useful engineering tool. Density functional theory (DFT) calculations may help in the development of such a model. DFT calculations of the driving force of surface segregation of metal cations have been important in understanding the impact of perovskite composition on nanoparticle properties, particularly nanoparticle density.24,27,28,31,42–49 Therefore, segregation energetics of exsolveable cations could serve as a proxy for nucleation rate. However, connecting DFT-based models to nucleation and growth is challenging. Since static DFT calculations are performed at absolute zero temperature, it is not always clear how to take temperature and reducing conditions into account. Some DFT models take O vacancies into consideration24,42–44,46–48 and therefore can be extended to understand the impact of the reducing environment. Kim et al. calculated that Co segregation in Co-doped PrBaMn2O5+δ was eased by the co-segregation of an oxygen vacancy. This calculation explained the experimentally-observed onset of exsolution at high temperatures.44 Gao et al. made similar arguments, calculating that the formation of an oxygen vacancy improves Ni segregation from Ni-doped SrTiO3. This in turn explained why exsolution only occurred under reducing conditions.24 Hamada et al. calculated oxygen vacancy formation energies and theorized that Pd, Rh, and Pt exsolved from LaFeO3 at different threshold oxygen chemical potentials, though this was not experimentally demonstrated.48 Overall, more work is needed to transform these largely qualitative findings into quantitative nucleation and growth models.
In this work, we studied the influence of temperature and reducing atmosphere on exsolution of Ni from Sr0.8La0.1Ca0.1Ti0.94Ni0.06O3−δ using experiments and first-principles calculations. We first characterized exsolution on as-prepared “native” surfaces and fracture surfaces of a bulk sample. We found the composition of Sr0.8La0.1Ca0.1Ti0.94Ni0.06O3−δ to be particularly amenable to transgranular fracture due to the promotion of grain growth by Ca and La substitution.50,51 The transgranular fracture surfaces formed were easy to analyze and exsolved far more homogeneously than native surfaces. Focusing on fracture surfaces, we next measured the properties of metal nanoparticles exsolved under various temperatures and oxygen chemical potentials. We fit these measurements to a semiempirical LaMer nucleation model informed by our previously proposed exsolution mechanism.28 Finally, we demonstrated that DFT calculations can be used to calculate key energetic parameters in this model. To our knowledge, this work is the first to build a quantitative model for nucleation of exsolved nanoparticles under variable reduction conditions. Our results offer deep insight into the exsolution mechanism and could help guide the search for superior exsolution materials for chemical and energy applications.
2 Methods
2.1 Material preparation
Perovskite powder with the nominal composition Sr0.8La0.1Ca0.1Ti0.94Ni0.06O3−δ was synthesized via a solid-state route. Stoichiometric quantities of SrCO3 (Alfa Aesar, 99.9%), CaCO3 (Sigma Aldrich, 99%), La2O3 (Sigma Aldrich, 99.9%), TiO2 anatase (Alfa Aesar, 99.6%), and NiO (Alfa Aesar, 99%) powders were ball milled (planetary ball mill, PM, Across International, PQ-N04) in pure ethanol with ZrO2 balls for 1 hour at 500 rpm. The resulting slurry was transferred to a crystallizing dish then dried for 2 hours at 120 °C. The remaining powder was briefly mixed via mortar and pestle before being transferred into an alumina crucible. The powder was then calcined at 1400 °C for 10 hours under air with a 10 °C min−1 heating rate. The resulting gray-black mass was ground to a fine powder with mortar and pestle. Next, the calcined power was pressed into a 0.15 g pellet using a uniaxial press (5000 bar) and sintered at 1500 °C for 5 hours under air with a 10 °C min−1 heating rate on an alumina plate. After sintering, the pellet was broken using tweezers to expose fracture surfaces.Pellets were exsolved in a tube furnace under a 200 sccm flow of Ar and H2. The composition of the atmosphere was controlled by Ar and H2 mass flow controllers (Ar: Vögtlin red-y smart Hi-performance, 300 mln min−1, H2: Vögtlin red-y smart Hi-performance, 200 mln min−1). Manufacturer-reported variance in the H2 flow rate was used to estimate variance in the oxygen chemical potential within the furnace.
2.2 Material characterization
XRD patterns of the as-calcined Sr0.8La0.1Ca0.1Ti0.94Ni0.06O3−δ powder was measured with a Panalytical X'Pert Pro diffractometer equipped with an X-ray tube using Cu-Kα radiation. An X'Celerator 1D detector, Ni filter, and a fixed divergence slit of 1/2° was used. SEM (Carl Zeiss Merlin HR-SEM, Germany) was performed using an in-lens detector and 6 kV accelerating voltage. The smoothness of the fracture surfaces on which exsolution was analyzed allowed semi-automated analysis of nanoparticle properties with Fiji52,53 (see ESI, Section S.1†). Nanoparticle number was divided by image area to determine nanoparticle density, while nanoparticle radius was determined by averaging over all nanoparticles visible in the image. Mean nanoparticle densities and radii were determined by an average over five images.2.3 DFT calculations
Spin-polarized DFT calculations were done in a manner consistent with those in our previous work.28 Calculations were done under the generalized gradient approximation with the Perdew–Burke–Ernzerhof (PBE)54 functional using the Vienna Ab initio Simulation Package (VASP).55–58 A 500 eV plane wave cutoff was used. The projector augmented-wave (PAW) method was applied.58,59 The PAW pseudopotentials included with VASP (v.5.4) were used for all elements. Standard pseudopotentials were used for O and La, while pseudopotentials treating semi-core s-states as valence states were used for Sr and Ca. For Ti and Ni, pseudopotentials treating semi-core p-states as valence states were used. Hubbard + U corrections60 were applied to Ti and Ni atoms (UTi = 3 eV, UNi = 6 eV). To better capture long-range forces, the DFT-D3 method with Becke–Johnson damping was applied.61 Details on the models used can be found in the main text, ESI,† and our previous work.283. Results and discussion
3.1 Synthesis, exsolution, and characterization of Sr0.8La0.1Ca0.1Ti0.94Ni0.06O3−δ
We first carried out experiments to demonstrate successful exsolution of Ni nanoparticles from Sr0.8La0.1Ca0.1Ti0.94Ni0.06O3−δ solid solutions and identify suitable surfaces on which to study the influence of reduction conditions on nanoparticle properties. For this, we prepared and characterized a ceramic pellet with the nominal stoichiometry Sr0.8La0.1Ca0.1Ti0.94Ni0.06O3−δ with 10 mol% La and 10 mol% Ca substitution on the Sr-site (A-site) and 6 mol% Ni substitution on the Ti-site (B-site) of SrTiO3. The steps taken to synthesize, exsolve, and characterize the pellet are shown in Fig. 2a. To begin, we calcined ball-milled precursors at 1400 °C for 10 hours under air to form Sr0.8La0.1Ca0.1Ti0.94Ni0.06O3−δ powder. We performed X-ray diffraction (XRD) on the powder to verify formation of the perovskite phase. We then prepared and densified a pellet at 1500 °C for 5 hours under air. We broke the pellet and selected a shard with both exposed fracture surfaces and “native” pellet surfaces. To drive exsolution, we reduced this shard at 900 °C under 5 vol% H2 in Ar for 10 hours, after which we examined the shard's surfaces with scanning electron microscopy (SEM). | ||
| Fig. 2 (a) Steps taken to synthesize, exsolve, and characterize our Sr0.8La0.1Ca0.1Ti0.94Ni0.06O3−δ pellet. Exsolution characteristics of the pellet's “native” and fracture surfaces were observed via SEM. (b) XRD pattern of as-synthesized Sr0.8La0.1Ca0.1Ti0.94Ni0.06O3−δ powder. All peaks indicative of the perovskite structure were present. A single super reflection indicated deviation from the ideal cubic structure. (c) SEM images of the native and fractured Sr0.8La0.1Ca0.1Ti0.94Ni0.06O3−δ surfaces after exsolution. Surface terracing strongly influenced exsolution of nanoparticles on the native surfaces. Exsolution on fracture surfaces – which were relatively smooth, indicative of transgranular fracture – was far more homogeneous. | ||
The XRD pattern of the Sr0.8La0.1Ca0.1Ti0.94Ni0.06O3−δ powder after calcination is shown in Fig. 2b. This pattern was analyzed in a previous work,28 showing no impurity phases. Observed Bragg peaks corresponded well to a cubic perovskite structure with lattice constant of 3.9010 Å, though the presence of a weak super reflection at 38.4° is consistent with several of the distorted tilt systems derived by Glazer.62 Pelletization and densification yielded a pellet with a dull, gray-black surface. Fracture of the pellet exposed shiny, black surfaces. This gave a first indication that the fracture was transgranular (through the grains), since surfaces created via transgranular fracture tend to be smoother and more reflective than those created by intergranular fracture.63
Post-exsolution SEM images of the native and fractured surfaces of the Sr0.8La0.1Ca0.1Ti0.94Ni0.06O3−δ shard are shown in Fig. 2c. The native surface exhibited a highly terraced surface morphology. The presence of terracing in Ni- and La-doped SrTiO3 has previously been shown to be an indicator of oxygen deficiency.64 Assuming Ni takes on a 2+ oxidation state, our nominal composition implies a small oxygen deficiency of δ = 0.01. The observed wide terrace spacing, however, suggests an oxygen deficiency beyond its nominal value. The terraces were made up of smooth surfaces separated by rough regions. Nanoparticles with radii of 25–35 nm were visible within the rough regions, while few were present in the smooth regions.
Compared to the highly inhomogeneous exsolution on the native surface, exsolution on fracture surfaces was far more uniform and vigorous, in agreement with previous observations on La0.52Sr0.28Ti0.94Ni0.06O3.64 The nanoparticle density near the grain boundaries was slightly elevated compared to within the grains. The fracture surfaces were relatively smooth, interrupted only by grain boundaries and the occasional pore, confirming our initial hypothesis of transgranular fracture. We next measured the influence of reducing conditions on the exsolution of Ni nanoparticles on these fracture surfaces.
3.2 Adjusting reduction temperature, oxygen chemical potential to tune nanoparticle properties
We exsolved Sr0.8La0.1Ca0.1Ti0.94Ni0.06O3−δ fracture surfaces under various reducing conditions to establish the influence of reducing temperature and atmosphere on exsolved nanoparticle properties. We selected 25 Sr0.8La0.1Ca0.1Ti0.94Ni0.06O3−δ shards possessing shiny fracture surfaces and exsolved each under different reducing conditions.Our exsolution setup is diagrammed in Fig. 3a. We processed each shard in a tube furnace under a continuous 200 sccm flow of gas. The inlet gas was a mixture of H2 and Ar, with the H2/Ar ratio controlled with high-precision mass flow controllers. The sample was first heated to the target temperature for 1.5 hours while pure Ar was flowed through the system to remove ambient air and moisture. Once the target temperature was reached, H2 was introduced to drive exsolution. After 10 hours of reduction, the furnace was allowed to naturally cool. The Ar/H2 atmosphere was maintained during cooling to prevent nanoparticle reoxidation.
 | ||
| Fig. 3 (a) Experimental setup for exsolution of perovskite shards at various temperatures and oxygen chemical potentials. Temperature was controlled via a calibrated tube furnace, while oxygen chemical potential was adjusted by varying the H2/Ar ratio of the inlet gas. Samples were heated to the target temperature while flushing the system with Ar. A set fraction of H2 was then introduced into the inlet gas to reduce the material. After 10 hours of reduction, the material was cooled under the reducing atmosphere to prevent reoxidation. (b) Set H2 concentrations used to achieve the desired oxygen chemical potentials at the various temperatures. These concentrations were calculated using gas-phase thermodynamics (see ESI Section S.2†). | ||
We reduced the shards at five different temperatures: 850, 875, 900, 925, and 950 °C. We adjusted the volume fraction of H2 in the inlet gas with the goal of achieving the same range of oxygen chemical potentials at each temperature. We used thermodynamic calculations to estimate these H2 fractions, the results of which are presented in Fig. 3b. We denote oxygen chemical potential as ΔμO, defined as the change in oxygen chemical potential versus a pure, 1 atm O2 atmosphere at 0 K. Uncertainties in chemical potentials were derived from the manufacturer-reported variabilities in the mass flow rates of the mass flow controllers. This error is largest at low gas flow rates and becomes negligible at moderate to high flow rates.
Before advancing to our experimental findings, some discussion on our reported values for ΔμO is warranted. In our experiments, ΔμO is determined by the partial pressures of H2 (pH2, set by mass flow controllers) and H2O (pH2O, introduced via desorption from components and leaks). We conservatively estimate pH2O ≤ 3 × 10⁻⁵ atm. Within this regime, lower values of pH2O will shift all ΔμO's by a constant factor between 0 and −0.2 eV. Therefore, we believe that the atmospheres achieved in this study cover a consistent range of chemical potentials at each temperature, though the magnitude of ΔμO is uncertain. In addition, we stress that the equilibrium ΔμO within our atmospheres should be regarded as a nominal quantity, as mass transport within the furnace as well as oxygen release from exsolving sample will dictate the transient value of ΔμO near the surface of the sample. Further definitions, details, and discussion can be found in the ESI Section S.2.†
After treatment of our 25 shards under the 25 different reduction conditions, we used SEM to determine the surface densities and radii of the exsolved nanoparticles. For each sample, we took images of five randomly chosen sites on the fracture surfaces. The area covered by each of the images ranged from ∼2.5 μm2 to ∼58 μm2 depending on the size of the nanoparticles. Representative SEM images collected from five shards exsolved at 900 °C under various oxygen chemical potentials are shown in Fig. 4a. Representative images for all samples can be found in Fig. S3.† For all treatments, nanoparticles appeared on the fracture surfaces with good homogeneity.
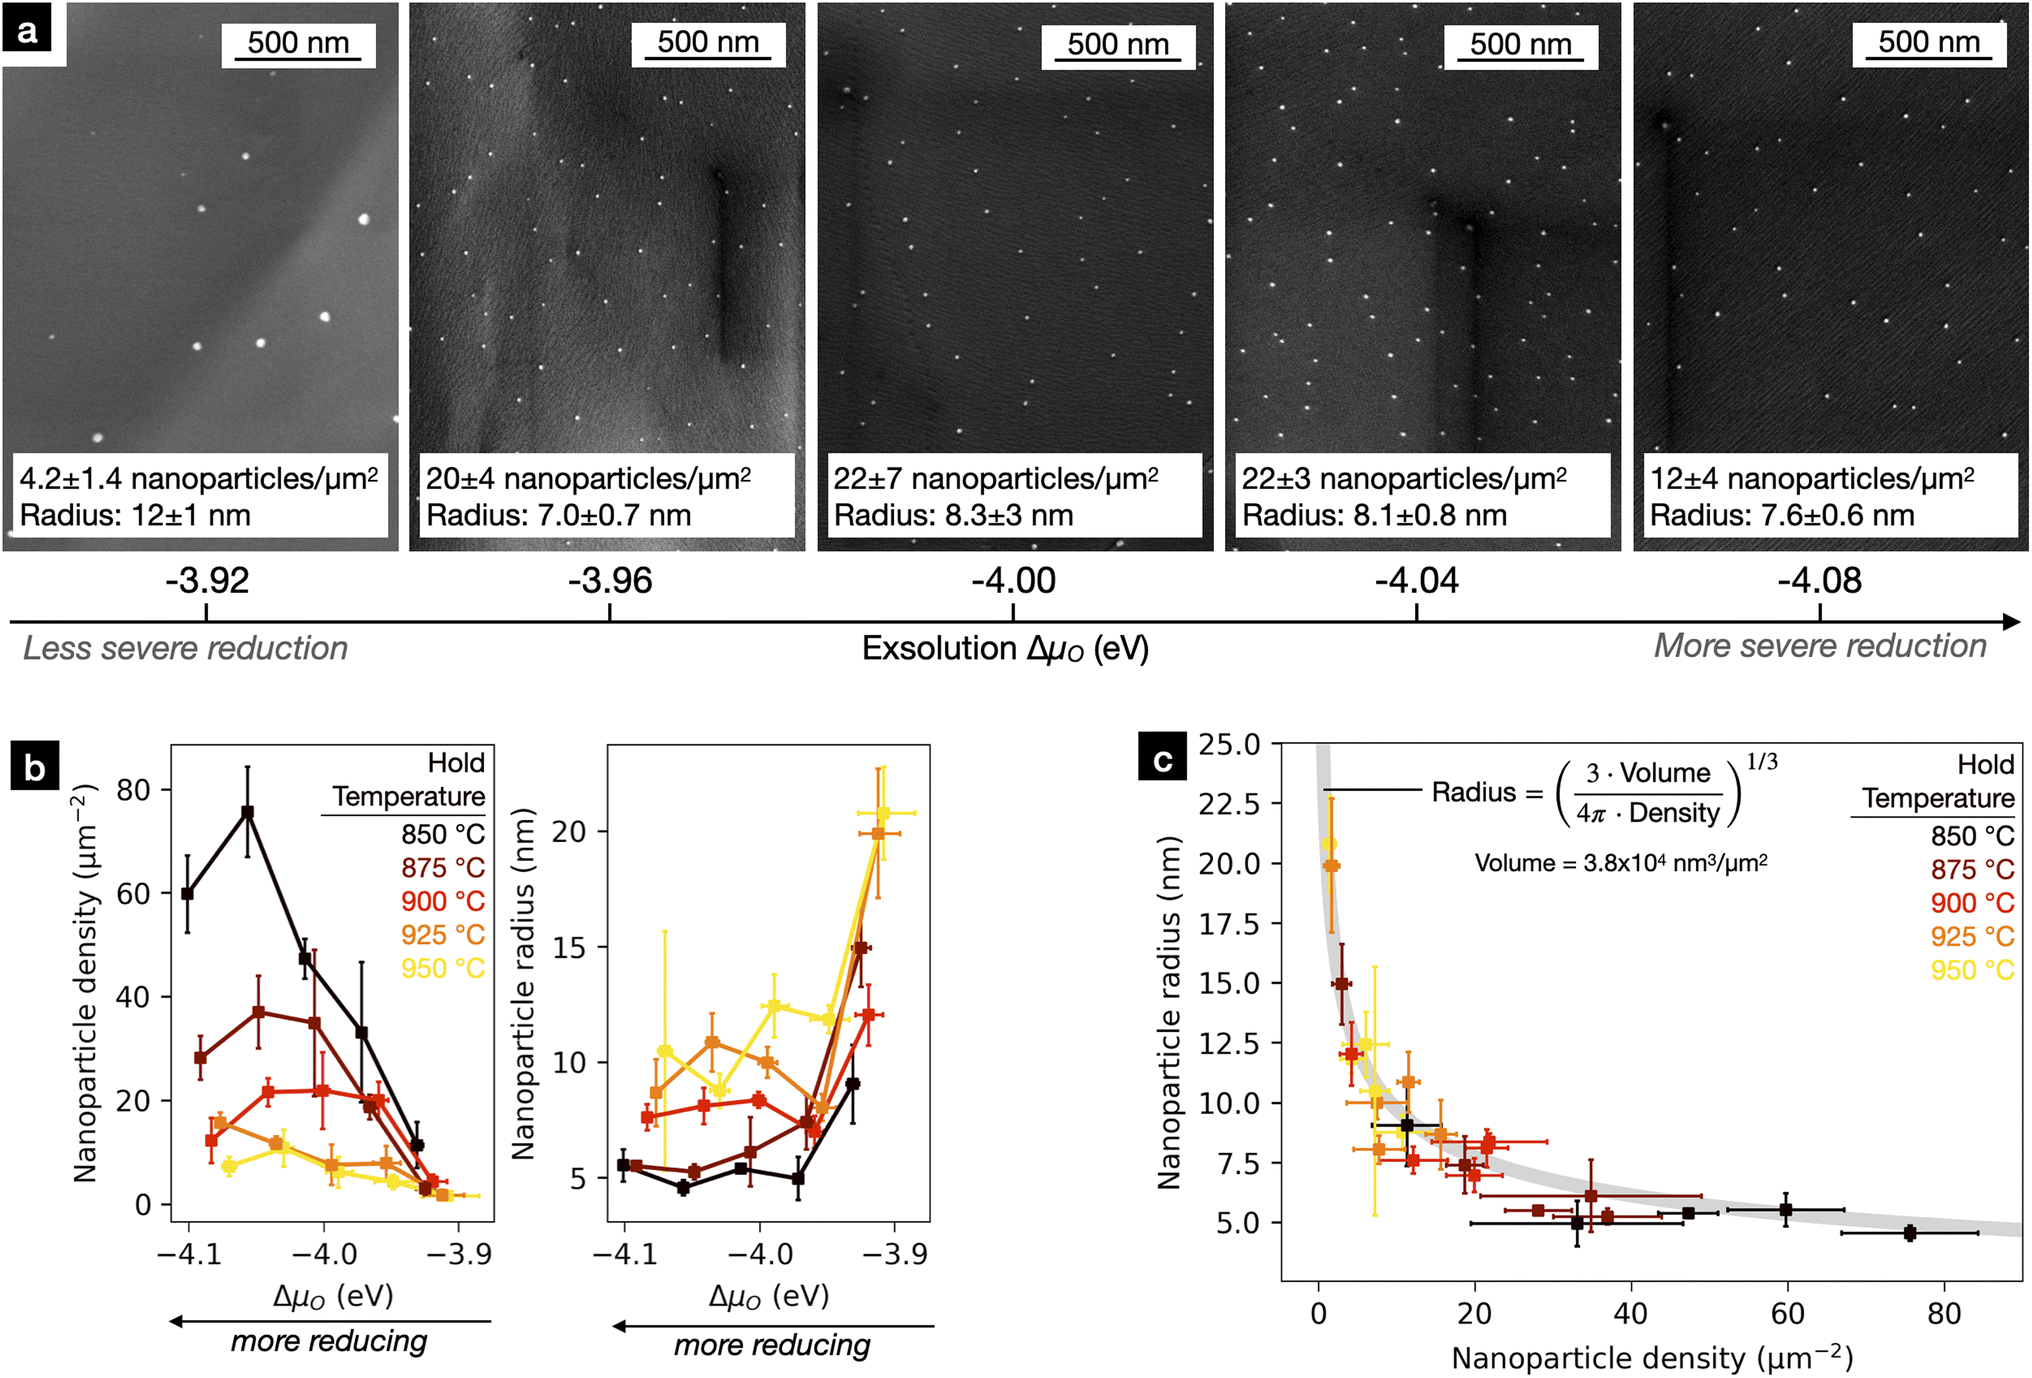 | ||
| Fig. 4 (a) Representative images of Sr0.8La0.1Ca0.1Ti0.94Ni0.06O3−δ fracture surfaces after reduction at 900 °C at various oxygen chemical potentials. All fracture surfaces were smooth, confirming these to be transgranular fracture surfaces. As oxygen chemical potential increased (harsher reducing conditions), nanoparticle density increased, plateaued, then decreased while nanoparticle radius decreased then plateaued. (b) Measured exsolved nanoparticle density and radius as a function of exsolution temperature and oxygen chemical potential. (c) Mean nanoparticle radius vs. nanoparticle density for all 25 unique processing conditions. The line indicates where the volume of the total exsolution per unit surface area is equal. By finding the best fit of the line to the experimental measurements, the exsolution volume per area could be estimated: 3.8 × 10⁴ nm3 μm−2. | ||
Mean nanoparticle densities and radii are plotted for the various reducing conditions in Fig. 4b. Histograms for nanoparticle radii for all samples are plotted in Fig. S4.† The exsolution nanoparticle properties on fracture surfaces were very sensitive to changes in the reduction conditions. We observed substantial differences in nanoparticle radius (5 nm up to 20 nm) and almost two orders of magnitude variation in nanoparticle density (1.5 nanoparticles per μm2 up to 75 nanoparticles per μm2). Such large variations were surprising, considering the rather small increments of ΔμO (0.04 eV, ∼0.5 kT at exsolution conditions) and temperature (25 °C). We noted three general trends in the nanoparticle density and radii:
(1) At higher temperatures and fixed ΔμO, nanoparticle density decreased while nanoparticle radius increased.
(2) At a fixed temperature nanoparticle radius was nearly constant, except for ΔμO = −3.92 eV where nanoparticle radius increased dramatically for all temperatures.
(3) Under more severe reducing conditions (more negative ΔμO) at fixed temperatures, nanoparticle density first increased then decreased. The sample reduced at 925 °C and ΔμO = −4.08 eV does not obey this trend. We consider this point to be an outlier.
In addition, we observed a systematic relationship between average nanoparticle radius and density across all reduction conditions. In Fig. 4c, nanoparticle radius is plotted against nanoparticle density and a line defining a constant exsolution volume (volume of nanoparticles per unit of perovskite surface area). To derive this line, we assumed all nanoparticles were spherical and fit the following expression,  , for V, where V is the total exsolution volume per unit area, ρ is the average nanoparticle density, and r is the average nanoparticle radius. The best fit value was V = 3.8 × 10⁴ nm3 μm−1.2 The fit was good, with a low standard error of regression of 1.2 nm. Our experimental data points largely fall onto this line, implying that the exsolution volume (or alternatively, the extent of exsolution) was not strongly dependent on the exsolution conditions.
The nearly constant extent of exsolution may trace back to the small changes in ΔμO and temperature employed in our experiments. If we consider exsolution as a simple process in which lattice Ni2+ is transformed into metallic Ni while lattice oxygen is released into the gas phase (for charge compensation), then the exsolution driving force will explicitly depend on ΔμO and the chemical potential of Ni. Our small changes in ΔμO (−0.2 eV) and temperature (100 °C) (on which Ni's chemical potential weakly depends) may not be large enough to appreciably change the driving force (see ESI, Section S.3†). The observed constant exsolution extent may also reflect limited availability of Ni cations; based on kinetic models, several studies have found that nanoparticle growth may be controlled by the availability of exsolveable cations.19,27 Based on kinetic fits, these same studies note that Ni diffusion is likely not the limiting factor. This is consistent with our findings, as a process limited by a diffusion step with a substantial activation barrier would be sensitive to small temperature changes. In addition, our exsolution volume indicates very low Ni availability, with an average Ni depletion depth of only 3 nm.
Since the exsolution extent is roughly constant, we hypothesized that the trends in nanoparticle density were a result of competition between nanoparticle nucleation and growth. To test this hypothesis, we developed a nucleation model to fit our experimental data.
3.3 Semiempirical model for nucleation of exsolution nanoparticles
Of the numerous physical and empirical nucleation and growth models available, we chose to fit our experimental data to the extension of the LaMer growth model proposed by Sugimoto et al.65 The LaMer model was initially proposed to explain the formation of monodisperse sulfur particles when water is added to a sulfur/alcohol solution.66 The model assumes that, upon addition of solute at a constant rate, the solute concentration behaves as shown in Fig. 5a during nucleation and growth. The solute concentration rises steadily until supersaturation is reached, triggering the start of nucleation and growth. Initially, both nucleation and growth are extremely slow and do not inhibit the continued rise of the solute concentration above supersaturation. Once enough nuclei have formed, growth drives solute concentration asymptotically towards the saturation limit. After this point, added solute contributes to growth only and nucleation stops. The idea that nucleation is restricted to the first moments of nucleation and growth is referred to as “burst” nucleation. Burst nucleation was key in explaining the formation of monodispersed nanoparticles in LaMer and Dineger's experiments.66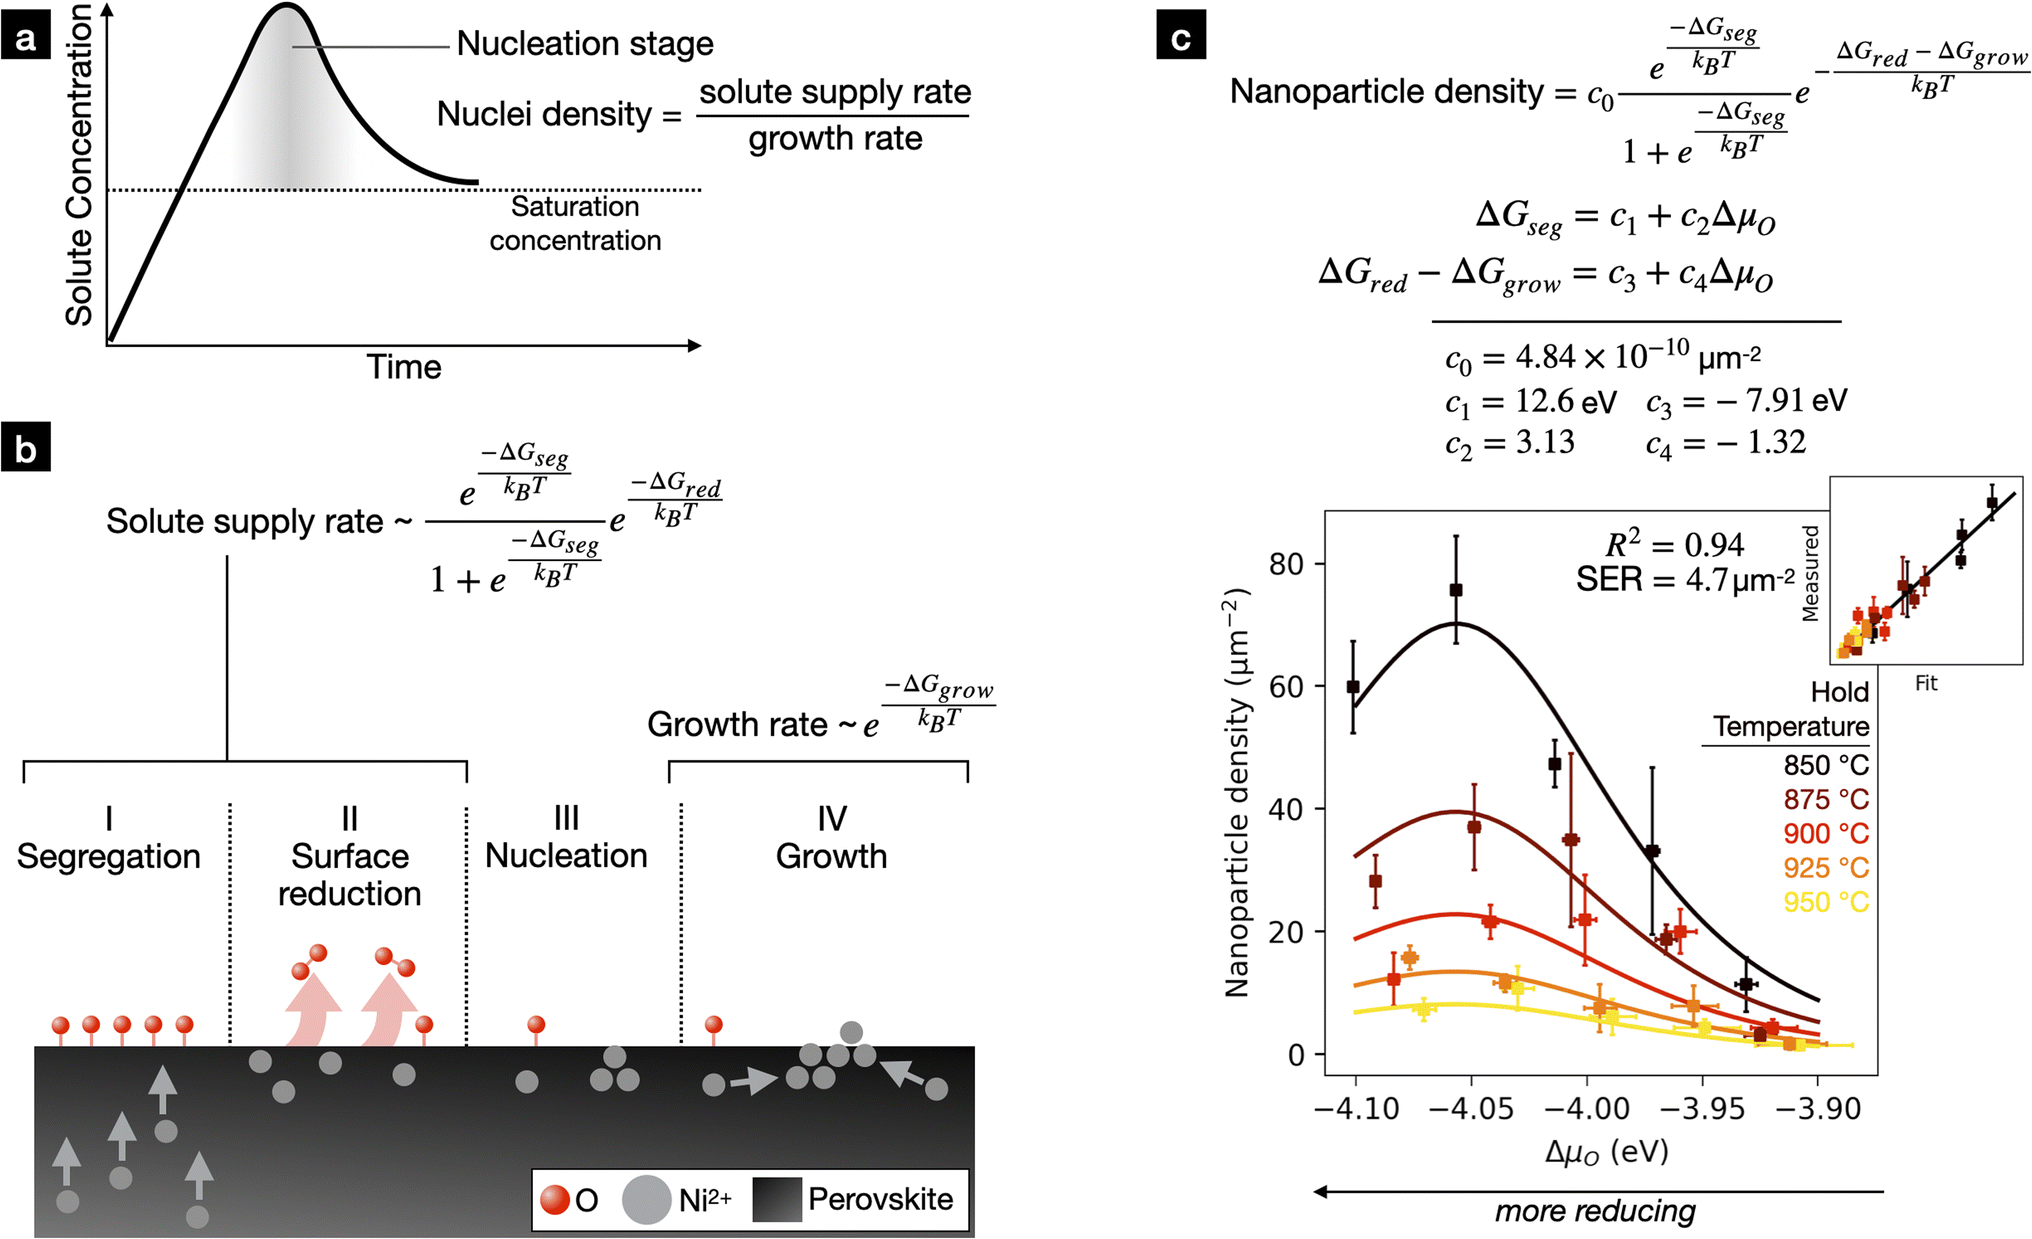 | ||
| Fig. 5 (a) Solute concentration vs. time assumed in the LaMer mechanism. Solute is made available for nucleation and growth and solute concentration initially shoots past the solute saturation limit. Nucleation quickly occurs and growth drives the solute concentration down to the saturation concentration. After this point, essentially all excess solute supplied goes towards growth. The final number of nuclei is the ratio in the solute supply rate and the growth rate. (b) Model for exsolution introduced in our previous work.28 Here, solute supply rate is dependent on the energetics of B-site cation segregation and surface reduction. We assume that the growth rate follows an Arrhenius equation. (c) Semiempirical model for nanoparticle density fit to experimental data. | ||
In situ TEM studies observing exsolution of Ni from La0.43Ca0.37Ni0.06Ti0.94O3![[thin space (1/6-em)]](https://www.rsc.org/images/entities/char_2009.gif) 19 and Sr2Fe1.35Mo0.45Co0.2O6−δ67 and Co from Co-doped Pr0.5Ba0.5MnOx68 indicate that metal nanoparticle nuclei form in the first seconds-minutes upon exposure to reducing gas. Nanoparticle growth, meanwhile, occurs on the order of hours, as shown when exsolving Ni from La0.4Sr0.4Sc0.9Ni0.1O3−δ,27 La0.5Sr0.5Fe0.8Ni0.1Nb0.1O3−δ,39 and La0.2Sr0.7Ti0.9Ni0.1O3−δ.32 The order-of-magnitude difference between nucleation and growth timescales suggests burst nucleation and the LaMer model may apply to exsolution. Furthermore, the burst nucleation hypothesis may rationalize recent results in which repeated reduction and oxidation treatments result to extremely high nanoparticle densities.69 Here, oxidizing after a short period of reduction may allow for several rounds of burst nucleation without losing too many available exsolveable cations to growth.
19 and Sr2Fe1.35Mo0.45Co0.2O6−δ67 and Co from Co-doped Pr0.5Ba0.5MnOx68 indicate that metal nanoparticle nuclei form in the first seconds-minutes upon exposure to reducing gas. Nanoparticle growth, meanwhile, occurs on the order of hours, as shown when exsolving Ni from La0.4Sr0.4Sc0.9Ni0.1O3−δ,27 La0.5Sr0.5Fe0.8Ni0.1Nb0.1O3−δ,39 and La0.2Sr0.7Ti0.9Ni0.1O3−δ.32 The order-of-magnitude difference between nucleation and growth timescales suggests burst nucleation and the LaMer model may apply to exsolution. Furthermore, the burst nucleation hypothesis may rationalize recent results in which repeated reduction and oxidation treatments result to extremely high nanoparticle densities.69 Here, oxidizing after a short period of reduction may allow for several rounds of burst nucleation without losing too many available exsolveable cations to growth.
We applied Sugimoto et al.’s extension of the LaMer model to fit our experimentally measured nanoparticle density.65 Sugimoto et al. derived an expression for the nuclei density as the ratio of the solute supply rate and the growth rate:
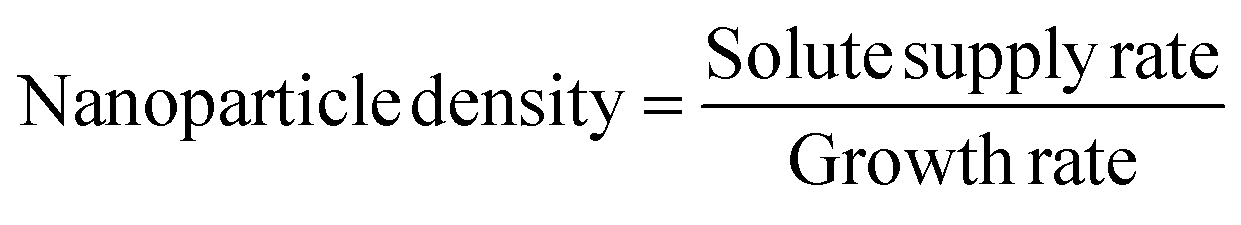 | (1) |
We derived a suitable expression for solute supply rate in our previous work.28 There, by correlating the exsolution properties of a variety of Ni-doped SrTiO3 solid solutions with DFT calculations, we derived the four-step exsolution mechanism diagrammed in Fig. 5b. The perovskite is first reduced, which drives Ni segregation to the perovskite surface. The degree of Ni segregation is determined by the thermodynamic driving force ΔGseg, assuming an equilibrium between bulk and surface Ni cations. After segregation, the Ni-rich surfaces can lose additional oxygen with a kinetic barrier ΔGred. We proposed that these reduced Ni-rich surfaces feed nanoparticle nucleation and growth i.e., the solute supply rate equals the generation rate of reduced Ni-rich surfaces. Based on the mechanism, we derived the following expression for the solute supply rate:
 | (2) |
In this work, we again used eqn (2) to describe the solute supply rate. Previously, we derived values for ΔGseg and ΔGred for Sr0.8La0.1Ca0.1Ti0.94Ni0.06O3−δ based on DFT calculations and exsolution on native surfaces.28 However, since this work focused on fracture surfaces, these values could not be carried over. Rather, we defined ΔGseg and ΔGred as simple, to-be-determined linear functions of the oxygen chemical potential ΔμO. Similarly, we defined a growth barrier ΔGgrow as a linear function of ΔμO and the growth rate as an Arrhenius rate:
 | (3) |
Combining eqn (1)–(3) yielded the final expression:
 | (4) |
| ΔGseg = c1 + c2ΔμO | (5) |
| ΔGred − ΔGgrow = c3 + c4ΔμO | (6) |
We began by directly fitting eqn (4) to our 25 experimentally measured metal nanoparticle densities using non-linear least squares regression. This initial fit was poor, with a standard error of regression of 8.2 μm−2 and an R2 value of 0.81 (Fig. S6a†). Curious, we removed the pH2 term as done in our previous work and refit the model. This fit was excellent, with a standard error of regression of 4.7 μm−2, an R2 value of 0.94, and 2–3 outliers among the 25 total datapoints. The fit parameters were c0 = 4.84 × 10⁻¹⁰ μm−2, c1 = 12.6 eV, c2 = 3.13 (unitless), c3 = −7.91 eV, and c4 = −1.32 (unitless). This fitted model is compared to the experimental data in Fig. 5c.
Based on this fit, we conclude that the relationship between the nanoparticle density is not explicitly proportional to pH2 as originally conjectured. This may imply that the surface reduction kinetics has negligible explicit dependence on pH2. However, this finding is also consistent with proportional dependence of the growth rate on pH2, which would cancel out the explicit pH2 term in eqn (4). Whatever the reason, we must ultimately regard eqn (4) as a semiempirical expression; additional work is required to understand how it's mathematical form precisely relates to the exsolution mechanism.
Despite uncertainties regarding the role of pH2, we could still extract some useful physical insights from the fitting constants. The constants c2 and c4 define the dependence of ΔGseg and ΔGred − ΔGgrow on ΔμO. We found that c2 > 0, implying that segregation energy is more favorable under more reducing conditions. We found that c4 < 0, meaning that under more reducing conditions surface reduction is less favorable and/or growth is more favorable. The opposite signs of c2 and c4 imply that the observed maximum in nanoparticle density is due to a tradeoff between Ni surface segregation thermodynamics and the rate of Ni surface reduction and/or metal nanoparticle growth. In addition, the increase in nanoparticle density at lower temperatures can be attributed to the suppression of nanoparticle growth.
Our derived model provides insight into the exsolution mechanism and could be used to optimize exsolution from Sr0.8La0.1Ca0.1Ti0.94Ni0.06O3−δ fracture surfaces. By performing similar studies on different perovskite compositions, one could derive a more general model i.e., a model that predicts the exsolution properties of an arbitrary composition after treatment under arbitrary reducing conditions. However, building such a model in this way would require an enormous experimental effort and would deliver only limited physical insights. Alternatively, methods could be developed to calculate the energetic parameters underlying our model. This would allow the model to be applied to arbitrary compositions. We next evaluated the feasibility of this approach by performing DFT calculations.
3.4 Calculation of semiempirical model parameters with DFT
In our previous work, we calculated two energies with DFT, here denoted as ΔGDFTseg and ΔGDFTred, that integrated into eqn (2) predicted the exsolved nanoparticle densities of a variety of perovskite compositions.28 In this work, we evaluated how these DFT-derived energies compared to ΔGseg and ΔGred − ΔGgrow, the energetic parameters in our semiempirical nucleation model.We calculated ΔGDFTseg and ΔGDFTred in a manner consistent with our previous work.28 Calculations were done on a five-layer (110) oriented slab model shown in Fig. 6a with the stoichiometry Sr0.8La0.1Ca0.1Ti0.9Ni0.1O3−δ. ΔGDFTseg was defined as the energy change upon swapping Ni and Ti between the third and first layers. ΔGDFTred was defined as the energy change upon removal of an oxygen from the slab surface and incorporation into the gas phase after Ni segregation. The positions of the Ca and La dopants were chosen to minimize ΔGDFTseg and ΔGDFTred. Both energies were rescaled based on the fits to experimental measurements presented in our previous work.28
 | ||
| Fig. 6 (a) Slab model and formulae (from ref. 28) used to calculate segregation (ΔGDFTseg) and reduction (ΔGDFTred) energies using DFT. (b) Surface structures (SrTiOx) used to approximate the influence of reduction conditions on segregation and reduction energies. For simplicity, A-site dopants (Ca and La) are not pictured. (c) Segregation and reduction energies vs. x. An oxygen chemical potential term is subtracted from ΔGDFTred to remove explicit dependence on ΔμO. (d) Surface oxygen removal energies as a function of x. The x at which this line equals −ΔμO defines x under experimental conditions. (e) Fit segregation and reduction/growth energies of our nucleation model compared to their DFT analogues, which are calculated by combining the results in (c) and (d). | ||
ΔGDFTseg and ΔGDFTred are dependent on the slab's surface O termination x, where x refers to the surface oxygen stoichiometry (SrTiOx) (Fig. 6b). Fig. 6c plots ΔGDFTseg for the three accessible and relevant O terminations. ΔGDFTred − 1.29 ΔμO is plotted as well, with the oxygen chemical potential term subtracted to allow plotting without assuming a specific value for ΔμO (see formula in Fig. 6a). As x decreases, ΔGDFTseg decreases, implying that Ni segregation is more favorable as ΔμO becomes more negative (dΔGDFTseg/dΔμO > 0). ΔGDFTred − 1.29 ΔμO increases as x decreases. The sign of dΔGDFTred/dΔμO depends on the numerical value of dx/dΔμO and therefore cannot be determined so simply.
In previous work we calculated ΔGDFTseg and ΔGDFTred for a fixed x where x was chosen as the most stable surface oxygen stoichiometry under the given reducing conditions.28 Under this methodology, ΔGDFTseg(ΔμO) and ΔGDFTred(ΔμO) would be discontinuous and could not be readily compared to the continuous functions ΔGseg(ΔμO) and ΔGred(ΔμO). We therefore derived the following continuous composite functions:
| ΔGDFTseg(ΔμO) = ΔGDFTseg(x(ΔμO)) | (7) |
| ΔGDFTred(ΔμO) = ΔGDFTred(x(ΔμO), ΔμO) | (8) |
DFT-derived exsolution energetics are compared to energy parameters from our semiempirical model in Fig. 6e and Table 1. ΔGDFTseg was ∼0.5 eV less favorable than the empirically-derived ΔGseg. This disagreement was unsuprising given that the formula for ΔGDFTseg was derived (in part) from experimental measurements of exsolution on native surfaces while ΔGseg was derived based on exsolution on fracture surfaces. As observed in Section 2.1, native surfaces exsolved less vigorously than fracture surfaces. This has been shown to be due to strong A-site segregation on the native surfaces which inhibits exsolution,64 which may be reflected in a higher segregation energy. However, dΔGDFTseg/dΔμO was in reasonable agreement with dΔGseg/dΔμO (4.31 vs. 3.13, a 38% difference). Therefore, we propose that ΔGseg could be derived by subtracting a constant ∼0.5 eV correction from ΔGDFTseg. However, detailed studies on other perovskite compositions would be needed to confirm this.
| Derivative | Semiempirical model | Density functional theory |
|---|---|---|
| dΔGseg/dΔμO | +3.13 | +4.31 |
| dΔGred/dΔμO | n/a | −0.87 |
| d(ΔGred − ΔGgrow)/dΔμO | −1.32 | n/a |
ΔGred − ΔGgrow and ΔGDFTred were consistent with the assumptions underlying our nucleation model, although these two energies are not directly comparable. The composite energy ΔGred − ΔGgrow was ∼2 eV lower than ΔGDFTred. This is consistent with our interpretation of ΔGgrow as a growth barrier (>0) and suggests that the growth barrier is larger than the reduction barrier. d(ΔGred − ΔGgrow)/dΔμO and dΔGDFTred/dΔμO were both negative (−1.32 vs. −0.87, a 57% difference). This result is consistent with dΔGgrow/dΔμO > 0, as expected since we expect the growth barrier to increase under less reducing conditions. We found that dΔGDFTred/dΔμO < 0, suggesting that dΔGred/dΔμO < 0. This result is consistent with the energetic trends observed and discussed in our previous work.28 There, we noted that as the oxygen content on the surface decreased, removal of additional oxygen becomes more difficult. These results are encouraging, but as of now we do not have a method to directly calculate ΔGred − ΔGgrow with DFT calculations. One possible scenario would be that the growth rate is largely independent of the perovskite composition, in which case ΔGDFTred could be linearly rescaled to derive a value for ΔGred − ΔGgrow. As in the case of ΔGseg, additional experiments and calculations are be needed to investigate this.
Based on our empirically derived energetics and the DFT calculations, we can reexamine terms in our semiempirical model (Fig. S8†) and more fully interpret our experimental observations discussed in Section 3.2:
(1) At higher temperatures and fixed ΔμO, nanoparticle density decreased while nanoparticle radius increased. Higher temperatures accelerate nanoparticle growth but only slightly increase the solute supply rate (by increasing the Ni-rich surface reduction rate). Ni segregation is largely unaffected by changes in temperature. This reduces the duration of the nucleation “burst”, resulting in fewer, larger nanoparticles.
(2) At a fixed temperature nanoparticle radius was nearly constant, except for ΔμO = −3.92 eV where nanoparticle radius increased dramatically for all temperatures. At greater ΔμO, Ni segregation is far less favorable, the surface reduction barrier slightly decreases, and the growth barrier increases. Although the growth rate is smaller, a far lower solute supply rate leaves little opportunity for nanoparticles to form. With a very short nucleation burst, nanoparticles can grow quite large.
(3) Under more severe reducing conditions (more negative ΔμO) at fixed temperatures, nanoparticle density first increased then decreased. As ΔμO decreases, the solute supply rate increases (largely due to an enhancement of Ni segregation). This leads to the initial increase in nanoparticle density. At more reducing conditions, the surface reduction barrier increases, and the growth barrier decreases. These effects eventually lead to a decrease in the nanoparticle density.
To our knowledge, this work is the first to quantitatively capture the influence of reduction conditions on exsolution nanoparticle density for different temperatures and reducing atmospheres. By building a nucleation model, we showed how Ni segregation, reduction of Ni-rich surfaces, and nanoparticle growth dictate the density and size of Ni nanoparticles exsolved from Sr0.8La0.1Ca0.1Ti0.94Ni0.06O3−δ. Key here was the introduction of burst nucleation and the LaMer mechanism which, combined with the energetics of exsolution, explains why small changes in the reduction conditions produced large changes in the exsolved nanoparticle properties. Furthermore, we demonstrated that our model's parameters could be derived with DFT calculations. This raises the question whether a general exsolution model could be derived i.e., a first-principles method to predict the properties of nanoparticles exsolved from an arbitrary perovskite under arbitrary reduction conditions. Considering the diversity of exsolution perovskites currently being studied, a truly general model likely does not exist. However, the model presented here suggests that general models for specific classes of materials and ranges of reducing conditions may be within reach.
A general model for Ni exsolution from fracture surfaces of SrTiO3 solid solutions could be built by extending this work. To do this, the experiments and calculations presented here should be repeated for several SrTiO3 solid solutions, perhaps with dopants and deficiency introduced onto the Sr site. In these experiments, we recommend precisely measuring the oxygen chemical potential directly above the sample rather than relying on nominal values. These measurements pose some major challenges. First, the reducing environment within the furnace is unlikely to be at steady state during the critical initial stages of reduction. Second, the atmosphere directly above the sample surface may not be in equilibrium with its surroundings, a consequence of oxygen release due to backbone reduction and exsolution, both on surfaces and within the bulk.70 Although taking these measurements will be challenging, not doing so will make it difficult to reproduce results using different experimental setups.
For the calculations, we recommend further development of robust DFT methodologies. In this work, we performed calculations on small slab models containing around 50 atoms, but, due to the small size of the slab model, our calculation of x(ΔμO) was highly approximate. We performed supplemental analyses where x(ΔμO) was derived using calculations on a larger slab in the ESI, Section S.5.† Although our results here were similar, the quantitative dependence of ΔGDFTseg and ΔGDFTred on ΔμO did change. This highlights the need to develop more accurate DFT methodologies, especially if the goal is quantitative first principles predictions of exsolution behavior.
Our results are an encouraging step towards more general exsolution models. Such models would be particularly useful when developing exsolution perovskites for complex, next-gen energy applications in which the properties of the perovskite backbone and the nanoparticles must be optimized simultaneously. The ability to perform many of these optimizations without the need to experimentally screen an larges number of material compositions and processing conditions could make exsolution materials much more competitive with conventional supported metal catalysts.
4. Conclusion
Exsolution is a promising route to active, stable ceramic-supported metal catalysts for use in conventional and up-and-coming chemical and energy conversion applications. However, implementation of exsolution materials is hindered by gaps in our understanding of the exsolution mechanism and consequent shortage of design guidelines. We confronted these challenges by studying the influence of temperature and reducing atmosphere on exsolution of Ni nanoparticles from Sr0.8La0.1Ca0.1Ti0.94Ni0.06O3−δ. After carrying out exsolution under 25 different reduction conditions, we found that exsolved nanoparticle properties were surprisingly sensitive to the reduction conditions. Furthermore, we established that low temperatures and moderate reducing conditions lead to smaller, more numerous Ni nanoparticles. We explained these findings by fitting a LaMer nucleation model to our measurements, building upon our earlier proposed exsolution mechanism in which Ni segregation and reduction of Ni-rich surfaces dictate nanoparticle density.28 This demonstrates that perovskite composition and reduction conditions influence the exsolution process through similar principles. Finally, we explored the feasibility of deriving the model's energetic parameters with DFT calculations. Overall, this work is a promising step towards general in silico design of exsolution perovskites. Further development in this area will be invaluable in guiding discovery of new, high-performance exsolution catalysts for complex applications.Author contributions
Willis O'Leary: conceptualization, experimental research, calculations and modelling, writing, and editing. Livia Giordano: computational supervision, discussion of results, and manuscript revisions. Jennifer L. M. Rupp: experimental supervision, discussion of results, and manuscript revisions.Conflicts of interest
There are no conflicts to declare.Acknowledgements
We would like to thank Prof. John Irvine for helpful discussions. This work made use of the MRSEC Shared Experimental Facilities at MIT, supported by the National Science Foundation under award number DMR-1419807. This material is based upon work supported by the US National Science Foundation Graduate Research Fellowship under grant #1122374. This work used Expanse at the San Diego Supercomputer Center through allocation TG-DMR190081 from the Advanced Cyberinfrastructure Coordination Ecosystem: Services & Support (ACCESS) program, which is supported by National Science Foundation grants #2138259, #2138286, #2138307, #2137603, and #2138296.References
- J. A. Anderson and M. F. García, Supported Metals in Catalysis, Imperial College Press, 2011, DOI: DOI:10.1142/p767.
- I. Ro, J. Resasco and P. Christopher, Approaches for Understanding and Controlling Interfacial Effects in Oxide-Supported Metal Catalysts, ACS Catal., 2018, 8(8), 7368–7387, DOI:10.1021/acscatal.8b02071.
- L. Zhang, M. Zhou, A. Wang and T. Zhang, Selective Hydrogenation over Supported Metal Catalysts: From Nanoparticles to Single Atoms, Chem. Rev., 2020, 120(2), 683–733, DOI:10.1021/acs.chemrev.9b00230.
- J. R. Rostrup-Nielsen, J.-H. B. Hansen and L. M. Aparcio, Reforming of Hydrocarbons into Synthesis Gas on Supported Metal Catalysts, J. Jpn. Pet. Inst., 1997, 40(5), 366–377, DOI:10.1627/jpi1958.40.366.
- C. A. Boasiako, Z. Zhou, X. Huo and T. Ye, Development of Pd-Based Catalysts for Hydrogenation of Nitrite and Nitrate in Water: A Review, J. Hazard. Mater., 2023, 446, 130661, DOI:10.1016/j.jhazmat.2022.130661.
- R. J. Farrauto and R. M. Heck, Catalytic Converters: State of the Art and Perspectives, Catal. Today, 1999, 51(3), 351–360, DOI:10.1016/S0920-5861(99)00024-3.
- J. Irvine, J. L. M. Rupp, G. Liu, X. Xu, S. Haile, X. Qian, A. Snyder, R. Freer, D. Ekren, S. Skinner, O. Celikbilek, S. Chen, S. Tao, T. H. Shin, R. O'Hayre, J. Huang, C. Duan, M. Papac, S. Li, V. Celorrio, A. Russell, B. Hayden, H. Nolan, X. Huang, G. Wang, I. Metcalfe, D. Neagu and S. G. Martín, Roadmap on Inorganic Perovskites for Energy Applications, J. Phys.: Energy, 2021, 3(3), 031502, DOI:10.1088/2515-7655/abff18.
- A. M. Abdalla, S. Hossain, A. T. Azad, P. M. I. Petra, F. Begum, S. G. Eriksson and A. K. Azad, Nanomaterials for Solid Oxide Fuel Cells: A Review, Renewable Sustainable Energy Rev., 2018, 82, 353–368, DOI:10.1016/j.rser.2017.09.046.
- J. Zhou, T.-H. Shin, C. Ni, G. Chen, K. Wu, Y. Cheng and J. T. S. Irvine, In Situ Growth of Nanoparticles in Layered Perovskite La0.8Sr1.2Fe0.9Co0.1O4−δ as an Active and Stable Electrode for Symmetrical Solid Oxide Fuel Cells, Chem. Mater., 2016, 28(9), 2981–2993, DOI:10.1021/acs.chemmater.6b00071.
- X. Xi, Y. Fan, J. Zhang, J.-L. Luo and X.-Z. Fu, In Situ Construction of Hetero-Structured Perovskite Composites with Exsolved Fe and Cu Metallic Nanoparticles as Efficient CO2 Reduction Electrocatalysts for High Performance Solid Oxide Electrolysis Cells, J. Mater. Chem. A, 2022, 10(5), 2509–2518, 10.1039/D1TA07678G.
- L. Wang, P. Lettenmeier, U. Golla-Schindler, P. Gazdzicki, A. N. Cañas, T. Morawietz, R. Hiesgen, S. Schwan Hosseiny, S. A. Gago and K. Andreas Friedrich, Nanostructured Ir-Supported on Ti4O7 as a Cost-Effective Anode for Proton Exchange Membrane (PEM) Electrolyzers, Phys. Chem. Chem. Phys., 2016, 18(6), 4487–4495, 10.1039/C5CP05296C.
- W. Chueh and S. Haile, Ceria as a Thermochemical Reaction Medium for Selectively Generating Syngas or Methane from H2O and CO2, ChemSusChem, 2009, 2(8), 735–739, DOI:10.1002/cssc.200900138.
- D. K. Liguras, D. I. Kondarides and X. E. Verykios, Production of Hydrogen for Fuel Cells by Steam Reforming of Ethanol over Supported Noble Metal Catalysts, Appl. Catal., B, 2003, 43(4), 345–354, DOI:10.1016/S0926-3373(02)00327-2.
- A. J. Carrillo, K. J. Kim, Z. D. Hood, A. H. Bork and J. L. Rupp, La0.6Sr0.4Cr0.8Co0.2O3 Perovskite Decorated with Exsolved Co Nanoparticles for Stable CO2 Splitting and Syngas Production, ACS Appl. Energy Mater., 2020, 3(5), 4569–4579 CrossRef CAS.
- J. M. Campelo, D. Luna, R. Luque, J. M. Marinas and A. A. Romero, Sustainable Preparation of Supported Metal Nanoparticles and Their Applications in Catalysis, ChemSusChem, 2009, 2(1), 18–45, DOI:10.1002/cssc.200800227.
- C. T. Campbell, The Energetics of Supported Metal Nanoparticles: Relationships to Sintering Rates and Catalytic Activity, Acc. Chem. Res., 2013, 46(8), 1712–1719, DOI:10.1021/ar3003514.
- M. Che and C. O. Bennett, The influence of particle size on the catalytic properties of supported metals, in Advances in Catalysis, ed. Eley D. D., Pines H. and Weisz P. B., Academic Press, 1989, vol. 36, pp. 55–172, DOI: DOI:10.1016/S0360-0564(08)60017-6.
- W. D. Nesse, Introduction to Mineralogy, Oxford University Press, 2012 Search PubMed.
- D. Neagu, V. Kyriakou, I.-L. Roiban, M. Aouine, C. Tang, A. Caravaca, K. Kousi, I. Schreur-Piet, I. S. Metcalfe, P. Vernoux, M. C. M. van de Sanden and M. N. Tsampas, In Situ Observation of Nanoparticle Exsolution from Perovskite Oxides: From Atomic Scale Mechanistic Insight to Nanostructure Tailoring, ACS Nano, 2019, 13(11), 12996–13005, DOI:10.1021/acsnano.9b05652.
- T.-S. Oh, E. K. Rahani, D. Neagu, J. T. S. Irvine, V. B. Shenoy, R. J. Gorte and J. M. Vohs, Evidence and Model for Strain-Driven Release of Metal Nanocatalysts from Perovskites during Exsolution, J. Phys. Chem. Lett., 2015, 6(24), 5106–5110, DOI:10.1021/acs.jpclett.5b02292.
- Y. Gao, J. Wang, Y.-Q. Lyu, K. Lam and F. Ciucci, In Situ Growth of Pt3Ni Nanoparticles on an A-Site Deficient Perovskite with Enhanced Activity for the Oxygen Reduction Reaction, J. Mater. Chem. A, 2017, 5(14), 6399–6404, 10.1039/C7TA00349H.
- D. Neagu, G. Tsekouras, D. N. Miller, H. Ménard and J. T. S. Irvine, In Situ Growth of Nanoparticles through Control of Non-Stoichiometry, Nat. Chem., 2013, 5(11), 916–923, DOI:10.1038/nchem.1773.
- D. Neagu, T.-S. Oh, D. N. Miller, H. Ménard, S. M. Bukhari, S. R. Gamble, R. J. Gorte, J. M. Vohs and J. T. S. Irvine, Nano-Socketed Nickel Particles with Enhanced Coking Resistance Grown in Situ by Redox Exsolution, Nat. Commun., 2015, 6, 8120, DOI:10.1038/ncomms9120.
- Y. Gao, Z. Lu, T. L. You, J. Wang, L. Xie, J. He and F. Ciucci, Energetics of Nanoparticle Exsolution from Perovskite Oxides, J. Phys. Chem. Lett., 2018, 9(13), 3772–3778, DOI:10.1021/acs.jpclett.8b01380.
- Y.-F. Sun, J.-H. Li, M.-N. Wang, B. Hua, J. Li and J.-L. Luo, A-Site Deficient Chromite Perovskite with in Situ Exsolution of Nano-Fe: A Promising Bi-Functional Catalyst Bridging the Growth of CNTs and SOFCs, J. Mater. Chem. A, 2015, 3(28), 14625–14630, 10.1039/c5ta03832d.
- Y. Sun, J. Li, Y. Zeng, B. S. Amirkhiz, M. Wang, Y. Behnamian and J. Luo, A-Site Deficient Perovskite: The Parent for in Situ Exsolution of Highly Active, Regenerable Nano-Particles as SOFC Anodes, J. Mater. Chem. A, 2015, 3(20), 11048–11056, 10.1039/c5ta01733e.
- Y. Gao, D. Chen, M. Saccoccio, Z. Lu and F. Ciucci, From Material Design to Mechanism Study: Nanoscale Ni Exsolution on a Highly Active A-Site Deficient Anode Material for Solid Oxide Fuel Cells, Nano Energy, 2016, 27, 499–508, DOI:10.1016/j.nanoen.2016.07.013.
- W. O'Leary, L. Giordano, J. Park, S. S. Nonnenmann, Y. Shao-Horn and J. L. M. Rupp, Influence of Sr-Site Deficiency, Ca/Ba/La Doping on the Exsolution of Ni from SrTiO3, J. Am. Chem. Soc., 2023, 145(25), 13768–13779, DOI:10.1021/jacs.2c12011.
- H. Han, J. Park, S. Y. Nam, K. J. Kim, G. M. Choi, S. S. P. Parkin, H. M. Jang and J. T. S. Irvine, Lattice Strain-Enhanced Exsolution of Nanoparticles in Thin Films, Nat. Commun., 2019, 10, 1471, DOI:10.1038/s41467-019-09395-4.
- J. Wang, J. Yang, A. K. Opitz, W. Bowman, R. Bliem, G. Dimitrakopoulos, A. Nenning, I. Waluyo, A. Hunt, J.-J. Gallet and B. Yildiz, Tuning Point Defects by Elastic Strain Modulates Nanoparticle Exsolution on Perovskite Oxides, Chem. Mater., 2021, 13, 5021–5034, DOI:10.1021/acs.chemmater.1c00821.
- K. Kim, B. Koo, Y.-R. Jo, S. Lee, J. K. Kim, B.-J. Kim, W. Jung and J. W. Han, Control of Transition Metal–Oxygen Bond Strength Boosts the Redox Ex-Solution in a Perovskite Oxide Surface, Energy Environ. Sci., 2020, 13(10), 3404–3411, 10.1039/D0EE01308K.
- J. Spring, E. Sediva, Z. D. Hood, J. C. Gonzalez-Rosillo, W. O'Leary, K. J. Kim, A. J. Carrillo and J. L. M. Rupp, Toward Controlling Filament Size and Location for Resistive Switches via Nanoparticle Exsolution at Oxide Interfaces, Small, 2020, 16(41), 2003224, DOI:10.1002/smll.202003224.
- S.-K. Otto, K. Kousi, D. Neagu, L. Bekris, J. Janek and I. S. Metcalfe, Exsolved Nickel Nanoparticles Acting as Oxygen Storage Reservoirs and Active Sites for Redox CH4 Conversion, ACS Appl. Energy Mater., 2019, 2(10), 7288–7298, DOI:10.1021/acsaem.9b01267.
- V. Kyriakou, D. Neagu, G. Zafeiropoulos, R. K. Sharma, C. Tang, K. Kousi, I. S. Metcalfe, M. C. M. van de Sanden and M. N. Tsampas, Symmetrical Exsolution of Rh Nanoparticles in Solid Oxide Cells for Efficient Syngas Production from Greenhouse Gases, ACS Catal., 2020, 10(2), 1278–1288, DOI:10.1021/acscatal.9b04424.
- K.-Y. Lai and A. Manthiram, Evolution of Exsolved Nanoparticles on a Perovskite Oxide Surface during a Redox Process, Chem. Mater., 2018, 30(8), 2838–2847, DOI:10.1021/acs.chemmater.8b01029.
- F. N. Agüero, A. M. Beltrán, M. A. Fernández and L. E. Cadús, Surface Nickel Particles Generated by Exsolution from a Perovskite Structure, J. Solid State Chem., 2019, 273, 75–80, DOI:10.1016/j.jssc.2019.02.036.
- S. Shah, M. Xu, X. Pan and K. L. Gilliard-Abdulaziz, Exsolution of Embedded Ni–Fe–Co Nanoparticles: Implications for Dry Reforming of Methane, ACS Appl. Nano Mater., 2021, 4(8), 8626–8636, DOI:10.1021/acsanm.1c02268.
- C. Tang, K. Kousi, D. Neagu, J. Portolés, E. I. Papaioannou and I. S. Metcalfe, Towards Efficient Use of Noble Metals via Exsolution Exemplified for CO Oxidation, Nanoscale, 2019, 11(36), 16935–16944, 10.1039/C9NR05617C.
- X. Wu, Y. Yu, Y. Chen, L. Li, Z.-F. Ma and Y.-M. Yin, Construction of Multifunctional Nanoarchitectures in One Step on a Composite Fuel Catalyst through In Situ Exsolution of La0.5Sr0.5Fe0.8Ni0.1Nb0.1O3−δ, ACS Appl. Mater. Interfaces, 2020, 12(31), 34890–34900, DOI:10.1021/acsami.0c08016.
- L. Lindenthal, J. Huber, H. Drexler, T. Ruh, R. Rameshan, F. Schrenk, S. Löffler and C. Rameshan, In Situ Growth of Exsolved Nanoparticles under Varying rWGS Reaction Conditions—A Catalysis and Near Ambient Pressure-XPS Study, Catalysts, 2021, 11(12), 1484, DOI:10.3390/catal11121484.
- J. K. Kim, Y.-R. Jo, S. Kim, B. Koo, J. H. Kim, B.-J. Kim and W. Jung, Exceptional Tunability over Size and Density of Spontaneously Formed Nanoparticles via Nucleation Dynamics, ACS Appl. Mater. Interfaces, 2020, 12(21), 24039–24047, DOI:10.1021/acsami.0c05215.
- O. Kwon, S. Sengodan, K. Kim, G. Kim, H. Y. Jeong, J. Shin, Y.-W. Ju, J. W. Han and G. Kim, Exsolution Trends and Co-Segregation Aspects of Self-Grown Catalyst Nanoparticles in Perovskites, Nat. Commun., 2017, 8, 15967, DOI:10.1038/ncomms15967.
- H. Lv, T. Liu, X. Zhang, Y. Song, H. Matsumoto, N. Ta, C. Zeng, G. Wang and X. Bao, Atomic-Scale Insight into Exsolution of CoFe Alloy Nanoparticles in La0.4Sr0.6Co0.2Fe0.7Mo0.1O3−δ with Efficient CO2 Electrolysis, Angew. Chem., Int. Ed., 2020, 59(37), 15968–15973, DOI:10.1002/anie.202006536.
- K. Kim, S. Joo, R. Huang, H. Jun Kim, G. Kim and J. Woo Han, Mechanistic Insights into the Phase Transition and Metal Ex-Solution Phenomena of Pr0.5Ba0.5 Mn0.85Co0.15O3−δ from Simple to Layered Perovskite under Reducing Conditions and Enhanced Catalytic Activity, Energy Environ. Sci., 2021, 14(2), 873–882, 10.1039/D0EE02875D.
- S. Joo, A. Seong, O. Kwon, K. Kim, J. H. Lee, R. J. Gorte, J. M. Vohs, J. W. Han and G. Kim, Highly Active Dry Methane Reforming Catalysts with Boosted in Situ Grown Ni–Fe Nanoparticles on Perovskite via Atomic Layer Deposition, Sci. Adv., 2020, 6(35), eabb1573, DOI:10.1126/sciadv.abb1573.
- Z. Tian, A. Uozumi, I. Hamada, S. Yanagisawa, H. Kizaki, K. Inagaki and Y. Morikawa, First-Principles Investigation on the Segregation of Pd at LaFe1−xPdxO3−y Surfaces, Nanoscale Res. Lett., 2013, 8(1), 203, DOI:10.1186/1556-276X-8-203.
- Y. Wang, X. Lei, Y. Zhang, F. Chen and T. Liu, In-Situ Growth of Metallic Nanoparticles on Perovskite Parent as a Hydrogen Electrode for Solid Oxide Cells, J. Power Sources, 2018, 405, 114–123, DOI:10.1016/j.jpowsour.2018.10.023.
- I. Hamada, A. Uozumi, Y. Morikawa, A. Yanase and H. Katayama-Yoshida, A Density Functional Theory Study of Self-Regenerating Catalysts LaFe1−xMxO3−y (M = Pd, Rh, Pt), J. Am. Chem. Soc., 2011, 133(46), 18506–18509, DOI:10.1021/ja110302t.
- X. Guo, L. Yao, X. Hou, X. Wu, Y. Zhang, Q. Zhu, Z. Guo, S. Li, Y. Jiang, S. Feng and K. Huang, An Exsolution Constructed FeNi/NiFe2O4 Composite: Preferential Breaking of Octahedral Metal–Oxygen Bonds in a Spinel Oxide, Chem. Sci., 2022, 13(32), 9440–9449, 10.1039/D2SC02149H.
- K. Gömann, G. Borchardt, M. Schulz, A. Gömann, W. Maus-Friedrichs, B. Lesage, O. Kaïtasov, S. Hoffmann-Eifert and T. Schneller, Sr Diffusion in Undoped and La-Doped SrTiO3 Single Crystals under Oxidizing Conditions, Phys. Chem. Chem. Phys., 2005, 7(9), 2053–2060, 10.1039/B418824A.
- G.-F. Zhang, H. Liu, Z. Yao, M. Cao and H. Hao, Effects of Ca Doping on the Energy Storage Properties of (Sr,Ca)TiO3 Paraelectric Ceramics, J. Mater. Sci.: Mater. Electron., 2015, 26(5), 2726–2732, DOI:10.1007/s10854-015-2749-1.
- J. Schindelin, I. Arganda-Carreras, E. Frise, V. Kaynig, M. Longair, T. Pietzsch, S. Preibisch, C. Rueden, S. Saalfeld, B. Schmid, J.-Y. Tinevez, D. J. White, V. Hartenstein, K. Eliceiri, P. Tomancak and A. Cardona, Fiji: An Open-Source Platform for Biological-Image Analysis, Nat. Methods, 2012, 9(7), 676–682, DOI:10.1038/nmeth.2019.
- C. A. Schneider, W. S. Rasband and K. W. Eliceiri, NIH Image to ImageJ: 25 Years of Image Analysis, Nat. Methods, 2012, 9(7), 671–675, DOI:10.1038/nmeth.2089.
- J. P. Perdew, K. Burke and M. Ernzerhof, Generalized Gradient Approximation Made Simple, Phys. Rev. Lett., 1996, 77(18), 3865–3868, DOI:10.1103/physrevlett.77.3865.
- G. Kresse and J. Furthmüller, Efficiency of Ab Initio Total Energy Calculations for Metals and Semiconductors Using a Plane-Wave Basis Set, Comput. Mater. Sci., 1996, 6(1), 15–50, DOI:10.1016/0927-0256(96)00008-0.
- G. Kresse and J. Hafner, Ab Initiomolecular Dynamics for Liquid Metals, Phys. Rev. B: Condens. Matter Mater. Phys., 1993, 47(1), 558–561, DOI:10.1103/physrevb.47.558.
- G. Kresse and J. Hafner, Ab Initiomolecular-Dynamics Simulation of the Liquid–Metal–Amorphous-Semiconductor Transition in Germanium, Phys. Rev. B: Condens. Matter Mater. Phys., 1994, 49(20), 14251–14269, DOI:10.1103/physrevb.49.14251.
- G. Kresse and D. Joubert, From Ultrasoft Pseudopotentials to the Projector Augmented-Wave Method, Phys. Rev. B: Condens. Matter Mater. Phys., 1999, 59(3), 1758–1775, DOI:10.1103/physrevb.59.1758.
- P. E. Blöchl, Projector Augmented-Wave Method, Phys. Rev. B: Condens. Matter Mater. Phys., 1994, 50(24), 17953–17979, DOI:10.1103/physrevb.50.17953.
- S. L. Dudarev, G. A. Botton, S. Y. Savrasov, C. J. Humphreys and A. P. Sutton, Electron-Energy-Loss Spectra and the Structural Stability of Nickel Oxide: An LSDA+U Study, Phys. Rev. B: Condens. Matter Mater. Phys., 1998, 57(3), 1505–1509, DOI:10.1103/physrevb.57.1505.
- S. Grimme, S. Ehrlich and L. Goerigk, Effect of the Damping Function in Dispersion Corrected Density Functional Theory, J. Comput. Chem., 2011, 32(7), 1456–1465, DOI:10.1002/jcc.21759.
- A. M. Glazer, Simple Ways of Determining Perovskite Structures, Acta Crystallogr., Sect. A, 1975, 31(6), 756–762, DOI:10.1107/S0567739475001635.
- J. J. Mecholsky, Fractography of Ceramic and Metal Failures, ASTM International, 1984 Search PubMed.
- D. Neagu, G. Tsekouras, D. N. Miller, H. Ménard and J. T. S. Irvine, In Situ Growth of Nanoparticles through Control of Non-Stoichiometry, Nat. Chem., 2013, 5(11), 916–923, DOI:10.1038/nchem.1773.
- T. Sugimoto, F. Shiba, T. Sekiguchi and H. Itoh, Spontaneous Nucleation of Monodisperse Silver Halide Particles from Homogeneous Gelatin Solution I: Silver Chloride, Colloids Surf., A, 2000, 164(2), 183–203, DOI:10.1016/S0927-7757(99)00366-0.
- V. K. LaMer and R. H. Dinegar, Theory, Production and Mechanism of Formation of Monodispersed Hydrosols, J. Am. Chem. Soc., 1950, 72(11), 4847–4854 CrossRef CAS.
- H. Lv, L. Lin, X. Zhang, Y. Song, H. Matsumoto, C. Zeng, N. Ta, W. Liu, D. Gao, G. Wang and X. Bao, In Situ Investigation of Reversible Exsolution/Dissolution of CoFe Alloy Nanoparticles in a Co-Doped Sr2Fe1.5Mo0.5O6−δ Cathode for CO2 Electrolysis, Adv. Mater., 2020, 32(6), 1906193, DOI:10.1002/adma.201906193.
- Y.-F. Sun, Y.-Q. Zhang, J. Chen, J.-H. Li, Y.-T. Zhu, Y.-M. Zeng, B. S. Amirkhiz, J. Li, B. Hua and J.-L. Luo, New Opportunity for in Situ Exsolution of Metallic Nanoparticles on Perovskite Parent, Nano Lett., 2016, 16(8), 5303–5309, DOI:10.1021/acs.nanolett.6b02757.
- H. Lv, L. Lin, X. Zhang, R. Li, Y. Song, H. Matsumoto, N. Ta, C. Zeng, Q. Fu, G. Wang and X. Bao, Promoting Exsolution of RuFe Alloy Nanoparticles on Sr2Fe1.4Ru0.1Mo0.5O6−δ via Repeated Redox Manipulations for CO2 Electrolysis, Nat. Commun., 2021, 12(1), 5665, DOI:10.1038/s41467-021-26001-8.
- K. Kousi, D. Neagu, L. Bekris, E. I. Papaioannou and I. S. Metcalfe, Endogenous Nanoparticles Strain Perovskite Host Lattice Providing Oxygen Capacity and Driving Oxygen Exchange and CH4 Conversion to Syngas, Angew. Chem., Int. Ed., 2020, 59(6), 2510–2519, DOI:10.1002/anie.201915140.
Footnote |
| † Electronic supplementary information (ESI) available. See DOI: https://doi.org/10.1039/d3ta04817a |
| This journal is © The Royal Society of Chemistry 2023 |