DOI:
10.1039/D3TA04553F
(Paper)
J. Mater. Chem. A, 2023,
11, 20559-20567
Delivering low-energy carbon capture with photo-responsive hypercrosslinked polymers derived from polystyrene waste†
Received
31st July 2023
, Accepted 11th September 2023
First published on 14th September 2023
Abstract
Highly effective but energy-intensive techniques such as temperature and pressure swing adsorption are typically deployed to regenerate adsorbents used in carbon capture. Here we show that the energy consumption and costs associated with adsorbent regeneration can be reduced by 500-fold when photo-responsive hypercrosslinked polymers (HCPs) recycled from waste expanded polystyrene that are loaded with 8.9 wt% of azobenzene are deployed for carbon capture. Our approach uses UV light (365 nm) to enhance the adsorption of CO2 from a variety of mixed gas concentrations with CO2 content between 1–40 v/v%. 14% of CO2 adsorbed on HCPs@Azo can be desorbed by irradiation with visible light. The photo-regeneration efficiency of adsorption and desorption capacities of HCPs@Azo stabilised at 50% after 5 cycles, demonstrating good reusability. The low energy footprints and synthesis and operating costs of our photo-responsive HCPs@Azo can potentially reduce carbon capture costs and establish a green carbon capture process driven by light.
Introduction
The combustion of fossil fuels contributes to over 80% of the total energy produced in the world and releases 3 × 10¹³ kg of CO2 every year,1 accounting for 91% of anthropogenic CO2 emissions.2 Despite the transition into green energy, fossil fuel combustion is still expected to contribute to energy production for the next few decades.3 To realise the target of reducing 40% of CO2 emissions in Europe by 2030 and achieving a net-zero greenhouse gas emission economy by 2050,4 it is imperative that carbon capture is energy-efficient and cost-effective.
Legacy carbon capture technologies are highly effective for reducing up to 90% of CO2 emissions from power plants that produce energy via fossil fuel combustion.5 Carbon capture in power plants can be achieved through pre-, post-, and oxy fuel combustion approaches. In pre- and post-combustion, CO2 is captured prior and after completion of the combustion process, respectively, while in oxy-fuel combustion capture, CO2 flow is purified and condensed with other flue gases.6 Amine-based absorption, a chemical capture process,7,8 is the incumbent technology deployed for post-combustion carbon capture in power plants.9 However, amine absorption is costly and energy-intensive due to regeneration requirements and corrosive nature of amines and can lead to environmental pollution when end-of-life amines are disposed.10
Physical processes like membrane technology11–14 and adsorption15,16 have also been explored for post-combustion capture. Compared to membrane separation, the advantages of adsorption by solid adsorbents include good stability, high reusability, flexibility, and comparatively lower costs than absorption.17 CO2 adsorption in adsorbents is dependent on the electronic attraction between CO2 molecules and adsorbent surfaces.18 Examples of such materials include activated carbons,19 zeolites,20 metal–organic frameworks (MOFs)21 and hypercrosslinked polymers (HCPs).22 Likewise amine regeneration, regenerating these microporous adsorbents via traditional methods of temperature swing, pressure swing or vacuum swing is energy-intensive and costly.23 For example, the operating costs of traditional carbon capture processes that rely on amine absorption or adsorption with zeolites cost around US$50 per ton of CO2.24,25 MOFs are regenerated at 120 °C–200 °C for at least 8 hours;26 regeneration of activated carbon requires a vacuum to desorb CO2 molecules;27 regenerating HCPs require a temperature of 80 °C and vacuum pressure of 0.1 bar for 4 hours.28 The energy consumption and cost of regenerating adsorbents can be potentially reduced with using renewable energy such as light to drive desorption (Fig. 1). The cost of carbon capture could be potentially reduced by >90% with light-induced swing adsorption processes as per the costs savings observed in light-controlled desalination.29
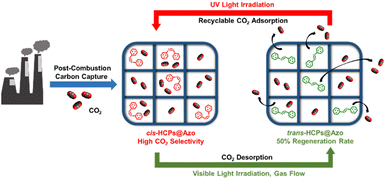 |
| | Fig. 1 Our approach of exploiting photo-isomerisation of azobenzene molecules embedded in pores of HCPs to drive adsorption (upon UV irradiation) and desorption (vis-irradiation) of CO2 to enable low-energy, low-cost carbon capture. | |
Different light wavelengths can be exploited to change the inherent physical or chemical properties of microporous solid adsorbents to trigger CO2 adsorption or desorption.30 For example, the CO2 adsorption capacities of photo-responsive MOFs of PCN-123 and T(7.5)/U-azo were reduced by 53.9% and 31.4%, respectively, upon UV-irradiation. This was attributed to blocking CO2 access to adsorption sites (metal cluster and amine) by the trans–cis conformation change of pendant azobenzene groups.31,32 Conversely, the positive dipole moment (3.0 D) of cis-azobenzene triggered by UV irradiation could be exploited to increase the uptake capacity of CO2 in porous organic polymer adsorbents.33 Photo-irradiation of such adsorbents can also tailor and control desorption. For example, 42% of the CO2 adsorbed in light-responsive MOFs Zn(AzDC)(4,4′-BPE)0.5 were desorbed through photo-reversible changes in MOF structures that were induced by cis–trans photoisomerization of azobenzene-based ligands.23 Vis-irradiation (400–500 nm visible light) of Ag/UiO-66 MOFs at 0.99 bar led to the desorption of 88.2% of CO2 as Ag converted light energy to thermal energy that aided desorption.34 Meanwhile, photo-irradiation of porous aromatic frameworks comprising diarylethene photo-switches, with 200–500 nm unfiltered light, weakened CO2-adsorbent interactions,35 desorbing up to 26% of adsorbed CO2 within 4 minutes.36 Although these works demonstrate the potential of photo-modulated carbon capture and adsorbent regeneration, the cost and operation of photo-sensitive adsorbents for such applications have not been evaluated in comparison with traditional regeneration methods (thermal and vacuum) and studied with gas mixtures representative of post-combustion flue gas compositions.
Herein we deployed photo-responsive HCPs loaded with 8.9 wt% azobenzene (HCPs@Azo) that were developed in our previous work37 in simulated post-combustion flue gas mixtures (CO2 4–20 v/v% in N2) to address this knowledge gap. Upon UV-irradiation, the azobenzene molecules incorporated within HCP pores undergo a photo-reversible trans–cis isomerization caused by n–π* and π–π* excitations,38 leading to changes in physical dimensions and dipole moment, from 9 Å (trans) to 5.5 Å (cis),39 and 0 D (trans) to 3.0 D (cis),40 respectively. Here we observed that these UV-triggered photo-reversible changes enhanced the CO2 adsorption capacity of HCPs@Azo by 48%, from 1 mmol g−1 to 1.48 mmol g−1. This was 17% higher than that of pristine HCPs (1.26 mmol g−1). In a gas mixture comprising 20 v/v% CO2, CO2 adsorption capacity and CO2/N2 selectivity of cis-HCPs@Azo were concomitantly improved by 12% and 76%, respectively, compared to those of HCPs, reaching 0.67 mmol g−1 and 31.6 mmol g−1. 14% of the CO2 adsorbed on these adsorbents were desorbed upon vis-irradiation, demonstrating the feasibility of light-controlled carbon capture and regeneration in simulated flue gas conditions. In addition, the photo-modulated adsorption and desorption capacities stabilised after 5 cycles of application. The use of light to recover the adsorption capacities of HCPs@Azo was only 50% as effective as traditional temperature and vacuum swing methods, but the total cost of our approach was only one-five-hundredth of the cost of these legacy methods.
Experimental section
Materials
All solvents, reagents and chemicals were purchased from Alfa Aesar, Sigma-Aldrich and Fisher Chemical without any purification before using. Iron chloride (FeCl3) and 1,2-dichloroethane (DCE) were obtained from Alfa Aesar. Azobenzene and formaldehyde dimethyl acetal (FDA) were purchased from Sigma-Aldrich. Methanol, ethanol, chloroform and acetone were received from Fisher Chemical. Waste expanded polystyrene (tradename: Styrofoam) was collected from discarded packaging supplies around The University of Edinburgh and used as is.
Synthesis of photo-sensitive HCPs
HCPs were first synthesized using the protocol developed in our group,41 where the reactants mass ratio were maintained at 1![[thin space (1/6-em)]](https://www.rsc.org/images/entities/char_2009.gif) :5:5. 1 g Styrofoam was added into a 100 mL flask and dissolved by 50 mL of DCE. 5 g FeCl3 (catalyst) and 5 g FDA (external crosslinker) were added into above mixture, and the new mixture was stirred and refluxed for 24 hours with 80 °C and 270 rpm stirring. The HCPs were synthesised via Friedel–Crafts alkylation reactions. The product was collected by vacuum suction filtration, and washed by chloroform, methanol, acetone, and deionized water for 3 times respectively. The washed solid was dried in a vacuum oven at 120 °C for 12 hours to obtain brown HCPs powder.
:5:5. 1 g Styrofoam was added into a 100 mL flask and dissolved by 50 mL of DCE. 5 g FeCl3 (catalyst) and 5 g FDA (external crosslinker) were added into above mixture, and the new mixture was stirred and refluxed for 24 hours with 80 °C and 270 rpm stirring. The HCPs were synthesised via Friedel–Crafts alkylation reactions. The product was collected by vacuum suction filtration, and washed by chloroform, methanol, acetone, and deionized water for 3 times respectively. The washed solid was dried in a vacuum oven at 120 °C for 12 hours to obtain brown HCPs powder.
HCPs@Azo were fabricated using our previously reported protocol.37 Briefly, 500 mg azobenzene was dissolved in 20 mL of ethanol. 200 mg of HCPs were steeped into the azobenzene ethanolic solution for 12 hours to reach equilibrium. To remove azobenzene molecules that were adsorbed on the surface of HCPs, the brown product was washed with ethanol for 10 seconds and dried at room temperature for 12 hours to yield HCPs@Azo.
Experimental configuration for adsorption and desorption
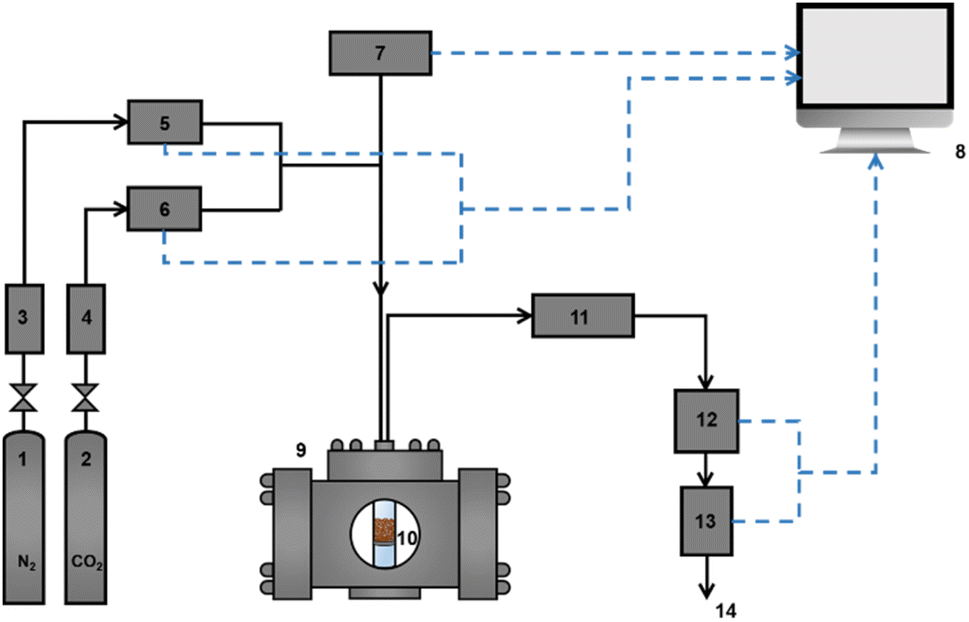
Dynamic adsorption and photo-modulated desorption measurements for HCPs and HCPs@Azo were taken at room temperature (25 °C) and atmospheric pressure. These measurements were taken using a laboratory-scale self-made fixed-bed apparatus (Fig. 2). A self-programmed Labview data collection software was utilised to record the monitored variables (temperature, flow rate, humidity, and CO2 concentration) every second from the beginning of the adsorption experiment. Desorption of CO2 from adsorbents were performed immediately after adsorption using visible light irradiation (brand: ZLUV LAMP, power: 6 W) in the same quartz container (Fig. S1†).
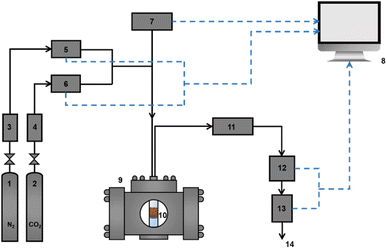 |
| | Fig. 2 Experimental configuration for adsorption: (1) N2 gas cylinder and regular, (2) CO2 gas cylinder and regular, (3) zeolite/silica drying column of N2 gas, (4) zeolite/silica drying column of CO2 gas, (5) mass flow controller of N2 (Brooks Instruments GF-Series, range: 0–400 mL min−1), (6) mass flow controller of CO2 (Brooks Instruments GF-Series, range: 0–100 mL min−1), (7) fibre-optic temperature sensor and signal conditioner, (8) data analysis workstation, (9) metal retainer, (10) quartz container (12 mm inner diameter, 1 mm wall thickness), (11) water condenser, (12) non-dispersive infrared CO2 sensor (COZIR-W-100, calibration range: 0–70% v/v), (13) mass flow meter (Brooks Instruments SLA5860, range: 0–500 mL min−1), and (14) gas exit. | |
Photo-modulated gas adsorption experiments
Dry gas mixtures comprising 0 to 100 v/v% of CO2 in N2 were allowed to flow in an empty quartz container under test gas flow rates. The humidity sensor indicated undetectable moisture levels. Data from these experiments was plotted as a concentration curve for subsequent determination of adsorbed CO2 quantities.
500 mg HCPs and 1 g HCPs@Azo were used here for gas adsorption experiments. First, 500 mg of HCPs@Azo were irradiated with 450 nm visible light for 1 hour to ensure that all azobenzene molecules in HCPs@Azo were in the trans state. The other 500 mg of HCPs@Azo were irradiated with 365 nm UV light (brand: ZLUV LAMP, power: 6 W, light intensity: 610 mW cm−2) to yield cis-HCPs@Azo. HCPs, trans-HCPs@Azo and cis-HCPs@Azo were loaded into the quartz container respectively, and the container was fixed in the metal retainer. Gas was introduced at the top of the container through a small quartz container. All gas lines were swept with N2 before and between experiments. The gas flow rates for pure CO2 and pure N2 adsorption test were maintained at 10 mL min−1, regulated with two calibrated mass flow controllers.
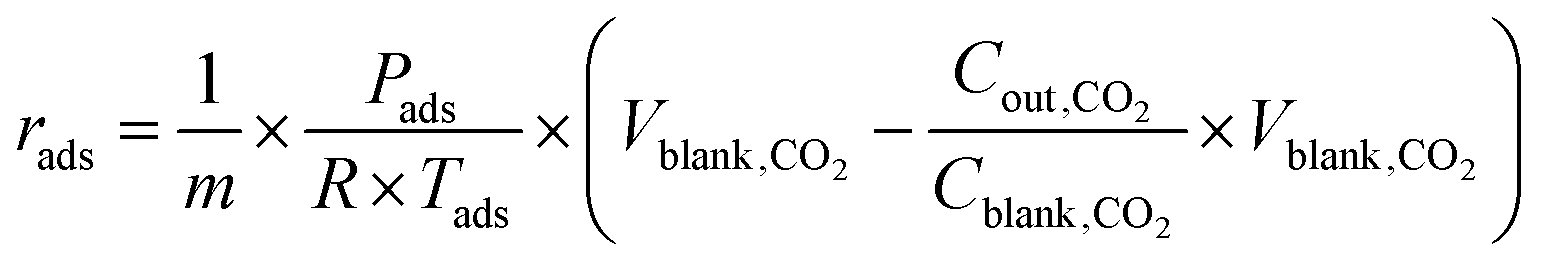
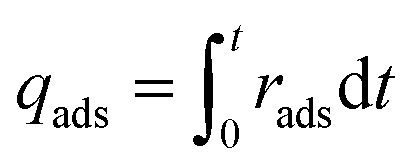
For mixed gas adsorption experiments, CO2 concentration in the inflow gas was varied by adjusting the input ratio of N2 and CO2 at fixed flow rates of 20 mL min−1. For a mixed gas comprising 1 v/v% CO2, the total rate flow of gases was 100 mL min−1. The adsorption rate (rads, mmol g−1 s−1) and capacity (qads, mmol g−1) were calculated according to the following equations:
| |  | (1) |
| |  | (2) |
where
Cblank,CO2 (mg L
−1 s
−1) and
Vblank,CO2 (mL s
−1) are the concentration and volume of CO
2 of blank experiment,
Cout,CO2 (mg L
−1 s
−1) is the concentration of CO
2 at outlet of the experiment system,
Tads (K) and
Pads (kPa) are the temperature and pressure of adsorption process,
R is the gas constant (8.314 J mol
−1 K
−1),
m (g) is the mass of adsorbents,
t (s) is the duration of adsorption.
Desorption experiments
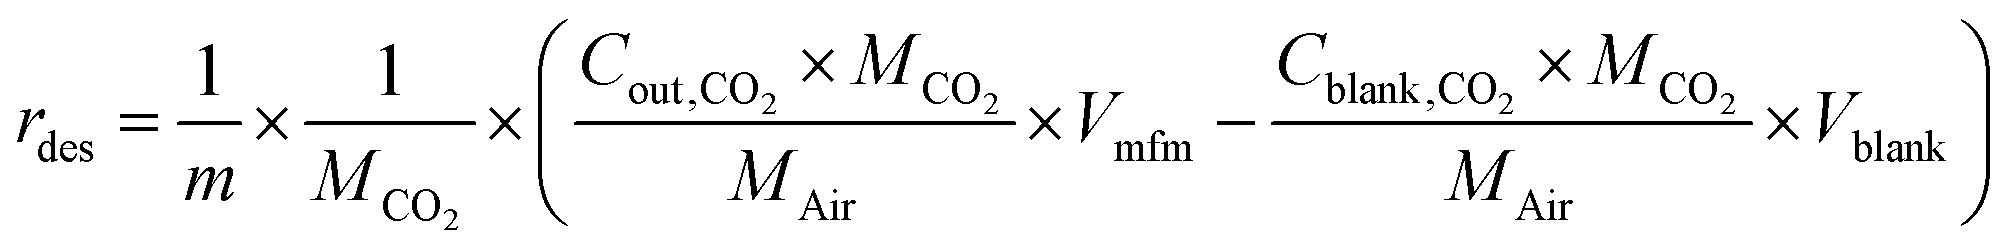
HCPs, trans-HCPs@Azo and cis-HCPs@Azo that were used to adsorb CO2 from pure CO2 gas in adsorption experiments were collected, weighed, and used in desorption experiments. At the start of desorption experiments, pure N2 gas (flow rate of 20 mL min−1) was used to purge possible residual CO2 in the gas line, and as sweep gas throughout this experiment. Here we performed these experiments with two sets of conditions – one without visible light irradiation where CO2-loaded adsorbents were loaded directly into the quartz container and the sweep gas of N2 was used to facilitate desorption, while in another set of experiments, visible light irradiation (450 nm wavelength) was used to trigger desorption. In the latter set of experiments, after loading adsorbents into the quartz container, N2 sweep gas was introduced alongside vis-irradiation simultaneously. The desorption rate (rdes, mmol g−1 s−1) and desorption capacity (qdes, mmol g−1) were calculated using these equations:| |  | (3) |
| |  | (4) |
where Cblank,CO2 and Cout,CO2 (mg L−1 s−1) are the concentrations of CO2 of blank experiment and the outlet after desorption, Vblank (mL s−1) and Vmfm (mL s−1) are the volumes of total volume of gas before and after desorption process, MCO2 and MAir are the relative molecular mass of CO2 and air, m (g) is the mass of spent adsorbents, t (s) is the duration of desorption.
Photo-modulated cyclic adsorption and desorption
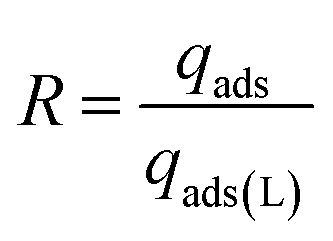
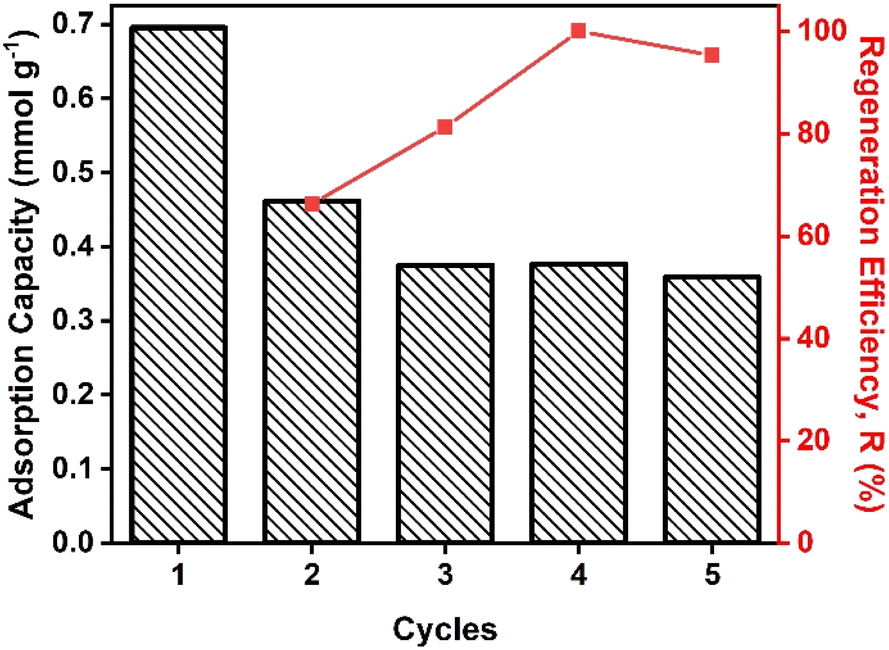
These experiments were performed using a simulated flue gas mixture with 20 v/v% CO2. 500 mg of HCPs@Azo was first UV-irradiated for 1 hour and the resultant cis-HCPs@Azo samples were used to adsorb CO2. After adsorption, the CO2-loaded cis- HCPs@Azo adsorbents were vis-irradiated for 1 hour, under continuous N2 flow. Subsequently, the regenerated trans-HCPs@Azo adsorbents were irradiated with UV light again for the next adsorption cycle. The above adsorption-regeneration cycling was repeated 5 times to study the reusability of HCPs@Azo. The regeneration efficiency (R) of HCPs@Azo was evaluated by the following equation:| |  | (5) |
where qads (mmol g−1) and qads(L) (mmol g−1) are the adsorption capacities of HCPs@Azo prior and after desorption, respectively.
Results and discussion
CO2 adsorption capacity and CO2/N2 selectivity
We previously showed that the photo-responses of azobenzene molecules embedded within HCP pores could be exploited to enhance and reduce CO2 uptake as a function of photo-irradiation wavelength.31 The CO2 uptake (determined using pure CO2 at 273 K and 1 bar) of HCPs, cis-HCPs@Azo and trans-HCPs@Azo reached 2.08 mmol g−1, 2.54 mmol g−1 and 1.48 mmol g−1, respectively. This could be ascribed to an increment in BET specific surface areas and a positive dipole moment that are associated with the trans–cis isomerization of azobenzene from 9 Å to 5.5 Å. The BET surface area of cis-HCPs@Azo reached 1024 m2 g−1, 19% higher than the BET specific surface area of trans-HCPs@Azo (862 m2 g−1). In addition, computational simulations showed that the 22% increase in CO2 uptake of cis-HCPs@Azo from pristine HCPs was due to dipole–quadrupole interactions between UV irradiated cis state azobenzene molecules (3.0 D) and CO2 molecules (−13.4 ± 0.4 × 10−40 cm2).42 These mechanisms were also responsible for the trends observed here when CO2 adsorption capacities were determined using a breakthrough rig at room temperature (298 K) and atmospheric pressure with a pure CO2 flow rate of 10 mL min−1 over 600 seconds (Fig. 3). The CO2 adsorption capacity of cis-HCPs@Azo reached 1.48 mmol g−1, 48% and 17% higher than those of trans-HCPs@Azo (1 mmol g−1) and HCPs (1.26 mmol g−1), respectively.
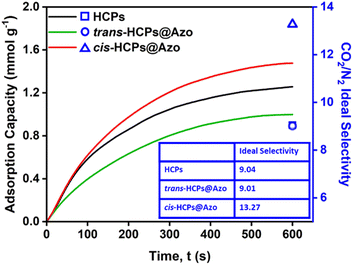 |
| | Fig. 3 CO2 adsorption profiles of (black) HCPs, (green) visible light irradiated trans-HCPs@Azo and (red) UV light irradiated cis-HCPs@Azo using a flow rate of 10 mL min−1, pure CO2 gas, at room temperature and atmosphere pressure. CO2/N2 ideal selectivities of HCPs, trans-HCPs@Azo and cis-HCPs@Azo were obtained using CO2 and N2 pure gas adsorption capacities after 600 s (Table S2†).43,44 | |
The N2 adsorption capacities of HCPs, cis-HCPs@Azo and trans-HCPs@Azo were also determined using pure N2 gas with a flow rate of 10 mL min−1 at room temperature and atmospheric pressure (Table S2†). We used this data to calculate the ideal CO2/N2 selectivity using Equation in Table S2†43,44 (Fig. 3). Similar to other microporous adsorbents,45,46 the CO2 adsorption capacities of all HCP types studied here in this work were higher than those of N2. The CO2/N2 selectivity of both pristine HCPs and trans-HCPs@Azo were similar, reaching a value of 9 while the CO2/N2 selectivity of cis-HCPs@Azo was 47% higher, reaching a value of 13.3. In addition to a 3.0 D dipole moment that enhanced dipole–quadrupole interactions with CO2 molecules,41cis state azobenzene molecules in cis-HCPs@Azo could contribute to additional van der Waals forces47 that consequently attracted more CO2 than N2 molecules. With higher CO2 adsorption capacity and CO2/N2 selectivity, cis-HCPs@Azo studied here were better adsorbents for carbon capture than pristine HCPs.
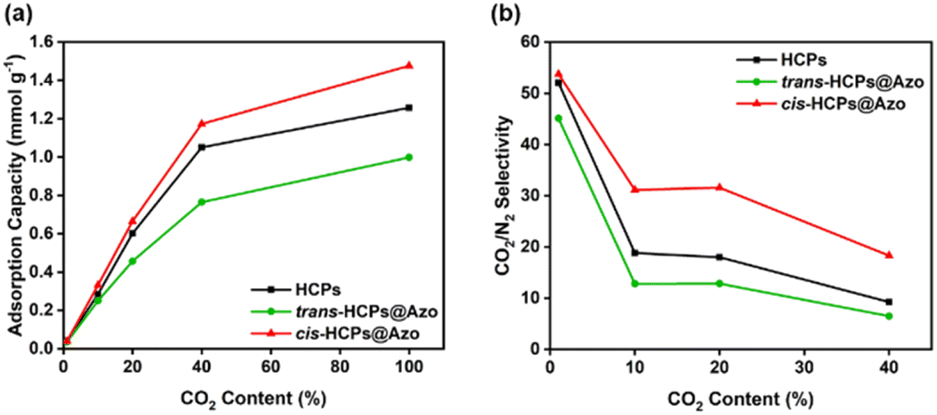
The mixed gas adsorption capacities and CO2/N2 selectivities of all HCP types studied here in this work were determined using CO2/N2 gas mixtures comprising 1 v/v% of CO2 (for minimising the risk of headaches48), 10 v/v% and 20 v/v% of CO2 to simulate post-combustion flue gas streams,49 and 40 v/v% of CO2 to simulate high CO2 content environments (Fig. S3†). As shown in Fig. 4a, the adsorption capacities of all three adsorbents studied here increased rapidly when CO2 content was between 1–40 v/v%. At 1 v/v% CO2, the CO2 adsorption capacities of pristine HCPs, cis-HCPs@Azo and trans-HCPs@Azo were identical. As CO2 concentration increased, the adsorption capacities of cis-HCPs@Azo were higher those that of pristine HCPs and trans-HCPs@Azo. For example, at 20 v/v% CO2, the adsorption capacity of cis-HCPs@Azo (0.67 mmol g−1) was 12% and 46% higher those that of pristine HCPs (0.6 mmol g−1) and trans-HCPs@Azo (0.46 mmol g−1), respectively. Beyond 40 v/v% CO2, the increment rates in CO2 adsorption capacities were less pronounced, possibly due to saturated adsorption sites. The mixed gas adsorption capacities of these adsorbents were lower than those obtained from pure gases. This could be attributed to lower CO2 content in gas mixtures and competitive sorption.50
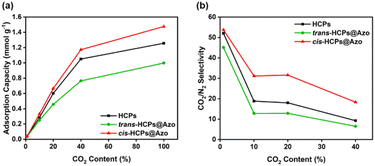 |
| | Fig. 4 (a) CO2 adsorption capacities and (b) mixed gas CO2/N2 selectivities (Table S3†)51,52 of (black) HCPs, (green) trans-HCPs@Azo and (red) cis-HCPs@Azo at different CO2 concentration of 1 v/v%, 10 v/v%, 20 v/v%, 40 v/v% and 100 v/v% at room temperature (25 °C) and atmosphere pressure (1 bar). | |
Competitive sorption between CO2 and N2 gas molecules was also why the mixed gas selectivities of HCPs, cis-HCPs@Azo and trans-HCPs@Azo at 1–20 v/v% CO2 (determined from mole fraction of CO2 and N2 in gas feed and output (Table S3†)51,52) were 476–99%, 305–138% and 400–43% higher than their ideal CO2/N2 selectivities (Fig. 4b). As CO2 concentration increased to 40 v/v%, the mixed gas CO2/N2 selectivity of only cis-HCPs@Azo was higher than its ideal selectivity. This was most probably due to the synergistic effects of both dipole–quadrupole interactions and competitive sorption. At 10 v/v% and 20 v/v% CO2, i.e., simulated flue gas concentrations, the mixed gas CO2/N2 selectivity of pristine HCPs studied in this work were similar to the CO2/N2 selectivity of similar HCPs that were determined using the ideal adsorbed selectivity theory (IAST).41 We also observed that the mixed gas CO2/N2 selectivity of HCPs, cis-HCPs@Azo and trans-HCPs@Azo decreased as CO2 concentration in the feed gas increased from 1 to 40 v/v%. This was because more CO2 molecules were left in the feed as saturated CO2 adsorption sites limited further uptake.53 Amongst all adsorbents studied here, cis-HCPs@Azo are potentially suited for post-combustion carbon capture. This was because, at 20 v/v% CO2, the CO2/N2 selectivity of cis-HCPs@Azo reached 31.6, which was 145% and 76% higher than that of trans-HCPs@Azo (12.9) and pristine HCPs (18).
Kinetics of photo-modulated gas adsorption
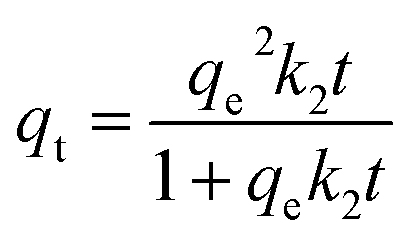
Three kinetic models – pseudo-first order, pseudo-second order and Avrami's fractional order (Fig. S4†) were deployed here to reveal the gas-adsorbent interactions and adsorption rate behaviour54 of all adsorbents studied in this work. The pseudo-first order model55 assumes that the adsorption rate is proportional to the number of free adsorption sites56 and is typically used to explain the physical adsorption process57via the following equation:where qt (mmol g−1) and qe (mmol g−1) are the amounts of adsorbed CO2 per unit of adsorbents at any time, t (s) and at equilibrium, k1 (s−1) is the rate constant of Pseudo-first order model. The pseudo-second order model58 assumes that the adsorption process is most likely controlled by chemical adsorption59 and can be expressed as:| |  | (7) |
where k2 (g mmol−1 s−1) is the rate constant of Pseudo-second order process. Avrami's fractional order model describes the process of random nucleation and subsequent growth.60 This kinetic model assumes the adsorption process is a complex process including physical and chemical adsorption61 and can be described with the following equation: | | | qt = qe(1 − e−(kAt)nA) | (8) |
where kA (s−1) is the Avrami kinetic model constant, nA is the kinetic order of the Avrami model. nA is the Avrami exponent which is a fractionary number to reflect the possible change of mechanism during adsorption.62 The term nA expresses the dimensionality of growth of adsorption sites, where nA = 2 represents one-dimensional growth, nA = 3 is for two-dimensional growth, nA = 4 is for three-dimensional growth.54 It is important to note that with a homogenous adsorption process, the probability of adsorption is identical at any region for any fixed time interval, nA = 1.54
Here, the CO2 experimental adsorption data of HCPs, cis-HCPs@Azo and trans-HCPs@Azo fit better with Avrami's fractional order model where the correlation coefficient (R2) was the highest (Table 1). This indicated that CO2 adsorption process in these adsorbents demonstrated both physical and chemical behaviours.63 With Avrami exponent (nA) values between 0.9–1, adsorption in all three adsorbents studied here could be described as a homogenous and physical adsorption process. We also observed that the experimental CO2 adsorption data could fit better with the pseudo-first order model than the pseudo-second order model, particularly for cis-HCPs@Azo. This meant that physical adsorption was more prevalent than chemical adsorption in cis-HCPs@Azo than pristine HCPs and trans-HCPs@Azo. This was most likely due to the additional van der Waals forces associated with dipole–quadrupole interactions between CO2 and cis-state azobenzene molecules. Although the rate constants k1 and kA of cis-HCPs@Azo were larger than those of trans-HCPs@Azo, they remained smaller than that of pristine HCPs. This indicated that the CO2 affinity of cis state azobenzene molecules could enhance adsorption rates, but could not offset adsorption rate losses associated with the loss in accessible pore volume due to the presence of azobenzene molecules in HCP pores.
Table 1 Parameters of pseudo-first order, pseudo-second order and Avrami's fractional order kinetic models for pure CO2 adsorption of HCPs, trans-HCPs@Azo and cis-HCPs@Azo with 10 mL min−1 gas flow rate at room temperature and atmosphere pressure
| Kinetic models |
Pseudo-first order |
Pseudo-second order |
Avrami's fractional order |
|
|
q
e,exp mmol g−1 |
q
e,cal mmol g−1 |
k
1 s−1 |
R
2
|
q
e,cal mmol g−1 |
k
2 g mmol−1 s−1 |
R
2
|
q
e,cal mmol g−1 |
k
A s−1 |
n
|
R
2
|
| HCPs |
1.257 |
1.29 |
0.00565 |
0.9987 |
1.691 |
0.00309 |
0.9982 |
1.317 |
0.00542 |
0.9474 |
0.9991 |
|
trans-HCPs@Azo |
0.998 |
1.09 |
0.00444 |
0.9993 |
1.5 |
0.00246 |
0.9979 |
1.102 |
0.00433 |
0.9765 |
0.9994 |
|
cis-HCPs@Azo |
1.476 |
1.567 |
0.00491 |
0.9998 |
2.121 |
0.002 |
0.9979 |
1.57 |
0.00489 |
0.9956 |
0.9998 |
Photo-modulated CO2 desorption
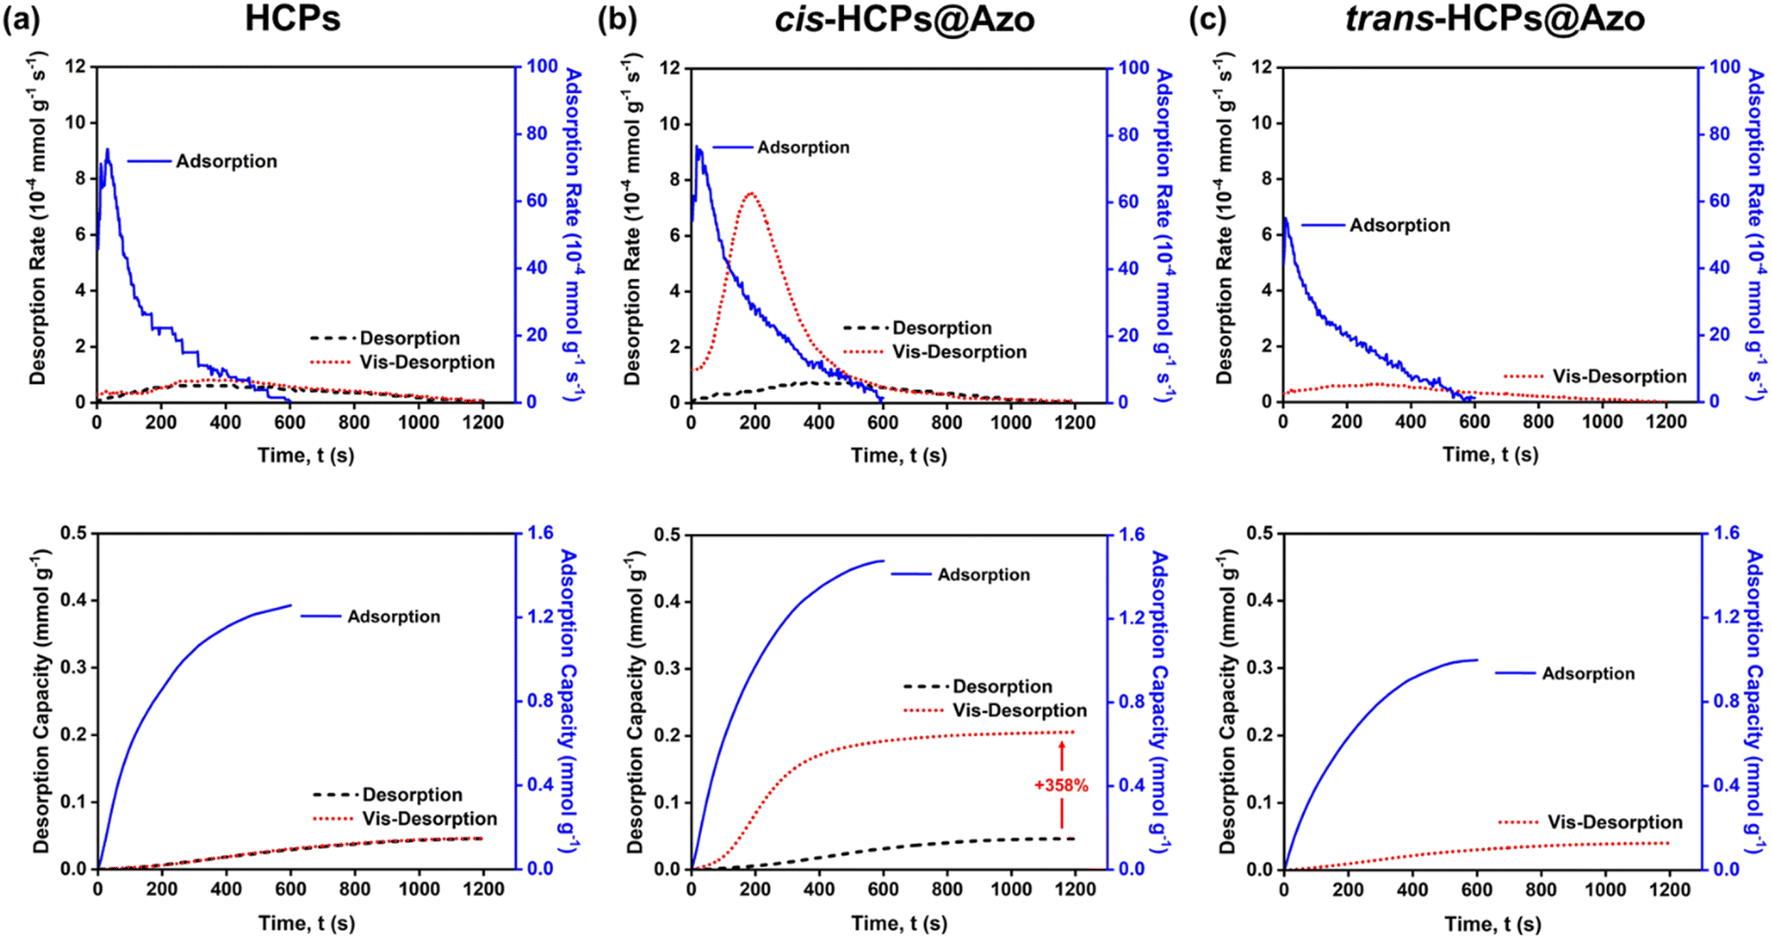
Like other HCPs,37,64,65 CO2 desorption from pristine HCPs in this work could only be enabled by thermal methods where a high temperature of 110 °C and a vacuum environment was required. Meanwhile, visible light (450 nm) was used here to trigger CO2 desorption from trans-HCPs@Azo and cis-HCPs@Azo. Here we used a N2 sweep gas and visible light to desorb CO2 molecules from adsorbents that were first exposed to pure CO2 gas (Fig. 5). Without vis-irradiation, the CO2 desorption capacities, and efficiencies of all three adsorbents only reached 0.046 mmol g−1 and <5%. This showed that even with a sweep gas flow rate of 20 mL min−1, CO2 molecules could not be desorbed from adsorbents studied here. With 1.48 mmol g−1 of CO2 adsorbed in cis-HCPs@Azo, vis-irradiation of these adsorbents for 1 hour desorbed 0.21 mmol g−1 of CO2, reaching a CO2 desorption efficiency of 14.2% (Fig. S5†). Compared to CO2 desorption that were enabled by a N2 sweep gas, vis-irradiation enhanced CO2 desorption by 358%. CO2 desorption from our photo-responsive HCPs was only enabled with vis-irradiation as the 3.0 D dipole moment of cis-azobenzene was reduced to 0 D (trans-azobenzene). Without dipole–quadrupole interactions between CO2 and azobenzene molecules, a 20 mL min−1 N2 sweep gas could then easily remove these CO2 molecules from the adsorbent surface. Additionally, cis–trans isomerisation of azobenzene also reduced the accessible pore volume,37 where the physical dimensions of azobenzene increased from 5.5 Å to 9 Å could force out CO2 molecules from the pores. Here, it is important to highlight that although vis-modulated desorption efficiency could only reach 14%, this could be potentially improved by ensuring that all cis-HCPs@Azo that were packed into the quartz container were exposed to the light source. Currently, only cis-HCPs@Azo on the outermost surface of the quartz container were exposed to visible light. Moreover, there were only 8.9 wt% of azobenzene molecules present in HCP pores and CO2 adsorption could still take place in pores that were not loaded with azobenzene. Hence, even with photo-irradiation, CO2 molecules present in pores without azobenzene could remain adsorbed. Therefore, another approach to potentially enhance desorption efficiency and capacity is to ensure that all pores are loaded with azobenzene molecules. Through a series of complementary control experiments (gas adsorption and desorption without photo-irradiation in the presence of a sweep gas), we isolated the effects of photo-irradiating 8.9 wt% azobenzene in HCPs on CO2 adsorption and desorption, where UV-irradiation led to the adsorption 0.48 mmol g−1 more CO2 and vis-irradiation desorbed 0.2 mmol g−1 of CO2. This meant that the desorption efficiency attributed to the presence of azobenzene in HCPs reached 42%.
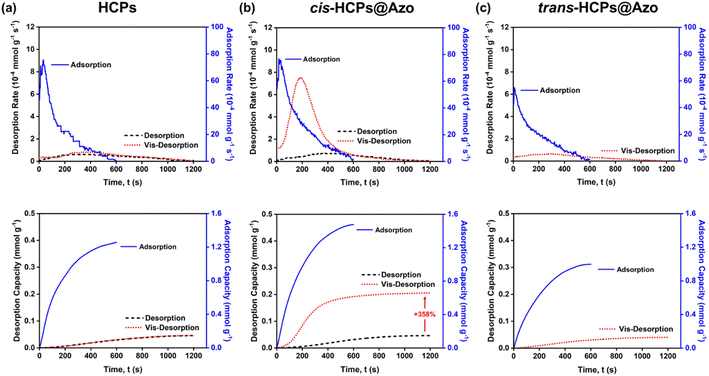 |
| | Fig. 5 The rate and capacities of adsorption (blue solid line) and desorption process (no visible irradiation: black dashed line; visible irradiation: red dotted line) of (a) HCPs, (b) cis-HCPs@Azo and trans-HCPs@Azo. | |
Kinetics of photo-modulated gas desorption
To further understand the desorption process, the desorption experimental data of three adsorbents, with/without visible light irradiation under pure N2 gas flow at room temperature and atmospheric pressure, were fitted with the following kinetic models:
Pseudo-first order model:
Pseudo-second order model:
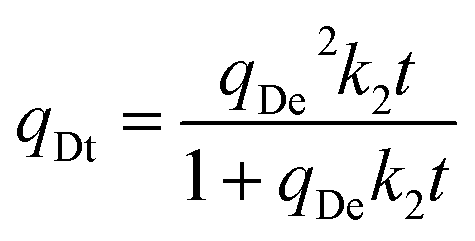
| |  | (10) |
Avrami's fractional order model:
where
qDt (mmol g
−1) and
qDe (mmol g
−1) are the amount of desorbed CO
2 per unit mass of adsorbents at any time,
t (s) and at equilibrium,
k1 (s
−1),
k2 (g mmol
−1 s
−1) and
kA (s
−1) are the rate constant of pseudo-first order, Pseudo-second order and Avrami's fractional order model respectively,
y is desorption fraction,
y =
qDt/
qDe,
nA is the Avrami exponent.
Regardless of vis-irradiation, in the presence of a N2 sweep gas, CO2 desorption in pristine HCPs and trans-HCPs@Azo could be described using the Avrami fractional order model (Table 2, Fig. S5†)because of the higher correlation coefficient R2 obtained when compared to those fitted using pseudo-first order and pseudo-second order models. This meant that the desorption mechanisms in these adsorbents were not based on either pure physical or chemical desorption. Meanwhile nA of these four desorption processes were between 1 and 2, indicative that these desorption processes occurred via a variety of pathways.52 Experimental desorption data from these four processes fit better with the pseudo-first order model than the pseudo-second order, indicating that physical adsorption was more prevalent in these four desorption processes. The CO2 desorption data of cis-HCPs@Azo that was obtained by vis-irradiation fit better with the pseudo-first order model, where the highest R2 value reached 0.9501 amongst all kinetic models used here. This inferred that vis-triggered desorption of CO2 from cis-HCPs@Azo demonstrated characteristics of both physical and chemical processes, with the former being more prevalent. More CO2 molecules were desorbed from cis-HCPs@Azo upon vis-irradiation as the cis–trans isomerization of azobenzene reverted led to a loss of physical van der Waals forces and dipole–quadrupole interactions for CO2 attraction towards the adsorbent surface.
Table 2 Parameters of pseudo-first order, pseudo-second order and Avrami's fractional order kinetic models for CO2 desorption from HCPs, HCPs-vis, cis-HCPs@Azo, cis-HCPs@Azo-vis and trans-HCPs@Azo at room temperature and atmosphere pressure
| Kinetic models |
Pseudo-first order |
Pseudo-second order |
Avrami's fractional order |
|
|
q
e,exp mmol g−1 |
q
e,cal mmol g−1 |
k
1 s−1 |
R
2
|
q
e,cal mmol g-1 |
k
2 g mmol−1 s−1 |
R
2
|
q
e,cal mmol g−1 |
k
A s−1 |
n
|
R
2
|
| HCPs |
0.0457 |
0.122 |
4.3 × 10⁻⁴ |
0.9823 |
0.23 |
0.001 |
0.9818 |
0.0485 |
0.00161 |
1.673 |
0.9999 |
| HCPs-vis |
0.0464 |
0.122 |
4.5 × 10⁻⁴ |
0.9789 |
0.16 |
0.0022 |
0.9763 |
0.0483 |
0.00166 |
1.747 |
0.9996 |
|
cis-HCPs@Azo |
0.0463 |
0.131 |
4.2 × 10⁻⁴ |
0.9669 |
0.18 |
0.0017 |
0.965 |
0.0472 |
0.00174 |
1.986 |
0.9998 |
|
cis-HCPs@Azo-vis |
0.2057 |
0.219 |
0.0031 |
0.9501 |
0.29 |
0.0092 |
0.928 |
0.1585 |
0.01 |
0.913 |
0.5541 |
|
trans-HCPs@Azo |
0.0401 |
0.055 |
0.0013 |
0.9869 |
0.086 |
0.0096 |
0.9835 |
0.0415 |
0.00202 |
1.456 |
0.9999 |
Reusability of photo-sensitive HCPs
Here we used our protocols for photo-modulated adsorption and desorption to evaluate the reusability of HCPs@Azo over five cycles using a gas mixture that simulated post-combustion flue gas streams that contained 20 v/v% CO2 (Fig. 6). After three cycles of photo-triggered adsorption and desorption, the loss in adsorption capacities of HCPs@Azo stabilised. The main reason for this loss was that pores without azobenzene in HCPs@Azo were unable to undergo reversible photo-induced changes in textural properties (BET surface area, accessible pore volume and sizes) and dipole moment. Hence, the CO2 adsorbed in these pores, like in pristine HCPs, could not be desorbed by visible light irradiation, and remained in the pores. Consequently, this hindered subsequent adsorption. By the fourth and fifth cycles, the regeneration efficiency of HCPs@Azo reached 100% and 95% (Fig. 6), delivering experimental working capacities of 0.38–0.36 mmol g−1 that were identical to those of legacy CO2 adsorbent materials deployed in temperature swing adsorption.66 The stable regeneration efficiency also indicated that the azobenzene guest molecules did not leach from HCPs@Azo. In a separate study from our group [DOI: 10.2139/ssrn.4535503], we also showed that azobenzene molecules did not leach out from HCPs@Azo even after immersion in water for up to 4.5 hours. Hence HCPs@Azo will remain relatively stable even when gas mixtures containing moisture are used (similar to real-world conditions). Here it is important to highlight that azobenzene molecules could leach out from HCPs@Azo when they come into contact with vapors of organic solvents such as alcohol,67 ether68 and glacial acetic acid.69 However, such vapors are not present in feed streams of most carbon capture processes.70 In addition, we also compared the energy consumption and cost for one adsorption–desorption cycle enabled with a high temperature of 110 °C and vacuum, and our photo-modulated approach (Table S4†). Using an average electricity price of £0.34 per kWh in 2023 in UK,71 the cost of thermal regeneration reached £2.04 while our photo-modulated approach cost only £0.004. Clearly, our approach of photo-modulated regeneration is more cost-effective and less energy-intensive than traditional regeneration methods.
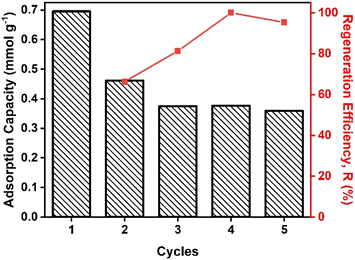 |
| | Fig. 6 (Column) adsorption capacity and (red line) regeneration efficiency of HCPs@Azo in five adsorption–desorption cycles using UV and visible light irradiation. | |
Conclusions
Using HCPs@Azo developed in our previous work, here we experimentally demonstrate the feasibility and benefits of deploying photo-responsive adsorbents for post-combustion carbon capture. Through a series of control experiments, we were able to isolate the effects of photo-modulation on regenerating HCPs@Azo. With 8.9 wt% azobenzene in HCPs, 0.48 mmol g−1 more CO2 was adsorbed in cis-HCPs@Azo from a CO2–N2 mixture comprising only 20 v/v% CO2. Vis-irradiation of this CO2-loaded adsorbent, led to the desorption of 0.2 mmol g−1 CO2. As such, the working capacity of HCPs@Azo based on the amount of azobenzene present, reached 41.6%, comparable to those of legacy CO2 adsorbents deployed in temperature swing adsorption and other state-of-art photo-responsive adsorbents. Calculations show that the energy footprint and costs of our photo-modulated regeneration approach was a fraction of those of legacy regeneration approaches. We also identified possible methods to improve regeneration efficiency, for e.g., increasing azobenzene content in HCPs whilst ensuring that all HCP pores contain these photo-switches. Outcomes from this work could potentially establish photo-modulated regeneration as a low-cost, low-carbon approach for post-combustion carbon capture.
Author contributions
AL and GL contributed equally to performing experiments and data analyses. The research concept was developed by AL and CHL. XF provided guidance and the setup for mixed gas adsorption experiments. All authors contributed to editing and writing this paper.
Conflicts of interest
There are no conflicts to declare.
References
-
X. Fan, Handbook of Clean Energy Systems, 2015, pp. 1–30 Search PubMed.
- S. J. McGurk, C. F. Martín, S. Brandani, M. B. Sweatman and X. Fan, Appl. Energy, 2017, 192, 126–133 CrossRef CAS.
- N. Ghorbani, A. Aghahosseini and C. Breyer, Renewable Energy, 2020, 146, 125–148 CrossRef.
- C. Chao, Y. Deng, R. Dewil, J. Baeyens and X. Fan, Renewable Sustainable Energy Rev., 2021, 138, 110490 CrossRef CAS.
- T. C. Drage, C. E. Snape, L. A. Stevens, J. Wood, J. Wang, A. I. Cooper, R. Dawson, X. Guo, C. Satterley and R. Irons, J. Mater. Chem., 2012, 22, 2815–2823 RSC.
- M. Kanniche, R. Gros-Bonnivard, P. Jaud, J. Valle-Marcos, J.-M. Amann and C. Bouallou, Appl. Therm. Eng., 2010, 30, 53–62 CrossRef CAS.
- R. Quinn, R. J. Kitzhoffer, J. R. Hufton and T. C. Golden, Ind. Eng. Chem. Res., 2012, 51, 9320–9327 CrossRef CAS.
-
H. Jilvero, Ammonia as an Absorbent of Carbon Dioxide in Post-Combustion Capture-An Experimental, Technical and Economic Process Evaluation, Chalmers Tekniska Hogskola, Sweden, 2014 Search PubMed.
- V. Gargiulo, M. Alfè, F. Raganati, L. Lisi, R. Chirone and P. Ammendola, Fuel, 2018, 222, 319–326 CrossRef CAS.
- F. Raganati, F. Miccio and P. Ammendola, Energy Fuels, 2021, 35, 12845–12868 CrossRef CAS.
- E. Lasseuguette, M.-C. Ferrari and S. Brandani, Energy Procedia, 2014, 63, 194–201 CrossRef CAS.
- M. Sandru, T.-J. Kim, W. Capala, M. Huijbers and M.-B. Hägg, Energy Procedia, 2013, 37, 6473–6480 CrossRef CAS.
- S. He, B. Zhu, S. Li, Y. Zhang, X. Jiang, C. H. Lau and L. Shao, Sep. Purif. Technol., 2022, 284, 120277 CrossRef CAS.
- B. Zhu, S. He, Y. Wu, S. Li and L. Shao, Engineering, 2022 DOI:10.1016/j.eng.2022.03.016.
- J. Merel, M. Clausse and F. Meunier, Ind. Eng. Chem. Res., 2008, 47, 209–215 CrossRef CAS.
- T.-H. Bae, M. R. Hudson, J. A. Mason, W. L. Queen, J. J. Dutton, K. Sumida, K. J. Micklash, S. S. Kaye, C. M. Brown and J. R. Long, Energy Environ. Sci., 2013, 6, 128–138 RSC.
- A. A. Abd, S. Z. Naji, A. S. Hashim and M. R. Othman, J. Environ. Chem. Eng., 2020, 8, 104142 CrossRef CAS.
-
D. M. Ruthven, Principles of Adsorption and Adsorption Processes, John Wiley & Sons, 1984 Search PubMed.
- H. M. Coromina, D. A. Walsh and R. Mokaya, J. Mater. Chem. A, 2016, 4, 280–289 RSC.
- S. Chen, M. Zhu, Y. Fu, Y. Huang, Z. Tao and W. Li, Appl. Energy, 2017, 191, 87–98 CrossRef CAS.
- J. A. Mason, K. Sumida, Z. R. Herm, R. Krishna and J. R. Long, Energy Environ. Sci., 2011, 4, 3030–3040 RSC.
- S. Yao, X. Yang, M. Yu, Y. Zhang and J.-X. Jiang, J. Mater. Chem. A, 2014, 2, 8054–8059 RSC.
- R. Lyndon, K. Konstas, B. P. Ladewig, P. D. Southon, P. C. J. Kepert and M. R. Hill, Angew. Chem., 2013, 125, 3783–3786 CrossRef.
- M. T. Ho, G. W. Allinson and D. E. Wiley, Ind. Eng. Chem. Res., 2008, 47, 4883–4890 CrossRef CAS.
- F. Su and C. Lu, Energy Environ. Sci., 2012, 5, 9021–9027 RSC.
- P. Küsgens, A. Zgaverdea, H. G. Fritz, S. Siegle and S. Kaskel, J. Am. Ceram. Soc., 2010, 93, 2476–2479 CrossRef.
- Q. Cen, M. Fang, T. Wang, I. Majchrzak-Kucęba, D. Wawrzyńczak and Z. Luo, Greenhouse Gases: Sci. Technol., 2016, 6, 787–796 CrossRef CAS.
- F. Maleki, A. Ghaemi and G. Mir Mohamad Sadeghi, Environ. Prog. Sustainable Energy, 2023, 42, e13954 CrossRef CAS.
- R. Ou, H. Zhang, V. X. Truong, L. Zhang, H. M. Hegab, L. Han, J. Hou, X. Zhang, A. Deletic and L. Jiang, Nat Sustainability, 2020, 3, 1052–1058 CrossRef.
- M. Wang, S. Zhou, S. Cao, Z. Wang, S. Liu, S. Wei, Y. Chen and X. Lu, J. Mater. Chem. A, 2020, 8, 10519–10533 RSC.
- J. Park, D. Yuan, K. T. Pham, J.-R. Li, A. Yakovenko and H.-C. Zhou, J. Am. Chem. Soc., 2012, 134, 99–102 CrossRef CAS PubMed.
- Y. Jiang, P. Tan, S. C. Qi, X. Q. Liu, J. H. Yan, F. Fan and L. B. Sun, Angew. Chem., Int. Ed., 2019, 58, 6600–6604 CrossRef CAS PubMed.
- Y. Zhu and W. Zhang, Chem. Sci., 2014, 5, 4957–4961 RSC.
- H. Li, M. R. Hill, C. Doblin, S. Lim, A. J. Hill and P. Falcaro, Adv. Funct. Mater., 2016, 26, 4815–4821 CrossRef CAS.
- K. Matsuda and M. Irie, J. Photochem. Photobiol., C, 2004, 5, 169–182 CrossRef CAS.
- R. Lyndon, K. Konstas, R. A. Evans, D. J. Keddie, M. R. Hill and B. P. Ladewig, Adv. Funct. Mater., 2015, 25, 4405–4411 CrossRef CAS.
- A. Liu, C. Mollart, A. Trewin, X. Fan and C. H. Lau, ChemSusChem, 2023, e202300019 CrossRef CAS PubMed.
- C. R. Crecca and A. E. Roitberg, J. Phys. Chem. A, 2006, 110, 8188–8203 CrossRef CAS PubMed.
- K. Tsuda, G. C. Dol, T. Gensch, J. Hofkens, L. Latterini, J. W. Weener, E. W. Meijer and D. Schryver, J. Am. Chem. Soc., 2000, 122, 3445–3452 CrossRef CAS.
- G. Hartley and R. Le Fevre, J. Chem. Soc., 1939, 531–535 RSC.
- X. Dong, A. Akram, B. Comesaña-Gándara, X. Dong, Q. Ge, K. Wang, S.-P. Sun, B. Jin and C. H. Lau, ACS Appl. Polym. Mater., 2020, 2, 2586–2593 CrossRef CAS.
- C. Graham, J. Pierrus and R. Raab, Mol. Phys., 1989, 67, 939–955 CrossRef CAS.
- S. Saqib, S. Rafiq, N. Muhammad, A. L. Khan, A. Mukhtar, N. B. Mellon, Z. Man, M. H. Nawaz, F. Jamil and N. M. Ahmad, J. Nat. Gas Sci. Eng., 2020, 73, 103072 CrossRef CAS.
- L. A. Neves, J. G. Crespo and I. M. Coelhoso, J. Membr. Sci., 2010, 357, 160–170 CrossRef CAS.
- J. W. To, J. He, J. Mei, R. Haghpanah, Z. Chen, T. Kurosawa, S. Chen, W.-G. Bae, L. Pan and J. B.-H. Tok, J. Am. Chem. Soc., 2016, 138, 1001–1009 CrossRef CAS PubMed.
- S. Mane, Z.-Y. Gao, Y.-X. Li, D.-M. Xue, X.-Q. Liu and L.-B. Sun, J. Mater. Chem. A, 2017, 5, 23310–23318 RSC.
- H. Margenau, Rev. Mod. Phys., 1939, 11, 1 CrossRef CAS.
- J. Law, M. Van Baalen, M. Foy, S. S. Mason, C. Mendez, M. L. Wear, V. E. Meyers and D. Alexander, J. Occup. Environ. Med., 2014, 56, 477–483 CrossRef CAS PubMed.
- B. P. Spigarelli and S. K. Kawatra, J. CO2 Util., 2013, 1, 69–87 CrossRef CAS.
- M. L. Chua, L. Shao, B. T. Low, Y. Xiao and T.-S. Chung, J. Membr. Sci., 2011, 385, 40–48 CrossRef.
- J. Liu, J. Tian, P. K. Thallapally and B. P. McGrail, J. Phys. Chem. C, 2012, 116, 9575–9581 CrossRef CAS.
- Y. Zhao, K. X. Yao, B. Teng, T. Zhang and Y. Han, Energy Environ. Sci., 2013, 6, 3684–3692 RSC.
- Y. Cui, Y. Xing, J. Tian, W. Su, F.-Z. Sun and Y. Liu, Fuel, 2023, 337, 127179 CrossRef CAS.
- F. Raganati, M. Alfe, V. Gargiulo, R. Chirone and P. Ammendola, Chem. Eng. J., 2019, 372, 526–535 CrossRef CAS.
- S. Lagergren, K. Sven. Vetenskapsakad. Handl., 1898, 24, 1–39 Search PubMed.
- S. Loganathan, M. Tikmani, S. Edubilli, A. Mishra and A. K. Ghoshal, Chem. Eng. J., 2014, 256, 1–8 CrossRef CAS.
- S. Mutyala, M. Jonnalagadda, H. Mitta and R. Gundeboyina, Chem. Eng. Res. Des., 2019, 143, 241–248 CrossRef CAS.
- Y.-S. Ho and G. McKay, Process Biochem., 1999, 34, 451–465 CrossRef CAS.
- B. Guo, Y. Wang, X. Qiao, X. Shen, J. Guo, J. Xiang and Y. Jin, Chem. Eng. J., 2021, 421, 127865 CrossRef CAS.
- X. Wang, L. Chen and Q. Guo, Chem. Eng. J., 2015, 260, 573–581 CrossRef CAS.
- Y. Liu and X. Yu, Appl. Energy, 2018, 211, 1080–1088 CrossRef CAS.
- Q. Liu, J. Shi, S. Zheng, M. Tao, Y. He and Y. Shi, Ind. Eng. Chem. Res., 2014, 53, 11677–11683 CrossRef CAS.
- N. J. Nagelkerke, Biometrika, 1991, 78, 691–692 CrossRef.
- L. Shao, Y. Sang, J. Huang and Y.-N. Liu, Chem. Eng. J., 2018, 353, 1–14 CrossRef CAS.
- M. Liu, L. Shao, J. Huang and Y.-N. Liu, Microporous Mesoporous Mater., 2018, 264, 104–111 CrossRef CAS.
- F. Raganati, R. Chirone and P. Ammendola, Ind. Eng. Chem. Res., 2020, 59, 3593–3605 CrossRef CAS.
- T. Takagishi, A. Katayama, M. Matsuoha, K. Konishi and N. Kuroki, Kolloid-Zeitschrift und Zeitschrift für Polymere, 1969, 232, 699–703 CrossRef CAS.
- H. Gilman and R. M. Pickens, J. Am. Chem. Soc., 1925, 47, 2406–2416 CrossRef CAS.
- R. G. Denning and J. Thatcher, J. Am. Chem. Soc., 1968, 90, 5917–5918 CrossRef CAS.
-
A. Basile, A. Gugliuzza, A. Iulianelli and P. Morrone, in Advanced Membrane Science and Technology for Sustainable Energy and Environmental Applications, Elsevier, 2011, pp. 113–159 Search PubMed.
-
Average Cost Of Electricity Per KWh (UK 2023 Updated), https://energyguide.org.uk/average-cost-electricity-kwh-uk/) Search PubMed.
|
| This journal is © The Royal Society of Chemistry 2023 |
Click here to see how this site uses Cookies. View our privacy policy here. 
 Open Access Article
 This Open Access Article is licensed under a Creative Commons Attribution-Non Commercial 3.0 Unported Licence
 *
*