 Open Access Article
Creative Commons Attribution 3.0 Unported Licence
Alkali-stable polybenzimidazole anion exchange membranes tethered with N,N-dimethylpiperidinium cations for dilute aqueous KOH fed water electrolyzers†
Oskar
Boström‡
a,
Seung-Young
Choi‡
 a,
Lu
Xia
b,
Shviro
Meital§
b,
Felix
Lohmann-Richters
 b and
Patric
Jannasch
 *a
*a
aPolymer & Materials Chemistry, Department of Chemistry, Lund University, SE-221 00, Sweden. E-mail: patric.jannasch@chem.lu.se
bForschungszentrum Jülich GmbH, Institute of Energy and Climate Research, Electrochemical Process Engineering (IEK-14), 52425 Jülich, Germany
First published on 5th September 2023
Abstract
Polybenzimidazole (PBI) is currently considered as a membrane material for alkaline water electrolyzers (AWEs), and has to be fed with highly concentrated aqueous KOH electrolytes in order to ensure sufficient electrolyte uptake and conductivity. However, the harsh operating conditions significantly limit the lifetime of PBI membranes. In response, we here report on the synthesis and performance of a series of PBI membranes tethered with alkali-stable mono-piperidinium (monoPip) and bis-piperidinium (bisPip) side groups, respectively, which allows the use of more dilute KOH concentrations. The electrolyte uptake of these membranes was found to be inversely proportional to the electrolyte concentration, which was in stark contrast to pristine PBI membranes. The high electrolyte uptake at low concentrations by the present membranes enables operation of AEMWE systems fed with dilute electrolytes, which significantly decrease membrane degradation. After immersion in 2 M aqueous KOH at 80 °C for up to 6 months, no degradation was detected by 1H NMR spectroscopy in the monoPip series of AEMs, and a mere 7% ionic loss by Hofmann elimination in the bisPip series. Membranes tethered with bisPip groups produced the best AEMWE performance, and a sample with a hydroxide ion exchange capacity of 2.4 meq. g−1 reached a high current density of 358 mA cm−2 at 2 V with demonstrated stability over 100 h, using 2 M aqueous KOH and only simple nickel foam electrodes. This is comparable to the performance reported for Zirfon diaphragms and pristine PBI membranes operating with much higher concentrations of KOH in the range of 5–7 M. The low KOH concentration of the present membranes brings important advantages for the material stability in the cell, as well as for the balance of plant, and the results provide useful insights into the molecular design of AEMs for dilute electrolyte-fed AEMWE systems.
Introduction
Electrolyzers are electrochemical devices that produce hydrogen gas by splitting water. Conventional alkaline water electrolyzers (AWEs) generally operate with highly concentrated alkaline electrolyte solutions (5–7 M aqueous KOH), allowing the use of platinum group metal (PGM)-free catalysts.1–5 However, the porous diaphragm which separates the anode and cathode causes a substantial gas crossover.4,5 Moreover, an AWE generally operates at a low current density (300–400 mA cm−2) due to high losses from ohmic resistance.1–7 To overcome the issues of the AWE, proton exchange membrane water electrolyzers (PEMWEs) and anion exchange membrane (AEM) water electrolyzers (AEMWEs) have been considered as alternatives. The former is today a mature technology, while the latter is currently intensively developed. Both PEMWEs and AEMWEs employ polymer-based ion exchange membranes instead of porous diaphragms, which suppress the gas crossover and allow for a compact zero-gap system design.1,2,7 Since the use of expensive PGM catalysts and protective coatings are necessary for PEMWEs, considerable research attention has recently been diverted towards AEMWEs. The most important parameter affecting AEMWE performance is the concentration of the electrolyte solution (i.e., aqueous KOH or K2CO3 solutions). Although pure water-fed systems are desired for AEMWEs,8 most studies have been focused on alkaline electrolyte solution-fed systems,1–7 because the alkaline solution is not only an excellent transport medium for hydroxide ions by itself, but also significantly promotes the reaction kinetics at the catalyst. However, polymeric membranes generally suffer from alkaline stability issues when highly concentrated solutions are used. Hence, in this respect, a dilute solution-fed system (<2 M) has clear advantages.Polybenzimidazoles (PBIs) employed as ion-solvating polymer membranes have shown high potential for AEMWE applications.9–12 Pristine PBI membranes are not inherently ion conductive, but become so after exposure to alkaline solution. This is because the protonic N–H groups in the imidazole rings are partly deprotonated in alkaline media, which leads to the formation of imidazolide anions along the polymer backbone.13,14 The anionic nature of the PBI then induces absorption of the alkaline electrolyte solution. From this follows that the higher the alkali concentration, the more imidazole rings are deprotonated to form imidazolide, leading to increased uptake of electrolyte solution by the PBI membrane. Hence, these membranes have mainly been applied in high concentration solution-fed AWEs (5–7 M), where the uptake is sufficient to reach high ionic conductivities.9–12 However, despite the ether-free and aromatic structure of PBI, it can still degrade under harsh conditions, for example in highly concentrated alkali solution at elevated temperature. While the imidazolide anions are not attacked by hydroxide ions, any remaining neutral (non-deprotonated) imidazole groups are vulnerable to attack at the C2 position, leading to hydrolysis and chain scission.12,15 Under dilute conditions (<2 M alkali), the chemical degradation issue of PBI is far less severe, but new approaches are needed to improve the uptake of electrolyte solution. To this end, we here report on PBI membranes functionalized with piperidinium side groups for dilute solution-fed AEMWEs. The introduction of cationic side chains to form AEMs is expected to improve ionic clustering, as well as increase the free volume in the PBI material,16–20 thus possibly enabling an increased absorption of electrolyte solution, especially at dilute concentrations. In the present study, two different cationic haloalkyl compounds were synthesized and tethered to PBI. As shown in Scheme 1, the first contained a single dimethylpiperidinium (DMP) cation and was designated monoPip, and the second contained two cationic groups (one DMP cation and one 1-butyl-1-methylpiperidinium cation), designated bisPip. The DMP cation has shown excellent alkaline stability compared to alternative cationic groups, both when it comes to small model compounds and when tethered to polymers.21–24 As expected, the 1-butyl-1-methylpiperidinium cation generally shows less alkaline stability compared to DMP.25–27 However, the configuration of bisPip is still interesting because the interstitial alkyl spacer chain between the two piperidinium rings may provide additional free volume to facilitate electrolyte uptake. Here, we report on the synthetic route to the modified PBIs, the thermal properties, nanostructure, alkaline stability, and alkali solution uptake, as well as on the AEMWE performance for both the monoPip- and the bisPip-tethered PBI membranes.
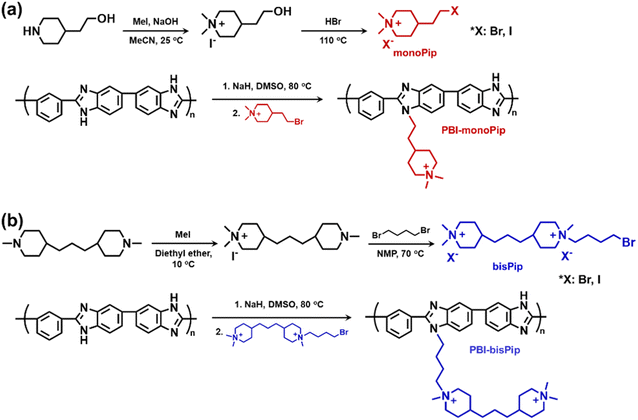 | ||
| Scheme 1 Synthetic pathway to m-PBI tethered with (a) monoPip and (b) bisPip side groupsa. a Counterions are omitted from the final polymers for clarity. | ||
Results and discussion
Tethering PBI with mono- and bis-piperidinium side groups
The two cationic alkyl halide compounds (monoPip and bisPip) were prepared for the functionalization of m-PBI. First, monoPip was synthesized via a two-step reaction in which the secondary amine group of 2-(piperidin-4-yl) ethanol was quaternized by MeI, followed by the conversion of the ethyl alcohol group to an ethyl halide using HBr (Scheme 1a). During the halogenation step, there were iodine ions remaining from the quaternization step along with the bromide ions. This resulted in a mixture of brominated and iodinated species in the final product. However, this is of little importance since both species have a similar reactivity in the subsequent PBI modification step. Still, an average molecular weight of the bisPip in the mixture was determined by quantitative NMR spectroscopy using maleic acid as an internal reference. BisPip was also synthesized via a two-step method (Scheme 1b). The starting material, 4,4′-trimethylenebis(1-methylpiperidine), contains two tertiary amine groups separated by an alkylene chain. In the first step, one of the tertiary amines was quaternized using MeI, followed by quaternization of the second one by 1,4-dibromobutane. In the first quaternization step, the intermediate product precipitated as a white powder after only one piperidine was quaternized, thus leaving the second ring as a tertiary amine.28 In the second quaternization step, a large excess of 1,4-dibromobutane (10 eq.) was used in order to avoid the coupling of two intermediate products by the dibromoalkane. The success of all the reactions was verified by 1H NMR spectroscopy. In Fig. 1, the NMR spectra of both haloalkylated monoPip and bisPip are shown, along with the spectra of the starting materials and intermediate products. Most important to note are the twin signals centered around 3 ppm assigned to the methyl groups of the piperidinium cations.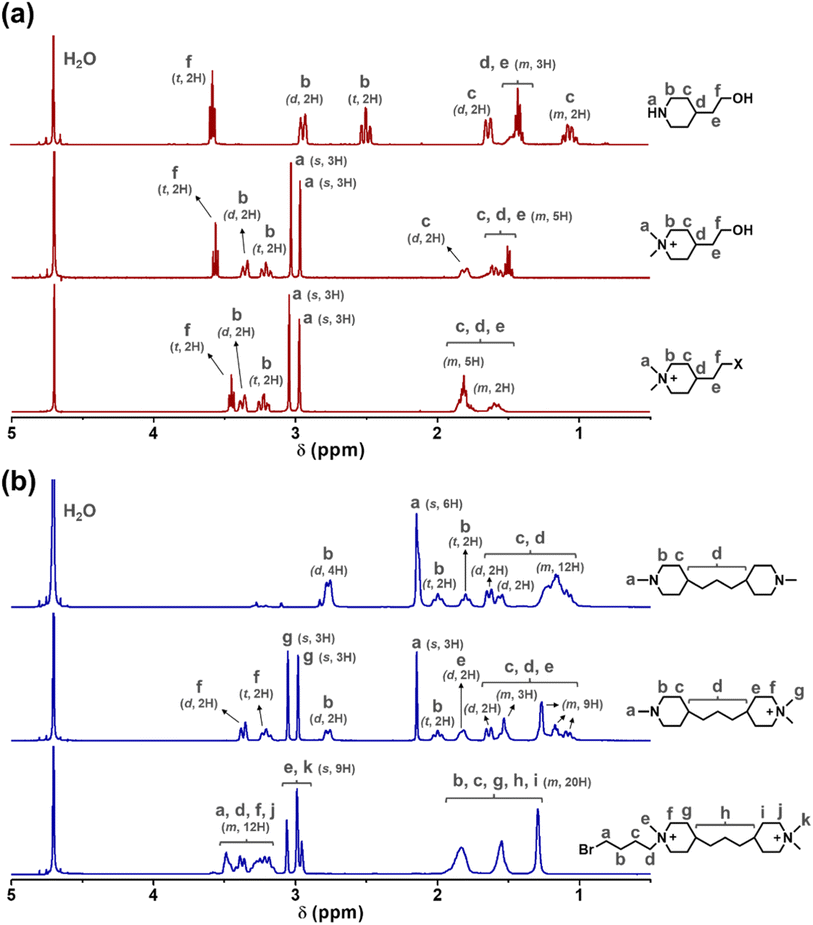 | ||
| Fig. 1 1H NMR spectra of the (a) monoPip and the (b) bisPip starting materials, intermediates and products (s: singlet, d: doublet, t: triplet, m: multiplet). | ||
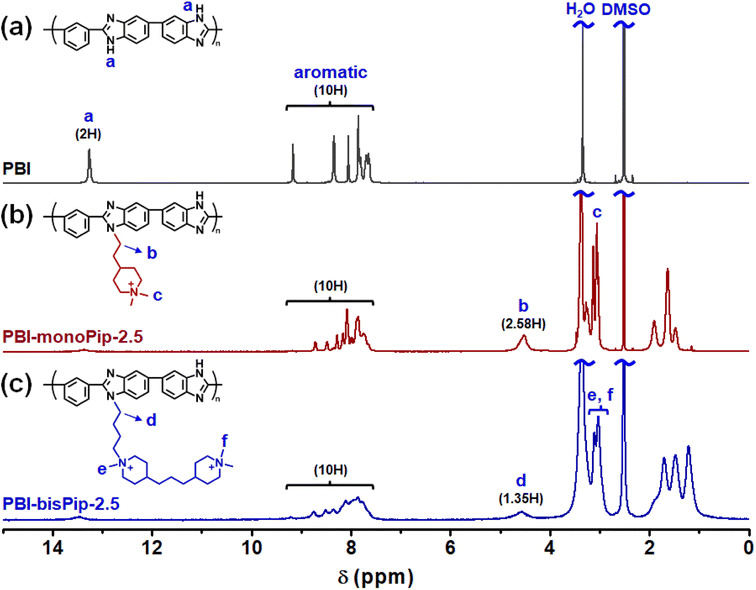
Both the haloalkylated monoPip and bisPip were grafted onto PBI via a two-step method. First, the N–H units of the benzimidazole groups of the PBI were deprotonated using NaH, and then the respective cationic side groups were attached via a nucleophilic substitution reaction (Scheme 1). The 1H signals of the grafted products, PBI-monoPip and PBI-bisPip, respectively, were used to verify the success of the grafting reaction and assess the degree of functionalization (DF). After the functionalization of PBI, the intensity of the N–H signal at 13.2 ppm decreased significantly, and new signals corresponding to side groups appeared below 5 ppm (Fig. 2). The DF of each membrane was determined by comparing the integrated signals corresponding to the α-hydrogen (Hα) (4.5 ppm, Hb in Fig. 2b and Hd in Fig. 2c) to those of the PBI backbone signal. Two hydrogen atoms are in the Hα position, and one repeating unit of PBI contains two functional sites. Consequently, DF was calculated as:
 | (1) |
 | (2) |
Thermal properties
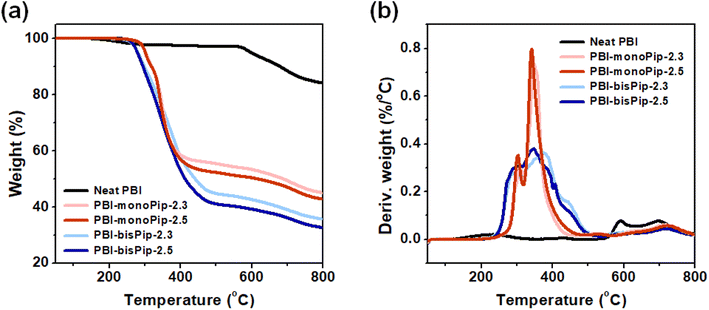
Thermal analysis of the membranes provides information about material compositions, as well as thermal stability. To analyze the thermal properties of each membrane, the weight loss was monitored up to 800 °C by TGA (Fig. 3). In general, a weight loss corresponding to H2O evaporation is observed at around 100 °C.29,30 In the present work, the membranes were pre-heated at 120 °C for 20 min to remove any water. A typical TGA curve for pristine PBI exhibits only a weight-loss step at around 600 °C, denoting backbone decomposition.31,32 However, due to the grafted side groups, PBI-monoPip and PBI-bisPip samples showed a large weight loss in the temperature range 220–450 °C, in addition to the backbone decomposition at around 600 °C (Fig. 3a and b). The molecular weight of bisPip was higher than that of monoPip, and hence the weight loss in connection to the side group decomposition was larger in PBI-bisPip than in PBI-monoPip. Moreover, the higher-IEC samples (2.5 meq. g−1) showed larger weight losses than the lower-IEC samples (2.3 meq. g−1) for both PBI-monoPip and PBI-bisPip. Both PBI-monoPip and PBI-bisPip membranes showed an onset of decomposition above 200 °C, indicating that both membranes have sufficient thermal stability to be applied in AEMWEs generally operating below 100 °C. Table 1 lists the thermal decomposition temperature (Td,95) for all studied samples, which was determined when the weight loss reached 5%.| Sample | DFa | IECb (meq. g−1) | σ (mS cm−1) | T d,95 (°C) | ||||
|---|---|---|---|---|---|---|---|---|
| Br− form | OH− form | 20 °C, water | 20 °C, 2 M KOH | 80 °C, water | 80 °C, 2 M KOH | |||
| a Calculated using eqn (1). b Calculated using eqn (2). c Measured in-plane in deionized water or through-plane in 2 M KOH. | ||||||||
| PBI-monoPip-2.3 | 0.55 | 2.00 | 2.29 | 31 | 15 | 52 | 19 | 302 |
| PBI-monoPip-2.5 | 0.65 | 2.18 | 2.52 | 52 | 28 | 101 | 38 | 301 |
| PBI-bisPip-2.3 | 0.29 | 2.00 | 2.29 | 48 | 21 | 92 | 31 | 281 |
| PBI-bisPip-2.5 | 0.34 | 2.16 | 2.50 | 73 | 25 | 163 | 34 | 279 |
Membrane morphology
The PBI-monoPip and PBI-bisPip membranes contain cationic groups in the side chains, resulting in phase separation between the ionic side groups and the hydrophobic backbones. A well-developed percolating hydrophilic phase domain of the membranes is generally a prerequisite for efficient ion conduction. Consequently, it is important to elucidate the nano-scale morphology of the designed PBI-monoPip and PBI-bisPip membranes. In general, SAXS33 and AFM34 are commonly used for the nanostructural analysis of membranes. However, no ionomer peaks were found in any of the SAXS profiles of the membranes (Fig. S3, ESI†), possibly due to an insufficient intensity of the X-ray beam, or a non-regular distribution of the ionic domains. In contrast, AFM phase images clearly showed differences in the nano-structure between the PBI-monoPip and PBI-bisPip membranes (Fig. 4). In these images, the dark and bright parts denote the hydrophilic and hydrophobic phases of the membranes, respectively.34 It is often found that long and flexible side chains, as present in PBI-bisPip, facilitate a hydrophilic–hydrophobic phase separation to the membranes. In addition, the average distance between ionic side chain grafts along the backbone polymer is smaller in PBI-monoPip than in PBI-bisPip at a given IEC (Fig. 4a′ and b′). Hence, the ionic phase domains of PBI-monoPip were small and more scattered (Fig. 4a) than those of PBI-bisPip which were comparatively more developed and larger (Fig. 4b). The surface topological AFM images for both membranes are shown in Fig. S4 (ESI†).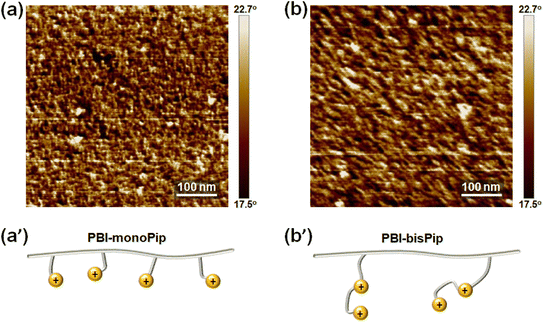 | ||
| Fig. 4 AFM phase images of (a) PBI-monoPip-2.5 and (b) PBI-bisPip-2.5 AEMs, together with schematic representations of the two membrane polymer structures (a′ and b′, respectively). | ||
Electrolyte solution uptake and membrane swelling
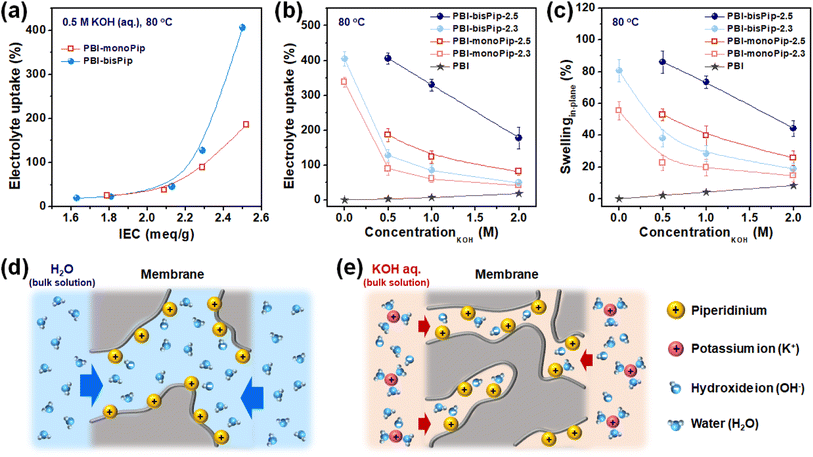
AEM properties such as water uptake, water swelling and conductivity are usually evaluated with pure water, because the research has been mainly focused on fuel cell applications. However, AEMWEs generally operate with an electrolyte solution (i.e., aqueous KOH) and the present PBI-monoPip and PBI-bisPip membranes were evaluated with electrolyte solutions, as well as pure water (Fig. 5). As shown in Fig. 5a, the uptake of electrolyte solution increased as a function of IEC for both the PBI-monoPip and PBI-bisPip membranes. At IEC values below 2 meq. g−1, the viscoelastic properties of the AEMs can balance the osmotic pressure, but after reaching a certain critical IEC between 2.1 and 2.2 meq. g−1, the increasing osmotic pressure caused progressively increasing electrolyte solution uptake of the membranes. The critical IEC is similar for both side groups, indicating that it is related to the concentration of ions in the material. Also, after exceeding the critical IEC, the electrolyte uptake of PBI-bisPip increased much more rapidly with the IEC than that of PBI-monoPip samples, approximately by a factor of two (Fig. 5a). Thus, this observation seems to be related to the number of ions per side group. A PBI-monoPip membrane with a certain IEC has almost twice the DF of a PBI-bisPip membrane at the same IEC (Fig. S5, ESI†). Most probably, the larger ionic domains formed by PBI-bisPip membranes (Fig. 4) facilitated a larger uptake of water, compared with corresponding PBI-monoPip membranes at a given IEC.The electrolyte uptake and swelling of the membranes were evaluated in various KOH concentrations (Fig. 5b and c). As expected, PBI-bisPip membranes showed higher electrolyte uptake compared to PBI-monoPip membranes at all concentrations. The dependence of uptake and swelling on the concentration of the electrolyte solution is important when it comes to the selection of an AEM and the specific KOH concentration. When pristine PBI is exposed to alkaline media, the N–H groups of the imidazole ring are progressively deprotonated as the KOH concentration is increased.35 Therefore, pristine PBI showed increasing electrolyte uptake and swelling with increasing KOH concentration (Fig. 5b and c). In contrast, the uptake and swelling of both the PBI-monoPip and the PBI-bisPip membranes decreased upon increasing KOH concentration. Similar results have been observed with, e.g., Nafion in hydrochloric acid.36 When immersed in pure water, the high concentration of counterions (OH−) compared to the cations tethered to the backbone polymers gives rise to absorption of water and a high osmotic pressure in the AEM (Fig. 5d). However, when the AEM is immersed in an alkaline solution with concentrations high enough to overcome the Donnan exclusion effect, ions from the electrolyte will enter the hydrophilic domains (Fig. 5e). These will increase the screening of the grafted cations, allowing the hydrophilic domains to shrink, consequently reducing the water content.36 To summarize, in contrast to pristine PBI, the electrolyte uptake and swelling of both PBI-monoPip and PBI-bisPip membranes decreased with increasing KOH concentration, likely due to screening effects from additional ions dissolved in the membrane. This trend indicates that membranes with tethered cations are suitable for use in the dilute electrolyte solution-fed AEMWE. Because of their high IEC, both PBI-monoPip-2.5 and PBI-bisPip-2.5 lost their mechanical integrity in pure water at 80 °C, due to their high swelling, and consequently their water uptake and swelling were not measured.
Ex situ conductivity was measured for the membranes immersed in pure water, as well as in 2 M aqueous KOH. In contrast to previous studies that reported similar, or increased, conductivity with increasing electrolyte concentrations,36,37 we observed a significantly lower conductivity in 2 M KOH compared to pure water for all samples, see Table 1. This is in line with the observed swelling behavior.
Alkaline stability
The alkaline stability is one of the most crucial properties for stable long-time AEMWE performance. The PBI backbone is known to be stable at dilute concentrations (<2 M),38 and so we focused on the alkaline stability of the AEMs in the monoPip and bisPip series. The α-carbon and β-hydrogen of the nitrogen atom in the piperidinium ring can be attacked by hydroxide ions, resulting in nucleophilic substitution (SN2) and Hofmann elimination, respectively.39 The most plausible degradation pathways are shown in Fig. 6.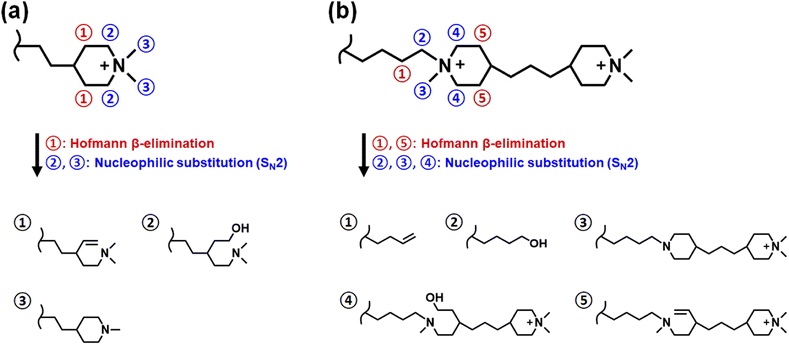 | ||
| Fig. 6 Possible degradation pathways of the cationic groups in the (a) monoPip and (b) bisPip series of AEMs. | ||
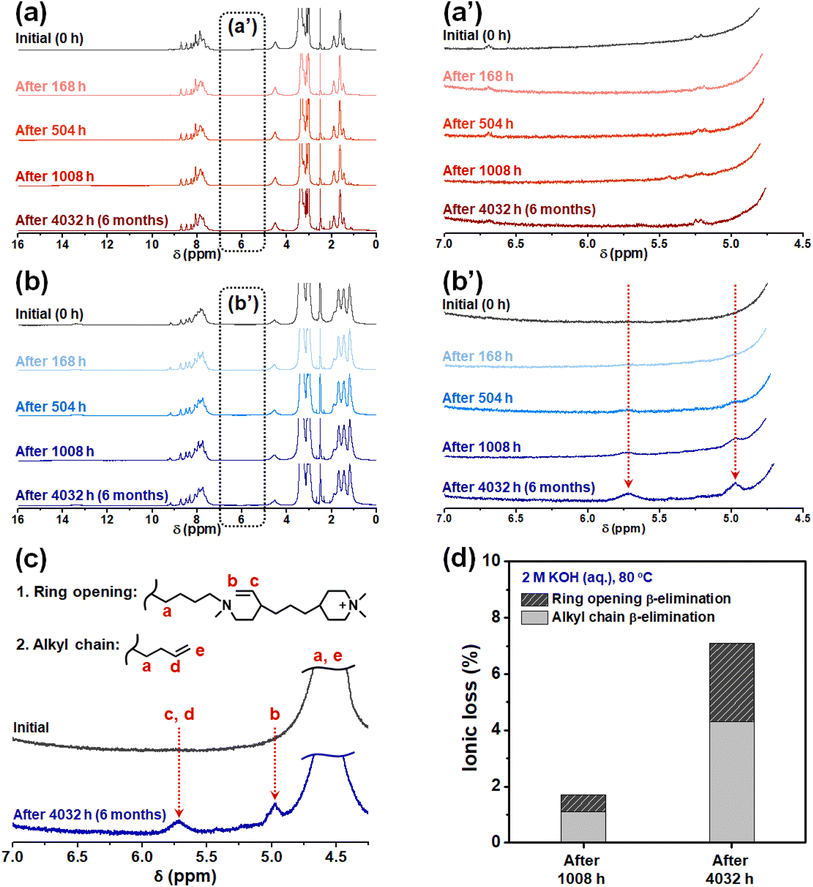
To evaluate the alkaline stability of PBI-monoPip and PBI-bisPip membranes, sample pieces with IEC values of 2.3 and 2.5 meq. g−1 from the two series were immersed in 2 M KOH solution at 80 °C for up to 6 months. Any changes in the molecular structure were then studied and quantified at different time intervals by NMR spectroscopy. As shown in Fig. 7a and a′, there were no detectable signs of degradation of the PBI-monoPip samples, even after the full 6 months, indicating the excellent alkaline stability of the monoPip group. In contrast, the PBI-bisPip samples showed two new, clear but rather small, signals observed between 4.5 and 6 ppm (Fig. 7b and b′). These are attributed to two types of Hofmann β-elimination, ring-opening and alkyl chain scission, respectively, of the 1-butyl-1-methylpiperidinium cation close to the backbone (Fig. 7c).25 The DMP cation, located at the terminus of the bisPip group, has previously been shown to possess excellent alkaline stability.40 The 1-butyl-1-methylpiperidinium cation is also quite stable but is more susceptible to attack by hydroxide ions than the DMP cation due to the presence of the N-butyl tether and the more constrained piperidinium ring.25–27 Based on the integrals of the two new NMR signals, the ionic loss was quantified (Fig. 7d). Among the two types of Hofmann β-elimination reactions, scission of the alkyl chain occurred at a higher rate compared to ring opening, which is consistent with our previous results on these kinds of cations.25 Still, the total ionic loss of PBI-bisPip during 6 months was merely 7%, which suggests high-performance AEMWE operation during a fairly long period. Similar cations have previously been utilized in AEMs with backbones such as poly(arylene piperidine).27 Two different cationic side groups were used in this work, namely a monocationic DMP (similar to PBI-monoPip), and a dicationic group containing an N-methylpiperidinium cation connecting a terminal DMP cation to the backbone polymer via an alkyl chain. In the case of the AEM with the monocationic side groups, the ionic loss was between 6 and 8% after 30 days in 2 M NaOH at 90 °C. The dicationic side groups were reported to be less stable with 18 to 22% cations lost after 30 days in 1 M NaOH at 80 °C.27
AEMWE performance
Membranes with a thickness of 80 μm in the dry state were mounted in electrolysis cells to investigate the performance under real operating conditions. The test station and cells have been described previously41 and plain Ni foam served as electrodes. Polarization curves with the different membranes were recorded after conditioning at 1.7 V for 20 h (Fig. 8). The current density at 2 V increased in the order PBI-monoPip-2.3 < PBI-bisPip-2.3 < PBI-monoPip-2.5 < PBI-bisPip-2.5. This trend was the same as that shown by the ex situ conductivity measurements performed in pure water. Clearly, PBI-bisPip exhibited better performance than PBI-monoPip, and the performance improved with the IEC.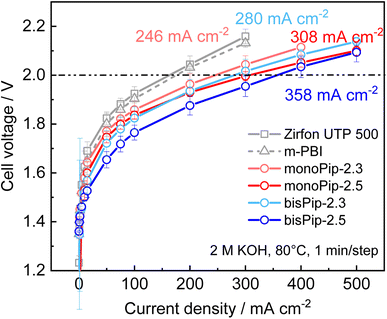 | ||
| Fig. 8 Polarization curves of electrolysis cells with the different membranes. The current density at 2 V is given next to the respective curves. | ||
The current density with PBI-bisPip-2.5 was 358 mA cm−2 at 2 V. In comparison, Zirfon UTP 500 and 40 μm thick m-PBI membranes were tested at the same KOH concentration as the PBI-monoPip and PBI-bisPip membranes (Fig. 8). The resulting current density at 2 V was significantly lower, reaching 163 and 176 mA cm−2, respectively. The comparison may be considered unfair, as Zirfon and m-PBI work much better at higher KOH concentrations. At a KOH concentration of 24 wt%, ion solvating m-PBI membranes have been reported to reach 397 mA cm−2 with Ni-foam electrodes.9 A classic Zirfon UTP 500 with Ni-foam electrodes yielded 300 mA cm−2 at 2 V with a concentration of 32.5 wt% KOH.41 Consequently, the current density obtained using PBI-bisPip-2.5 (358 mA cm−2 at 2 V) in 2 M KOH is comparable to that of Zirfon UTP 500 and pure m-PBI operating at much higher concentrations of KOH. The high electrolyte uptake and high ionic conductivity of the present AEMs at low KOH concentration are thus also reflected in the electrolysis measurements. The low concentration is advantageous in terms of material stability for the cell, as well as for the balance of plant.
Galvanostatic impedance measurements at 10 mA cm−2 were performed and fitted to estimate the specific conductivity of the membranes (see Fig. S7 and S8 in the ESI†). This yielded 52 and 63 mS cm−1 for PBI-monoPip-2.3 and −2.5, respectively, and 50 and 58 mS cm−1 for PBI-bisPip-2.3 and −2.5, respectively. Comparison of the impedance measurements for different cells with the same membrane showed that the error of the measurements can be estimated to be up to 5 mS cm−1. The numbers given should therefore be taken with some caution. Still, the trend of the specific conductivity from the impedance data agreed quite well with the trend of the slopes at high current densities in the polarization curves.
The observed specific conductivities are systematically higher than those in the ex situ measurement at the same concentration and temperature. This was rather unexpected as systematically lower conductivities in cell measurements compared to ex situ measurements have been reported for alkaline diaphragms.42 It might be related to the compression of the membrane in the electrolysis cell resulting in less swelling. The trend of the specific conductivities in the cell measurement was the same as that of the ex situ measurements in 2 M KOH, except for PBI-monoPip-2.3, which showed a higher conductivity than expected. This could be due to a variety of factors such as different mechanical behavior in the cell assembly, minor differences in membrane thickness, or an undetected membrane damage.
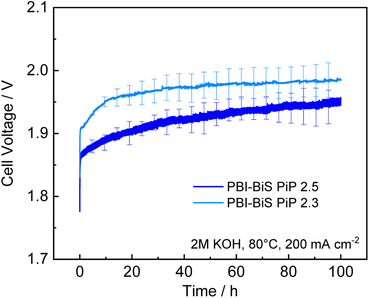
As the PBI-bisPip AEMs showed systematically better performance than the PBI-monoPip ones, the former membranes were subsequently subjected to a 100 h electrolysis test at 200 mA cm−2. The resulting voltage is plotted in Fig. 9. In the polarization curves, PBI-bisPip-2.5 exhibited a lower voltage than PBI-bisPip-2.3. A linear fit of the last 50 h gave a degradation rate of 419 ± 2 μV h−1 for PBI-bisPip-2.5 and 153 ± 0.4 μV h−1 for PBI-bisPip-2.3. Generally, the degradation rate depends on the separator, the electrodes, and the test conditions. Consequently, it is thus not straightforward to compare and identify the causes for variations in the results between different studies. State-of-the-art electrolyzers are specified to have degradation rates between 0.4 and 5 μV h−1.43 A recent review on AEM electrolysis states degradation rates between <1 μV h−1 and 3 mV h−1.44 One study performed a long term test with a water-fed AEM electrolyzer with a fluoride-incorporated Ni–Fe anode at 200 mA cm−2, the same current density as in this work.45 Here, a degradation rate of 0.56 mV h−1 was observed over 260 h. Nevertheless, the degradation also includes degradation of the electrodes and potential reversible degradation contributions, which are not in the scope of this work. The impedance spectra show no significant change of the ohmic resistance before and after the long-term test (see Fig. S9, ESI†). The degradation is thus primarily due to the Ni foam electrodes and the stability of the AEMs can be considered to be good, even though further investigation on industrially relevant time scales and at high current density would be advantageous. Significant degradation of Ni-foam electrodes over 100 h has been previously reported,46 and different swelling and mechanical behavior of the membranes might be responsible for the different degradation rates.
In summary, the electrolysis test of the new AEMs showed a high current density and good stability over 100 h using only simple nickel foam electrodes and a low electrolyte concentration of 2 M KOH. Future investigations should focus on exploring the H2 crossover of the new membranes and the stability on industrial time scales.
Experimental
Materials
The following chemicals were used as received: meta-polybenzimidazole (PBI, kindly supplied by Blue World Technologies, Mw ≈ 70 kg mol−1), 2-(piperidin-4-yl)ethanol (TCI, 96%), sodium hydroxide (NaOH, VWR, 99%), acetonitrile (MeCN, Fisher, 99%), hydrobromic acid (HBr, Acros organics, 48%), 4,4-trimethylenebis(1-methylpiperidine) (Sigma-Aldrich, 97%), diethyl ether (Sigma-Aldrich, 99%), methyl iodide (MeI, Sigma-Aldrich, 99%), N-methyl-2-pyrrolidone (NMP, Sigma-Aldrich, 99%), 1,4-dibromobutane (Sigma-Aldrich, 98%), acetone (VWR, 99%), anhydrous dimethyl sulfoxide (anhydrous DMSO, Sigma-Aldrich, 99%), dimethyl sulfoxide (DMSO, Fisher, 99%), sodium hydride (NaH, Sigma-Aldrich, 60 wt% dispersion in mineral oil), sodium bromide (NaBr, VWR, 99%).Synthesis of monoPip and bisPip
In the synthesis of monoPip, 2-(piperidin-4-yl)ethanol (7.2 g, 55.7 mmol, 1 eq), NaOH (2.22 g, 55.5 mmol, 1 eq), and MeCN (50 ml) were added to a round bottom flask. The mixture was cooled to 0 °C and MeI (6.94 ml, 111.5 mmol, 2 eq.) was added dropwise to carry out the quaternization reaction. Next, the ice bath was then removed and the flask was covered with aluminum foil, before stirring the reaction mixture for 12 h at 25 °C. The mixture was then cooled to 0 °C for 1 h and filtered to remove MeCN. The white precipitate was then repeatedly washed with acetone to remove the byproduct NaI, and dried under vacuum to yield an intermediate compound (11.9 g, yield: 75%). The intermediate was transferred to a round bottom flask with HBr (50 ml, 48%) and stirred at 110 °C for 5 days. Afterwards, the mixture was cooled to 25 °C and filtered to remove black solids. The clear orange filtrate was evaporated under reduced pressure, and the dry residue washed with acetone and dried under vacuum to yield a pale yellow powder (monoPip, 6.8 g, approximate yield: 50%).To synthesize bisPip, 4,4′-trimethylenebis(1-methylpiperidine) (13.3 ml, 50 mmol, 1 eq.) was dissolved in diethyl ether (250 ml), and the solution was cooled down to 10 °C. The MeI (3.11 ml, 50 mmol, 1 eq.) dissolved in diethyl ether (50 ml) was added dropwise for 1 h, and the mixture was stirred at 10 °C for 6 h.1 The reaction was performed under dark conditions by protecting the reactor with aluminum foil due to the presence of the light sensitive MeI. Next, the white precipitate was washed with diethyl ether three times, and dried under vacuum to yield the intermediate compound (17.7 g, yield: 93%). Subsequently, the intermediate white powder (1.9 g, 5 mmol, 1 eq.) was dissolved in NMP (95 wt%, 35.1 ml), and the solution was heated to 70 °C. This solution was then added dropwise to 1,4-dibromobutane (5.9 ml, 50 mmol, 10 eq.) dissolved in NMP (95 wt%, 199.1 ml) for 30 min, and the mixture was then stirred at 70 °C for 24 h. Notably, 10 equivalents of 1,4-dibromobutane were used to prevent Menshutkin reaction at both ends of 1,4-dibromobutane. After that, the pale-yellow solution was poured into diethyl ether to precipitate the product (bisPip) as a yellow powder. To completely remove NMP and unreacted 1,4-dibromobutane, the product was washed with diethyl ether and acetone several times, and then dried in a vacuum desiccator (1.5 g, yield: 51%).
Tethering PBI with monoPip and bisPip
PBI was tethered with monoPip and bisPip, respectively, and the degree of functionalization was controlled by varying the ratio of the reactants. The relationship between the NaH![[thin space (1/6-em)]](https://www.rsc.org/images/entities/char_2009.gif) :
:![[thin space (1/6-em)]](https://www.rsc.org/images/entities/char_2009.gif) PBI ratio and the resulting IEC of monoPip can be seen in Fig. S10, ESI.† Below, the syntheses of PBI-monoPip-2.3 and PBI-bisPip-2.3 are given as examples. All the reactions were performed in a nitrogen atmosphere.
PBI ratio and the resulting IEC of monoPip can be seen in Fig. S10, ESI.† Below, the syntheses of PBI-monoPip-2.3 and PBI-bisPip-2.3 are given as examples. All the reactions were performed in a nitrogen atmosphere.
To synthesize PBI-monoPip-2.3, PBI (0.2 g, 0.65 mmol, 1 eq.) was dissolved in anhydrous DMSO (12 ml, 98.5 wt%) at 120 °C. After cooling the solution to 25 °C, NaH (0.103 g, 2.6 mmol, 4 eq.) was added to the solution and the mixture was stirred at 80 °C for 2 h. Bubbling of H2 gas was observed as the deprotonation of the N–H groups proceeded. Next, monoPip (0.82 g, 2.6 mmol, 4 eq.) dissolved in anhydrous DMSO (10 ml, 93 wt%) was added to the solution of deprotonated PBI. Immediately after addition, a deep red precipitation appeared, which gradually dissolved over 3 h. The reaction was kept at 80 °C for a total of 72 h. After cooling to 25 °C, the deep red solution was poured into acetone to precipitate the product. The collected brown powder (PBI-monoPip-2.3) was washed three times with acetone and water, and then dried in a vacuum desiccator (0.583 g, yield: 83%).
To synthesize PBI-bisPip-2.3, PBI (0.2 g, 0.65 mmol, 1 eq.) was dissolved in anhydrous DMSO (12 ml, 98.5 wt%) at 120 °C. After cooling the solution to 25 °C, NaH (0.042 g, 1 mmol, 1.6 eq.) was added and the mixture was stirred at 80 °C for 2 h. After the formation of H2 gas (bubbling) had stopped, bisPip (0.62 g, 1 mmol, 1.6 eq.) dissolved in anhydrous DMSO (10 ml, 94.7 wt%) was added to the solution of deprotonated PBI. Immediately after the addition, a brown precipitation appeared, which then completely dissolved at 80 °C over 72 h. After cooling to 25 °C, the brown solution was poured into acetone to precipitate the product. The collected brown powder (PBI-bisPip-2.3) was washed three times with acetone and water, and then dried in a vacuum desiccator (0.576 g, yield: 87%).
Membrane preparation
To prepare PBI-monoPip and PBI-bisPip membranes, each polymer sample (0.15 g) was dissolved in DMSO (6 ml, 97.8 wt%) at 80 °C for 24 h. Subsequently, each solution was passed through a syringe-driven filter (ϕ: 25 mm, Fluoropore membrane, 5 μm) into a glass Petri dish (ϕ: 40 mm). After casting, the membranes were vacuum-dried at 80 °C for up to 48 h to evaporate any remaining solvent residues. After peeling the membranes from the Petri dish, they were kept in 1 M aqueous NaBr solution before further characterization.Characterization techniques
MonoPip and bisPip and all the polymers were quantitatively analyzed by 1H NMR spectroscopy (Bruker DR X400 spectrometer, 400 MHz). The compounds were dissolved in D2O for the analysis of monoPip and bisPip, and DMSO-d6 for the PBI derivatives.Thermogravimetric analysis (TGA) was performed using a Q500 instrument from TA Instruments to analyze the thermal properties of the membranes in the temperature range 50–800 °C. Prior to the measurements, the samples were pre-heated at 120 °C for 20 min to remove traces of water. The weight loss was then recorded at a heating rate of 10 °C min−1 under a nitrogen flow rate of 40 mL min−1.
To analyze the nanostructure of the membranes, small angle X-ray scattering (SAXS) was measured using a SAXSLAB instrument (JJ X-ray Systems Aps) with copper Kα radiation (wavelength: 0.154 nm). The SAXS measurements were performed under dry conditions in the q range 0.5–6.7 nm−1. In addition, atomic force microscopy (AFM) was used to investigate the morphology of the membranes using a Bruker Dimension Icon microscope. All samples were measured in tapping phase and surface topological modes under ambient conditions.
The electrolyte solution uptake was calculated from the difference between the dry and immersed weights of the membranes. The electrolyte uptake was determined using eqn (3):
 | (3) |
To determine the weightwet, the membranes were immersed in the electrolyte solution for at least 24 h.
Swelling of the membranes was determined from the dimensional change between the dry and immersed membranes. In-plane and through-plane swelling were calculated using eqn (4) and (5), respectively:
 | (4) |
 | (5) |
To determine the widthwet and thicknesswet, the membranes were immersed in the electrolyte solution for at least 24 h.
The in-plane ion conductivity in water was measured using a Novocontrol high resolution dielectric analyzer V 1.01S at an amplitude of 50 mV. Stainless steel electrodes were clamped onto the sample on opposite sides in a PTFE and brass test cell and water was added to immerse the membrane. Prior to measurement, the membranes in Br− form were first exchanged to the OH− form by immersion in 1 M aqueous KOH solution for at least 2 days, then thoroughly washed with degassed distilled water.
The method to measure the conductivity of membranes immersed in KOH solution was adapted from that reported by Xia et al.47 The impedance was measured through-plane using a Gamry Reference 600 at an amplitude of 10 mV, using a two-compartment PTFE cell filled with 2 M aqueous KOH using perforated Ni plates as electrodes. Temperature control was achieved by placing the cell in a heated sand bath. To ensure sufficient cell equilibration, measurements were performed every 30 min until a stable impedance was recorded. Prior to the measurements, the membranes were ion exchanged to the OH− form by immersion in 2 M aqueous KOH for 2 weeks, changing the solution every three days. Thicknesses used for the conductivity calculations were measured in the wet form before cell assembly.
The alkaline stability of the membranes was assessed by studying the changes in chemical structure via1H NMR spectroscopy. Samples were stored in sealed PTFE vials containing 2 M aq. KOH solution in an oven at 80 °C for up to 6 months. Samples were taken out at different time intervals, exchanged to the Br− form, and then washed and dried before dissolution in DMSO-d6 for the NMR analysis.
AEMWE measurement
The membranes were tested in an electrolysis cell to assess their performance and stability under real operating conditions. Each membrane was tested in duplicate and the results averaged. The cell, as well as the test station, has been described in detail previously.41The membranes used in the test had a dry thickness of 80 μm. They were soaked in 2 M KOH in an oven at 80 °C for 6 h and then mounted in the cells. After connecting the cells to the test station, an electrolyte flow of 50 ml min−1 for each electrode was set and the cells were heated to 80 °C and then left for temperature stabilization for 2 h. The cells were conditioned by holding them at 1.7 V for 20 h. The conditioning is crucial for good reproducibility and comparability.41
After 30 s at open circuit, a polarization curve was recorded by holding a current of 0.2, 1, 2, 5, 10, 15, 50, 75, 100, 200, 300, 400, and 500 mA cm−2 for one minute each. The measured voltage was averaged over the last five seconds of each current step. A galvanostatic impedance measurement was performed at the 10 mA cm−2 step, with a frequency range from 6.7 kHz to 100 mHz, an amplitude of 1 mA cm−2 and 5 measurements per frequency. The impedance data were fitted in the Biologic BT-Lab Software using a R1 + Q2/R2 + Q3/R3 equivalent circuit. R1 was taken as the estimate for the membrane resistance, even though it includes other ohmic contributions. The specific conductivity of the membranes was calculated using the dry thickness of the membranes corrected for the swelling in thickness as reported in Fig. S6 (ESI†). Selected cells were finally subjected to a stability test at 200 mA cm−2 for 100 h.
As a benchmark for comparison, PBI and Zirfon were also evaluated. Before mounting, the PBI membrane (supplied by Blue World Technologies, formerly Danish Power Systems, 40 μm thickness) was kept in de-ionized water at 90 °C for 4 h, and then immersed into 2 M KOH at room temperature for 20 h. Zirfon Perl UTP 500 (Agfa-Gevaert N.V.) was used as received and surrounded by a 450 μm thick PTFE gasket to compensate for the added thickness.
Conclusions
PBI membranes have so far been mainly applied in high concentration electrolyte-fed AEMWEs because their electrolyte uptake is highly concentration-dependent. Under these harsh conditions, the membranes are easily degraded, which motivates the use of dilute electrolyte solutions. In the present work, PBI membranes were tethered with monoPip and bisPip groups, respectively, and evaluated for dilute electrolyte-fed AEMWEs. The side group precursors (monoPip and bisPip) were synthesized in simple two-step procedures and then separately grafted onto the PBI backbone. AFM phase images revealed that PBI-bisPip membranes possessed larger ionic domains than the PBI-monoPip ones. Hence, PBI-bisPip membranes also showed higher electrolyte uptake and swelling than PBI-monoPip membranes at a given IEC. In contrast to pristine PBI, the electrolyte uptake and swelling of the present AEMs were inversely proportional to the electrolyte concentration. This suggests that the cation-tethered membranes are suitable for dilute electrolyte-fed AEMWEs. When it comes to alkaline stability, the PBI-monoPip membranes were highly stable in 2 M KOH at 80 °C, whereas two types of Hofmann β-elimination, leading to ring-opening and alkyl chain scission, respectively, were detected for the PBI-bisPip membranes. Nevertheless, the total ionic loss of PBI-bisPip membranes was merely 7% after 6 months. The high stability of the membranes was also verified in an electrolysis measurement over 100 h. In agreement with the ex situ characterization, PBI-bisPip-2.5 showed the highest current density at 358 mA cm−2 at 2 V using only plain nickel foam as electrodes. This study provides fundamental insights into the electrolyte concentration-dependent behaviour of cation-tethered AEMs, as well as an introduction to PBI-monoPip and PBI-bisPip membranes. We believe that this study is a useful guide for the molecular design of AEMs for dilute electrolyte-fed AEMWEs.Conflicts of interest
The authors of this manuscript declare that there are no conflicts of interest.Acknowledgements
This work was done as part of the materials for next generation alkaline electrolyzers (NEXTAEC) project, which is funded by European Union's Horizon 2020 research and innovation programme. The PBI sample was gratefully received from Blue World Technologies. We also thank Mikkel Rykaer Kraglund and Yifan Xia at DTU for helpful discussions and assistance concerning through-plane conductivity measurements.References
- D. Li, E. J. Park, W. Zhu, Q. Shi, Y. Zhou, H. Tian, Y. Lin, A. Serov, B. Zulevi, E. D. Baca, C. Fujimoto, H. T. Chung and Y. S. Kim, Nat. Energy, 2020, 5, 378–385 CrossRef CAS.
- D. Li, A. R. Motz, C. Bae, C. Fujimoto, G. Yang, F.-Y. Zhang, K. E. Ayers and Y. S. Kim, Energy Environ. Sci., 2021, 14, 3393–3419 RSC.
- N. Chen, S. Y. Paek, J. Y. Lee, J. H. Park, S. Y. Lee and Y. M. Lee, Energy Environ. Sci., 2021, 14, 6338–6348 RSC.
- R. A. Krivina, G. A. Lindquist, S. R. Beaudoin, T. N. Stovall, W. L. Thompson, L. P. Twight, D. Marsh, J. Grzyb, K. Fabrizio, J. E. Hutchison and S. W. Boettcher, Adv. Mater., 2022, 34, e2203033 CrossRef PubMed.
- C. Li and J.-B. Baek, Nano Energy, 2021, 87 CAS.
- C. Niether, S. Faure, A. Bordet, J. Deseure, M. Chatenet, J. Carrey, B. Chaudret and A. Rouet, Nat. Energy, 2018, 3, 476–483 CrossRef CAS.
- W. E. Mustain and P. A. Kohl, Nat. Energy, 2020, 5, 359–360 CrossRef CAS.
- F. Razmjooei, T. Morawietz, E. Taghizadeh, E. Hadjixenophontos, L. Mues, M. Gerle, B. D. Wood, C. Harms, A. S. Gago, S. A. Ansar and K. A. Friedrich, Joule, 2021, 5, 1776–1799 CrossRef CAS.
- M. R. Kraglund, M. Carmo, G. Schiller, S. A. Ansar, D. Aili, E. Christensen and J. O. Jensen, Energy Environ. Sci., 2019, 12, 3313–3318 RSC.
- M. R. Kraglund, D. Aili, K. Jankova, E. Christensen, Q. Li and J. O. Jensen, J. Electrochem. Soc., 2016, 163, F3125–F3131 CrossRef CAS.
- D. Aili, A. G. Wright, M. R. Kraglund, K. Jankova, S. Holdcroft and J. O. Jensen, J. Mater. Chem. A, 2017, 5, 5055–5066 RSC.
- D. Aili, M. K. Hansen, R. F. Renzaho, Q. Li, E. Christensen, J. O. Jensen and N. J. Bjerrum, J. Membr. Sci., 2013, 447, 424–432 CrossRef CAS.
- D. Aili, J. Yang, K. Jankova, D. Henkensmeier and Q. Li, J. Mater. Chem. A, 2020, 8, 12854–12886 RSC.
- G. Zhang, R. Li, X. Wang, X. Chen, Y. Shen and Y. Fu, Sep. Purif. Technol., 2022, 291 Search PubMed.
- D. Serhiichuk, T. Patniboon, Y. Xia, M. R. Kraglund, J. O. Jensen, H. A. Hansen and D. Aili, ACS Appl. Polym. Mater., 2022, 5, 803–814 CrossRef.
- Y. Wang, X. Qiao, M. Liu, L. Liu and N. Li, J. Membr. Sci., 2021, 626 Search PubMed.
- X. Wang, J. Li, W. Chen, B. Pang, Y. Liu, Y. Guo, X. Wu, F. Cui and G. He, ACS Appl. Mater. Interfaces, 2021, 13, 49840–49849 CrossRef CAS PubMed.
- B. Lin, F. Xu, Y. Su, J. Han, Z. Zhu, F. Chu, Y. Ren, L. Zhu and J. Ding, ACS Appl. Energy Mater., 2019, 3, 1089–1098 CrossRef.
- J.-K. Jang, S.-W. Jo, J. W. Jeon, B. G. Kim, S. J. Yoon, D. M. Yu, Y. T. Hong, H.-T. Kim and T.-H. Kim, ACS Appl. Energy Mater., 2021, 4, 4672–4685 CrossRef CAS.
- X. Wang, W. Chen, X. Yan, T. Li, X. Wu, Y. Zhang, F. Zhang, B. Pang and G. He, J. Power Sources, 2020, 451 CAS.
- M. G. Marino and K. D. Kreuer, ChemSusChem, 2015, 8, 513–523 CrossRef CAS PubMed.
- J. Xue, J. Zhang, X. Liu, T. Huang, H. Jiang, Y. Yin, Y. Qin and M. D. Guiver, Electrochem. Energy Rev., 2021, 5, 348–400 CrossRef.
- N. Chen and Y. M. Lee, Prog. Polym. Sci., 2021, 113 Search PubMed.
- N. Chen, Y. Jin, H. Liu, C. Hu, B. Wu, S. Xu, H. Li, J. Fan and Y. M. Lee, Angew Chem. Int. Ed., 2021, 60, 19272–19280 CrossRef CAS PubMed.
- A. Allushi, T. H. Pham and P. Jannasch, J. Membr. Sci., 2021, 632 Search PubMed.
- T. H. Pham, A. Allushi, J. S. Olsson and P. Jannasch, Polym. Chem., 2020, 11, 6953–6963 RSC.
- D. Pan, T. H. Pham and P. Jannasch, ACS Appl. Energy Mater., 2021, 4, 11652–11665 CrossRef CAS.
- A. Vasilev, T. Deligeorgiev, N. Gadjev and K.-H. Drexhage, Dyes Pigm., 2005, 66, 135–142 CrossRef CAS.
- A. Z. Al Munsur, J. Lee, J. E. Chae, H.-J. Kim, C. H. Park, S. Y. Nam and T.-H. Kim, J. Membr. Sci., 2022, 643 Search PubMed.
- C. Long, T. Zhao, L. Tian, Q. Liu, F. Wang, Z. Wang and H. Zhu, ACS Appl. Energy Mater., 2021, 4, 6154–6165 CrossRef CAS.
- M. Li, G. Zhang, H. Zuo, M. Han, C. Zhao, H. Jiang, Z. Liu, L. Zhang and H. Na, J. Membr. Sci., 2012, 423–424, 495–502 CrossRef CAS.
- M. Okamoto, T. Fujigaya and N. Nakashima, Adv. Funct. Mater., 2008, 18, 1776–1782 CrossRef CAS.
- X. Luo, S. Rojas-Carbonell, Y. Yan and A. Kusoglu, J. Membr. Sci., 2020, 598 CAS.
- K. H. Lee, D. H. Cho, Y. M. Kim, S. J. Moon, J. G. Seong, D. W. Shin, J.-Y. Sohn, J. F. Kim and Y. M. Lee, Energy Environ. Sci., 2017, 10, 275–285 RSC.
- S. S. He and C. W. Frank, J. Mater. Chem. A, 2014, 2, 16489–16497 RSC.
- K. M. Beers, D. T. Hallinan, X. Wang, J. A. Pople and N. P. Balsara, Macromolecules, 2011, 44, 8866–8870 CrossRef CAS.
- M. Najibah, E. Tsoy, H. Khalid, Y. Chen, Q. Li, C. Bae, J. Hnát, M. Plevová, K. Bouzek, J. H. Jang, H. S. Park and D. Henkensmeier, J. Membr. Sci., 2021, 640 Search PubMed.
- D. Aili, K. Jankova, Q. Li, N. J. Bjerrum and J. O. Jensen, J. Membr. Sci., 2015, 492, 422–429 CrossRef CAS.
- Q. Ge, J. Ran, J. Miao, Z. Yang and T. Xu, ACS Appl. Mater. Interfaces, 2015, 7, 28545–28553 CrossRef CAS PubMed.
- J. Kamcev, D. R. Paul and B. D. Freeman, Desalination, 2018, 446, 31–41 CrossRef CAS.
- C. Karacan, F. P. Lohmann-Richters, G. P. Keeley, F. Scheepers, M. Shviro, M. Müller, M. Carmo and D. Stolten, Int. J. Hydrogen Energy, 2022, 47, 4294–4303 CrossRef CAS.
- M. T. de Groot and A. W. Vreman, Electrochim. Acta, 2021, 369, 137684 CrossRef CAS.
- L. Bertuccioli, A. Chan, D. Hart, F. Lehner, B. Madden and E. Standen, Fuel cells and hydrogen joint undertaking, 2014 Search PubMed.
- P. Shirvanian, A. Loh, S. Sluijter and X. Li, Electrochem. Commun., 2021, 132, 107140 CrossRef CAS.
- J. Xiao, A. M. Oliveira, L. Wang, Y. Zhao, T. Wang, J. Wang, B. P. Setzler and Y. Yan, ACS Catal., 2020, 11, 264–270 CrossRef.
- C. Karacan, F. P. Lohmann-Richters, M. Shviro, G. P. Keeley, M. Müller, M. Carmo and D. Stolten, J. Electrochem. Soc., 2022, 169, 054502 CrossRef CAS.
- Y. Xia, S. C. Rajappan, D. Serhiichuk, M. R. Kraglund, J. O. Jensen and D. Aili, J. Membr. Sci., 2023, 680, 121719 CrossRef CAS.
Footnotes |
| † Electronic supplementary information (ESI) available. See DOI: https://doi.org/10.1039/d3ta03216g |
| ‡ These authors contributed equally to this work. |
| § Present address: Chemistry and Nanoscience Center, National Renewable Energy Laboratory (NREL), Golden, CO, 80401 United States. |
| This journal is © The Royal Society of Chemistry 2023 |

