
 Open Access Article
 This Open Access Article is licensed under a
 Creative Commons Attribution 3.0 Unported Licence
Exploring the impact of lithium halide-based redox mediators in suppressing CO2 evolution in Li–O2 cells†
Sri Harsha
Akella
a,
Muniyandi
Bagavathi
a,
Rosy
b,
Daniel
Sharon
c,
Capraz
Ozgur
 d and
Malachi
Noked
*a
d and
Malachi
Noked
*a
aDepartment of Chemistry, Bar-Ilan Institute of Nanotechnology and Advanced Materials, Ramat Gan, 529002, Israel. E-mail: Malachi.Noked@biu.ac.il
bDepartment of Chemistry, Indian Institute of Technology (Banaras Hindu University), Varanasi, Uttar Pradesh 221005, India. E-mail: rosy.chy@iitbhu.ac.in
cThe Institute of Chemistry, The Hebrew University of Jerusalem, Jerusalem, 9190401, Israel. E-mail: daniel.sharon@mail.huji.ac.il
dThe School of Chemical Engineering, Oklahoma State University, Stillwater, Oklahoma 74078, USA. E-mail: ocapraz@okstate.edu
First published on 16th August 2023
Abstract
The realization of lithium–oxygen (Li–O2) batteries has been impeded by parasitic reactions that cause cell component degradation, often accompanied by the release of CO2 gas during oxidation reactions. The use of halide-based redox mediators (RMs) like LiBr and LiI has been proposed as a strategy to reduce overpotentials during oxygen evolution reactions and thus suppress the subsequent evolution of CO2. However, there is a scarcity of research examining the effectiveness of these RMs in the direct mitigation of parasitic reactions. In this study, we investigated the evolution of CO2 during the oxidation processes using an online electrochemical mass spectrometer. The results show that cells without RMs exhibited high overpotentials and significant CO2 evolution from the first charging cycle. In contrast, the addition of 50 mM LiI to the electrolyte resulted in a delay in CO2 evolution, observed only after several cycles. Notably, no CO2 evolution was observed in cells containing 50 mM LiBr in 0.5 M LiTFSI during the cell cycling. Our findings demonstrate that while the mechanism of halide-based RMs may be similar, their chemical properties and electrochemical behaviour can greatly influence their ability to effectively mediate the oxygen evolution process.
 Malachi Noked | Prof. Noked, a PhD graduate of Bar-Ilan University under Prof. Aurbach, is an accomplished researcher in energy storage materials. As a Fulbright Ilan-Ramon fellow, he conducted postdoctoral research at the University of Maryland. Returning to Bar-Ilan in 2016, he established a research group of 25 researchers focused on energy storage and ALD surface modifications. He leads the US-IL Energy Storage Consortium and serves as director of the Batteries Research Lab at the Israeli National Energy Center. Prof. Noked has received numerous prestigious awards for energy research, including the Krill Prize of the Wolf Foundation (2019), the Climate Solutions Prize Award (2022), and the Guy Sella Research Prize in Energy (2023). |
Introduction
Lithium–oxygen (Li–O2) battery technology underwent a tremendous push for practical realization because of its high theoretical gravimetric energy density which is 3–5 times higher when compared with conventional lithium-ion batteries.1–4 However, commercialization was hindered because of poor reversible capacity, low-rate capability, poor cycle life and round-trip efficiency.5–8 These limitations are mainly because of unavoidable intermediate parasitic reactions occurring at electrode–electrolyte interphases during cycling.9–11 In non-aqueous Li–O2 cells, the O2 electrochemistry consists of an overall two-electron transfer (2e−) producing solid lithium peroxide (Li2O2) during discharge.3,12–16 Upon charging the oxygen evolution reaction (OER) occurs with oxidation of the non-conductive Li2O2 species.17,18 Parasitic chemical reactions which are accompanied with early cell failure are as follows: (1) parasitic reactions associated with the oxidation of lithium peroxide and formation of reactive intermediates during charging such as decomposition of electrolyte because of reactive oxygen species at the electrode electrolyte interphase. (2) Instabilities associated with carbon cathode at higher voltages. (3) Degradations associated with lithium anode.19–22 Several reports proposed using stationary heterogeneous catalysts coated on carbon cathode to suppress the parasitic reactions during Li–O2 battery cycling. However, the performance of conventional stationary catalysts is limited since they are only effective for ORR products that come into direct contact with them. Furthermore, many of these catalysts can enhance additional side reactions such as carbon and electrolyte solution decomposition which negatively impacts the overall battery life.23,24 In this regard, soluble electrocatalysts or redox mediators (RM) can diffuse through the interphases to oxidize the insulating Li2O2 product layer.25–28 During charging, RM itself first gets oxidized at the electrode to form an oxidized species, which then chemically oxidizes the Li2O2 to evolve O2.29–31 Liang et al. proposed LiBr as RM for improved electrochemical performance without necessarily changing the two electron transfer process during discharge (ORR).31 Nevertheless, the cells containing LiBr resulted in CO2 evolution during OER process maybe due to formation of corrosive, free bromine (Br2).31 Kwak et al. has conducted systematic electrochemical study using electrolyte with and without RM's specifically LiI and LiBr.23,31 They demonstrated improved electrochemical stability for Li–O2 cells containing LiBr as RM. However little research was known about the influence of RM on suppressing the parasitic reactions accompanied with CO2 evolution during OER process. Therefore, it is important to monitor the CO2 gas evolution using online electrochemical mass spectrometer (OEMS) to decipher the role and impact of RMs in imparting interfacial stability needed for prolonged cycling.Herein, we conducted a systematic study to examine the extent of CO2 evolution from a diglyme based Li–O2 cell in presence and absence of LiI and LiBr RMs. Long term monitoring of CO2 evolution was conducted using OEMS, to follow the evolvement and evolution of CO2 over time and not only during the 1st cycle. Upon cycling the cells without RMs experienced severe electrochemical instabilities because of high overpotential behaviour. Both RMs showed initial suppression of CO2 evolution, however on longer term cycling, the LiBr showed profound advantage over the LiI in terms of CO2 suppression. Our results highlight the consequences of differences in chemical properties of RMs, even if they exhibit similar influence on the overpotential of the cell. We find that addition of lithium bromide RM can greatly improve the electrochemical properties and effectively mediate the oxygen evolution process.
Results and discussion
Cyclic voltammetry is conducted for neat 0.5 M LiTFSI base solution in diglyme with/without addition of 50 mM LiI or 50 mM LiBr halide based RMs. Fig. 1a shows the cyclic voltammograms observed for the proposed electrolytes under Ar atmosphere. As previously reported, 0.5 M LiTFSI in diglyme does not show any kind of redox behaviour. However the cathodic scan of the cyclic voltammogram shows low-intensity peaks at ∼2 V indicating reduction of some species in the electrolyte (Fig. S1†).32,33 Tułodziecki et al. suggests that the Li+ cation preferentially adsorb on the carbon surface and drag the TFSI− anions with them, facilitating their reduction.34–36 A similar electrochemical activity was observed in the galvanostatic discharge and charge profiles for neat 0.5 M LiTFSI electrolyte solution as shown in Fig. 1b. The cells with 0.5 M LiTFSI electrolyte solution discharge to 2 V very fast with negligible capacity and charged with steep raise in voltage to 4.2 V. With addition of 50 mM LiI to the 0.5 M LiTFSI base solution the cyclic voltammogram exhibited two oxidation processes during the anodic scan. The first oxidation process in the anodic scan is attribute to the conversion of iodide ion to triiodide ion (I− → I3−) at ∼3.1 V, whereas the second oxidation process is due to conversion of triiodide ion to iodine (I3− → I2) at ∼3.8 V. This phenomenon is more evident during the galvanostatic charge profiles (Fig. 1b) where the RM undergoes two oxidation processes with two representative voltage plateaus. The first voltage plateau during charge occurs at ∼3.1 V indicating the first oxidation process (I− → I3−). After steep increase in the voltage, a second voltage plateau is appearing at ∼3.8 V, implying the second oxidation process (I3− → I2).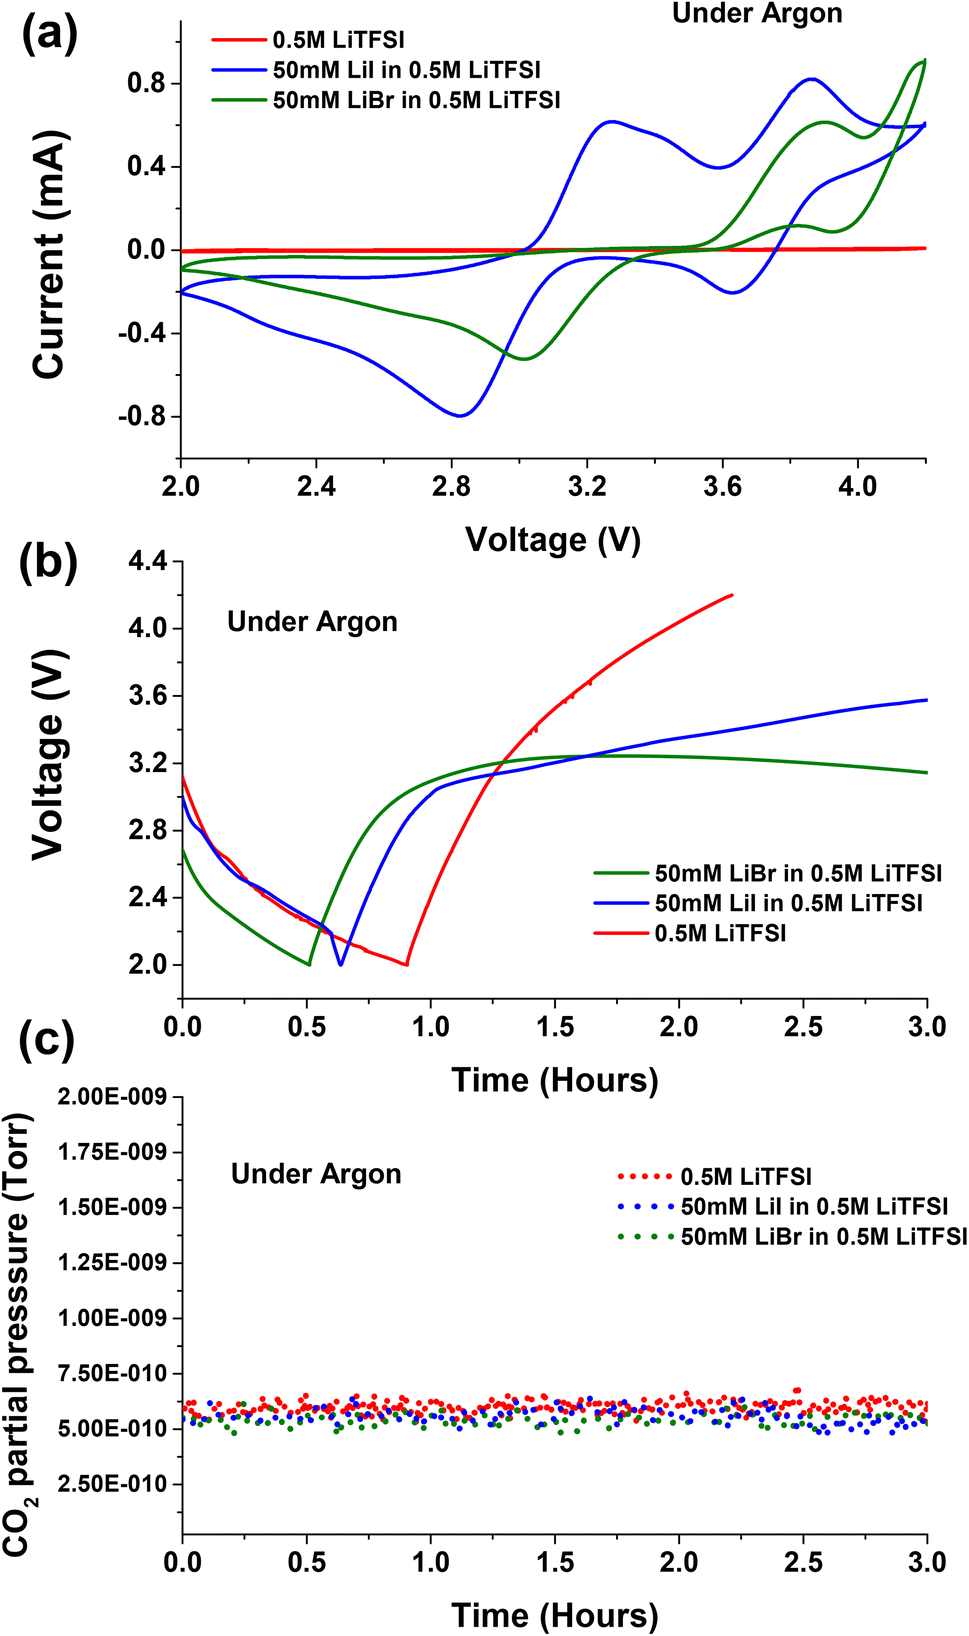 | ||
| Fig. 1 (a) Cyclic voltammetry (5 mV s−1) on Pt working electrode under argon atmosphere for 0.5 M LiTFSI, 50 mM LiI in 0.5 M LiTFSI, and 50 mM LiBr in 0.5 M LiTFSI in diglyme; (b) voltage profiles during galvanostatic discharge and charge under Argon for cells with lithium anode against carbon cathode separated with glass fibre separator with 0.5 M LiTFSI, 50 mM LiI in 0.5 M LiTFSI and 50 mM LiBr in 0.5 M LiTFSI in diglyme electrolytes, current density was fixed at 0.052 mA cm−2 (OCV not shown) (c) the corresponding normalized carbon dioxide gas evolutions monitored in OEMS. | ||
When 50 mM LiBr was added to the 0.5 M LiTFSI base solution, the cyclic voltammetry exhibited higher oxidation potentials with respect to cells containing LiI as RM. The first oxidation process of bromide ion to tribromide ion occurs at ∼3.5 V (Br− → Br3−), while the second oxidation process of tribromide ion to bromine started from ∼4 V (Br3− → Br2). These results are consistent with previous report for LiBr and LiI RMs.23Fig. 1b shows the galvanostatic discharge and charge cycle for the cells containing LiBr RM. In Ar environment the cells exhibited negligible capacity when discharged to 2 V. The subsequent charge voltage profile exhibits a voltage plateau at ∼3.2 V indicating the oxidation of Br− → Br3−. As suggested by cyclic voltammogram, LiBr containing cells requires high overpotentials for the second oxidation process tribromide ion to bromine (Br3− → Br2) with respect to cells containing LiI as RM.
Fig. 2a–c presents the voltage profiles of 0.5 M LiTFSI, 50 mM LiI in 0.5 M LiTFSI, and 50 mM LiBr in 0.5 M LiTFSI in diglyme solutions cycled under O2 atmosphere. The first discharge voltage profile at ∼2.8 V is attributed to oxygen reduction reaction on the porous carbon cathode and formation of Li-peroxide species. Scanning electron microscopic imaging studies show the well reported Li2O2 coagulation on porous carbon cathode (Fig. S2†). Also, cells with neat 0.5 M LiTFSI electrolyte and LiBr containing additive favours the formation of Li2O2 which is supported by the presence of diffraction peaks at 2θ: ∼33, ∼35 in the X-ray diffractograms of the discharged cathodes (Fig. 3a). Whereas cells with 50 mM LiI addition clearly exhibit LiOH phases at 2θ: ∼32.7 and ∼36.23,37,38 Further, ATR-FTIR characterization (Fig. S3†) shows the presence of –OH vibration indicating the formation LiOH in case of LiI containing cells. These results are consistent with the findings of Zhou et al. where they demonstrated the formation of LiOH with increasing LiI concentration in the cells.23,39
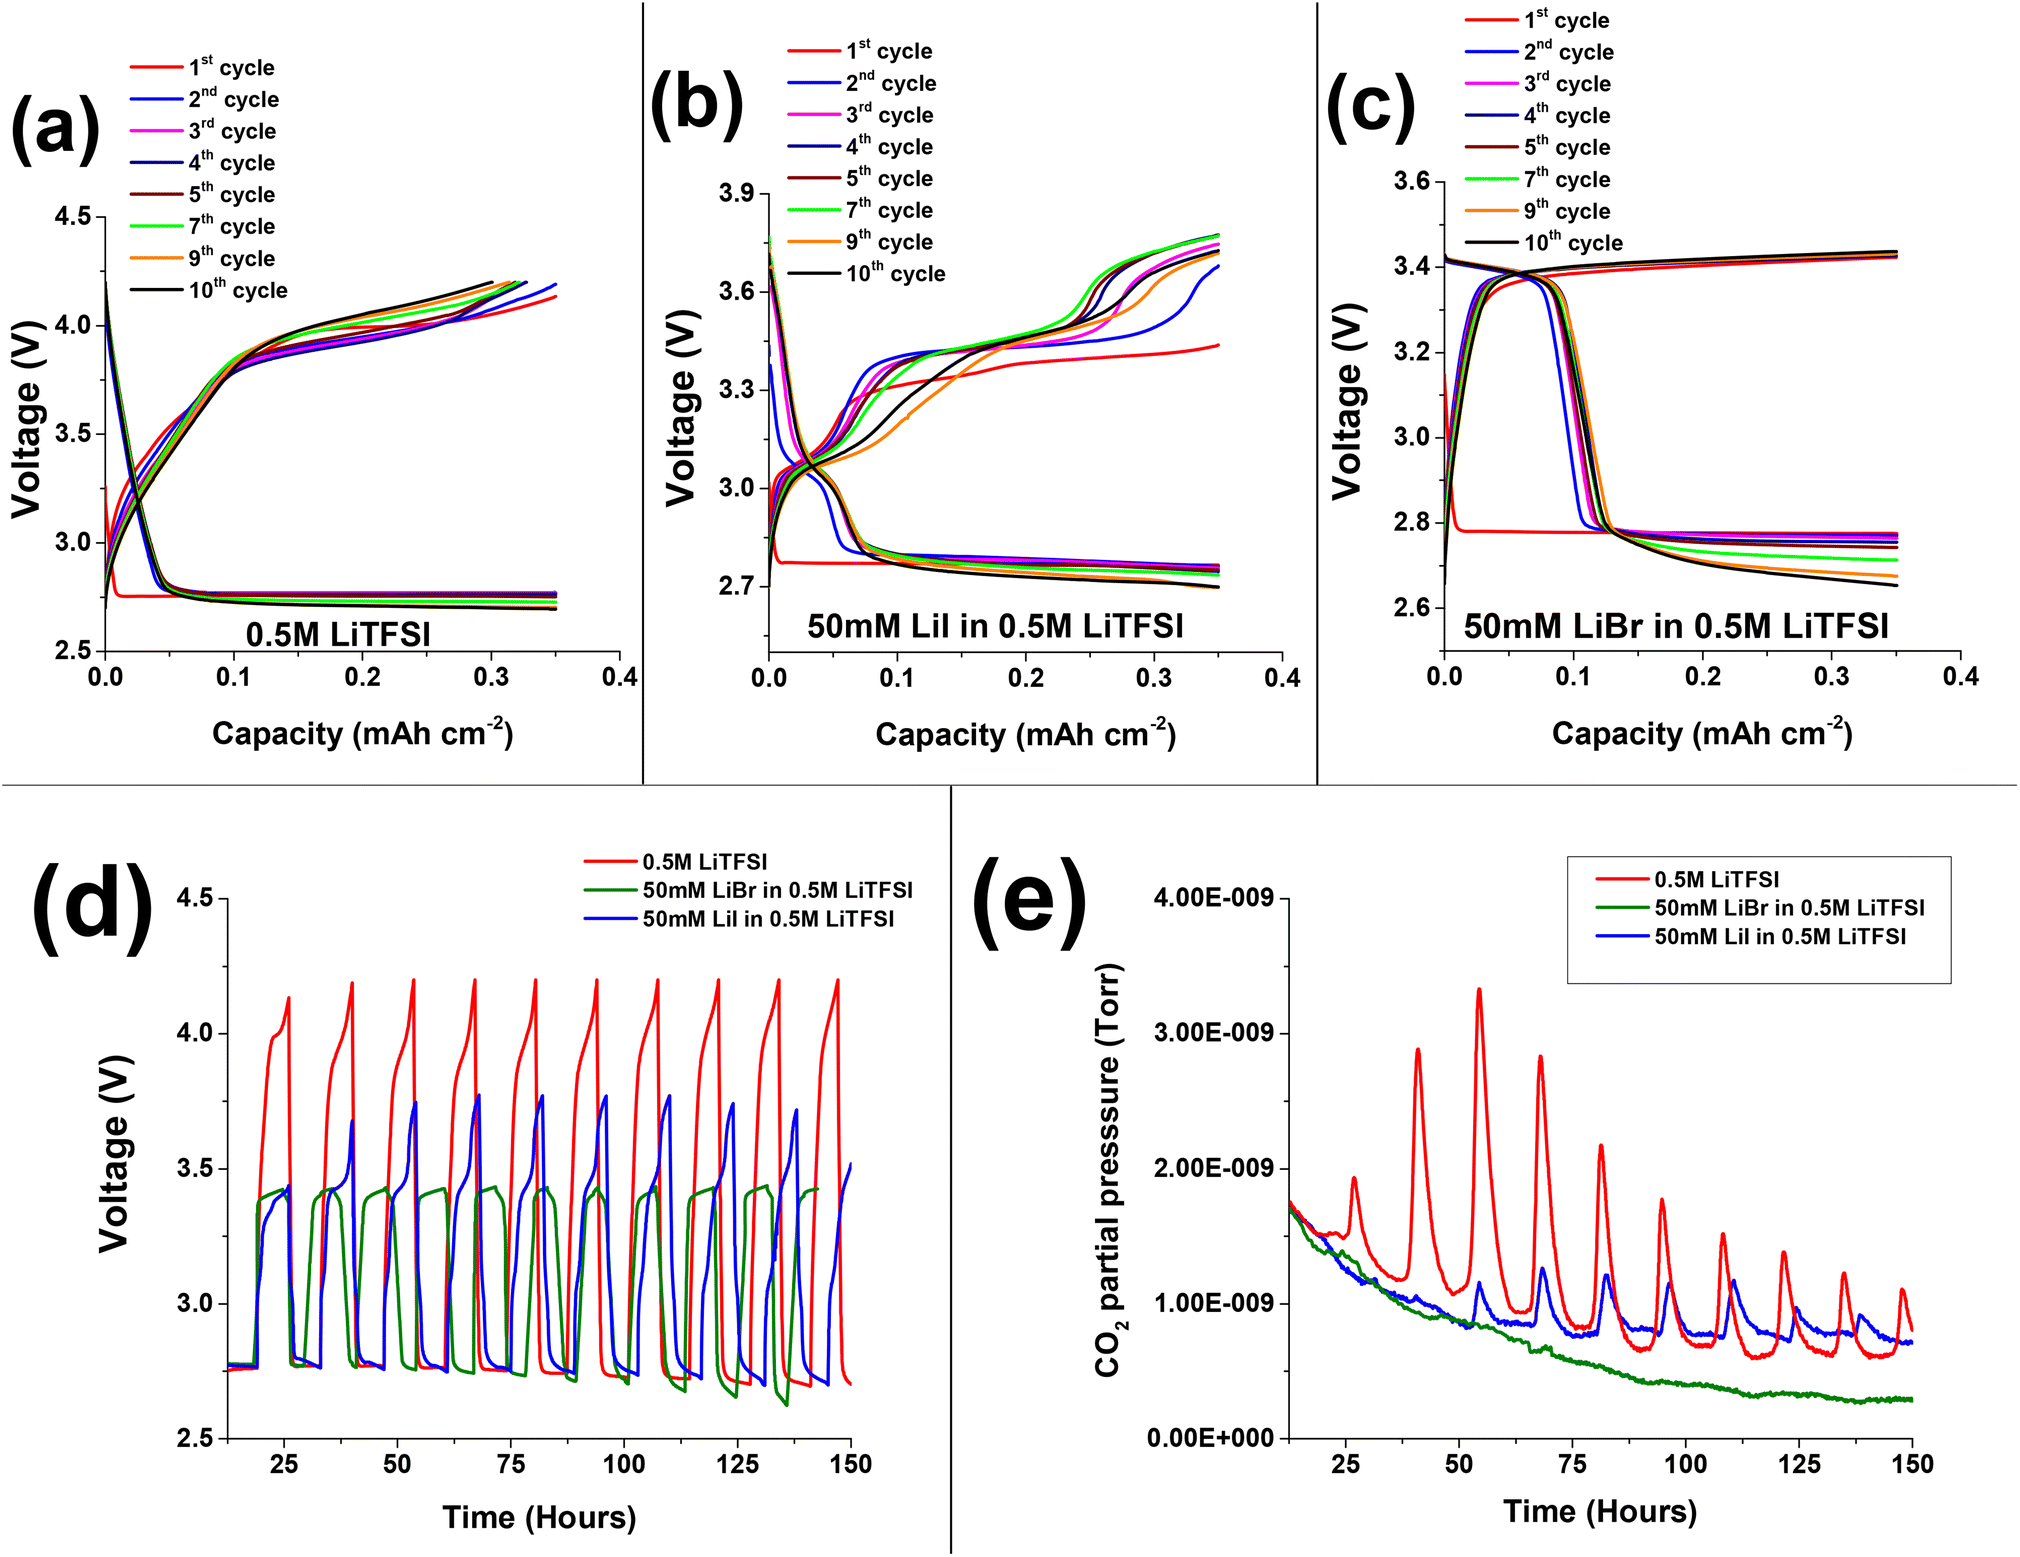 | ||
| Fig. 2 Voltage vs. specific discharge capacity profiles of Li–O2 cells during prolonged galvanostatic cycling under oxygen atmosphere: (a) 0.5 M LiTFSI (b) 50 mM LiBr in 0.5 M LiTFSI (c) 50 M LiI in 0.5 M LiTFSI in diglyme solutions. Current density was fixed at 0.052 mA cm−2. (d) Overlayed time vs. voltage profiles of Li–O2 cell for 0.5 M LiTFSI, 50 mM LiI in 0.5 M LiTFSI, 50 M LiBr in 0.5 M LiTFSI in diglyme electrolytes and (e) the corresponding CO2 gas evolutions monitored in OEMS. | ||
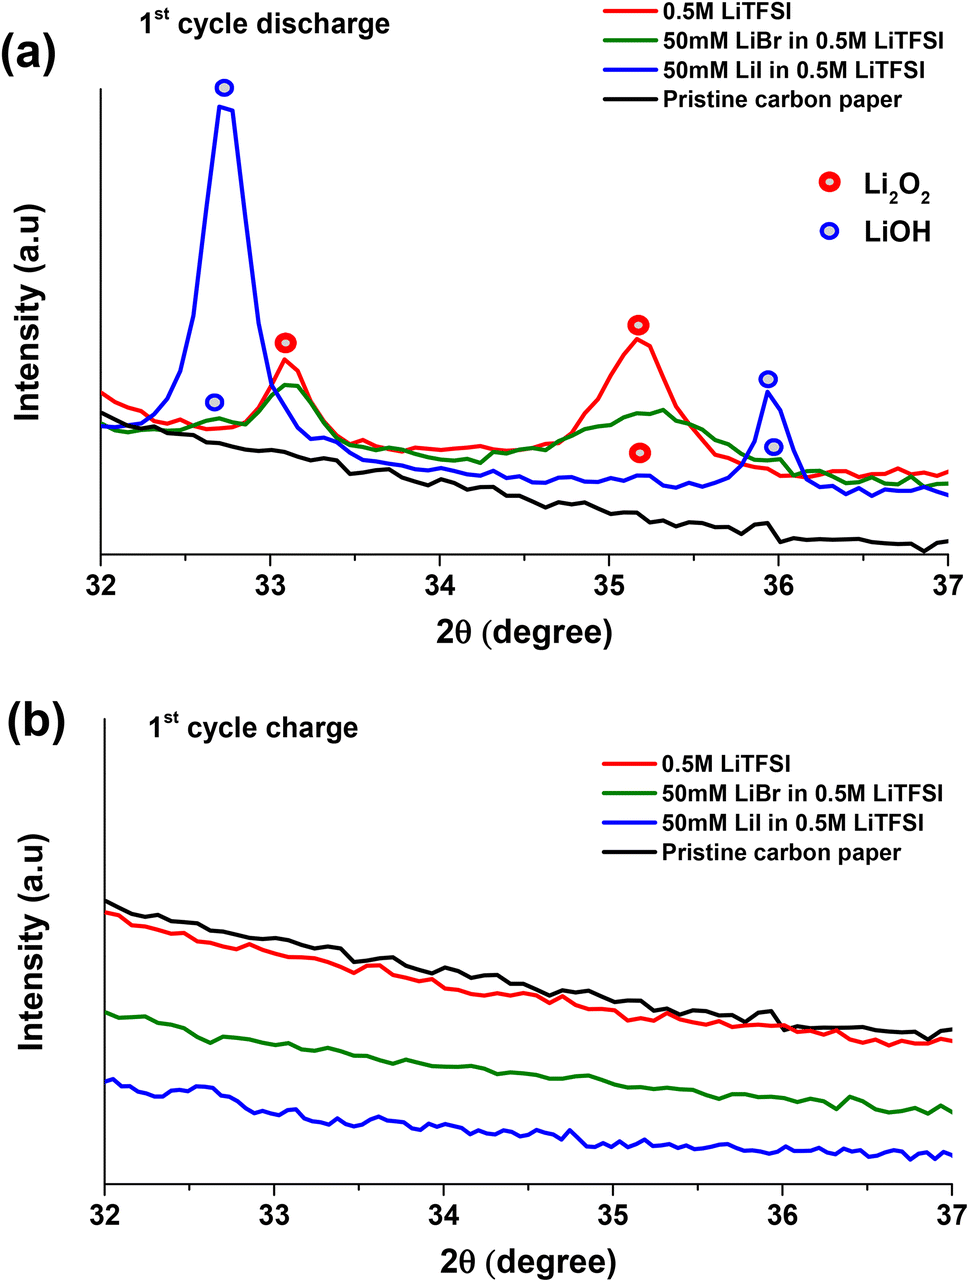 | ||
| Fig. 3 X-ray diffraction spectra of Li–O2 cells with 0.5 M LiTFSI, 50 mM LiI in 0.5 M LiTFSI and 50 mM LiBr in 0.5 M LiTFSI in diglyme solutions after (a) first cycle discharge and (b) the subsequent charge under O2. | ||
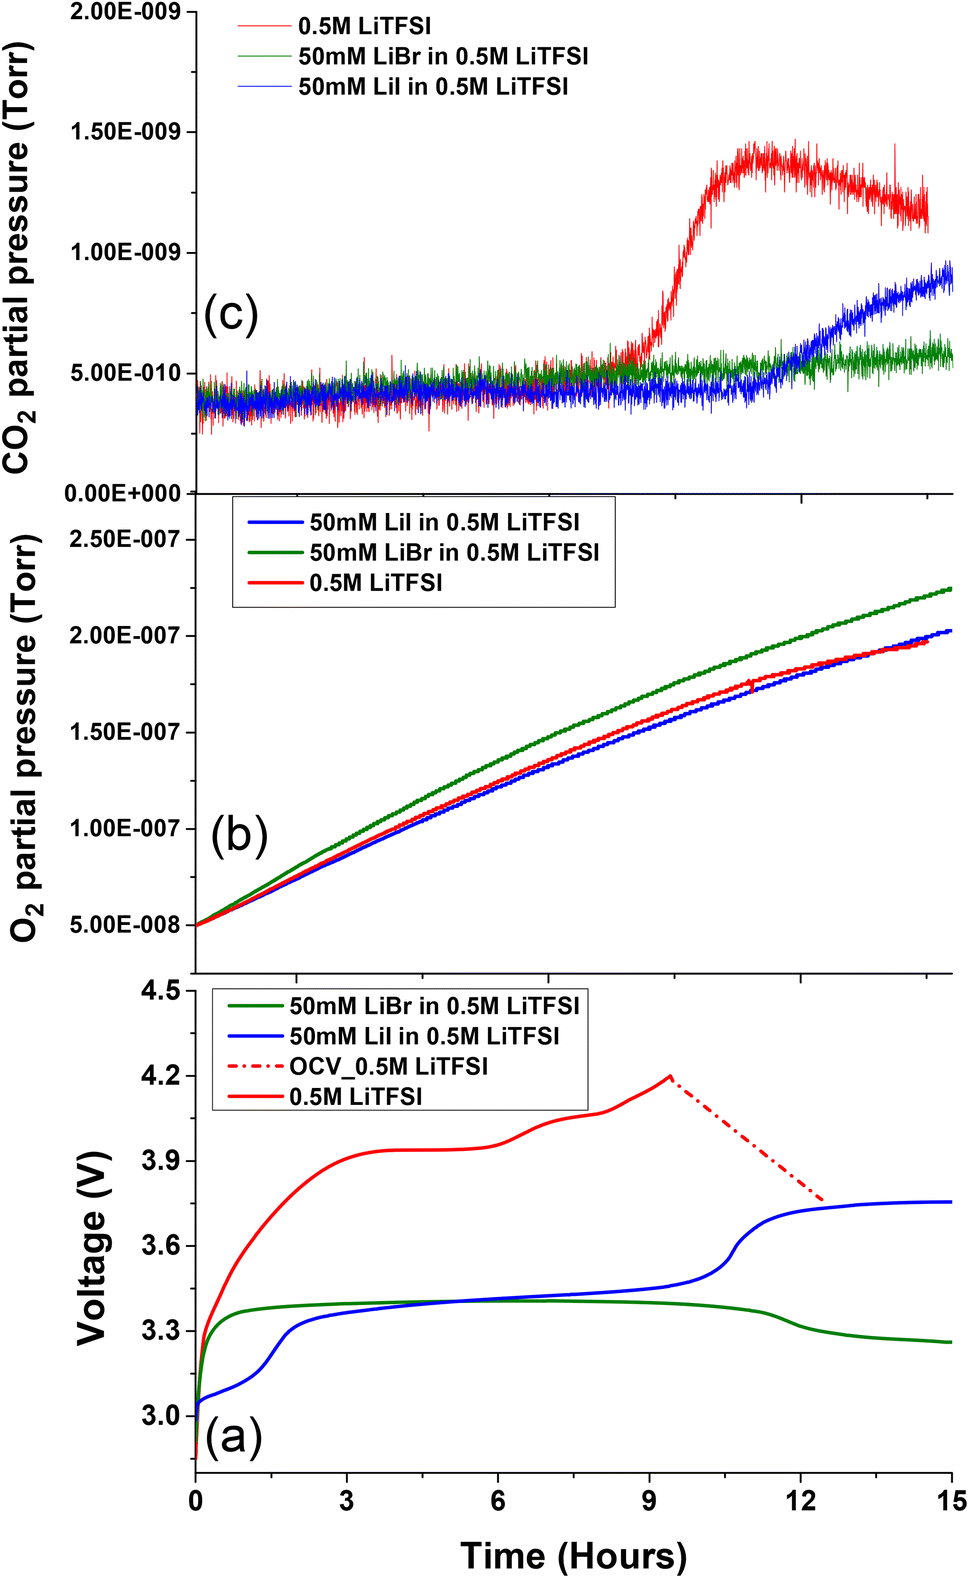
Fig. 2a presents the voltage vs. capacity profiles of cells containing neat 0.5 M LiTFSI without any halide RMs additive. The first discharge voltage profile stabilizes at ∼2.8 V implying the formation of Li2O2 deposits on the cathode side. The subsequent charge process undergoes steep rise in voltage profile till ∼3.9 V followed by plateau in the first cycle. Upon prolonged cycling, we can clearly see the raise in overpotential cycle by cycle. This is because of clogging of the porous carbon paper by non-conductive Li2O2 deposits, which require additional potential to oxidize. The discharge (oxygen reduction reaction (ORR)) and charge (oxygen evolution reaction (OER)) voltage profiles indicate the instabilities of Li–O2 cells upon prolonged cycling. These instabilities of cell components are accompanied with oxidation of ethereal solvent or carbon electrode corrosion during cycling.40 Several of these parasitic reactions are accompanied with CO2 evolution as a main decomposition product.41 Upon monitoring CO2 evolution during galvanostatic discharge and charge for cells with and without RM's under Ar atmosphere, no CO2 evolution was seen (Fig. 1c). The absence of CO2 evolution in Ar environment implies that the operation voltage is not the main cause for degradation processes accompanied with CO2 evolution. However, the chemical and electrochemical activity of O2 plays a major role. Therefore, to study the parasitic reactions accompanied with CO2 evolution, operando electrochemical gas evolutions are conducted for prolonged cycling in the presence of O2.
Fig. 2d shows time vs. voltage profiles and the corresponding CO2 evolutions measured using OEMS are shown in Fig. 2e. During the initial oxidation process, a low intensity overshoot of CO2 evolution was observed, which continued to rise in the following three cycles. Further, in later cycles the intensity of CO2 decreases, which may be due to passivation of discharged species on porous carbon cathode. However, the CO2 evolution was not entirely suppressed. The evolution of CO2 may stem from a variety of side reactions, including: (1) oxidation and degradation of electrolyte solution during OER at the electrode electrolyte interphase.42–45Scheme 1a shows the oxidative decomposition of diglyme in the presence of O2 resulting in CO2 evolution and other side products during Li2O2 decomposition.46,47 (2) Side reactions accompanied with carbon cathode instabilities at high overpotentials Scheme 1b shows the oxidation of carbon cathode to carbon dioxide and other side products such as Li2CO3 beyond ∼3.5 V.48–52 (3) Parasitic reactions associated with lithium anode during OER.19–21 In summary, the cells containing pure 0.5 M LiTFSI electrolyte exhibit consistent CO2 evolution during OER, indicating that severe parasitic reactions are present in Li–O2 cells without RMs.
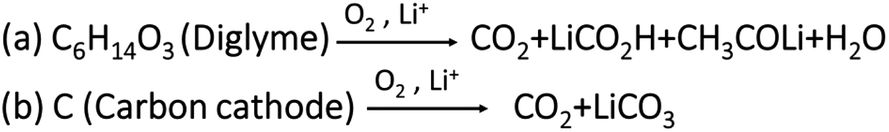 | ||
| Scheme 1 Proposed parasitic chemical reactions during OER. Reaction (a) showing the oxidative decomposition of diglyme to CO2 evolution. Reaction (b) showing the direct oxidation of carbon cathode to CO2 gas beyond ∼3.5 V during OER.46–48 | ||
The initial discharge (ORR) process of Li–O2 cells containing 50 mM LiI in addition to 0.5 M LiTFSI shows a voltage plateau at around 2.8 V (Fig. 2b), similar to the cells without the RM (0.5 M LiTFSI) (Fig. 2a). The subsequent 1st cycle charging (OER) exhibits long voltage plateau between ∼3.3 V to ∼3.4 V indicating the oxidation of iodide ion to triiodide ion (I− → I3−). Fig. 3b present the XRD pattern of the carbon paper after the first charging process indicating the absence of any significant peak of LiOH phases at 2θ: ∼32.7. This implies oxidation of LiOH species at reduced overpotential that is ∼3.4 V with respect to neat 0.5 M LiTFSI without any RM's.30,53–55 In case of second discharge process, the voltage profile follows a gentle steep descent from ∼3.4 V with a voltage plateau at ∼3.1 V that may be due to reduction of oxidized triiodide species to iodide ion (I3− → I−) at the cathode interface, followed by stable discharge (ORR) profile at ∼2.8 V. The 2nd cycle charge (OER) processes exhibit two distinct oxidation processes; a first voltage plateau at around 3.4 V that is attributed to the initial conversion from iodide ion (I−) to triiodide ion (I3−). The second voltage plateau at around 3.8 V is assigned to the formation of the more oxidative iodine (I2) species. Upon prolonged cycling, LiI-containing cells display instabilities in their mediating capabilities, as evidenced by changes in their OER voltage profiles. As the cycling advances, we observe a decrease in the duration of the initial voltage plateau (I− to I3−), with associated increase in the duration of the second voltage plateau (I3− to I2). This observation suggests that in subsequent cycles, the LiI RM requires continued oxidation of iodide ions to iodine in order to effectively oxidize the LiOH deposits.23,56 But as reported that corrosive iodine formed during the OER can aggressively react with the cell components which is detrimental to Li–O2 battery life.56–59 In this regard, monitoring the CO2 using OEMS is useful to justify the reported claim.
Fig. 2d shows the overlapped time vs. voltage profile of 50 mM LiI in 0.5 M LiTFSI and the corresponding CO2 evolution in Fig. 2e. We can clearly see that during the first cycle, cells containing LiI has suppressed the CO2 evolution with respect to the 0.5 M LiTFSI based electrolyte solution. However, after few initial cycles we see an overshoot in CO2 evolution. We attribute the evolution of CO2 in later cycles to the following factors: (1) the formation of corrosive iodine species that can significantly oxidize cell components. (2) Parasitic reactions at the cathode–electrolyte interface and oxidation of the electrolyte solution at high potentials. (3) Instabilities associated with the carbon cathode above ∼3.5 V.1,31,48,50 In conclusion, while Li RM's can initially suppress CO2 evolution during OER, as the cycling progresses, their mediating capabilities deteriorate, resulting in the unavoidable formation of CO2.
Fig. 2c depicts voltage profiles of Li–O2 cells with addition of 50 mM LiBr to the neat 0.5 M LiTFSI in diglyme. The first discharge process exhibits a plateau at ∼2.8 V similar to neat 0.5 M LiTFSI during ORR. The subsequent first oxidation voltage profile of Li–O2 cells with LiBr, exhibits steep voltage rise followed by a plateau at ∼3.4 V, which is assigned to the oxidation of Br− to Br3− that can diffuse and oxidize the ORR product which were deposited on the electrode surface. XRD is conducted after 1st cycle charge to evaluate the efficiency of LiBr in oxidizing the Li2O2 species. XRD patterns in Fig. 3b shows no crystalline phases on the carbon cathode implying efficient oxidation of Li2O2 species at lower charging potentials with respect to neat 0.5 M LiTFSI without any RM that otherwise requires high overpotentials for oxidizing the Li2O2 species.53,54 In the following reduction processes (discharge) of LiBr-containing cells, an additional voltage plateau is observed. This additional plateau at ∼3.4 V is ascribed to the reduction of Br3− to Br− as a result of the prior oxidation step. Unlike the LiI-containing cells, upon advanced cycling, cells with LiBr don't exhibit additional oxidation plateau at higher potentials. This phenomena is because of higher overpotential needed for the conversion of Br3− to Br2 with respect to conversion of I3− to I2 as suggested by cyclic voltammogram in Fig. S4.† These results are in good agreement with results published by Aurbach and Sun laboratories.23,31,60–62 More significantly, the LiBr containing cells exhibits stable voltage profiles upon prolonged cycling. Upon monitoring CO2 evolution using OEMS, we can observe that LiBr containing cells has significantly suppressed CO2 evolution during the first OER (Fig. 2e). In contrast to LiI, the LiBr RM demonstrated stable mediating capabilities during the OER process. This is likely due to the fact that tribromide species are more effective oxidizing agents than triiodide species, which facilitates oxidation of the ORR product layer without the need for higher potentials and the associated risk of forming corrosive, free bromine species. Another possibility is that the formation of tribromide species buffers the anodic voltage, and keeps us in a high enough potential to oxidize ORR products, but not too high where the degradation of cell components can occur.
To isolate the RM operation of the halide salts from potential parasitic reactions mediated by the oxygen environment during charging, such as carbon corrosion and solvent oxidation,33 cells with and without RM agents were discharged in O2 and charged in an Ar atmosphere. Fig. 4 depicts the electrochemical profile of Li–O2 cells charged in the presence of Ar and the corresponding O2 and CO2 evolutions. While charging in Ar, the 0.5 M LiTFSI in diglyme exhibits severe overpotential behaviour which resulted in CO2 evolution below 4 V (Fig. 4c). These parasitic reactions are attributed to instabilities associated with carbon cathode and electrolyte decomposition at electrode electrolyte interface during oxygen evolution process at voltage potential below 4 V.63,64
 | ||
| Fig. 4 (a) Voltage vs. specific discharge capacity profiles of Li–O2 cells charged under an Ar atmosphere for pre-discharged cells in O2. Current density was fixed at 0.052 mA cm−2. The corresponding normalized (b) O2 gas evolution and (c) CO2 gas evolutions monitored in OEMS. | ||
From the charging profile, it is evident that upon addition of 50 mM LiI to 0.5 M LiTFSI the OER takes place (Fig. 4b) at reduced overpotential with respect to cells without RMs.65,66 As previously discussed, the free iodine species are more reactive towards cell components than the complexed triiodide species. As can be observed (Fig. 4c), CO2 evolution occurs at higher potentials during the formation of free iodine species.23,59 This implies that the main drawback of the LiI RM is the possible formation of iodine species which can lead to cell component degradation at high voltage. The formation of highly reactive iodine species at potentials lower than 4 V, makes it difficult to avoid their formation in Li–O2 systems, where the potential can reach these values even in cells containing RM's.
Li–O2 cells charged at Ar atmosphere were also conducted on 50 mM LiBr added to 0.5 M LiTFSI electrolyte solution (Fig. 4b). During charging process voltage increases to ∼3.4 V followed stable charge profile followed by gentle decline at ∼3.15 V after few hours. This indicates saturation of tribromide ion concentration from bromide ion. This behaviour is similar to OER voltage profile of the cells that were cycled in oxygen environment. Nevertheless, it is evident that cells containing LiBr have completely suppressed CO2 evolution in the Li–O2 cells under Ar atmosphere (Fig. 2c). This outcome also aligns with the observed increased evolution of oxygen from the oxidation of ORR products. These findings demonstrate that LiBr is a more suitable and efficient RM additive than LiI for long-term cycling of Li–O2 cells.
Conclusions
In this study, we evaluated the effectiveness of halide-based redox mediator (RM) additives (LiI or LiBr) in suppressing side reactions during OER in Li–O2 cells. By monitoring the evolution of CO2via OEMS, we were able to assess the effectiveness of RMs in suppressing these side reactions. We found that cells containing 0.5 M LiTFSI without RMs additives exhibited severe electrochemical instabilities from the first cycle. These instabilities were correlated to the evolution of CO2 during OER. On the other hand, in cells where 50 mM LiI was added to 0.5 M LiTFSI solution, no CO2 evolution was observed in the first oxidation processes. However, in the following cycles, an increase in the amount of CO2 evolution was detected for cells containing LiI. We attribute this instability to the formation of iodine (I2) species during the following oxidation processes. Free iodine species are more aggressive and corrosive toward the cell components than the complexed tribromide (I3−) species that were prevalent in the first OER processes. Furthermore, the higher overpotential that is accompanied with the formation of I3− can also lead to more side-reactions and evolution of CO2 during the cell charging. In contrast, we found that LiBr suppressed the CO2 evolution upon prolonged cycling. We propose that this improved behaviour is likely due to the fact that tribromide species are more effective oxidation agents than triiodide species, which allows for oxidation of the ORR product layer without the need for higher potentials and the associated risk of forming damaging free bromine species. These results emphasize that LiBr additives are more efficient than LiI as RM additives for Li–O2 cells. Furthermore, this study highlights the importance of thoroughly examining RM additives to ensure optimal performance and stability of Li–O2 cells.Experimental
Materials
Lithium bis(trifluoromethylsulphonyl)imide (LiTFSI ≥ 99.95%), lithium bromide (≥98.0%), lithium iodide (≥99.9%), lithium foil were purchased from Sigma Aldrich, high purity Diglyme purchased from Sigma (diethylene glycol dimethylether; 99.99% anhydrous), and carbon paper is purchased from MARKETECH International Inc.Electrolyte preparation
All the salts were dried under ultra-high vacuum at ∼120 °C overnight to remove any amount of moisture. 0.5 M LiTFSI, 50 mM LiI in 0.5 M LiTFSI and 50 mM LiBr in 0.5 M LiTFSI electrolytes are prepared in diglyme solutions in Argon filled atmosphere (O2, H2O ≤ 0.1 ppm). All the electrolyte was dried using 4 Å molecular sieves. The water content of all electrolytes was determined by Karl Fischer titration (Metrohm 756 KF) to be ≤50 ppm.High resolution scanning electron microscopy (HRSEM)
High resolution scanning electron microscopy imaging of discharged products were taken by HR-SEM, Magellan 400 L. SEM samples were prepared by smearing the powder on carbon tape.X-ray diffraction (XRD)
XRD is conducted for free-standing carbon cathode paper after discharge, using Bruker D8 Advanced X-ray diffractometer, using Cu Kα radiation source.Attenuated total reflectance Fourier transform infrared spectroscopy (ATR-FTIR)
ATR-FTIR was conducted using Thermo Scientific Nicolet iS10 was used for FTIR analysis to know the functional groups of discharged products formed on the porous carbon paper.Online electrochemical mass spectroscopy
The in situ gas evolution during the charge–discharge cycles for Li–O2 cells were monitored using an online electrochemical mass spectrometer (OEMS) from Hiden Analytical. OEMS is conducted in an in-house designed cell as reported previously, we monitored the O2 and CO2 evolution with respect to the voltage profiles for cells containing 0.5 M LiTFSI, 50 mM LiBr in 0.5 M LiTFSI and 50 mM LiI in 0.5 M LiTFSI electrolytes.29 OEMS cells for Li–O2 cells were prepared in an argon-filled glovebox by combining Li as the anode (ϕ 14 mm) with two glass fiber separators (ϕ 29 mm), and 200 μL of proposed electrolyte solution with binder free carbon paper is used as cathode (ϕ 11 mm). The cell outlet was connected to the OEMS capillary. The electrochemical measurements were conducted using a MPG potentiostat (BioLogic Science Instruments) within a potential window of 2.0–4.2 V at 0.052 mA cm−2 current density charge–discharge cycles. The partial pressures of the evolved gases were plotted against time.Conflicts of interest
There are no conflicts to declare.References
- W.-J. Kwak, Rosy, D. Sharon, C. Xia, H. Kim, L. R. Johnson, P. G. Bruce, L. F. Nazar, Y.-K. Sun and A. A. Frimer, Chem. Rev., 2020, 120, 6626–6683 CrossRef CAS PubMed.
- P. G. Bruce, S. A. Freunberger, L. J. Hardwick and J.-M. Tarascon, Nat. Mater., 2012, 11, 19–29 CrossRef CAS PubMed.
- J. Lu, L. Li, J.-B. Park, Y.-K. Sun, F. Wu and K. Amine, Chem. Rev., 2014, 114, 5611–5640 CrossRef CAS PubMed.
- Z. Peng, S. A. Freunberger, Y. Chen and P. G. Bruce, Science, 2012, 337, 563–566 CrossRef CAS PubMed.
- J.-J. Xu, Z.-L. Wang, D. Xu, L.-L. Zhang and X.-B. Zhang, Nat. Commun., 2013, 4, 1–10 Search PubMed.
- Z. Jian, P. Liu, F. Li, P. He, X. Guo, M. Chen and H. Zhou, Angew. Chem., Int. Ed., 2014, 53, 442–446 CrossRef CAS PubMed.
- Y. Wang and Y.-C. Lu, Energy Storage Mater., 2020, 28, 235–246 CrossRef.
- N. Mahne, O. Fontaine, M. O. Thotiyl, M. Wilkening and S. A. Freunberger, Chem. Sci., 2017, 8, 6716–6729 RSC.
- J. Højberg, B. D. McCloskey, J. Hjelm, T. Vegge, K. Johansen, P. Norby and A. C. Luntz, ACS Appl. Mater. Interfaces, 2015, 7, 4039–4047 CrossRef PubMed.
- L. Ma, T. Yu, E. Tzoganakis, K. Amine, T. Wu, Z. Chen and J. Lu, Adv. Energy Mater., 2018, 8, 1800348 CrossRef.
- D. Sharon, D. Hirsberg, M. Salama, M. Afri, A. A. Frimer, M. Noked, W. Kwak, Y.-K. Sun and D. Aurbach, ACS Appl. Mater. Interfaces, 2016, 8, 5300–5307 CrossRef CAS PubMed.
- A. Dutta, R. A. Wong, W. Park, K. Yamanaka, T. Ohta, Y. Jung and H. R. Byon, Nat. Commun., 2018, 9, 680 CrossRef PubMed.
- B. D. McCloskey, R. Scheffler, A. Speidel, G. Girishkumar and A. C. Luntz, J. Phys. Chem. C, 2012, 116, 23897–23905 CrossRef CAS.
- Z. Lyu, Y. Zhou, W. Dai, X. Cui, M. Lai, L. Wang, F. Huo, W. Huang, Z. Hu and W. Chen, Chem. Soc. Rev., 2017, 46, 6046–6072 RSC.
- Y. Zhang, X. Zhang, J. Wang, W. C. McKee, Y. Xu and Z. Peng, J. Phys. Chem. C, 2016, 120, 3690–3698 CrossRef CAS.
- W.-J. Kwak, H. Kim, H.-G. Jung, D. Aurbach and Y.-K. Sun, J. Electrochem. Soc., 2018, 165, A2274 CrossRef CAS.
- Y. Mo, S. P. Ong and G. Ceder, Phys. Rev. B: Condens. Matter Mater. Phys., 2011, 84, 205446 CrossRef.
- Y.-C. Lu, B. M. Gallant, D. G. Kwabi, J. R. Harding, R. R. Mitchell, M. S. Whittingham and Y. Shao-Horn, Energy Environ. Sci., 2013, 6, 750–768 RSC.
- X. Zhang, Z. Xie and Z. Zhou, ChemElectroChem, 2019, 6, 1969–1977 CrossRef CAS.
- X. Bi, K. Amine and J. Lu, J. Mater. Chem. A, 2020, 8, 3563–3573 RSC.
- H. Song, H. Deng, C. Li, N. Feng, P. He and H. Zhou, Small Methods, 2017, 1, 1700135 CrossRef.
- Z. Wu, Y. Tian, H. Chen, L. Wang, S. Qian, T. Wu, S. Zhang and J. Lu, Chem. Soc. Rev., 2022, 51, 8045–8101 RSC.
- W.-J. Kwak, D. Hirshberg, D. Sharon, M. Afri, A. A. Frimer, H.-G. Jung, D. Aurbach and Y.-K. Sun, Energy Environ. Sci., 2016, 9, 2334–2345 RSC.
- J. Wang, J. Zheng and X. Liu, Phys. Chem. Chem. Phys., 2022, 24, 17920–17940 RSC.
- Z.-F. Chen, X. Lin, H. Xia, Y. Hong, X. Liu, S. Cai, J.-N. Duan, J. Yang, Z. Zhou and J.-K. Chang, J. Mater. Chem. A, 2019, 7, 14260–14270 RSC.
- T. Zhang, K. Liao, P. He and H. Zhou, Energy Environ. Sci., 2016, 9, 1024–1030 RSC.
- A. G. Tamirat, X. Guan, J. Liu, J. Luo and Y. Xia, Chem. Soc. Rev., 2020, 49, 7454–7478 RSC.
- C.-Y. Li, M.-S. Wu, W.-R. Chen, Y.-J. Rong, Q.-Y. Wang and X.-P. Zhang, Chem. Commun., 2022, 58, 13632–13635 RSC.
- Rosy, S. Akabayov, M. Leskes and M. Noked, ACS Appl. Mater. Interfaces, 2018, 10, 29622–29629 CrossRef CAS PubMed.
- T. Liu, M. Leskes, W. Yu, A. J. Moore, L. Zhou, P. M. Bayley, G. Kim and C. P. Grey, Science, 2015, 350, 530–533 CrossRef CAS PubMed.
- Z. Liang and Y.-C. Lu, J. Am. Chem. Soc., 2016, 138, 7574–7583 CrossRef CAS PubMed.
- A. Tkacheva, B. Sun, J. Zhang, G. Wang and A. M. McDonagh, J. Phys. Chem. C, 2021, 125, 2824–2830 CrossRef CAS.
- J. Zhang, B. Sun, Y. Zhao, A. Tkacheva, Z. Liu, K. Yan, X. Guo, A. M. McDonagh, D. Shanmukaraj and C. Wang, Nat. Commun., 2019, 10, 602 CrossRef CAS PubMed.
- M. Tułodziecki, J.-M. Tarascon, P.-L. Taberna and C. Guéry, Electrochem. Commun., 2017, 77, 128–132 CrossRef.
- V. Sharova, A. Moretti, T. Diemant, A. Varzi, R. J. Behm and S. Passerini, J. Power Sources, 2018, 375, 43–52 CrossRef CAS.
- L. Coustan and D. Belanger, J. Electroanal. Chem., 2019, 854, 113538 CrossRef CAS.
- Z. Li, S. Ganapathy, Y. Xu, J. R. Heringa, Q. Zhu, W. Chen and M. Wagemaker, Chem. Mater., 2017, 29, 1577–1586 CrossRef CAS PubMed.
- A. E. Torres, E. Ramos and P. B. Balbuena, J. Phys. Chem. C, 2020, 124, 10280–10287 CrossRef CAS.
- Y. Qiao, S. Wu, Y. Sun, S. Guo, J. Yi, P. He and H. Zhou, ACS Energy Lett., 2017, 2, 1869–1878 CrossRef CAS.
- D. W. Kim, S. M. Ahn, J. Kang, J. Suk, H. K. Kim and Y. Kang, J. Mater. Chem. A, 2016, 4, 6332–6341 RSC.
- H. Guo, W. Luo, J. Chen, S. Chou, H. Liu and J. Wang, Adv. Sustainable Syst., 2018, 2, 1700183 CrossRef.
- D. Sharon, D. Hirsberg, M. Afri, A. Garsuch, A. A. Frimer and D. Aurbach, J. Phys. Chem. C, 2014, 118, 15207–15213 CrossRef CAS.
- Y. S. Jeong, J.-B. Park, H.-G. Jung, J. Kim, X. Luo, J. Lu, L. Curtiss, K. Amine, Y.-K. Sun and B. Scrosati, Nano Lett., 2015, 15, 4261–4268 CrossRef CAS PubMed.
- B. D. McCloskey, D. S. Bethune, R. M. Shelby, T. Mori, R. Scheffler, A. Speidel, M. Sherwood and A. C. Luntz, J. Phys. Chem. Lett., 2012, 3, 3043–3047 CrossRef CAS PubMed.
- J. Park, S. H. Lee, H. Jung, D. Aurbach and Y. Sun, Adv. Mater., 2018, 30, 1704162 CrossRef PubMed.
- N. Tsiouvaras, S. Meini, I. Buchberger and H. A. Gasteiger, J. Electrochem. Soc., 2013, 160, A471–A477 CrossRef CAS.
- S. A. Freunberger, Y. Chen, N. E. Drewett, L. J. Hardwick, F. Bardé and P. G. Bruce, Angew. Chem., Int. Ed., 2011, 50, 8609–8613 CrossRef CAS PubMed.
- M. M. Ottakam Thotiyl, S. A. Freunberger, Z. Peng and P. G. Bruce, J. Am. Chem. Soc., 2013, 135, 494–500 CrossRef CAS PubMed.
- N. Mahne, B. Schafzahl, C. Leypold, M. Leypold, S. Grumm, A. Leitgeb, G. A. Strohmeier, M. Wilkening, O. Fontaine and D. Kramer, Nat. Energy, 2017, 2, 1–9 Search PubMed.
- Z. Liang, Q. Zou, J. Xie and Y.-C. Lu, Energy Environ. Sci., 2020, 13, 2870–2877 RSC.
- S. Meini, N. Tsiouvaras, K. U. Schwenke, M. Piana, H. Beyer, L. Lange and H. A. Gasteiger, Phys. Chem. Chem. Phys., 2013, 15, 11478–11493 RSC.
- S. A. Freunberger, Y. Chen, Z. Peng, J. M. Griffin, L. J. Hardwick, F. Bardé, P. Novák and P. G. Bruce, J. Am. Chem. Soc., 2011, 133, 8040–8047 CrossRef CAS PubMed.
- S. Ganapathy, B. D. Adams, G. Stenou, M. S. Anastasaki, K. Goubitz, X.-F. Miao, L. F. Nazar and M. Wagemaker, J. Am. Chem. Soc., 2014, 136, 16335–16344 CrossRef CAS PubMed.
- H. Kim, W.-J. Kwak, H.-G. Jung and Y.-K. Sun, Energy Storage Mater., 2019, 19, 148–153 CrossRef.
- Z. Gao, I. Temprano, J. Lei, L. Tang, J. Li, C. P. Grey and T. Liu, Adv. Mater., 2023, 35, 2201384 CrossRef CAS PubMed.
- W. J. Kwak, D. Hirshberg, D. Sharon, M. Afri, A. A. Frimer, H. G. Jung, D. Aurbach, Y. K. Sun, J. Kwak, D. Hirshberg, D. Sharon, H.-J. Shin, M. Afri, J.-B. Park, A. Garsuch, F. F. Chesneau, A. A. Frimer, D. Aurbach and Y.-K. Sun, J. Mater. Chem. A, 2015, 3, 8855–8864 RSC.
- W. K. Behl and D. Chin, J. Electrochem. Soc., 1988, 135, 16 CrossRef CAS.
- Y. G. Zhu, Q. Liu, Y. Rong, H. Chen, J. Yang, C. Jia, L.-J. Yu, A. Karton, Y. Ren and X. Xu, Nat. Commun., 2017, 8, 14308 CrossRef CAS PubMed.
- G. Leverick, M. Tułodziecki, R. Tatara, F. Bardé and Y. Shao-Horn, Joule, 2019, 3, 1106–1126 CrossRef CAS.
- C.-Y. Li, M.-S. Wu, W.-R. Chen, Q.-Y. Wang, Y.-J. Rong and X.-P. Zhang, J. Mater. Chem. A, 2023, 11, 937–942 RSC.
- M. Ono and S. Matsuda, J. Phys. Chem. C, 2023, 127, 6117–6124 CrossRef CAS.
- W. Kwak, S. Park, H. Jung and Y. Sun, Adv. Energy Mater., 2018, 8, 1702258 CrossRef.
- S. Song, W. Xu, R. Cao, L. Luo, M. H. Engelhard, M. E. Bowden, B. Liu, L. Estevez, C.-M. Wang and J.-G. Zhang, Nano Energy, 2017, 33, 195–204 CrossRef CAS.
- X. Yao, Q. Dong, Q. Cheng and D. Wang, Angew. Chem., Int. Ed., 2016, 55, 11344–11353 CrossRef CAS PubMed.
- C. M. Burke, R. Black, I. R. Kochetkov, V. Giordani, D. Addison, L. F. Nazar and B. D. McCloskey, ACS Energy Lett., 2016, 1, 747–756 CrossRef CAS.
- W.-J. Kwak, D. Hirshberg, D. Sharon, H.-J. Shin, M. Afri, J.-B. Park, A. Garsuch, F. F. Chesneau, A. A. Frimer and D. Aurbach, J. Mater. Chem. A, 2015, 3, 8855–8864 RSC.
Footnote |
| † Electronic supplementary information (ESI) available. See DOI: https://doi.org/10.1039/d3ta03002d |
| This journal is © The Royal Society of Chemistry 2023 |