
 Open Access Article
 This Open Access Article is licensed under a
 Creative Commons Attribution 3.0 Unported Licence
Direct monitoring of the potassium charge carrier in Prussian blue cathodes using potassium K-edge X-ray absorption spectroscopy†
Alexander J.
Mayer
ab,
Owain T.
Beynon
 c,
Andrew J.
Logsdail
c,
K. G. Upul
Wijayantha
ad,
Sandra E.
Dann
a,
José F.
Marco
e,
Joshua D.
Elliott
b,
Matteo
Aramini
b,
Giannantonio
Cibin
b and
Simon A.
Kondrat
*a
c,
Andrew J.
Logsdail
c,
K. G. Upul
Wijayantha
ad,
Sandra E.
Dann
a,
José F.
Marco
e,
Joshua D.
Elliott
b,
Matteo
Aramini
b,
Giannantonio
Cibin
b and
Simon A.
Kondrat
*a
aDepartment of Chemistry, Loughborough University, Loughborough, Leicestershire LE113TU, UK. E-mail: S.Kondrat@lboro.ac.uk
bDiamond Light Source, Harwell Science and Innovation Campus, Chilton, Didcot, OX11 0DE, UK
cCardiff Catalysis Institute, School of Chemistry, Cardiff University, Park Place, Cardiff, CF103AT, Wales, UK
dCentre for Renewable and Low Carbon Energy, Cranfield University, Cranfield, Bedfordshire MK43 0AL, UK
eInstituto de Quimica Fisica Rocasolano, CSIC, Serrano, 119, 28006 Madrid, Spain
First published on 28th July 2023
Abstract
Prussian blue is widely utilized as a cathode material in batteries, due to its ability to intercalate alkaline metal ions, including potassium. However, the exact location of potassium or other cations within the complex structure, and how it changes as a function of cycling, is unclear. Herein, we report direct insight into the nature of potassium speciation within Prussian blue during cyclic voltammetry, via operando potassium K-edge X-ray Absorption Near Edge Structure (XANES) analysis. Clear and identifiable spectra are experimentally differentiated for the fully intercalated (fully reduced Fe2+FeII Prussian white), partially intercalated (Prussian blue; Fe3+FeII), and free KNO3(aq) electrolyte. Comparison of the experiment with simulated XANES of theoretical structures indicates that potassium lies within the channels of the Prussian blue structure, but is displaced towards the periphery of the channels by occluded water and/or structural water present resulting from [Fe(CN)6]4− vacancies. The structural composition from the charge carrier perspective was monitored for two samples of differing crystallite size and electrochemical stability. Reproducible potassium XANES spectral sequences were observed for large crystallites (ca. 100 nm) of Prussian blue, in agreement with retention of capacity; in contrast, the capacity of a sample with small crystallites (ca. 14 nm) declined as the potassium became trapped within the partially intercalated Prussian blue. The cause of degradation could be attributed to a significant loss of [Fe(CN)6]–[Fe(NC)6] ordering and the formation of a potassium-free non-conducting ferrihydrite phase. These findings demonstrate the potential of XANES to directly study the nature and evolution of potassium species during an electrochemical process.
1 Introduction
Prussian blue (PB) is an important porous metal–cyanide framework structure (AxFe3+[FeII(CN)6]y·nH2O) with exchangeable A cations. Along with its analogs, it shows promise for a range of important applications1–3 including as cathodes in secondary ion batteries.4–10 Indeed, PB cathodes have potential in widespread, low-cost energy storage applications, using abundant and affordable Na+ or K+ based aqueous electrolytes.10–12 In particular, K+ ions can be readily accommodated by the open structure of PB, which allows for reversible intercalation processes that are challenging in layered transition metal oxide cathodes.Despite the identified potential, unexpected complexities within the PB structure have made fundamental understanding of intercalation processes difficult. The PB structural framework is highly flexible, forming a cubic structure that can accommodate up to 25% [FeII(CN)6]4− defects, with the subsequent under-coordinated Fe3+ ions being bound to water, forming (H2O)6 clusters (Scheme 1).13–16 In addition, the structure can accommodate significant amounts of uncoordinated occluded water.17,18 These structural variations influence the location of A site alkali cations within PB, which has ramifications in understanding the balance of charges during the high (Fe2+/3+) and low (FeII/III) spin redox pair processes.15,17,19,20 In an ideal structure (Scheme 1a), reduction of Fe3+/III sites is balanced by the intercalation of K+ within the vacant channels of the structure, with the fully reduced Fe2+FeII structure, known as Prussian white (PW) having a 1![[thin space (1/6-em)]](https://www.rsc.org/images/entities/char_2009.gif) :1 K:Fe ratio. In the fully oxidized Fe3+FeIII structure, commonly referred to as Berlin Green (BG), K+ is fully deintercalated. However, the influence of (H2O)6 clusters, which are prevalent within the defective structure, has been debated, with some work concluding that these sites can inhibit ion insertion into the channels, while others deducing that K+ sits within the (H2O)6 cluster itself (Scheme 1b).15,21 The complications in understanding K+ ion location have resulted in ambiguity when assigning the charge-balancing species during framework redox processes, with suggestions that in aqueous electrolytes H3O+ or K+ can act as counterions.15,22,23 Indeed, similar uncertainty is also observed for other cations that can be incorporated into the structure, such as Mg2+.24
:1 K:Fe ratio. In the fully oxidized Fe3+FeIII structure, commonly referred to as Berlin Green (BG), K+ is fully deintercalated. However, the influence of (H2O)6 clusters, which are prevalent within the defective structure, has been debated, with some work concluding that these sites can inhibit ion insertion into the channels, while others deducing that K+ sits within the (H2O)6 cluster itself (Scheme 1b).15,21 The complications in understanding K+ ion location have resulted in ambiguity when assigning the charge-balancing species during framework redox processes, with suggestions that in aqueous electrolytes H3O+ or K+ can act as counterions.15,22,23 Indeed, similar uncertainty is also observed for other cations that can be incorporated into the structure, such as Mg2+.24
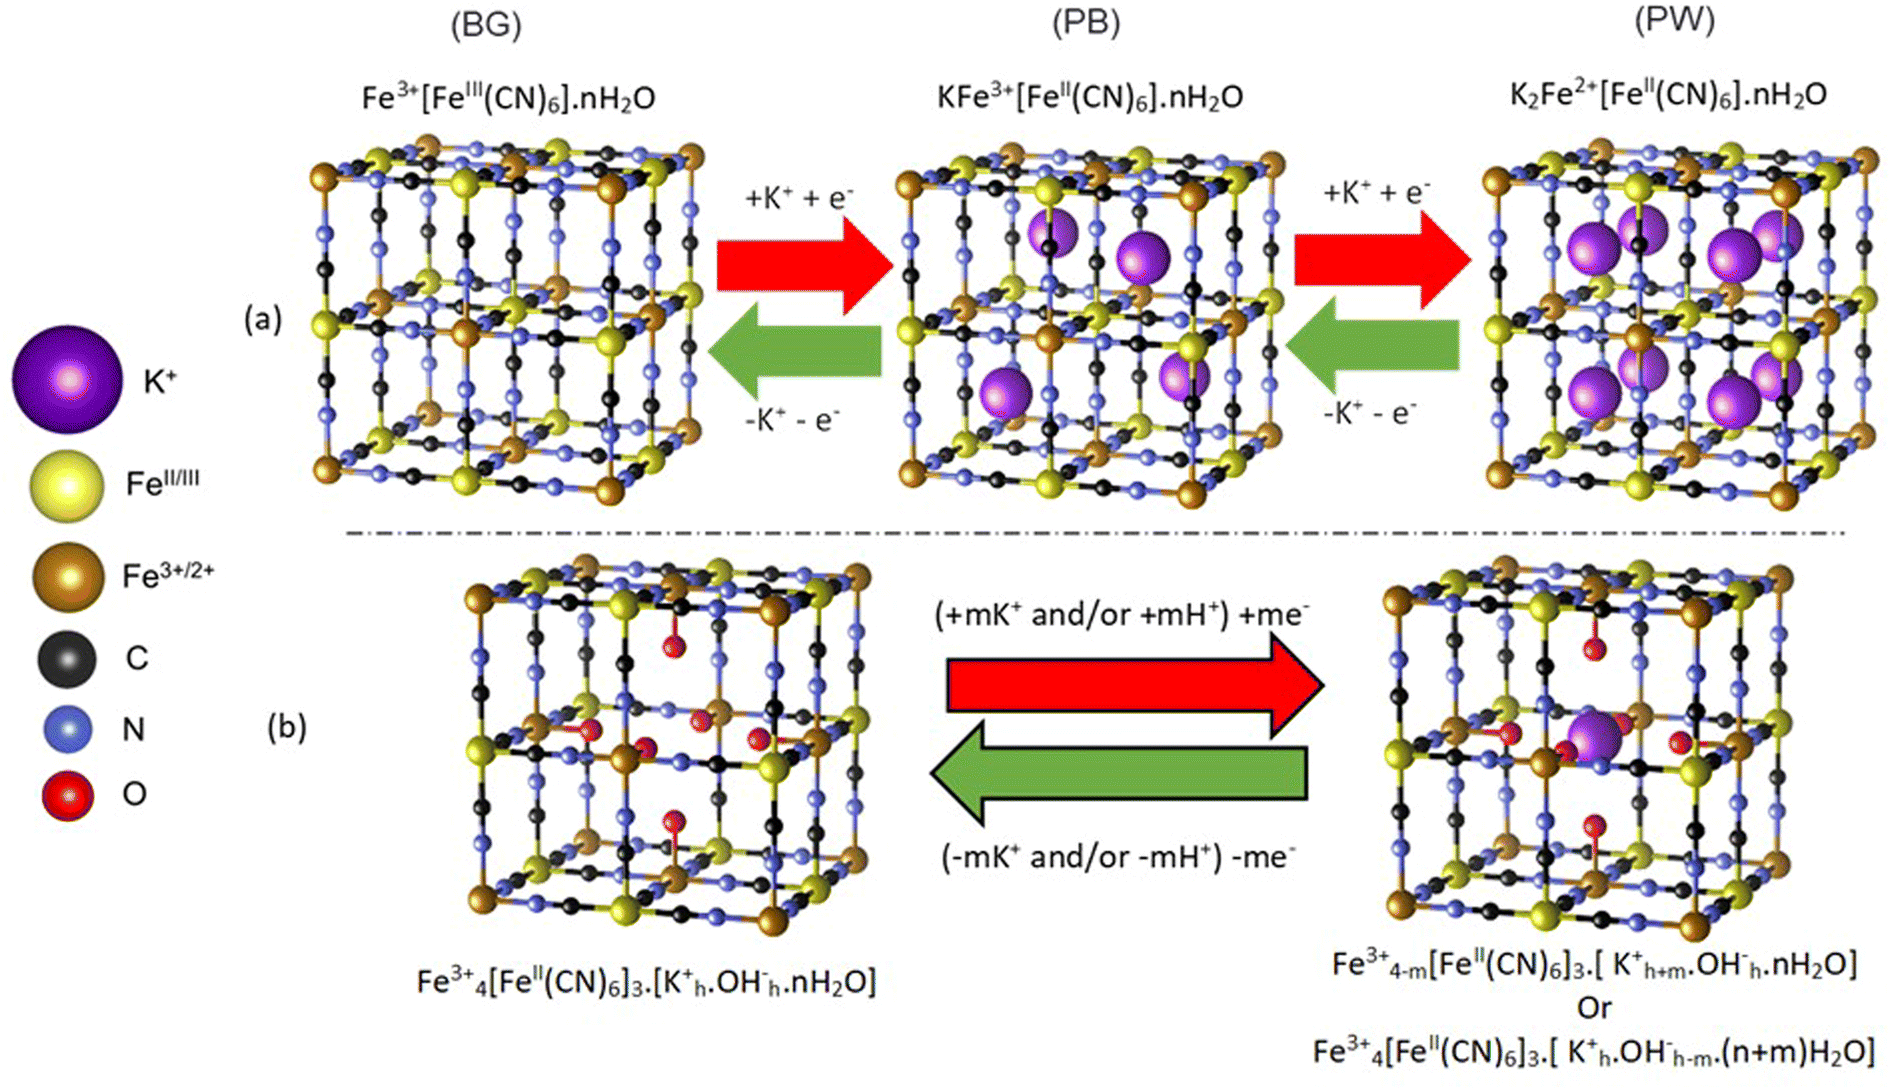 | ||
| Scheme 1 Conceptualized structural evolution of PB during electrochemical reduction and oxidation. (a) Ideal defect free Prussian blue. (b) Defective structure based on a [FeII(CN)6]4− absence, which is charge balanced by H2O coordinated to high spin Fe3+. A key is provided to identify the ionic and atomic species. H associated with water is not included for clarity | ||
Another challenge in utilizing PB for energy storage applications is its varied stability over repeated cycling. Highly crystalline materials with large crystallite sizes, which are considered to have a limited number of defects, are reported to favor superior cycle-life and rate capability. The importance of [Fe(CN)6]4− defects in contributing to structural collapse is stated to be due to their inhibition of ion insertion and decrease in electronic conductivity.25–28 However, understanding the loss of capacity is again complicated by the differing process mechanisms that are suggested for charge balancing and K+ intercalation.
Importantly, current understanding of the location of K+ in PB is deduced from general long range structural information such as diffraction data, or via theoretical simulation. Herein, we show that operando potassium K-edge X-ray absorption near edge structure (XANES) can successfully be employed to understand, with the aid of theoretical simulations, the local structure of K+ in PB cathodes. While XANES has previously been employed to follow sulfur species (at the S K-edge) in batteries during operation,29–31 there have been few attempts to monitor group 1 or 2 species in battery cathodes. Villevieille and co-workers have identified different Na K-edge spectra of ex situ isolated charged and discharged NaxMnO2 cathodes,32 while Weatherup and co-workers showed that ex situ Mg K-edge XANES could be used to identify changes at the solid electrolyte interface of a Mg anode.33 Yet neither of these studies are performed during battery operation. We show that such XANES studies can be employed simultaneously with electrochemical testing in an operando experiment. Two samples of varying crystallite size and electrochemical stability are studied, and the evolution of K+ within the structure monitored over repeated cyclic voltammograms.
2 Results and discussion
2.1 Ex situ characterization and electrochemical performance
Prior to analysis of the local structure of K+ within the samples, electrochemical properties and ex situ structural analysis was performed to identify any informative structure–function properties that may enhance our analysis of the potassium K-edge XANES. The PB samples with large crystallite size (LC-PB) and small crystallites (SC-PB) can both be assigned by XRD to crystalize with a face-centered Fm![[3 with combining macron]](https://www.rsc.org/images/entities/char_0033_0304.gif) m PB structure, with varying average crystallite sizes of 103 ± 3 nm and 14 ± 2 nm, respectively (Fig. S1 and Table S1†). The choice of nomenclature (LC vs. SC) being based on the observed broadening in the diffraction patterns. It is noted that there are no differences in incoherent scattering between samples and therefore no variation in amorphous content. IR spectroscopy further confirmed the formation of PB through the presence of a single ν(C
m PB structure, with varying average crystallite sizes of 103 ± 3 nm and 14 ± 2 nm, respectively (Fig. S1 and Table S1†). The choice of nomenclature (LC vs. SC) being based on the observed broadening in the diffraction patterns. It is noted that there are no differences in incoherent scattering between samples and therefore no variation in amorphous content. IR spectroscopy further confirmed the formation of PB through the presence of a single ν(C![[triple bond, length as m-dash]](https://www.rsc.org/images/entities/char_e002.gif) N) mode at 2086 cm−1 (LC-PB) and 2081 cm−1 (SC-PB), as shown in Fig. S2.† The morphology of the two samples is notably different when imaged with scanning electron microscopy (SEM) (Fig. S3†), with LC-PB comprised of 140 ± 30 nm faceted crystalline particles, and SC-PB of small ill-defined 16 ± 3 nm particles, at the limit of microscope resolution, that agglomerate into >10 μm aggregates. Notably, these large aggregates of SC-PB proved harder to disperse amongst the conductive carbon black during electrode preparation (Fig. S4†).
N) mode at 2086 cm−1 (LC-PB) and 2081 cm−1 (SC-PB), as shown in Fig. S2.† The morphology of the two samples is notably different when imaged with scanning electron microscopy (SEM) (Fig. S3†), with LC-PB comprised of 140 ± 30 nm faceted crystalline particles, and SC-PB of small ill-defined 16 ± 3 nm particles, at the limit of microscope resolution, that agglomerate into >10 μm aggregates. Notably, these large aggregates of SC-PB proved harder to disperse amongst the conductive carbon black during electrode preparation (Fig. S4†).
Elemental analysis and TGA (Fig. S5† and Table S2†) result in structural formulae of K0.55Fe[Fe(CN)6]0.92·3.3H2O and K1.04Fe[Fe(CN)6]0.94·4.1H2O for LC-PB and SC-PB, respectively. Given that values of <1 were observed for [Fe(CN)6]4−, defect sites are concluded to be present in both samples. Fe K-edge EXAFS analysis of the samples is indicative of the PB structure (Fig. 1a and S6†), with features associated with the Fe–C/N 1st and 2nd shells and the Fe–Fe 1st shell. The intensity of Fourier transform magnitude features is similar between samples, indicating that the short-range order was comparable. Room temperature 57Fe Mössbauer spectra of the two samples (Fig. 1b and Tables S3 & S4†) also show limited differences, with similar average quadrupole splittings and the ratio of areaFe(III):areaFe(II) being equal to 1. The high spin Fe3+ component of the spectra required fitting with two doublets that are associated with the ideal Fe(NC)6 site and another with partial water coordination, demonstrating comparable defects exist in both samples.34–36 The results are in contrast to the impactful assumption that small crystallite size equated to a more defective structure, which was applied in previous studies of PB electrochemical stability.28 In the present study, both the small and large crystallite containing samples contain a notable, but comparable, number of defects, despite their very different crystallite size.
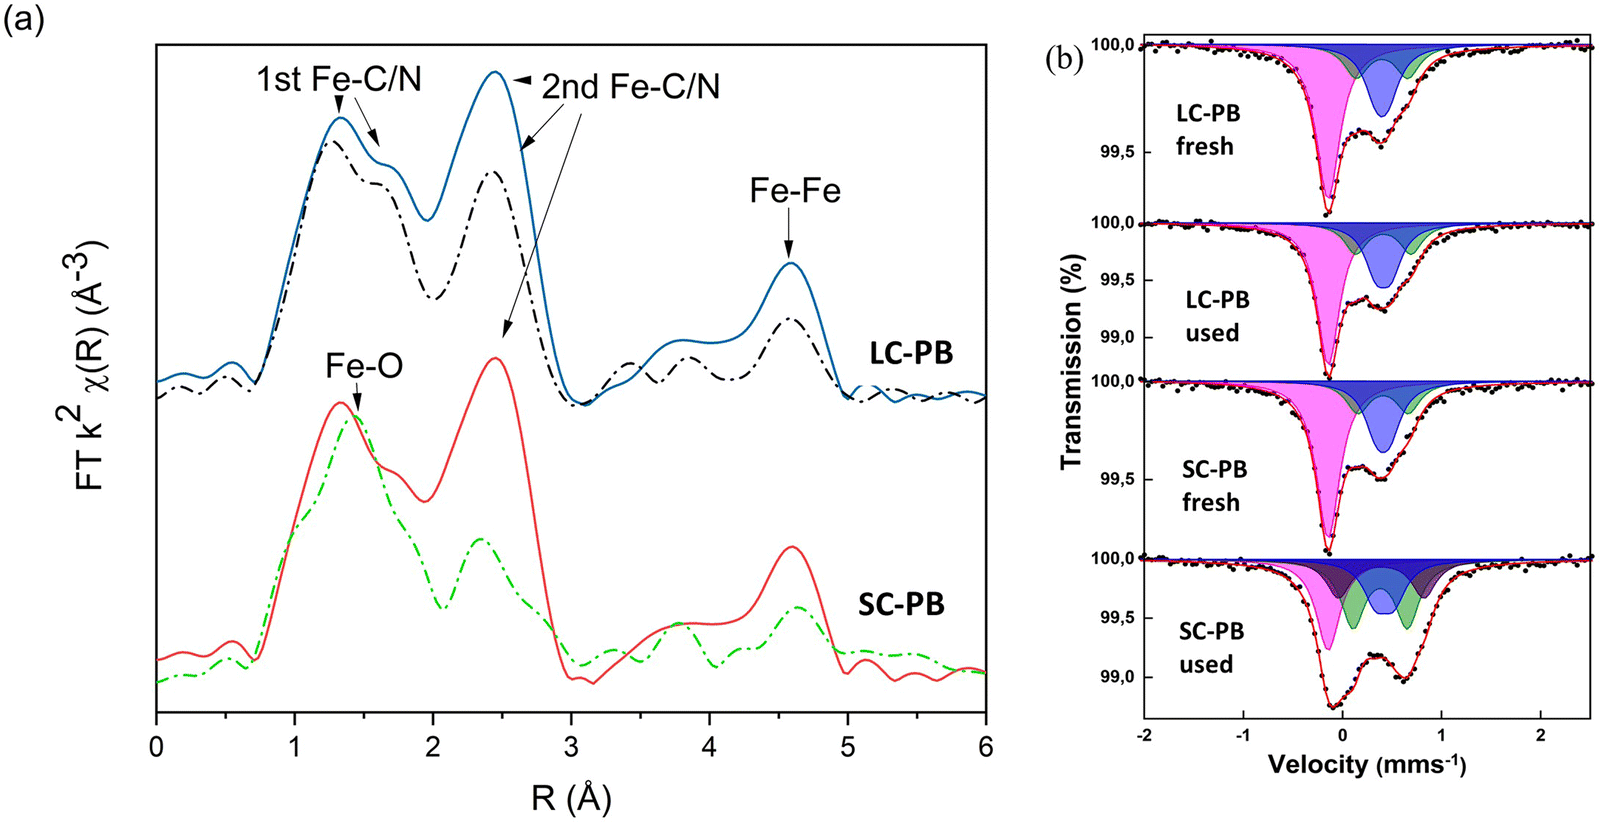 | ||
| Fig. 1 Ex situ Characterization of LC-PB and SC-PB pre and post repeated CV cycles. (a) The magnitude of the FT of Fe K-edge EXAFS. Fresh LC-PB (blue), used LC-PB (dashed black), fresh SC-PB (red), used SC-PB (dashed Green). (b) Room temperature Mössbauer spectra. Fit (red), low spin Fe(II) singlet component (magenta), high spin Fe(III) doublet components 1 (blue), 2 (green) and 3 (brown). | ||
A cyclic voltammogram (CV) of LC-PB within the 3-electrode operando XAS cell, using a Pt counter electrode, in 0.1 M KNO3(aq) electrolyte and cycled vs. an Ag/AgCl reference, is shown in Fig. 2a. The reduction and oxidation peaks at 0.034 V and 0.22 V are due to the high spin (Fe2+/3+) redox pair transition of PB to PW (and vice versa). The reduction peak suggests intercalation of K+ ion into the LC-PB lattice although, as noted previously, contributions from H+ or OH− cannot be excluded (see Scheme 1).15 The observation of an oxidation peak at 0.22 V, with an identical area and height to the reduction peak, indicates the deintercalation of K+ ion as well as the quasi-reversibility of the process. The 186 mV peak separation suggests that the rate of intercalation and deintercalation of the hydrated K+ ion in and out of the LC-PB lattice is slow and Nernstian concentration is not maintained throughout these processes. The peaks corresponding to the low spin (FeII/III) redox pair transition of BG to PB (and vice versa) are at 0.88 V and 0.73 V, respectively, and appear to be quasi-reversible with peak-to-peak separation of 150 mV. The recorded CV shapes, with both redox pairs being observed in an equivalent voltage window, are comparable to those found in the literature.11
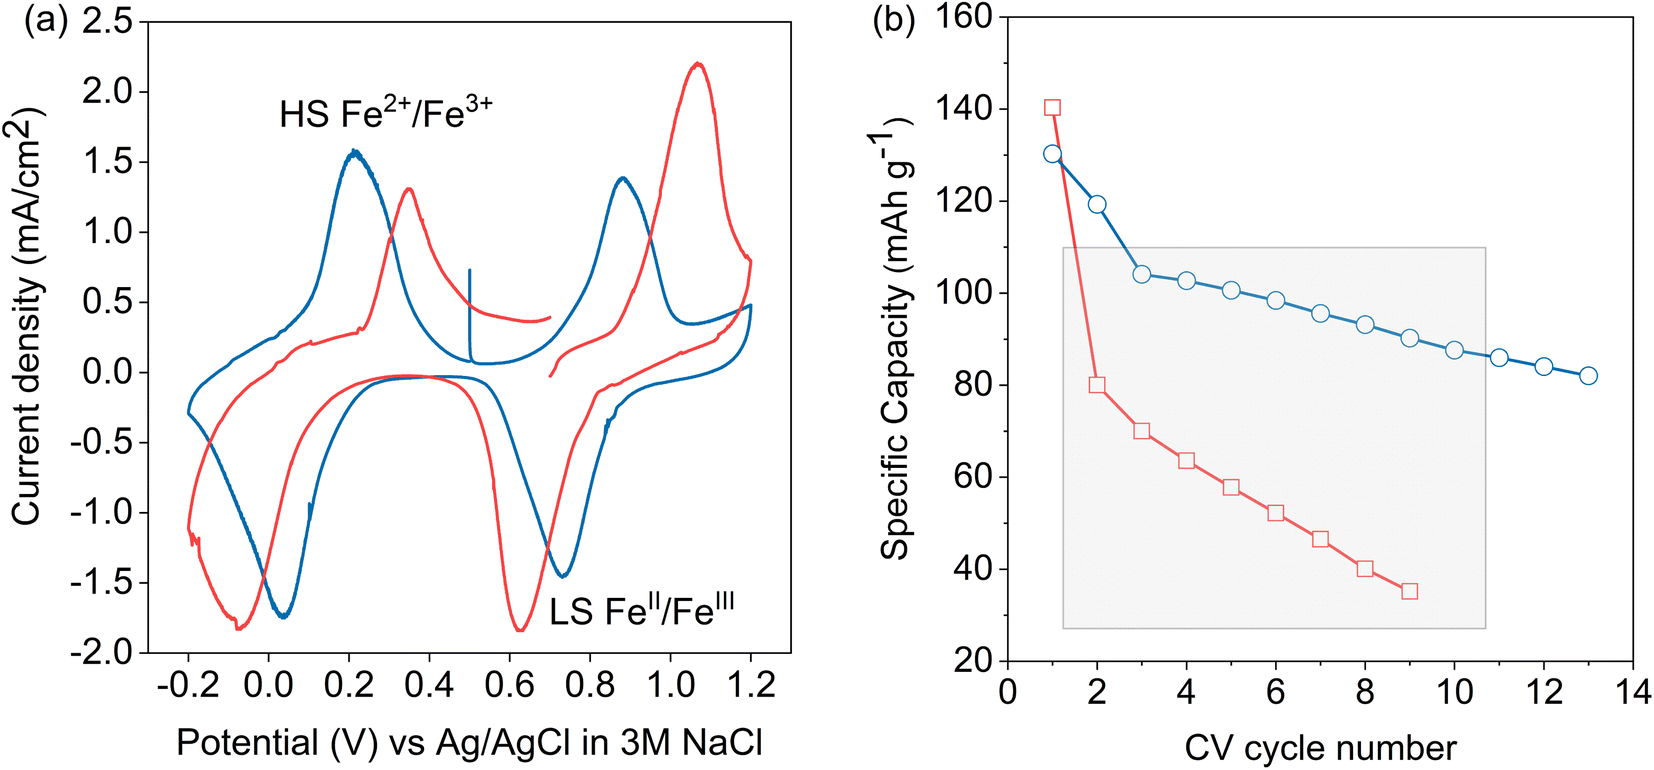 | ||
| Fig. 2 Electrochemical performance of LC-PB and SC-PB. (a) Cyclic voltammograms of LC-PB (blue) and SC-PB (red). Performed within the 3-electrode operando cell, with Pt counter electrode, Ag/AgCl reference electrode, a scan rate of 0.77 mV s−1 and a 0.1 M KNO3 aqueous electrolyte. (b) Discharge capacities determined from repeated CV cycling of LC-PB (blue) and SC-PB (red). Grey box illustrates CV cycles that were subsequently investigated using operando potassium K-edge XANES. | ||
While the same two redox pairs are observed in SC-PB, the electrochemical behavior is somewhat different (Fig. 2a). The redox processes show a significantly greater peak separation of 460 mV (transition of BG to PB) vs. 150 mV seen for LC-PB (and vice versa), illustrating a quasi-reversible process with much slower kinetics than LC-PB. This could be due to slower charge transfer or alternatively greater particle and contact resistance seen with SC-PB. Unwin and co-workers clearly illustrated that increased electrical resistance increased CV peak separation in scanning electrochemical cell microscopy measurements of LiMn2O4 at fast scan rates of 1 V s−1.37 Although the impact of resistance on peak separation is anticipated to be limited by the slow scan rate of 0.77 mV s−1 used in our study, the impact of the relatively poor conductivity of PB (ca. 1 × 10⁻⁷ S cm−1)38 should not be discounted. In particular the large aggregates of SC-PB seen by SEM (Fig. S4†) with relatively poor dispersion, when compared to LC-PB, in the conductive carbon of the assembled matrix could well account for substantial resistance within the SC-PB cathode.
It was noted that the 1st CV of SC-PB was not stable as it displayed a clear break at 0.7 eV, suggesting a significant change in electrochemical performance within this 1st CV. Notably, LC-PB displayed clear stability over this 1st CV. The varying stability of LC-PB and SC-PB was further investigated over repeated CV cycles, with calculated discharge capacities given in Fig. 2b (specific changes in CVs are discussed in Section 2.4 with XANES analysis). LC-PB capacity was mostly retained with a 35% reduction over 13 cycles, while SC-PB showed significant instability with 80% loss of capacity over 9 cycles.
Ex situ analysis of electrodes after cycling showed a loss of structural order in both cathodes, but to a significantly greater extent in SC-PB (Fig. 1). Specifically, Fe K-edge EXAFS showed reductions in 2nd shell Fe–C/N and Fe–Fe path intensities, indicating a loss of short-range order in both samples, although to a far greater extent for SC-PB. There is a clear correlation from EXAFS between the loss in intensity of 2nd shell Fe–C/N and the loss of capacity of the PB samples on cycling. No change in phasing was observed in the EXAFS of LC-PB, indicating no bulk formation of a new structure. In contrast, an increased contribution of a Fe–O path, as indicated by a shift in the 1st feature of the FT towards 1.5 Å, is seen in SC-PB after cycling, attributable to the presence of a new additional oxidic phase. 57Fe Mössbauer analysis (Fig. 1b and Tables S3 & S4†) shows no degradation to LC-PB after cycling, while significant changes were seen for SC-PB. For the spectrum of the SC-PB material, the conventional fitting with 2 Fe(III) doublets was not valid and a further 3rd Fe(III) component with a larger quadrupole splitting was needed to satisfactorily fit the data. The resultant ratio of areaFe(III):areaFe(II) for SC-PB after cycling changed from 1:1 to 3:1, which is far beyond the reasonable limit for PB and implies the presence of an additional Fe(III) phase. A further fit of the SC-PB after cycling spectrum using the original PB components revealed hyperfine parameters of two doublets, which is consistent with the poorly crystalline phase, ferrihydrite (Fig. S7†).39 The presence of ferrihydrite within the sample is further evidenced when comparing Fe-K edge XANES and EXAFS of the SC-PB used electrode and a ferrihydrite standard (Fig. S8 & S9†). There was no change in microstructure, formation of cracks, or exfoliation from the current collector observed in the used samples by SEM (Fig. S10†).
The combination of techniques provides an overall picture a relatively stable LC-cathode with a small but notable loss of long-range order over cycling, and a SC-PB cathode that undergoes rapid degradation through loss of PB short-range order and formation of non-conductive ferrihydrite. The analysis provides an understanding of differences in framework electrochemical properties and associated bulk structural changes, though further work is necessary to provide information on the K+ charge carrier speciation and evolution during charge/discharge cycling.
2.2 Understanding the local K+ coordination from potassium K-edge XANES
Potassium K-edge XANES of LC-PB were recorded at voltages of 0.41 V during charging, and 0.9 V and −0.1 V during discharge (indicated on the CV in Fig. 3a, with spectra shown in Fig. 3b). At 0.41 V, the spectrum was comparable with that recorded for PB prior to the addition of electrolyte (Fig. S9†) with notable features at 3610.1 eV (pre-edge), 3612.3 eV (white line shoulder), 3614.3 eV (white line), 3617.7 eV and 3619.8 eV (small doublet peaks after white line), and extended features beyond 3625 eV. Significantly, the XANES spectra of the KNO3(aq) electrolyte alone (red spectrum in Fig. 3b) is clearly distinguishable, through a more intense pre-edge feature, and a broad single structure centered at 3616.7 eV. This spectra of dissolved KNO3(aq) (i.e. the electrolyte) is identical to that of KCl(aq), but notably different to the equivalent KNO3 and KCl solid crystal structures, as shown in Fig. 4. Therefore, a distinct spectrum of aqueously solvated K+ can be identified. The observations show the potential of operando K-edge potassium XANES, as the spectrum of K+ within the cathode and electrolyte can be easily differentiated. At 0.9 V (discharge), the spectrum of the cathode is comparable to the electrolyte with residual features associated with PB, showing that almost all K+ has been deintercalated from the now oxidized BG structure. The result suggests that K+ is acting as a charge carrier under the conditions monitored and can be fully deintercalated from the structure. Lastly, holding at −0.1 V resulted in a 3rd XANES spectrum, which is associated with the fully reduced Fe2+FeII PW structure, with full K+ intercalation. The features of the XANES spectrum for the postulated PW structure differ from that of PB, with an enhanced pre-edge feature, a change in intensity ratios of the split main feature, and emergence of another strong shoulder at 3616.3 eV.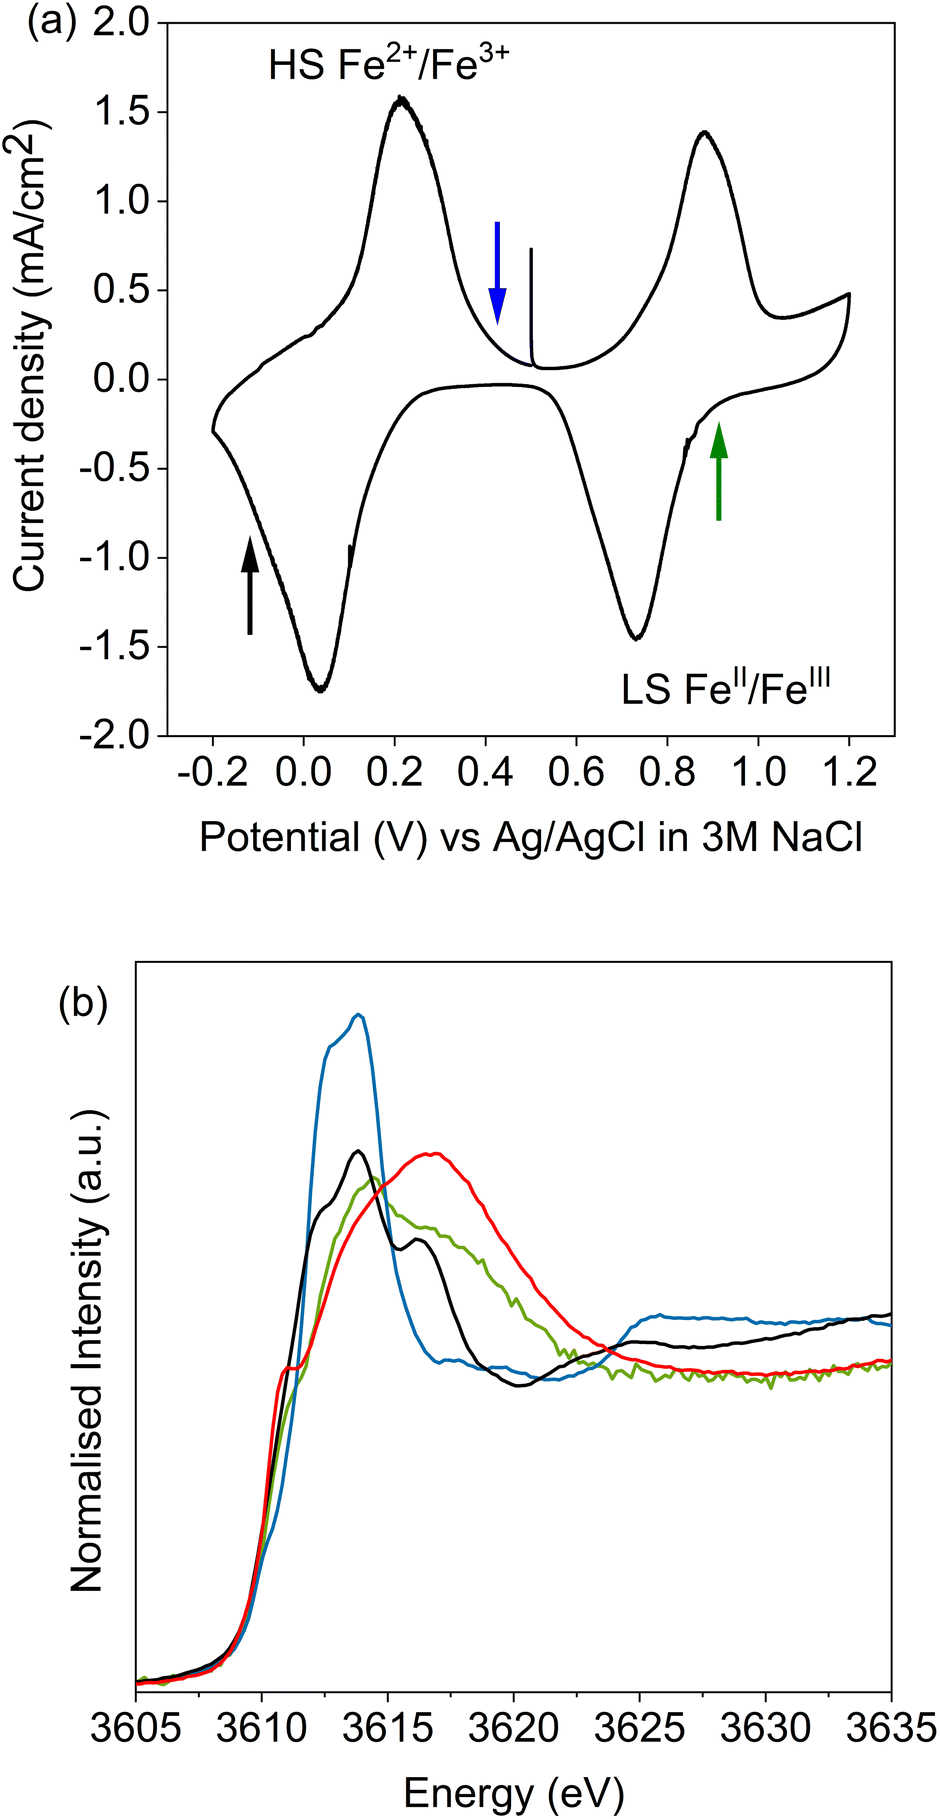 | ||
| Fig. 3 Potassium K-edge XANES of LC-PB at applied voltages. (a) Cyclic voltammogram of LC-PB, arrows indicate voltages that the sample was held at for XANES measurements. (b) Potassium K-edge XANES of samples held at denoted points during the CV. LC-PB sample at 0.41 V charge (blue); sample at 0.9 V discharge (green); sample at −0.1 V discharge (black); KNO3(aq) (red). CV measurements were made performed within the 3-electrode operando cell, with Pt counter electrode, Ag/AgCl reference electrode, a scan rate of 0.77 mV s−1 and a 0.1 M KNO3 aqueous electrolyte. | ||
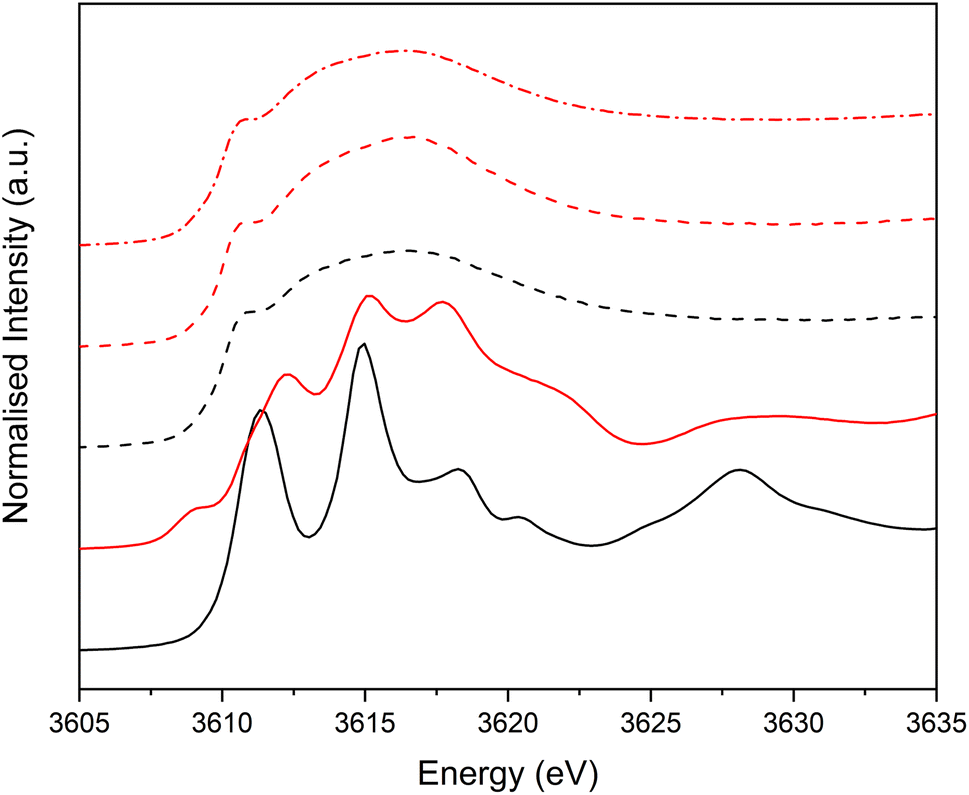 | ||
| Fig. 4 Potassium K-edge XANES comparing dissolved HCl(aq) and KNO3(aq) and their associated solid salts. KCl salt (black solid line); 1 M KCl(aq) (black dashed); KNO3 salt (red solid line); 0.1 M KNO3 (aq) (red dashed); 1 M KNO3(aq) (red dashed dotted). | ||
By comparison, SC-PB analyzed prior to addition of electrolyte, or an applied voltage, shows subtle difference in K+ speciation (Fig. S11†). Linear combination fitting (LCF) allows assignment of 68% K+ within a comparable environment to LC-PB, and 32% adsorbed K+ in a solvated environment, possibly as surface adsorbed species. Subsequently, the structural formula determined by elemental analysis can be revised to K0.71Fe[Fe(CN)6]0.94.4.1H2O + 0.33K+(ads). Introduction of electrolyte results in the XANES spectrum of SC-PB changing to that seen for LC-PB, which shows the removal of adsorbed K+ from the PB surface. At the same voltages of −0.1 V, 0.4 V, and 0.9 V that were applied to LC-PB, potassium XANES of SC-PB gives comparable pre-edge positions, main feature splitting, and extended structural features for K+ in PB, PW and electrolyte environments, as seen for LC-PB (Fig. S12†). Interestingly, these results show that the local environment of K+ is comparable in both samples after residual K+(ads) is washed from the surface by the aqueous solvent. This observation correlates to information from the framework perspective, as provided by Fe K-edge XAS and 57Fe Mössbauer, which showed similar structural order and defect formation in both samples.
To rationalize the observed spectra, several theoretical structures were validated by density functional theory (DFT) simulation, before being used to simulate the potassium K-edge XANES. The electronic and structural properties of K+ inclusion within the ideal PB structure verified that the ion sits in the center of half of the primitive cubic structural cavities (8c sites), in an ordered tetrahedral pattern (as shown in Scheme 1a). Analysis of the electronic density of states (DOS) is consistent with the expected changes in Fe oxidation and spin states on removing all K+ (BG), or when fully oxidizing the system by filling all 8c sites (PW) (Fig. S13†). The use of the exchange–correlation (XC) functional of HSE06 describing the band gap relatively well, as previously reported.40 Next, the inclusion of H2O was considered in competition with K+ for the 8c site, which increased the distance between intercalated K+, as it is pushed towards the corners of the primitive cell into the 32f′ position (Fig. S14 & S15†). Increasing the water content from 4 to 16 H2O molecules per unit cell pushes the K+ further away from the central 8c site, with the inclusion of 8 H2O calculated as the most thermodynamically viable.
Finally, the influence of the FeII(CN)6 defects was considered by the removal of the central FeII(CN)6 octahedra and addition of a (H2O)6 cluster. In this scenario K+ has been considered in two locations (Fig. S16†). When K+ was considered within the cavities, it was pushed away from the 8c site towards the 32f′ position, relative to the ideal water free PB structure. The enthalpy of formation (ΔHform) of this intercalated structure is higher with the inclusion of the defect, supporting notions that structural defects would inhibit K+ intercalation.27 Alternatively, K+ was considered within the central (H2O)6 cluster (equivalent to Scheme 1b), with ΔHform (at comparable K+ loading) being less favorable than for the defective system with K+ within the channel. Therefore, K+ is unlikely to be located within this defect site.
Simulation of the XANES spectrum of the ideal PB structure, with K+ on the 8c site, is compared in Fig. 5a with the experimental spectra of LC-PB. The pre-edge (feature A), white line shoulder (features B & C) and white line (feature D) were successfully simulated. These features are attributed from the projected DOS (Fig. 5b) to low lying K p-states overlapped with Fe orbitals (A), hybridized K p-states with CN anti-bonding π orbitals (B & C), and isolated K p-states (D), respectively. While most features are well represented, the intensity of feature C is significantly underestimated in the original simulation. Given that K+ at the 8c site is a significant distance from CN π anti-bonding orbitals, a lack of overlap between K p-states and these π orbitals can account for the low intensity of feature C and dominance of D. As noted, when performing the FHI-DFT simulations, the inclusion of water molecules or defects pushes K+ towards the Fe3+–N corners of the primitive cube (32f′ position), which would increase orbital overlap of states associated with feature C. XANES simulation of K+ within this 32f′ position (Fig. 5c) did indeed show an increased contribution to the XANES from feature C and brought the XANES simulation into closer agreement with experiment. In contrast, XANES simulation for K+ within the defective system (Scheme 1b) was not representative of the experimental XANES (Fig. S17†), which agrees with the greater ΔHform calculated by DFT and further suggests that K+ does not reside within the defect (Fig. S16†); the evidence is more compelling for K+ being forced into the corners of the channels by these defect sites or occluded water within the structure.
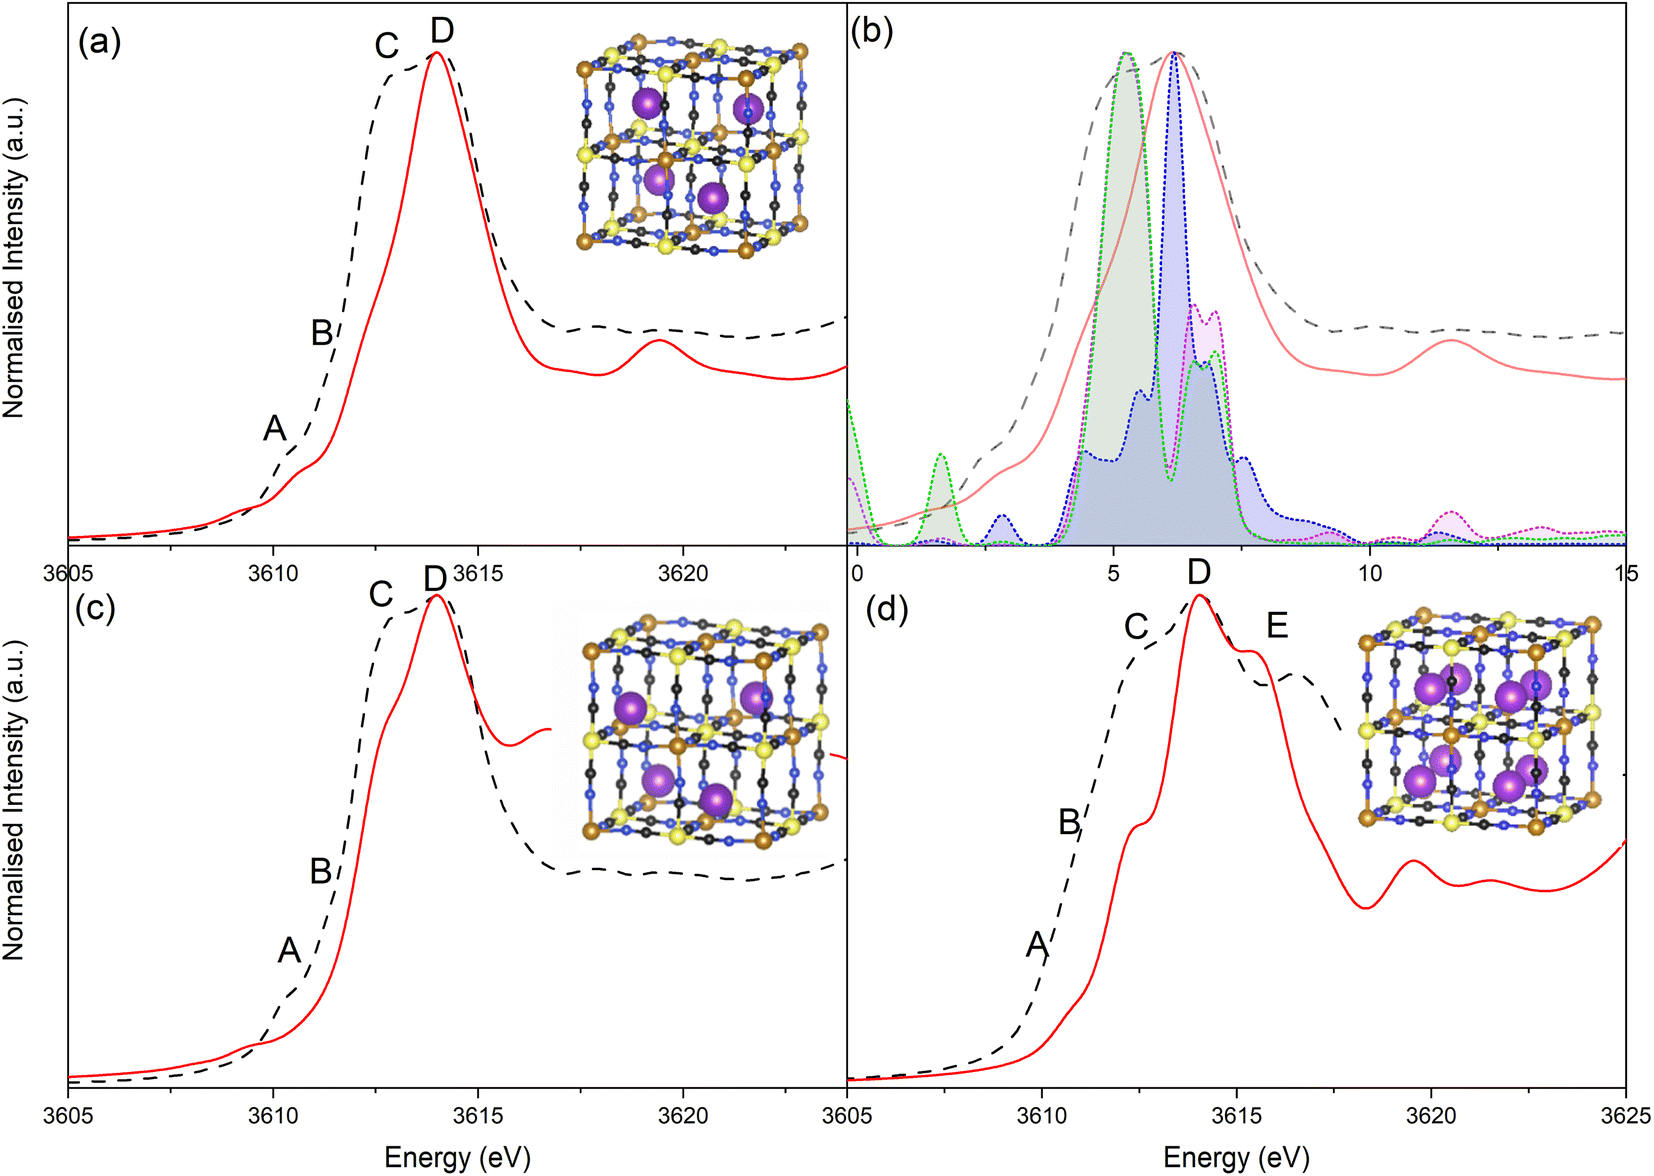 | ||
| Fig. 5 Comparison of experimental potassium K edge XANES (black dashed) and simulated XANES (red). (a) Prussian blue with K+ within the ideal 8c cage site. (b) Projected p-type density of states from PBEsol optimized structures from XANES simulations for Prussian blue with K+ within the ideal 8c site: potassium p-type DOS (blue); N p-type DOS (green); C p-type DOS. (c) Simulated XANES of Prussian blue with K+ being in the 32f site towards the high spin Fe3+ corners of the cage (non-relaxed structure). (d) Simulated XANES of Prussian white with full K+ occupancy. | ||
The XANES spectrum calculated for the PW structure (Fig. 5d) replicated the experimental features seen at −0.1 V, including the additional feature at 3616.3 eV (feature E) that is not observed for PB. The position of feature E is shifted relative to experiment, which is due to inaccuracies in core–hole interactions within our model; adjustment of the core–hole interaction strength and/or simulation using alternative finite difference methods results in a more accurate representation of this specific feature (Fig. S18 & S19†). The results validate the assignment of the experimental XANES spectrum to a fully intercalated PW structure, where the sample is fully reduced. Using simulation to validate the spectrum is particularly important given that PW readily oxidized under ambient conditions to PB, making validation via the use of a synthesized material analyzed ex situ unsuitable. As seen with the simulated spectra of PB with K+ within the 8c site, the shoulder of the white line is mispresented in the simulated spectrum of PW, showing that K+ continues to be off center from the 8c site within the fully intercalated structure.
2.3 Operando potassium K-edge XANES of PB cathodes
Unnormalized operando spectra, obtained throughout a CV of LC-PB, are shown in Fig. 6a, alongside the determined compositions of potassium within PB, PW, and electrolyte environments (Fig. 6b). The compositions are determined from the potassium K-edge step values and associated fractions of each K+ species determined by LCF analysis (Fig. S20†). Visual inspection of the unnormalized spectra in Fig. 6a shows a clear evolution of speciation through the voltage sweep, and a change in edge step height. As K+ speciation evolves through the different environments of PB and residual electrolyte, the edge step decreases as K+ is removed from the cathode. The edge step then increases as the sample is oxidized to PB and then PW. Consequently, comprehensive analysis of both K+ speciation and its relative concentration within the PB cathode, with respect to applied potential and current response, can be made during charge/discharge cycling.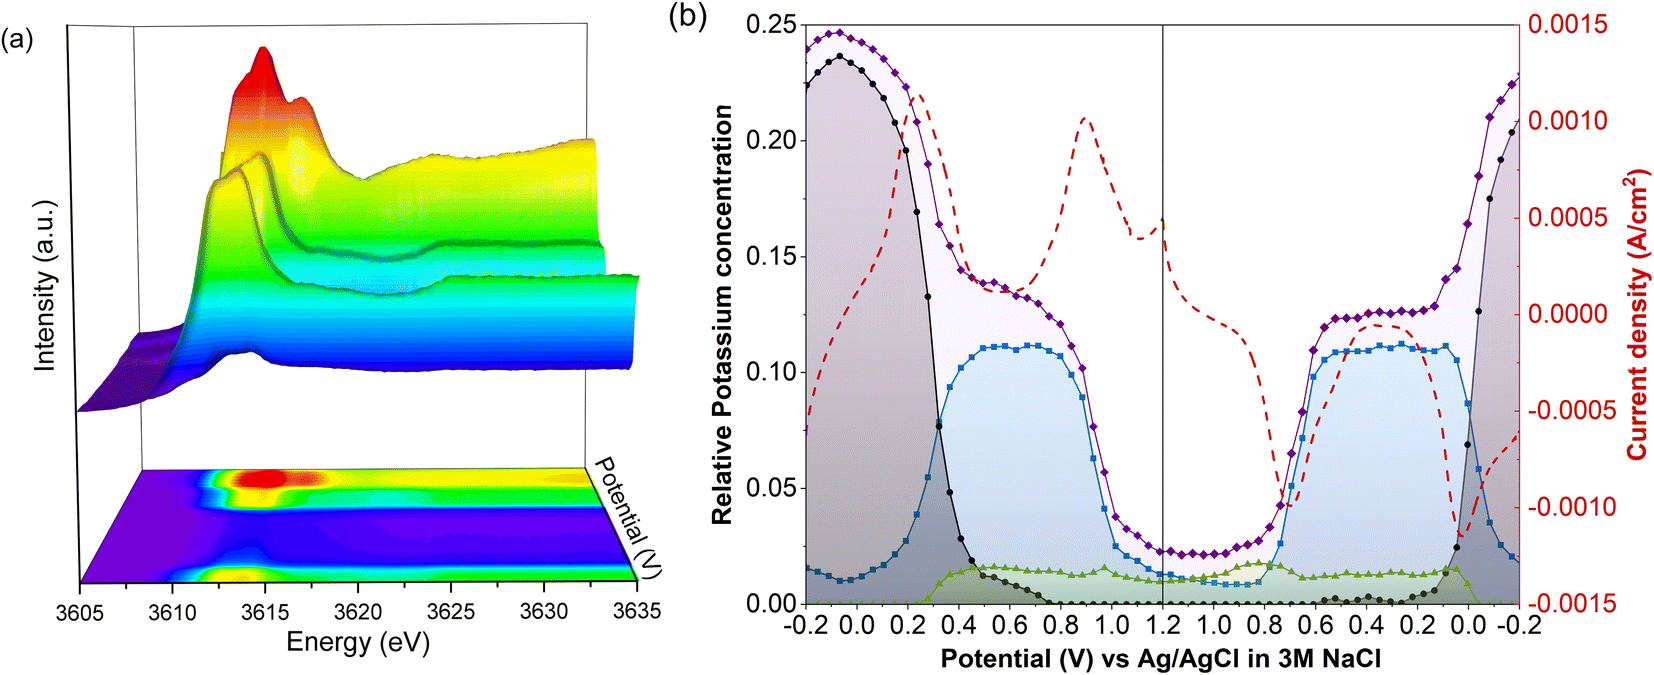 | ||
| Fig. 6 Operando potassium K-edge XANES of LC-PB during cyclic voltammetry. (a) XANES plot showing evolution of unnormalized spectra from 0.56 to 0.33 V. (b) Pseudo-concentration of potassium speciation with respect to applied potential and current density. Current density (red dashed); total edge step value of potassium XANES (purple); potassium associated with PW structure (black); potassium associated with PB structure (blue); potassium associated with KNO3(aq) (green). Pseudo-concentration of potassium determined by multiplication of edge step date by fraction of potassium determined by linear combination fitting of XANES. Performed within the 3-electrode operando cell, with Pt counter electrode, Ag/AgCl reference electrode, a scan rate of 0.77 mV s−1 and a 0.1 M KNO3 aqueous electrolyte. | ||
The changes in K+ for the 1st full CV, starting from PW, are shown in Fig. 6b. Deintercalation of K+, as evidenced by the decrease in the step edge, clearly occurs in two stages and at the same potentials of 0.22 V and 0.88 V as seen from the current responses in the voltammogram. When observing the evolution of individual K+ species, the stages that occur are the deintercalation of K+ from within PW due to its oxidation to PB, and then further deintercalation from oxidation to BG. Again, the evolution of specific K+ environments associated with these framework structures can be directly correlated to redox features within a CV. Each deintercalation event is followed by further small and gradual losses in K+ signal (i.e., poorly defined plateaus of K+ concentration), which occur within the voltage windows of 0.4–0.8 V and 1.0 V charging cycle to 1.0 V discharge cycle. Analysis of the individual XANES components shows that this gradual loss of K+ concentration between oxidation events is due to deintercalation of kinetically hindered K+ from within PW and PB environments respectively. Furthermore, the sluggish deintercalation of K+ from residual PB sites within the cathode is particularly apparent from the LCF of the normalized spectra (Fig. S18†). Zampardi et al. noted that the deintercalation of K+ from PB to BG can be sluggish in composite electrodes, corresponding to the slow K+ evolution seen in the XANES.41 Interestingly, this kinetically hindered K+ was hypothesized not to be an intrinsic property of PB but of the assembled electrode and associated electrostatic effects, as supported by the resent multiscale measurements by Unwin and co-workers using scanning electrochemical microscopy on LiMn2O4.37
The corresponding two step intercalation of K+ during reduction of BG to PB, and then to PW, can also be directly observed from the increases in K+ concentration and the evolution of K+ environment. In contrast to oxidation, a clear plateau in K+ concentration, and PB speciation, is observed between the two reduction events. The result suggests that the reduction process is more facile, with no residual intercalation being observed. Given that the total edge step intensity does not return to its initial value the apparent improvement in kinetics could be the consequence of poorly conductive intercalation sites, seen during oxidation, not participating in the subsequent reduction. Evidently, throughout the entire redox process of PB, K+ acts as the predominant charge-balancing species through intercalation processes, with no clear discrepancies seen between this process and the recorded current response during cycling. It is important to note that the apparent loss of solvated K+ associated with electrolyte when the sample is fully reduced to PW is likely an artifact of the analysis, as the PW standard XANES spectrum used in LCF analysis itself contained an electrolyte component.
Operando XANES of SC-PB (Fig. 7) revealed significantly different behavior to LC-PB (LCF vs. edge step data shown in Fig. S21†). Starting from −0.2 V of the 2nd CV cycle, a very low current response is seen when sweeping the potential between 0.1 to 0.5 V. The lack of current response suggests minimal oxidation of species, either due to minimal PW being formed from the preceding PB reduction or a lack of oxidation of PW. Interestingly, XANES analysis of K+ speciation shows that ca. 20% of K+ was already within a PB environment at −0.2 V, partially explaining the low current response. However, the remaining ca. 80% of K+ was present within a PW environment and the deintercalation of the K+ from the PW environment is clearly observed during the oxidative potential sweep. The rate of deintercalation from PW was incredibly sluggish, with considerable K+ being retained in SC-PB up to 0.8 V (i.e., within PW) and no clear plateau of K+ concentration exists. Surprisingly, the deintercalation process shows minimal current response, suggesting a non-faradaic chemical process is responsible for a significant proportion of the PW deintercalation.
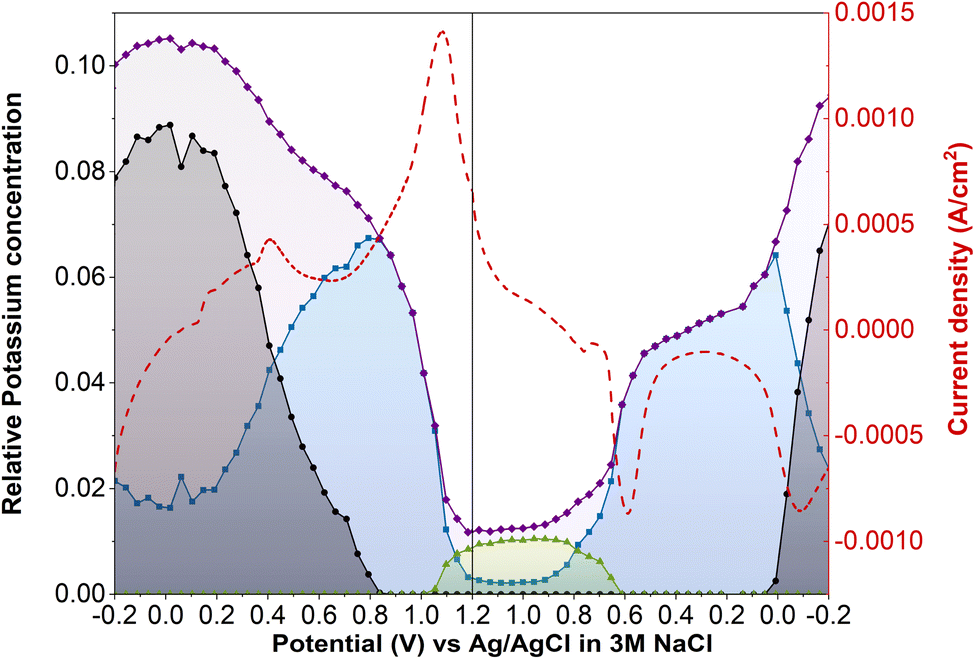 | ||
| Fig. 7 Pseudo-concentration of potassium speciation during operando potassium K-edge XANES of SC-PB cyclic voltammetry. Current density (red dashed); total edge step value of potassium XANES (purple); potassium associated with PW structure (black); potassium associated with PB structure (blue); potassium associated with KNO3(aq) (green). Pseudo-concentration of potassium determined by multiplication of edge step date by fraction of potassium determined by linear combination fitting of XANES. Performed within the 3-electrode operando cell, with Pt counter electrode, Ag/AgCl reference electrode, a scan rate of 0.77 mV s−1 and a 0.1 M KNO3 aqueous electrolyte. | ||
Further oxidation of PB to BG was facile, with rapid K+ deintercalation and a strong simultaneous current response. Given that little difference in defect structure has been demonstrated for LC-PB and SC-PB, these differences are attributed to variation in composite film microstructure seen by SEM (Fig. S4†), as reported by Zampardi et al.41 From the XANES analysis, it is evident that K+ is almost completely deintercalated from PB, with the remaining K+ that is seen after the current response attributed with the electrolyte. Therefore, while the high spin redox process appears to be incomplete (i.e., K+ is not completely converted from a PB environment to a PW one), the K+ removal during low spin PB to BG is far more favorable and goes to completion. The subsequent intercalation of K+ from BG to PB also appears facile, although observation of the total edge step shows that significantly less K+ is present within the sample after the low spin redox process, in agreement with the reduced current response (i.e., K+ signal at the two relevant current response plateaus are not equal). Finally, unlike during oxidation, the intercalation of K+ during PB reduction to PW corresponds to a clearly observable current response, indicating that this process is faradaic in nature.
2.4 Operando XANES of PB cathodes during repeat cycling
Operando XANES was used to follow changes in K+ speciation within LC-PB between CV cycles 3 and 10 (Fig. 8a), over which time a 15% loss in capacity was observed. While minor shifts in the CV peak positions occurred during LC-PB cycling, the electrochemical properties of the sample remained relatively consistent. Based on the edge step of the unnormalized XANES (Fig. 8b), clear repeatable cycles of K+ concentration can be observed. Notably, the plateaus and maxima of K+ concentration reduce slightly, by 30% accross all cycles, while the minima remain constant. LCF of the potassium XANES across the repeated cycles is shown in Fig. 8c, with the cycling of the three K+ environments being relatively consistent, as expected. Therefore, it can be concluded that the intercalation sites present, while dropping slightly in absolute number, continuing to effectively cycle between the K+ species discussed over the 8 CV cycles investigated. The modest loss of structural order and intercalation sites on cycling of LC-PB, as determined by Fe K-edge EXAFS analysis (Section 2.1), explains the decrease in K+ intercalation seen from edge step analysis. Nevertheless, the effective cycling of the remaining K+ species shows that sufficient framework order is retained to maintain conductivity and electrochemical efficiency.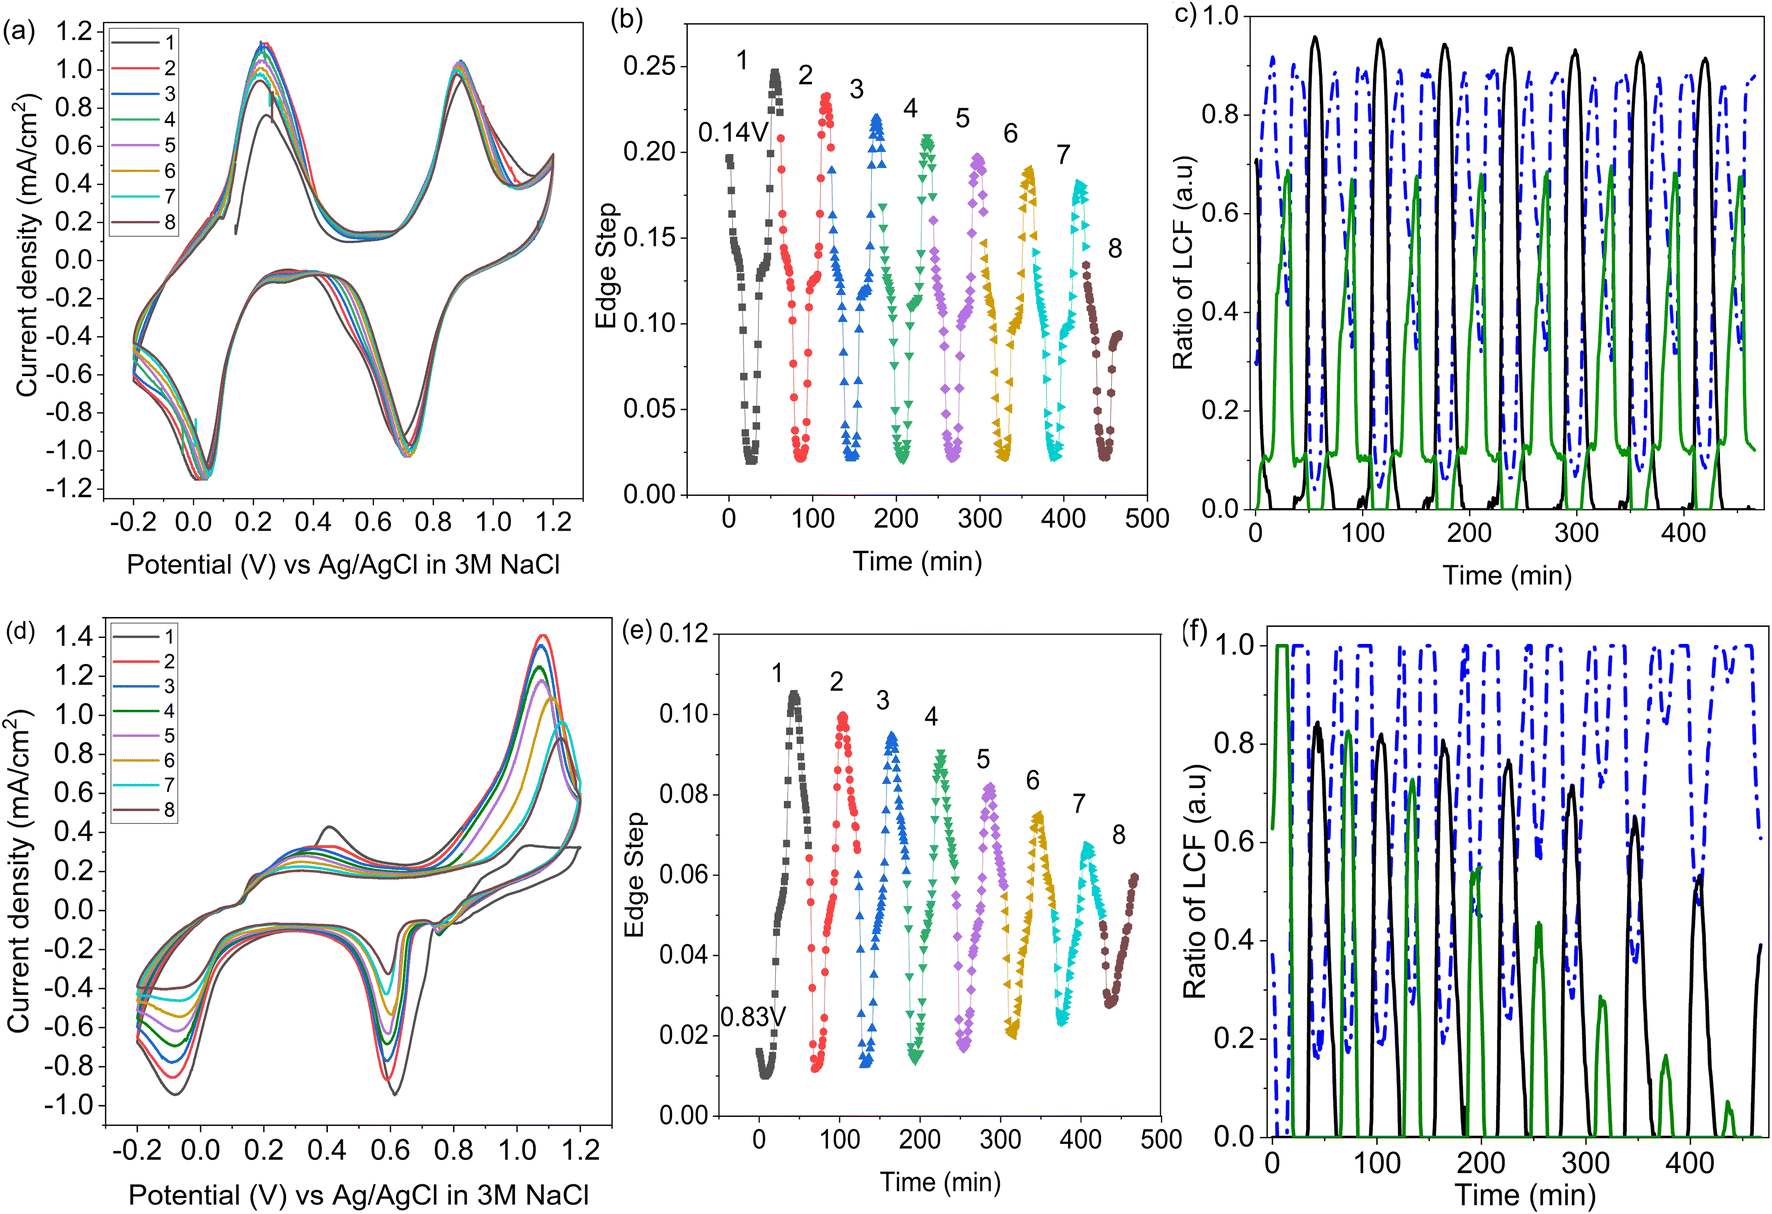 | ||
| Fig. 8 Operando potassium K-edge XANES of SC-PB and LC-PB over multiple CV cycles. Top panel describes LC-PB; (a) operando CV scans; (b) associated potassium edge step (pseudo-concentration of K+); and (c) associated linear combination fitting of recorded potassium K-edge XANES. Bottom panel describes SC-PB; (d) associated operando CV scans; (e) associated potassium edge step (pseudo-concentration of K+); and (f) LCF results from XANES measurements. Figures (a), (b), (d), and (e) (CVs & edge step data); scan 1 (black); scan 2 (red); scan 3 (blue); scan 4 (green); scan 5 (purple); scan 6 (orange); scan 7 (cyan); and scan 8 (brown). Figures (c) and (f) (LCF analysis); potassium associated with PW structure (black); potassium associated with PB structure (blue); potassium associated with KNO3(aq) (green). | ||
In contrast, SC-PB showed clear instability over the 8 cycles when studied by operando XANES, with 62.5% loss of capacity (CV scans shown in Fig. 8d). Changes to the CVs consist of a shift in peak potential by 0.08 V for PB → BG oxidation and a reduction in peak current magnitude. A shift to lower V for the BG reduction is also observed between the 1st and 2nd cycle, and then the peak position stabilized at 0.6 V but with a reduction in peak magnitude over increasing cycles. A minimal shift in peak potential was observed for the high spin redox couple, with a dramatic decrease in the magnitude of the features, which was particularly prominent for the current response associated with PW reduction to PB. Evidently a series of complex changes occur during cycling, which the operando XANES can help rationalize.
In accordance with the dramatic capacity loss seen for SC-PB, the Δ edge step, which corresponds to the change in unnormalized potassium K-edge XANES edge step during charge/discharge, decreases by 54% over 7 cycles (Fig. 8e). In SC-PB, the edge step values show a different trend to that observed for LC-PB on repeat cycling, with the maximum and minimum K+ concentrations both converging on a relatively stable PB plateau. By contrast K+ signal only decreased in respect to a loss of fully intercalated PW sites on cycling of LC-PB. LCF analysis (Fig. 8f) of the SC-PB data shows a dramatic loss of K+ signal variation associated with either electrolyte or PW as CV cycling progresses, with complementary increase of a signal associated with K+ trapped within the PB structure. The entrapment of K+ within an PB environment throughout the potential sweeps showed that SC-PB becomes electrochemically inactive. A loss of conductivity due to the collapse of the short-range order within PB and ferrihydrite formation (Section 2.1) explains the observed trapping of charge carriers in the remaining PB sites within the cathode.
3 Conclusion
Potassium K-edge XANES has been used to understand the location of K+ within the Prussian blue structure. Differentiated K+ species were clearly observed, associated with the fully intercalated Prussian white structure, partial intercalation within Prussian blue, and within the aqueous KNO3(aq) electrolyte. Theoretical simulations of Prussian blue, and associated XANES simulations, show that K+ resides within the cavities of the structure, but located away from the center of the primitive cubic cavities (8c site) and towards the corners of the cavities (32f′ position), due to structural defects or occluded water.Operando potassium K-edge X-ray spectroscopy has been applied during electrochemical redox reactions of Prussian blue within an aqueous KNO3 electrolyte, and definitively shows that K+ is the predominant species that balances structural charge during the relevant redox reaction. Within the large >100 nm domain sized Prussian blue sample, the intercalation process was reproducible over repeated charge/discharge cycles, although full deintercalation of K+ was kinetically hindered with residual evolution of K+ species being observed by XANES at potentials beyond that of the observed current response.
Significant degradation in electrochemical performance of a Prussian blue sample with smaller domains (<14 nm), with almost complete loss of capacity over 10 voltammetry cycles, was identified as being caused by K+ becoming trapped within the partially intercalated structure. The degradation is caused by an increase in structural disorder on cycling, which can be observed from the perspectives of framework Fe and also the K+ species. Specifically, non-conductive ferrihydrite forms on repeated cycling, which results in a loss of electrochemical activity, and K+ becomes trapped within the remaining thermodynamically stable Prussian blue within the cathode.
It is noted that the two fresh PB samples had no identifiable differences regarding observable defects, which therefore seem unlikely to be the cause of the differing electrochemical stability. Potentially the degradation process is exacerbated in the small crystallite sample by the poor electrical conductivity of these crystallites aggregating together when forming composite electrodes.
The study shows that operando potassium K-edge XANES can be successfully employed to effectively study the evolution of charge carrier species during an electrochemical process. Notable differences in XANES spectra of aqueously solvated K+, from its crystalline salts and spectra of it within inorganic phases has not been previously widely recognized. These findings show the potential of XANES to monitor the speciation of alkaline charge carriers, in a host of different battery and other electrochemical processes, has exciting future potential in characterization and development of new materials.
4 Experimental section
4.1 Material synthesis
SC-PB preparation is based on wet chemical precipitation method. Equimolar concentrations of Fe(NO3)3 and K4Fe(CN)6 solutions (5 mmol in 15 mL in DI water) were mixed together through dropwise addition. The solution was heated to 60 °C and kept under vigorous stirring for 2 hours. The resulting blue precipitate was separated via centrifugation at 10000 rpm for 5 minutes and washed 5 times with acetone and DI water. The resulting precipitate was dried in a vacuum oven at 80 °C for 3 hours.
LC-PB preparation is based on a previously described method with modifications.28 An equimolar ratio of K3Fe(CN)6 and K4Fe(CN)6 (10 mmol) was dissolved in a 150 mL 0.6 M HCl solution. The solution was heated to 80 °C and stirred for 20 hours. The resulting precipitate was filtered under vacuum and washed with DI water several times. The powder collected was dried in a vacuum oven at 80 °C for 3 hours.
4.2 Material characterisation
The thermogravimetric analyses were collected on a TA Q600 SDT system, the samples were heated to 900 °C under air with a 2 °C min−1 ramp rate. X-ray diffraction (XRD) patterns were collected on a Bruker D8 Discover diffractometer using Co Kα (λ = 1.79 Å) operating at 35 kV and 40 mA with a PSD Braun detector. CHN elemental analysis was performed on a PerkinElmer 2400. Before measurements, the samples were degassed overnight at 90 °C. ICP-AES experiments were performed on reaction filtrates using an Agilent 4210 MP-AES fitted with a SPS4 autosampler. SEM images were taken using the lower electron detector in a JEOL 7100F REGSEM. Infrared measurements were taken using a Shimadzu IT Affinity-1 spectrometer, using an attenuated total reflection crystal sampling technique. The investigated spectral range was from 4000 to 400 cm−1 with a resolution of 4 cm−1. The signal was obtained by averaging 16 scans. 57Fe Mössbauer spectra were recorded at room temperature in the transmission mode using a constant acceleration spectrometer and a 57Co(Rh) source. The velocity scale was calibrated using a 6 μm thick α-Fe foil. All the spectra were computer-fitted and the isomer shifts referred to the centroid of the spectrum of α-Fe at room temperature.4.3 Electrochemical evaluation
Electrochemical performances were performed in a 3-electrode operando cell (Fig. S22†). To compensate for the low energy of potassium XANES, 60 μm glassy carbon windows were used as both the current collector and X-ray window of the cell. The electrodes consisted of 80% active material, 10% C65 carbon black, and 10% polyvinylidene fluoride (PVDF) binder, which were ground together into a paste and spread on the substrate with a K-Bar at ca. 100 μm thickness. The total mass of the electrode was 2.6 mg with a geometric surface area of 0.8 cm2. The electrochemical performance of active material was evaluated using cyclic voltammetry (CV) at ambient temperature. A Pt wire acted as the counter electrode, and a Ag/AgCl (3 M NaCl) filled capillary tube as the reference electrode. The electrolyte comprised of flowing 0.1 M KNO3(aq). The measurements were performed using an Ivium OctoStat30 potentiostat.4.4 XANES measurements
XANES measurements was performed at B18 Beamline at Diamond Light Source, Didcot, UK. XANES were set-up with a fast-scanning silicon (111) double-crystal monochromator. Operando measurements (electrochemical measurements discussed above in electrochemical evaluation section) were taken in fluorescence mode. Spectra were collected with a ∼0.2 eV energy resolution and at 56 s per scan. For ex situ measurements, sample preparation consisted of spreading a thin layer of material on carbon tape and taken in total electron yield (TEY). XANES data was processed using Athena software of the Demeter package. Linear Combination Fitting of operando XANES on normalised datasets was carried out in the energy window of 3593–3643 eV.42 Standards for PB and electrolyte were recorded within the operando cell environment to mitigate for self-absorption effect. The PW standard was taken at a fixed −0.1 V potential after the current response stabilised.4.5 DFT simulations
Ab initio DFT calculations were performed using the numeric atomic orbital (NAO) package, FHI-aims,43 which is an all-electron, full-potential electronic structure code. The generalised gradient approximation (GGA) of Perdew–Burke–Ernzerhof, reparametrized for solids (PBEsol),44 was used as the exchange–correlation (XC) functional during geometry optimisations, with the XC functional of Heyd, Scuseria and Ernzerhof (HSE06)45 and a screening parameter, w, of 0.11 bohr−1 used for subsequent single point energy calculations on the optimised structures. Dispersion interactions were accounted for using the Tkatchenko–Scheffler method,46 which is a pair-wise additive approach to include van der Waals interactions within the system. Calculations were performed using a ‘light’ basis set of the 2010 FHI-aims release, with SCF convergence assumed when the change in density was 10−6 e Å−1. Calculations were performed with a converged Monkhorst–Pack k-point47 sampling grid of 4 × 4 × 4. Calculations were also performed spin-polarized to account for the iron spin-states, and the zeroth order regular approximations (ZORA) was used for relativistic treatments.Models were built and manipulated using the Atomic Simulation Environment (ASE) Python library.48 Full geometry and unit cell optimizations were performed using the Broyden–Fletcher–Goldfarb–Shanno (BFGS) algorithm,49–52 with convergence reached when the forces on all atoms become less than 0.01 eV Å−1.
4.6 XANES simulation
Simulations of X-ray absorption have been performed using the plane-wave pseudopotential DFT method available within the code CASTEP, with the generalized-gradient approximation taken for the XC functional, in the form of Perdew–Burke–Ernzerhof, reparametrized for solids (PBEsol).44 It is important to clarify that XANES spectra are determined from this XC functional and not the hybrid HSE06 function used for advanced electronic calculation in the DFT simulations discussed above. All ground-state simulations were converged with respect to the basis set and cutoff energy for all explored materials, resulting in the use of 750 eV cutoff energy and a 9 × 9 × 9 integration grid. Self-consistent calculations were performed to a total energy convergence value of 10−7 eV. Spectra have been generated via the inclusion of a core–hole potential on the ground-state electronic structure, as implemented in the code. Additional XANES simulations were performed using the finite difference method (FDM) to solve the Schrödinger equation on a discrete grid of points, with the FDMNES code.53,54 The Hedin–Lundqvist XC functional was utilized as the exchange–correlation approximation in this case. The calculations were performed using a cluster model, with a radius of 9 Å.Author contributions
AJM; methodology, validation, formal analysis, investigation, data curation, visualisation. OTB; methodology, software, validation, formal analysis, investigation, writing- original draft, data curation, visualisation. AJL; conceptualisation, methodology, supervision, writing – original draft, writing – review & editing, funding acquisition. UW; resources, writing – review & editing, supervision. SED; formal analysis, writing – review & editing. JFM; formal analysis, investigation, writing – original draft, writing – review & editing, visualisation. JE; writing – review & editing, supervision, formal analysis. MA; methodology, software, validation, formal analysis, investigation, writing – original draft, writing-review & editing, data curation, visualisation. GC; conceptualisation, investigation, resources, writing – review & editing, supervision, funding acquisition. SAK; conceptualisation, resources, data curation, writing – original draft, writing – review & editing, visualisation, supervision, funding acquisition and project administration.Conflicts of interest
There are no conflicts of interest to declare.Acknowledgements
We acknowledge Diamond Light Source for PhD funding for A. J. M., access to beamtime on B18 (proposal nt28095) and computing resources provided by STFC Scientific Computing Department's SCARF cluster. Loughborough Materials Characterization Centre and Dr Keith Yendall is thanked for access to SEM. OTB gratefully appreciates financial support from the Coleg Cymraeg Cenedlaethol scholarship programme. AJL acknowledges funding by the UKRI Future Leaders Fellowship program (MR/T018372/1). Computing resources for this work were provided by ARCCA at Cardiff University, Supercomputing Wales, which is part-funded by the European Regional Development Fund via the Welsh Government. We would like to thank Dr Ian McPherson for his advice and guidance.References
- S. Ferlay, T. Mallah, R. Ouahès, P. Veillet and M. Verdaguer, A Room-Temperature Organometallic Magnet Based on Prussian Blue, Nature, 1995, 378(6558), 701–703, DOI:10.1038/378701a0.
- S. S. Kaye and J. R. Long, Hydrogen Storage in the Dehydrated Prussian Blue Analogues M3[Co(CN)6]2 (M = Mn, Fe, Co, Ni, Cu, Zn), J. Am. Chem. Soc., 2005, 127(18), 6506–6507, DOI:10.1021/ja051168t.
- P. A. Haas, A Review of Information on Ferrocyanide Solids for Removal of Cesium from Solutions, Sep. Sci. Technol., 1993, 28(17–18), 2479–2506, DOI:10.1080/01496399308017493.
- P. Nie, L. Shen, H. Luo, B. Ding, G. Xu, J. Wang and X. Zhang, Prussian Blue Analogues: A New Class of Anode Materials for Lithium Ion Batteries, J. Mater. Chem. A, 2014, 2(16), 5852–5857, 10.1039/C4TA00062E.
- Z. Shadike, D.-R. Shi, Tian-Wang, M.-H. Cao, S.-F. Yang, J. Chen and Z.-W. Fu, Long Life and High-Rate Berlin Green FeFe(CN)6 Cathode Material for a Non-Aqueous Potassium-Ion Battery, J. Mater. Chem. A, 2017, 5(14), 6393–6398, 10.1039/C7TA00484B.
- J. Song, L. Wang, Y. Lu, J. Liu, B. Guo, P. Xiao, J.-J. Lee, X.-Q. Yang, G. Henkelman and J. B. Goodenough, Removal of Interstitial H2O in Hexacyanometallates for a Superior Cathode of a Sodium-Ion Battery, J. Am. Chem. Soc., 2015, 137(7), 2658–2664, DOI:10.1021/ja512383b.
- W. Wang, Y. Gang, Z. Hu, Z. Yan, W. Li, Y. Li, Q.-F. Gu, Z. Wang, S.-L. Chou, H.-K. Liu and S.-X. Dou, Reversible Structural Evolution of Sodium-Rich Rhombohedral Prussian Blue for Sodium-Ion Batteries, Nat. Commun., 2020, 11(1), 980, DOI:10.1038/s41467-020-14444-4.
- C. Vaalma, D. Buchholz and S. Passerini, Non-Aqueous Potassium-Ion Batteries: A Review, Curr. Opin. Electrochem., 2018, 9, 41–48, DOI:10.1016/j.coelec.2018.03.031.
- B. Wang, Y. Han, X. Wang, N. Bahlawane, H. Pan, M. Yan and Y. Jiang, Prussian Blue Analogs for Rechargeable Batteries, iScience, 2018, 3, 110–133, DOI:10.1016/J.ISCI.2018.04.008.
- J. Liu, C. Xu, Z. Chen, S. Ni and Z. X. Shen, Progress in Aqueous Rechargeable Batteries, Green Energy Environ, 2018, 3(1), 20–41, DOI:10.1016/J.GEE.2017.10.001.
- P. Padigi, J. Thiebes, M. Swan, G. Goncher, D. Evans and R. Solanki, Prussian Green: A High Rate Capacity Cathode for Potassium Ion Batteries, Electrochim. Acta, 2015, 166, 32–39, DOI:10.1016/j.electacta.2015.03.084.
- X. Wu, Y. Luo, M. Sun, J. Qian, Y. Cao, X. Ai and H. Yang, Low-Defect Prussian Blue Nanocubes as High Capacity and Long Life Cathodes for Aqueous Na-Ion Batteries, Nano Energy, 2015, 13, 117–123, DOI:10.1016/j.nanoen.2015.02.006.
- Y. Avila, P. Acevedo-Peña, L. Reguera and E. Reguera, Recent Progress in Transition Metal Hexacyanometallates: From Structure to Properties and Functionality, Coord. Chem. Rev., 2022, 453, 214274, DOI:10.1016/j.ccr.2021.214274.
- L. Samain, F. Grandjean, G. J. Long, P. Martinetto, P. Bordet and D. Strivay, Relationship between the Synthesis of Prussian Blue Pigments, Their Color, Physical Properties, and Their Behavior in Paint Layers, J. Phys. Chem. C, 2013, 117(19), 9693–9712, DOI:10.1021/jp3111327.
- P. R. Bueno, F. F. Ferreira, D. Giménez-Romero, G. Oliveira Setti, R. C. Faria, C. Gabrielli, H. Perrot, J. J. Garcia-Jareño and F. Vicente, Synchrotron Structural Characterization of Electrochemically Synthesized Hexacyanoferrates Containing K+: A Revisited Analysis of Electrochemical Redox, J. Phys. Chem. C, 2008, 112(34), 13264–13271, DOI:10.1021/jp802070f.
- A. Simonov, T. De Baerdemaeker, H. L. B. Boström, M. L. Ríos Gómez, H. J. Gray, D. Chernyshov, A. Bosak, H.-B. Bürgi and A. L. Goodwin, Hidden Diversity of Vacancy Networks in Prussian Blue Analogues, Nature, 2020, 578(7794), 256–260, DOI:10.1038/s41586-020-1980-y.
- D. Wardecki, D. O. Ojwang, J. Grins and G. Svensson, Neutron Diffraction and EXAFS Studies of K2x/3Cu[Fe(CN)6]2/3·nH2O, Cryst. Growth Des, 2017, 17(3), 1285–1292, DOI:10.1021/acs.cgd.6b01684.
- F. Herren, P. Fischer, A. Ludi and W. Haelg, Neutron Diffraction Study of Prussian Blue, Fe4[Fe(CN)6]3·XH2O. Location of Water Molecules and Long-Range Magnetic Order, Inorg. Chem., 1980, 19(4), 956–959, DOI:10.1021/ic50206a032.
- N. Ruankaew, N. Yoshida, Y. Watanabe, A. Nakayama, H. Nakano and S. Phongphanphanee, Distinct Ionic Adsorption Sites in Defective Prussian Blue: A 3D-RISM Study, Phys. Chem. Chem. Phys., 2019, 21(40), 22569–22576, 10.1039/C9CP04355A.
- C. Ling, J. Chen and F. Mizuno, First-Principles Study of Alkali and Alkaline Earth Ion Intercalation in Iron Hexacyanoferrate: The Important Role of Ionic Radius, J. Phys. Chem. C, 2013, 117(41), 21158–21165, DOI:10.1021/jp4078689.
- J. Nordstrand, E. Toledo-Carrillo, S. Vafakhah, L. Guo, H. Y. Yang, L. Kloo and J. Dutta, Ladder Mechanisms of Ion Transport in Prussian Blue Analogues, ACS Appl. Mater. Interfaces, 2022, 14(1), 1102–1113, DOI:10.1021/acsami.1c20910.
- D. Giménez-Romero, P. R. Bueno, J. J. García-Jareño, C. Gabrielli, H. Perrot and F. Vicente, Mechanism for Interplay between Electron and Ionic Fluxes in KhFek[Fe(CN)6]l·mH2O Compounds, J. Phys. Chem. B, 2006, 110(6), 2715–2722, DOI:10.1021/jp0561773.
- P. R. Bueno, D. Giménez-Romero, C. Gabrielli, J. J. García-Jareño, H. Perrot and F. Vicente, Changeover during In Situ Compositional Modulation of Hexacyanoferrate (Prussian Blue) Material, J. Am. Chem. Soc., 2006, 128(51), 17146–17152, DOI:10.1021/ja066982a.
- A. I. Komayko, S. V. Ryazantsev, I. A. Trussov, N. A. Arkharova, D. E. Presnov, E. E. Levin and V. A. Nikitina, The Misconception of Mg2+ Insertion into Prussian Blue Analogue Structures from Aqueous Solution, ChemSusChem, 2021, 14(6), 1574–1585, DOI:10.1002/cssc.202002916.
- Y. You, X.-L. Wu, Y.-X. Yin and Y.-G. Guo, High-Quality Prussian Blue Crystals as Superior Cathode Materials for Room-Temperature Sodium-Ion Batteries, Energy Environ. Sci., 2014, 7(5), 1643–1647, 10.1039/C3EE44004D.
- Y. Liu, Y. Qiao, W. Zhang, Z. Li, X. Ji, L. Miao, L. Yuan, X. Hu and Y. Huang, Sodium Storage in Na-Rich NaxFeFe(CN)6 Nanocubes, Nano Energy, 2015, 12, 386–393, DOI:10.1016/j.nanoen.2015.01.012.
- C. Li, X. Wang, W. Deng, C. Liu, J. Chen, R. Li and M. Xue, Size Engineering and Crystallinity Control Enable High-Capacity Aqueous Potassium-Ion Storage of Prussian White Analogues, ChemElectroChem, 2018, 5(24), 3887–3892, DOI:10.1002/celc.201801277.
- X. Wu, M. Shao, C. Wu, J. Qian, Y. Cao, X. Ai and H. Yang, Low Defect FeFe(CN)6 Framework as Stable Host Material for High Performance Li-Ion Batteries, ACS Appl. Mater. Interfaces, 2016, 8(36), 23706–23712, DOI:10.1021/acsami.6b06880.
- A. Kitajou, J. Yamaguchi, S. Hara and S. Okada, Discharge/Charge Reaction Mechanism of a Pyrite-Type FeS2 Cathode for Sodium Secondary Batteries, J. Power Sources, 2014, 247, 391–395, DOI:10.1016/j.jpowsour.2013.08.123.
- M. Cuisinier, P.-E. Cabelguen, S. Evers, G. He, M. Kolbeck, A. Garsuch, T. Bolin, M. Balasubramanian and L. F. Nazar, Sulfur Speciation in Li–S Batteries Determined by Operando X-Ray Absorption Spectroscopy, J. Phys. Chem. Lett., 2013, 4(19), 3227–3232, DOI:10.1021/jz401763d.
- Y. Gorlin, M. U. M. Patel, A. Freiberg, Q. He, M. Piana, M. Tromp and H. A. Gasteiger, Understanding the Charging Mechanism of Lithium-Sulfur Batteries Using Spatially Resolved Operando X-Ray Absorption Spectroscopy, J. Electrochem. Soc., 2016, 163(6), A930, DOI:10.1149/2.0631606jes.
- A. Kulka, C. Marino, K. Walczak, C. Borca, C. Bolli, P. Novák and C. Villevieille, Influence of Na/Mn Arrangements and P2/P′2 Phase Ratio on the Electrochemical Performance of NaxMnO2 Cathodes for Sodium-Ion Batteries, J. Mater. Chem. A, 2020, 8(12), 6022–6033, 10.1039/C9TA12176E.
- Y. Li, P. Zuo, R. Li, H. Huo, Y. Ma, C. Du, Y. Gao, G. Yin and R. S. Weatherup, Formation of an Artificial Mg2+-Permeable Interphase on Mg Anodes Compatible with Ether and Carbonate Electrolytes, ACS Appl. Mater. Interfaces, 2021, 13(21), 24565–24574, DOI:10.1021/acsami.0c22520.
- F. Grandjean, L. Samain and G. J. Long, Characterization and Utilization of Prussian Blue and Its Pigments, Dalt. Trans., 2016, 45(45), 18018–18044, 10.1039/C6DT03351B.
- T. L. Greaves and J. D. Cashion, Site Analysis and Calculation of the Quadrupole Splitting of Prussian Blue Mössbauer Spectra, Hyperfine Interact, 2016, 237(1), 70, DOI:10.1007/s10751-016-1216-6.
- E. Reguera, J. Fernández-Bertrán, A. Dago and C. Díaz, Mössbauer Spectroscopic Study of Prussian Blue from Different Provenances, Hyperfine Interact, 1992, 73(3), 295–308, DOI:10.1007/BF02418604.
- B. Tao, I. J. McPherson, E. Daviddi, C. L. Bentley and P. R. Unwin, Multiscale Electrochemistry of Lithium Manganese Oxide (LiMn2O4): From Single Particles to Ensembles and Degrees of Electrolyte Wetting, ACS Sustain. Chem. Eng., 2023, 11(4), 1459–1471, DOI:10.1021/acssuschemeng.2c06075.
- K. Tennakone and W. G. D. Dharmaratne, Experimental and Theoretical Study of Electronic Conduction in H2O-Doped Prussian Blue, J. Phys. C Solid State Phys., 1983, 16(29), 5633, DOI:10.1088/0022-3719/16/29/017.
- E. Murad and U. Schwertmann, The Möessbauer Spectrum of Ferrihydrite and Its Relations to Those of Other Iron Oxides, Am. Mineral., 1980, 65(9–10), 1044–1049 Search PubMed.
- F. S. Hegner, J. R. Galán-Mascarós and N. López, A Database of the Structural and Electronic Properties of Prussian Blue, Prussian White, and Berlin Green Compounds through Density Functional Theory, Inorg. Chem., 2016, 55(24), 12851–12862, DOI:10.1021/acs.inorgchem.6b02200.
- G. Zampardi, S. V. Sokolov, C. Batchelor-McAuley and R. G. Compton, Potassium (De-)Insertion Processes in Prussian Blue Particles: Ensemble versus Single Nanoparticle Behaviour, Chem.–Eur. J., 2017, 23(57), 14338–14344, DOI:10.1002/chem.201703175.
- B. Ravel and M. Newville, ATHENA, ARTEMIS, HEPHAESTUS: Data Analysis for X-Ray Absorption Spectroscopy Using IFEFFIT, J. Synchrotron Radiat., 2005, 12(4), 537–541, DOI:10.1107/S0909049505012719.
- V. Blum, R. Gehrke, F. Hanke, P. Havu, V. Havu, X. Ren, K. Reuter and M. Scheffler, Ab Initio Molecular Simulations with Numeric Atom-Centered Orbitals, Comput. Phys. Commun., 2009, 180(11), 2175–2196, DOI:10.1016/j.cpc.2009.06.022.
- J. P. Perdew, A. Ruzsinszky, G. I. Csonka, O. A. Vydrov, G. E. Scuseria, L. A. Constantin, X. Zhou and K. Burke, Restoring the Density-Gradient Expansion for Exchange in Solids and Surfaces, Phys. Rev. Lett., 2008, 100(13), 136406, DOI:10.1103/PhysRevLett.100.136406.
- J. Heyd, G. E. Scuseria and M. Ernzerhof, Erratum: “Hybrid Functionals Based on a Screened Coulomb Potential” [J. Chem. Phys. 118, 8207 (2003)], J. Chem. Phys., 2006, 124(21), 219906, DOI:10.1063/1.2204597.
- A. Tkatchenko and M. Scheffler, Accurate Molecular Van Der Waals Interactions from Ground-State Electron Density and Free-Atom Reference Data, Phys. Rev. Lett., 2009, 102(7), 73005, DOI:10.1103/PhysRevLett.102.073005.
- H. J. Monkhorst and J. D. Pack, Special Points for Brillouin-Zone Integrations, Phys. Rev. B: Solid State, 1976, 13(12), 5188–5192, DOI:10.1103/PhysRevB.13.5188.
- A. Hjorth Larsen, J. Jørgen Mortensen, J. Blomqvist, I. E. Castelli, R. Christensen, M. Dułak, J. Friis, M. N. Groves, B. Hammer, C. Hargus, E. D. Hermes, P. C. Jennings, P. Bjerre Jensen, J. Kermode, J. R. Kitchin, E. Leonhard Kolsbjerg, J. Kubal, K. Kaasbjerg, S. Lysgaard, J. Bergmann Maronsson, T. Maxson, T. Olsen, L. Pastewka, A. Peterson, C. Rostgaard, J. Schiøtz, O. Schütt, M. Strange, K. S. Thygesen, T. Vegge, L. Vilhelmsen, M. Walter, Z. Zeng and K. W. Jacobsen, The Atomic Simulation Environment—a Python Library for Working with Atoms, J. Phys. Condens. Matter, 2017, 29(27), 273002, DOI:10.1088/1361-648X/aa680e.
- D. F. Shanno, Conditioning of Quasi-Newton Methods for Function Minimization, Math. Comput., 1970, 24(111), 647–656, DOI:10.2307/2004840.
- D. Goldfarb, A Family of Variable-Metric Methods Derived by Variational Means, Math. Comput., 1970, 24(109), 23–26, DOI:10.2307/2004873.
- R. A. Fletcher, New Approach to Variable Metric Algorithms, Comput. J., 1970, 13(3), 317–322, DOI:10.1093/comjnl/13.3.317.
- C. G. Broyden, The Convergence of a Class of Double-Rank Minimization Algorithms 1. General Considerations, IMA J. Appl. Math., 1970, 6(1), 76–90, DOI:10.1093/imamat/6.1.76.
- O. Bunău and Y. Joly, Self-Consistent Aspects of x-Ray Absorption Calculations, J. Phys. Condens. Matter, 2009, 21(34), 345501, DOI:10.1088/0953-8984/21/34/345501.
- Y. X.-Ray Joly, Absorption near-Edge Structure Calculations beyond the Muffin-Tin Approximation, Phys. Rev. B: Condens. Matter Mater. Phys., 2001, 63(12), 125120, DOI:10.1103/PhysRevB.63.125120.
Footnote |
| † Electronic supplementary information (ESI) available: XRD, FT-IR, elemental analysis, electron microscopy, XANES, EXAFS, 57Fe Mössbauer, and DFT simulations. All computational structures associated with the presented work are available from the NOMAD repository (https://doi.prg/10.17172/NOMAD/2023.07.25-1). All XANES, XRD & IR data and meta-data presented is available from the Loughborough University repository (https://doi.org/10.17028/rd.lboro.23587176). See DOI: https://doi.org/10.1039/d3ta02631k |
| This journal is © The Royal Society of Chemistry 2023 |