
 Open Access Article
 This Open Access Article is licensed under a
 Creative Commons Attribution 3.0 Unported Licence
A double perovskite oxygen electrode in Zr-rich proton conducting ceramic cells for efficient electricity generation and hydrogen production†
Haoyu
Zheng
 *ab,
Matthias
Riegraf
a,
Noriko
Sata
a and
Rémi
Costa
*a
*ab,
Matthias
Riegraf
a,
Noriko
Sata
a and
Rémi
Costa
*a
aInstitute of Engineering Thermodynamics, German Aerospace Center (DLR), Pfaffenwaldring 38-40, 70569 Stuttgart, Germany
bInstitute for Building Energetics, Thermotechnology and Energy Storage (IGTE), University of Stuttgart, Pfaffenwaldring 31, 70569 Stuttgart, Germany. E-mail: zhenghaoyu01@gmail.com; remi.costa@dlr.de
First published on 28th April 2023
Abstract
Proton conducting ceramic fuel cells and electrolyzers are nascent technologies. An operating temperature of about 600 °C calls for the development of specific oxygen electrodes with adequate catalytic activity and stability especially at high steam concentrations. An efficient composite oxygen electrode Ba0.5Gd0.8La0.7Co2O6−δ–BaZr0.5Ce0.4Y0.1O3−δ (BGLC587–BZCY541) with low polarization resistance and high durability in either mode is reported. Electronic leakage that occurs through the electrolyte due to intrinsic materials characteristics is a major issue that limits the faradaic efficiency (ηFE) especially in steam electrolysis. An equivalent circuit model was developed to deconvolute the effect of electronic leakage in the electrolyte and the oxygen electrode reaction process. The electronic (te) and ionic (ti) transference numbers, real polarization resistance and ηFE are shown to be strongly related to pH2O, pO2, applied current density and operating temperatures. Distribution of relaxation time analysis of electrochemical impedance spectra revealed that the rate-limiting step for steam electrolysis is a surface-related oxygen electrode process in the low-frequency range and that a triple phase boundary process at the contact point BGLC587–BZCY541 is favored over a pure double phase boundary process at the surface of BGLC587 yielding the conclusion that composite electrode structures may have to be favored to achieve high performance.
1. Introduction
In the context of CO2 emission abatement in the energy sector, hydrogen is asserting its position as a green energy carrier when produced by water electrolysis powered by low CO2 electricity. Among the different water electrolysis technologies, high temperature electrolysis (typically above 600 °C) based on ceramic cells is especially attractive by allowing high energy conversion efficiency and the highest production rate of hydrogen at rated power. While electrolyzers based on solid oxide cells (SOCs) are approaching the pre-industrial scale with systems in the range of a few MW,1 a technology based on proton conducting ceramic (PCC) cells is still nascent.PCC cells typically use Y doped BaZrO3–BaCeO3 solid solution materials (BaZr1−x−yCexYyO3−δ, BZCY) as an electrolyte, which are characterized by a lower activation energy for bulk proton transfer (0.3–0.5 eV) compared with oxygen ion conduction (0.8–0.9 eV) in solid oxide materials.2 PCC cells are ideally suited for operation between 400 °C and 600 °C, which makes them attractive to valorize waste heat from industrial processes available in the form of steam for hydrogen production.3 Moreover, beyond steam electrolysis application, a broad variety of ceramic membrane reactors can be built with PCC cells to convert electricity to high-value chemicals, such as ammonia, ethylene, acetylene and other hydrocarbons.4–7
Similar to SOCs, PCC cells are reversible which means that they can be operated either in fuel cell (PCFC) or electrolysis (PCEC) mode. In PCC cells, steam generation or consumption occurs at the oxygen electrode, while only hydrogen is present at the fuel electrode. This is supposed to enable higher conversion rates and efficiency than in SOCs, because there is no dilution of hydrogen. Generally, the polarization losses in PCC cells are dominated by the oxygen electrode, due to the sluggish kinetics of the oxygen reduction reaction (ORR) or oxygen evolution reduction (OER) at low operating temperatures. The reaction rate limiting steps are usually associated with oxygen surface exchange and diffusion.8–10 In addition to high chemical stability at high steam content, it is thus desirable that a PCC oxygen electrode possesses high oxygen ionic, electronic and protonic conductivities. The preliminary research on PCC oxygen electrodes was based on simple perovskites (ABO3−δ) which generally are mixed (oxygen) ionic and electronic conductors (MIECs), including La0.6Sr0.4Co0.2Fe0.8O3−δ,11 and Sm0.5Sr0.5CoO3−δ;12 however, their performances are inadequate, since the active sites are limited only to the triple phase boundaries (TPBs) between the oxygen electrode, proton conducting electrolyte and the gas phase. Double perovskite structure materials AA′B2O6−δ, where A is a trivalent lanthanide cation, A′ is barium or strontium and B is a transition metal cation or mixture of different elements, such as GdBaMn2O6−δ and GdBaCo2O6−δ,13,14 exhibit remarkably faster oxygen surface exchange, higher oxygen ion transfer rates and electronic conductivity compared with simple perovskite materials. In particular, LnBaCo2O6−δ (Ln being a lanthanide) based double perovskites, Ln–O and Ba–O layers are stacked alternately along the crystallographic c-axis leading oxygen vacancies to be localized preferably on the Ln–O layer,13,15 providing channels for rapid oxygen transport.16 Although the role of these defects has not been clearly identified, it is generally understood that oxygen vacancies promote surface reactions.17 Double perovskites LnBaCo2O6−δ with Ln = La, Pr, Nd, Sm and Gd have been explored in several studies. Among them, Ba1−xGd0.8La0.2+xCo2O6−δ (BGLC) was reported as a promising mixed protonic and electronic conductor in PCC cells,18,19 demonstrating high activity for the OER in photoelectrochemical devices even at room temperature.20 Strandbakke et al.21 evaluated water incorporation of BGLC by exposure to a steam atmosphere at 400 °C. Vøllestad et al.22 reported a polarization resistance of a composite oxygen electrode Ba0.5Gd0.8La0.7Co2O6−δ–BaZr0.7Ce0.2Y0.1O3−δ in a tubular PCC cell below 1 Ω cm2 at 600 °C together with a good stability over 700 h when operated at −62.5 mA cm−2 and 1.5 bar steam in electrolysis mode. However, the large ohmic resistance of around 3 Ω cm2 at 600 °C, inherent to the tubular architecture and the issue of current collection did not allow for investigation of the electrode performance and stability at higher current densities.23 This issue could be circumvented in a planar cell design. The further development of PCC cells and scale-up, especially for PCEC applications, requires tackling the challenges of performance and durability at more practical current densities, for example, around −0.5 A cm−2 and higher at nominal operating voltage.
The other particularity of PCC cells lies in the mixed-conducting properties of BZCY electrolyte materials, that under given conditions, exhibit in addition to proton conductivity, oxygen ion and p-type conductivities.24 The transference numbers for each charge carrier depend on the chemical composition of the material, the operation atmosphere, the working temperature and the applied voltage. The presence of p-type charge carriers is especially critical as it typically induces electronic current leakage through the electrolyte which adversely affects the faradaic efficiency of the process.25,26 Several reports demonstrated that the impact of this electronic leakage is limited towards the faradaic efficiency for PCFCs.27 However, it had dramatic influence on PCECs. Up to now, the state-of-the-art faradaic efficiency in PCECs was in the range of 30–70% at the thermal-neutral voltage (VTN of around 1.3 V) which is below that in SOCs that reaches values close to 100% at VTN.
Here, we report about the performance and electrochemical response of a composite Ba0.5Gd0.8La0.7Co2O6−δ–BaZr0.5Ce0.4Y0.1O3−δ (BGLC587–BZCY541) oxygen electrode in a planar PCC cell operated as a PCFC and PCEC. The behavior of the composite oxygen electrode has been explored in full PCC cells by varying operating conditions such as temperature, gas atmosphere, and direct current (DC) bias. Furthermore, the characteristics of the different charge carrier transference numbers on the cell behavior as well as faradaic efficiency were evaluated in order to identify the most favorable operating conditions, particularly for electrolysis.
2. Results and discussion
2.1. Materials and morphology of the single cell
The crystalline structure of the as-prepared BGLC587 and the commercial BZCY541 powders were analyzed using XRD (Fig. 1a). The pattern of BGLC587 was consistent with the one reported in previous studies.22 The chemical compatibility between BGLC587 and BZCY541 was investigated by annealing the mixed powder in air at 1000 °C for 2 h. No secondary phase was observed in the XRD pattern of the BGLC587–BZCY541 mixture confirming adequate compatibility between the two components. Besides, the physical compatibility between the oxygen electrode and electrolyte is also a critical factor for the mechanical strength of full cells. Fig. S1† shows the thermal expansion feature of BGLC587. The average thermal expansion coefficient (TEC) value of BGLC587 at 300–700 °C is 20 × 10−6 K−1 and is indeed a common feature for cobalt-based perovskite structure materials. This is associated with the change in the spin state of Co3+ cations: the transition from a low-spin state to a high-spin state increasing the volume of CoO6 octahedrons and thus causing lattice expansion.28 By contrast, doped BaCeO3–BaZrO3 electrolytes typically have a significantly lower TEC of ∼10–12 × 10−6 K−1.29 Such TEC mismatch can be the origin of a significant residual stress concentrated at the interface of the electrolyte/oxygen electrode and can ultimately yield to delamination and failure of the cell upon thermal cycles (i.e., cell fabrication and operation). The use of a composite BGLC587–BZCY541 oxygen electrode allows mitigation of this issue. Fig. 1b and c depict the morphology of the BGLC587–BZCY541 composite oxygen electrode with a uniformly distributed porous structure. | ||
| Fig. 1 (a) XRD patterns of commercial BZCY541, as-synthesized BGLC587 and BGLC587–BZCY541 mixture powder after calcining at 1000 °C for 2 h. (b) and (c) The morphology of a BGLC587–BZCY541 composite oxygen electrode at different magnifications. (d) XRD patterns of the BZCY541 electrolyte layer and a NiO–BZCY541 fuel electrode from the as-fabricated PCC cells. (e) Surface microstructure of the BZCY541 electrolyte layer after sintering at 1450 °C for 5 h. (f) Cross-section image of the as-fabricated PCC cells with different functional layers of NiO–BZCY541/BZCY541/BGLC587–BZCY541 (fuel electrode/electrolyte/oxygen electrode). | ||
Fig. 1d exhibits the XRD patterns of the NiO–BZCY541 fuel electrode and the BZCY541 electrolyte in the as-fabricated full cells without any secondary phases. An overview of the fabricated cell with a three-layer assembly is shown in Fig. 1f. The fuel electrode has a thickness of ∼800 μm, shows good adhesion to the electrolyte and has a fine network distribution of NiO and BZCY541. The BZCY541 electrolyte layer (thickness of ∼12 μm) exhibits a homogeneous and pin-hole free surface with a grain size of ∼2 μm (Fig. 1e). The composite BGLC587–BZCY541 oxygen electrode was about 35 μm thick with a good quality interface to the electrolyte layer without any evidence of cracks or delamination.
2.2. PCFC: fuel cell operation
The electrochemical performances of PCC cells with the BGLC587–BZCY541 oxygen electrode were evaluated in fuel cell mode, first. The polarization characteristics are shown in Fig. 2a. Peak power densities (PPDs) reach 755, 570, 403, 259 and 152 mW cm−2 at 700, 650, 600, 550, and 500 °C, respectively, which are competitive values with the best performances reported so far for PCFCs with Zr-rich BZCY electrolyte. For comparison, Table S1† shows an overview of PPD values of different fuel electrode supported PCFCs with BZCY electrolyte in the literature. In most PCFCs with BaZr0.9−xCexY0.1O3−δ ([Zr] > 40 at%) electrolyte and cobalt-containing oxide oxygen electrodes, the PPD is in the range between 100 and 300 mW cm−2 at 600 °C. Furthermore, good stability of the full cell with the BGLC587–BZCY541 oxygen electrode in fuel cell mode was demonstrated over 80 h at 0.2 A cm−2 and 650 °C (Fig. S2†). | ||
| Fig. 2 Electrochemical performance of the PCC cells with the BGLC587–BZCY541 oxygen electrode in fuel cell mode with wet (∼3% H2O) hydrogen on the fuel electrode side and wet (∼3% H2O) air on the oxygen electrode side. (a) I–V–P curves of the PCC cells measured at 500, 550, 600, 650 and 700 °C, respectively. (b) Measured open circuit voltages (VOC) and calculated theoretical Nernst voltages (VN) as a function of temperature. (c) Nyquist and (d) imaginary impedance plots at OCV and different temperatures. (e) Temperature dependence of Rp/Rp,r ratios and ionic transference number (ti) at OCV, and (f) temperature dependence of different resistances (Rt, RΩ, Rp, Re, Ri and Rp,r). | ||
The open circuit voltage (OCV; named VOC) measured at 500 °C is 1.13 V which is close to the calculated theoretical Nernst voltage of 1.15 V (Fig. 2b). Such a small deviation suggests that a dense electrolyte with good gas-tightness and sealing was obtained. Nevertheless, the deviation between the measured and the theoretical voltage increased with temperature. For example, the OCV value is 1.09 V at 600 °C with the theoretical value being 1.13 V. Most likely, this increase in deviation is a manifestation of electronic leakage in the BZCY541 electrolyte, which is a typical property of proton conducting ceramics.
In proton conducting ceramics, the formation of mobile protonic charge carrier  is introduced by a hydration process and can be described by the Stotz–Wagner mechanism30
 | (1) |
Based on eqn (1), the hydration equilibrium constant KH and proton concentration can be defined as
 | (2) |
 | (3) |
 | (4) |
 | (5) |
 | (6) |
To further reveal the impact of p-type conduction, electrochemical impedance spectra (EIS) were recorded at OCV and different temperatures (Fig. 2c and d) and analyzed using an equivalent circuit model as shown in Fig. 3a. Due to the mixed ionic and electronic conduction (MIEC) properties of the BZCY electrolyte, the measured apparent ohmic resistance (RΩ) contains contributions from both the ionic resistance (Ri) and the electronic resistance (Re). Their relationship can be written as
 | (7) |
 | ||
| Fig. 3 (a) A simple equivalent circuit consisting of one RQ element to describe the polarization resistance of PCC cells with mixed conducting electrolytes; (b) a more complex equivalent circuit consisting of n (RQ)i (i = 1…n) elements in series for the polarization resistance. Schematic illustration of the PCC cells operated in fuel cell mode (c) and steam electrolysis mode (d). | ||
Analogous to the apparent ohmic resistance, the apparent polarization resistance Rp also needs to be corrected since the real polarization resistance Rp,r is parallel to the electronic resistance of the electrolyte (see Fig. 3a). The total resistance (Rt) can be expressed as a function of Re, Ri and Rp,r:
 | (8) |
 | (9) |
Fig. 2e shows that the ionic transference numbers decreased from 0.995 at 500 °C to 0.917 at 700 °C most likely due to the increased electronic conduction in the electrolyte at higher temperatures. This is consistent with the observed increased deviation between measured and theoretical voltages as shown in Fig. 2b. The increases in electronic leakage with temperature also led to a change in Rp/Rp,r which reduced from 0.98 at 500 °C to 0.82 at 700 °C, indicating an increased difference between apparent and real polarization resistances. Therefore, the necessity to correct the measured apparent resistance values is clearly demonstrated. Fig. 2f shows the Arrhenius plot of different resistances and the corresponding activation energies (Ea) are indicated as well. The activation energy barrier for the ionic resistance Ri of 0.36 eV is slightly lower than the 0.39 eV for RΩ and agrees well with the migration energy associated with the activation energy of proton conduction (0.3–0.5 eV).2 Similarly, the activation energy of Rp,r of 1.20 eV was slightly lower than the 1.25 eV for Rp; despite the corresponding resistance values of Rp,r being larger than those of Rp. The activation energy of Rp,r of the full cells matches well with the values of BGLC electrode symmetrical cells (0.8–1.25 eV).18 For fuel electrode supported cells, it is reported that the polarization resistance is dominated by the oxygen electrode.35 The total losses of the cells are dominated by the ohmic contribution above 550 °C (Fig. 2f). In this study, BZCY541 was employed as the electrolyte. But it possesses relatively lower ionic conductivity in comparison to BZCY compositions with a larger Ce content on the B site (e.g., BZCY271) or with a higher level of doping on the B site with Y or Yb (e.g., BZCYYb).36,37 This could be the reason for the comparatively high ohmic losses. Table S3† summarizes the PCFC with the best performance reported so far (Note S2†). Nevertheless, the polarization resistance, which is dominated by the contribution of the oxygen electrode (e.g., Rp,r is only 0.209 Ω cm2 at 600 °C) is competitive for practical use.35
2.3. PCEC: steam electrolysis operation
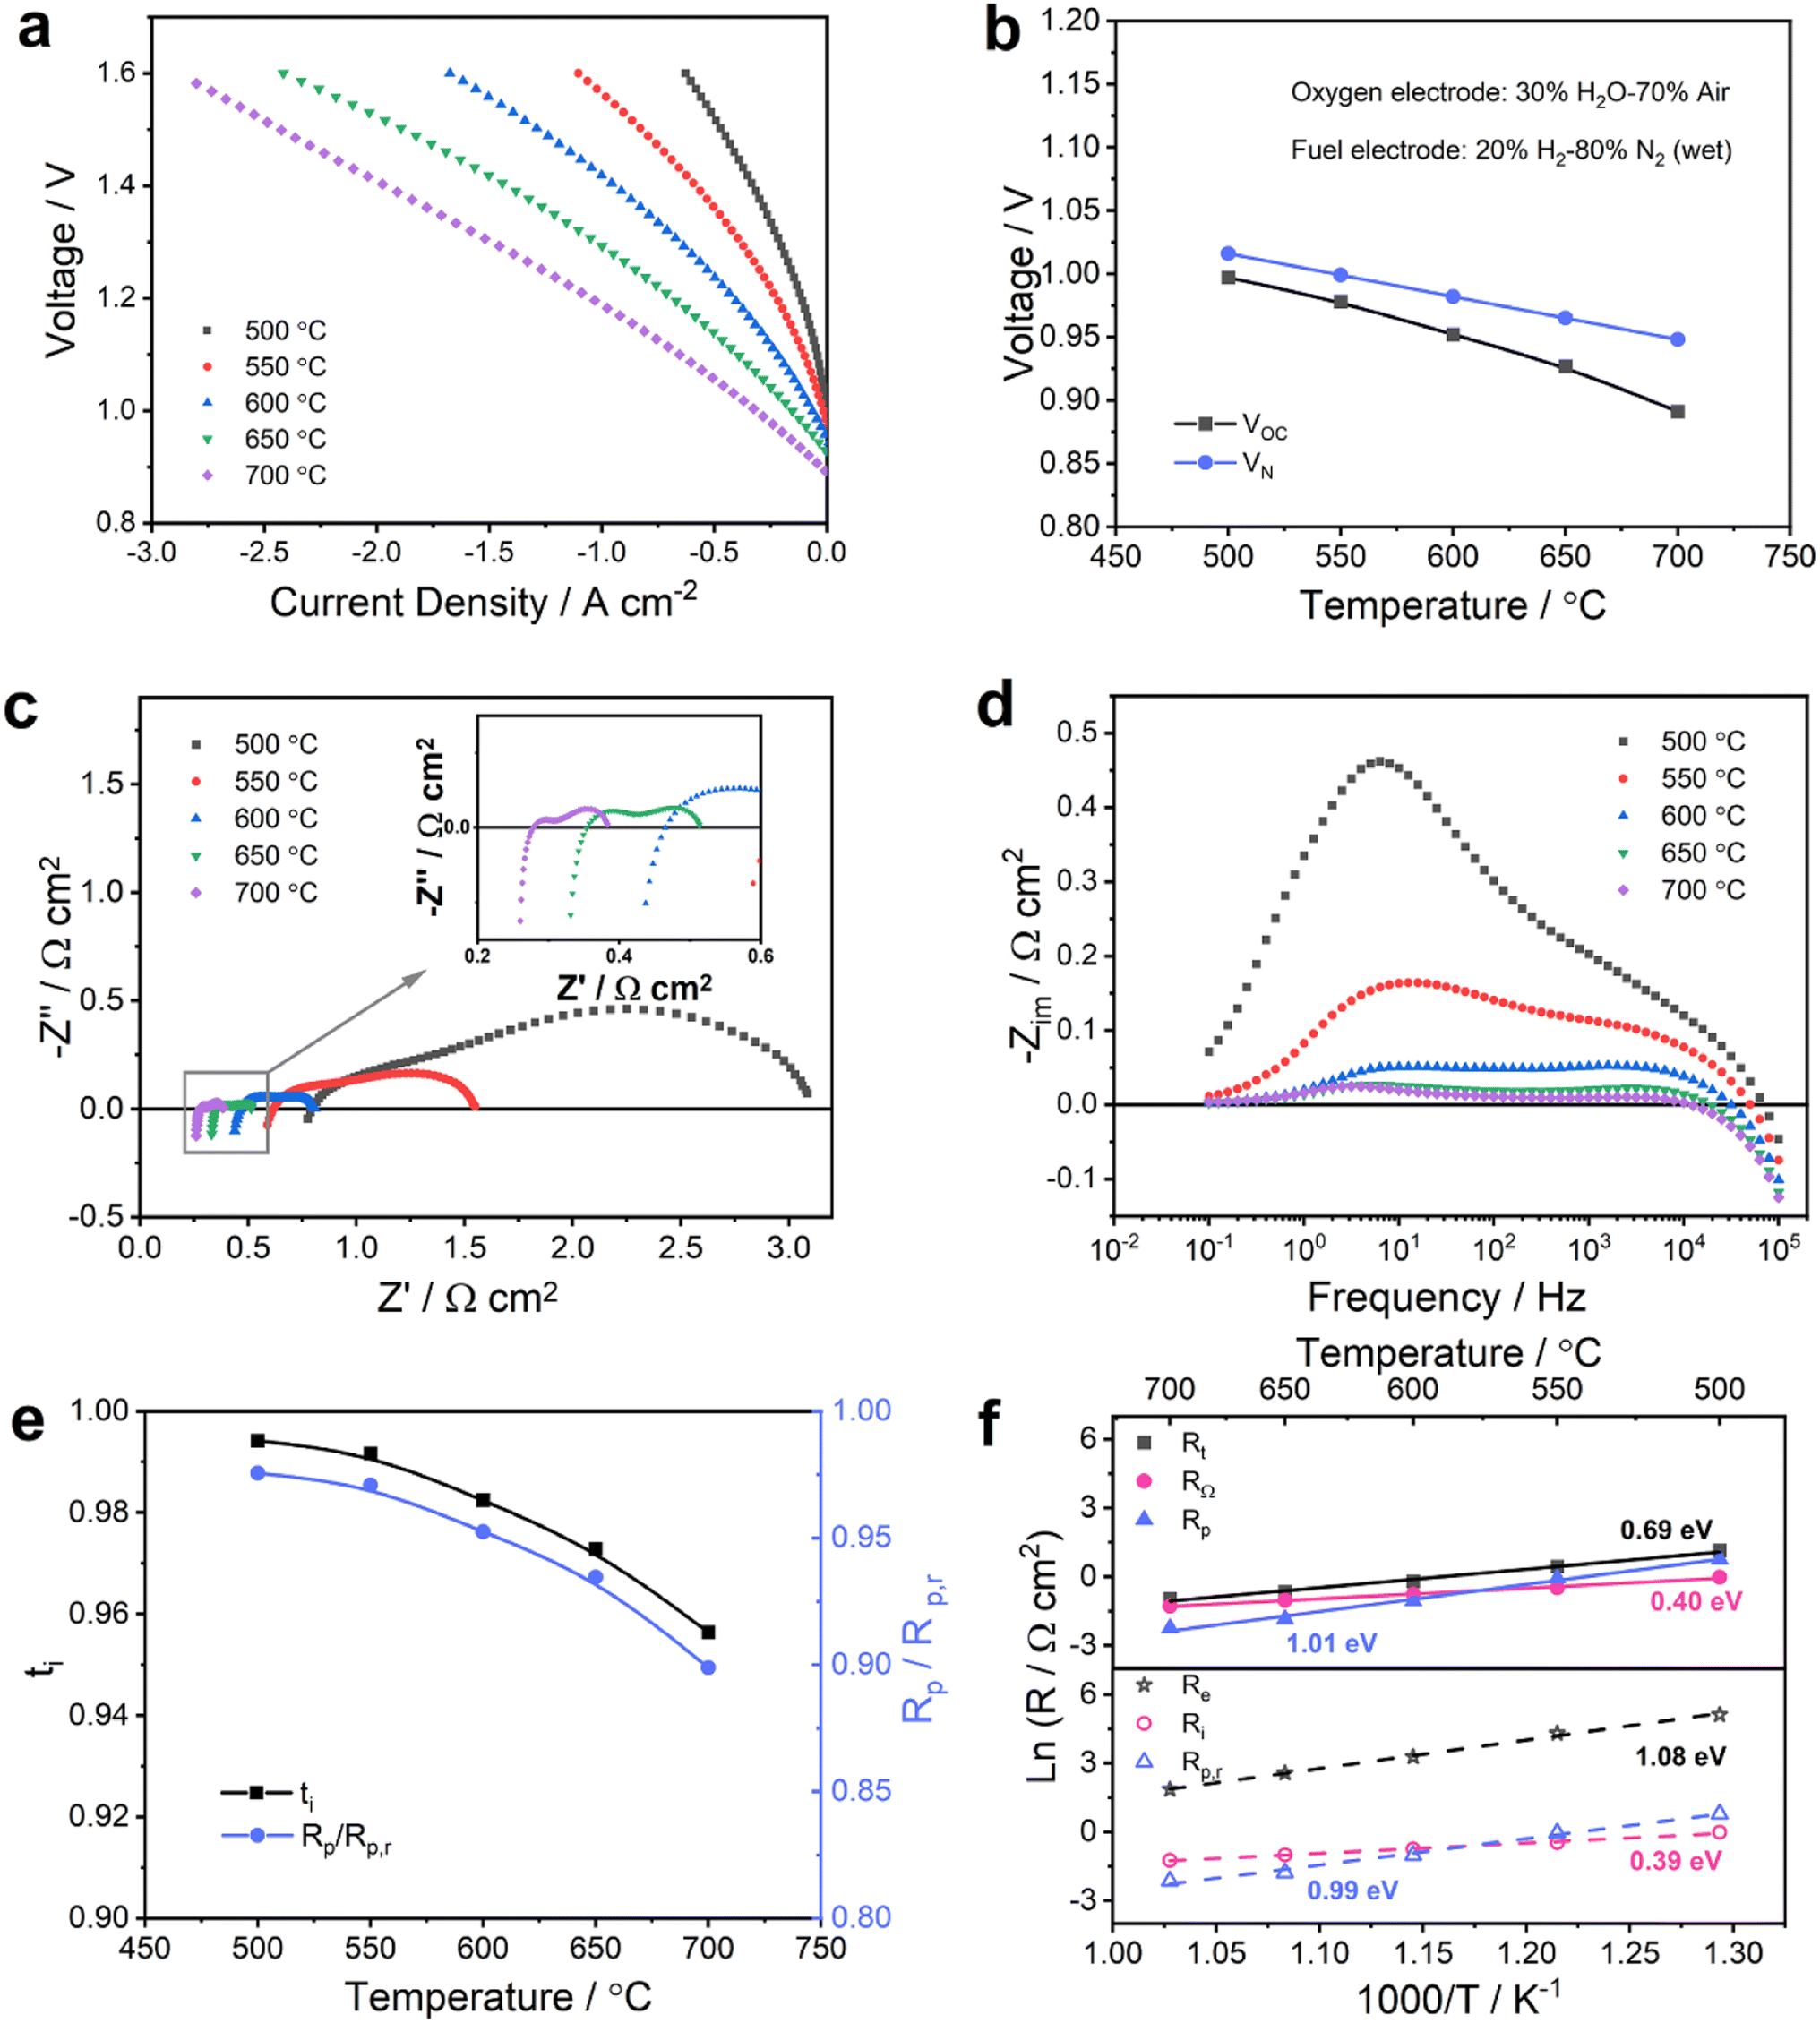 | ||
| Fig. 4 Electrochemical performance of PCC cells with the BGLC587–BZCY541 oxygen electrode in steam electrolysis mode. (a) I–V curves of the PCC cells measured at different temperatures with 20% H2-80% N2 (wet) on the fuel electrode side and 30% H2O-70% air on the oxygen electrode side. (b) Measured open circuit voltages (VOC) and calculated theoretical Nernst voltages (VN) as a function of temperature. (c) Nyquist and (d) imaginary impedance spectra at OCV and 500–700 °C. (e) Temperature dependence of Rp/Rp,r ratios and ionic transference number ti at OCV, and (f) temperature dependence of different resistances (Rt, RΩ, Rp, Re, Ri and Rp,r). | ||
The OCV values are 0.997, 0.978, 0.952, 0.927 and 0.891 V at 500, 550, 600, 650 and 700 °C, respectively. Similar to fuel cell operation, the experimentally detected OCV values were slightly lower than the theoretical values (Fig. 4b). Nevertheless, the deviation between measured and theoretical voltages is mitigated compared with the difference shown in Fig. 2b, especially at high temperatures. This indicates a strong influence of the gas phase composition in the fuel electrode and oxygen electrode compartments on the electronic conductivity in the electrolyte. By combining eqn (3) and (6), the electron hole concentration can be determined in terms of steam partial pressure (pH2O) and oxygen partial pressure (pO2),
 | (10) |
The electrochemical impedance spectra recorded at OCV and various temperatures are shown in Fig. 4c and d and exhibit a typical thermally activated behavior. The spectra were modeled following the same approach as described in the previous section in order to calculate the real values of Ri, Re and Rp,r. The results are shown in Fig. 4e and f (details are summarized in Table S5†). The ionic transference numbers range from 0.994 at 500 °C to 0.956 at 700 °C and are systematically higher than the ones determined from the gas compositions representative for fuel cell operation as shown in Fig. 2e. Consequently, the ratios of Rp/Rp,r are also considerably higher, which means a decreased influence of electronic conduction on polarization resistance. Indeed, the electron hole concentration (eqn (10)) decreases while pH2O increases and pO2 decreases. Assuming comparable mobilities under both conditions, this behavior is also reflected in an increased electronic resistance of 14.6 Ω cm2 under fuel cell conditions (Fig. 2f) compared to 26.5 Ω cm2 under electrolysis conditions (Fig. 4f) at 600 °C. Due to the decreased electronic leakage under electrolysis conditions at OCV, the activation energies of Ri and Rp,r are closer to the apparent values from RΩ and Rp, respectively, in Fig. 4f. Furthermore, the activation energy for Rp,r of 0.99 eV is lower than the corresponding value of 1.20 eV acquired as shown in Fig. 2f, suggesting that the electrocatalytic activity of the BGLC587–BZCY541 oxygen electrode is promoted at higher pH2O.
 | ||
| Fig. 5 Electrochemical performance of PCC cells with the BGLC587–BZCY541 oxygen electrode in steam electrolysis mode at 600 °C. (a) I–V curves of the cell measured with various H2O concentrations (5–70%) mixed with air at the oxygen electrode, and the corresponding (b) Nyquist impedance spectra at OCV. (c) Steam partial pressure dependence of different resistances and ionic transference numbers. (d) Faradaic efficiency and H2 production rates at different applied current densities with 30% and 70% H2O mixed with air at the oxygen electrode. | ||
Furthermore, impedance spectra were recorded at various applied voltages to investigate the cell's behavior under electrical bias. Both the high frequency and low frequency arcs in the Nyquist impedance plot reduced with increasing voltages as shown in Fig. S5.† The values of ti, Re, Ri and Rp,r were calculated and presented in Table S7.†38,39 Notably, ti dropped dramatically from 0.982 at OCV (0.955 V) to 0.889 at OCV + 0.2 V (1.155 V), indicating increased electronic conduction in the electrolyte at high overpotentials. Vøllestad et al. have determined the electron hole concentration as a function of potential E,22
 | (11) |
 | (12) |
| pH2O/(pO2 = 0.20 atm) | pO2/(pH2O = 0.3 atm) | ||||
|---|---|---|---|---|---|
| 0.30 atm | 0.70 atm | 0.20 atm | 0.40 atm | 0.70 atm | |
| Voltage/V | 1.25 | 1.23 | 1.25 | 1.25 | 1.24 |
| FE/% | 59 | 66 | 59 | 50 | 40 |
In conclusion, the gas atmosphere and applied DC bias both showed a remarkable impact on the faradaic efficiency. For practical application, that is at high steam conversion rates, the produced O2 on the oxygen electrode side will increase the local pO2 significantly resulting in an increased current leakage. Nonetheless, the applied DC bias is likely to have a greater impact on the faradaic efficiency for steam electrolysis compared with the pO2 evolution. Optimization of the operating window may not be the sole and best solution to address such inherent p-type current leakage. Recently, different approaches were suggested by optimizing the cell design to suppress the current leakage, for instance, via the employment of an additional layer able to block the diffusion of p-type charge carriers or the development of novel electrolyte materials for PCECs.42 However, the investigation and the evaluation of such approaches go beyond the scope of the present study.
 | ||
| Fig. 6 (a) Nyquist and (c) imaginary impedance spectra as a function of H2O partial pressure on the oxygen electrode side at 600 °C and OCV, and (b) Nyquist and (d) imaginary impedance spectra as a function of O2 partial pressure on the oxygen electrode side at 600 °C and OCV. | ||
Turning to pO2 variation, both RΩ and Rp decreased with increasing pO2 as depicted in Fig. 6b and d. In this case, the decreased RΩ can be attributed to the increased hole conduction through the electrolyte in more oxidizing atmospheres (eqn (4)). This is reflected by an increase in te, increasing from 0.011 with 10% oxygen to 0.016 with 70% oxygen on the oxygen electrode side. In addition, it is speculated that cobalt in the BGLC phase is present in a high oxidation state at high pO2 and primarily contributes to the electronic defect concentration,22 which may affect the reaction process on the oxygen electrode side. Generally, the oxygen exchange rate on the oxygen electrode side increases in more oxidizing atmospheres. One should notice that the p-type conduction in the oxygen electrode may increase, and this could be one of the reasons for the Rp decrease with increasing pO2 as well.
In the imaginary impedance plot (Fig. 6c and d), the change in Rp upon variation of pH2O occurred in the frequency range of 103–104 Hz and to a smaller extent between 100–101 Hz. Differently, the change in Rp caused by varying pO2 occurred across the whole frequency range of 100–104 Hz. The Nyquist and imaginary impedance plots exhibit distinctly different behaviors of the polarization resistance changing with the variation in pH2O or pO2. As a result, the observed change in polarization resistance is a cumulation of discrete polarization components corresponding to pH2O and/or pO2 variation. Distinguishing the different processes becomes challenging when their respective characteristic time constants are close to each other.
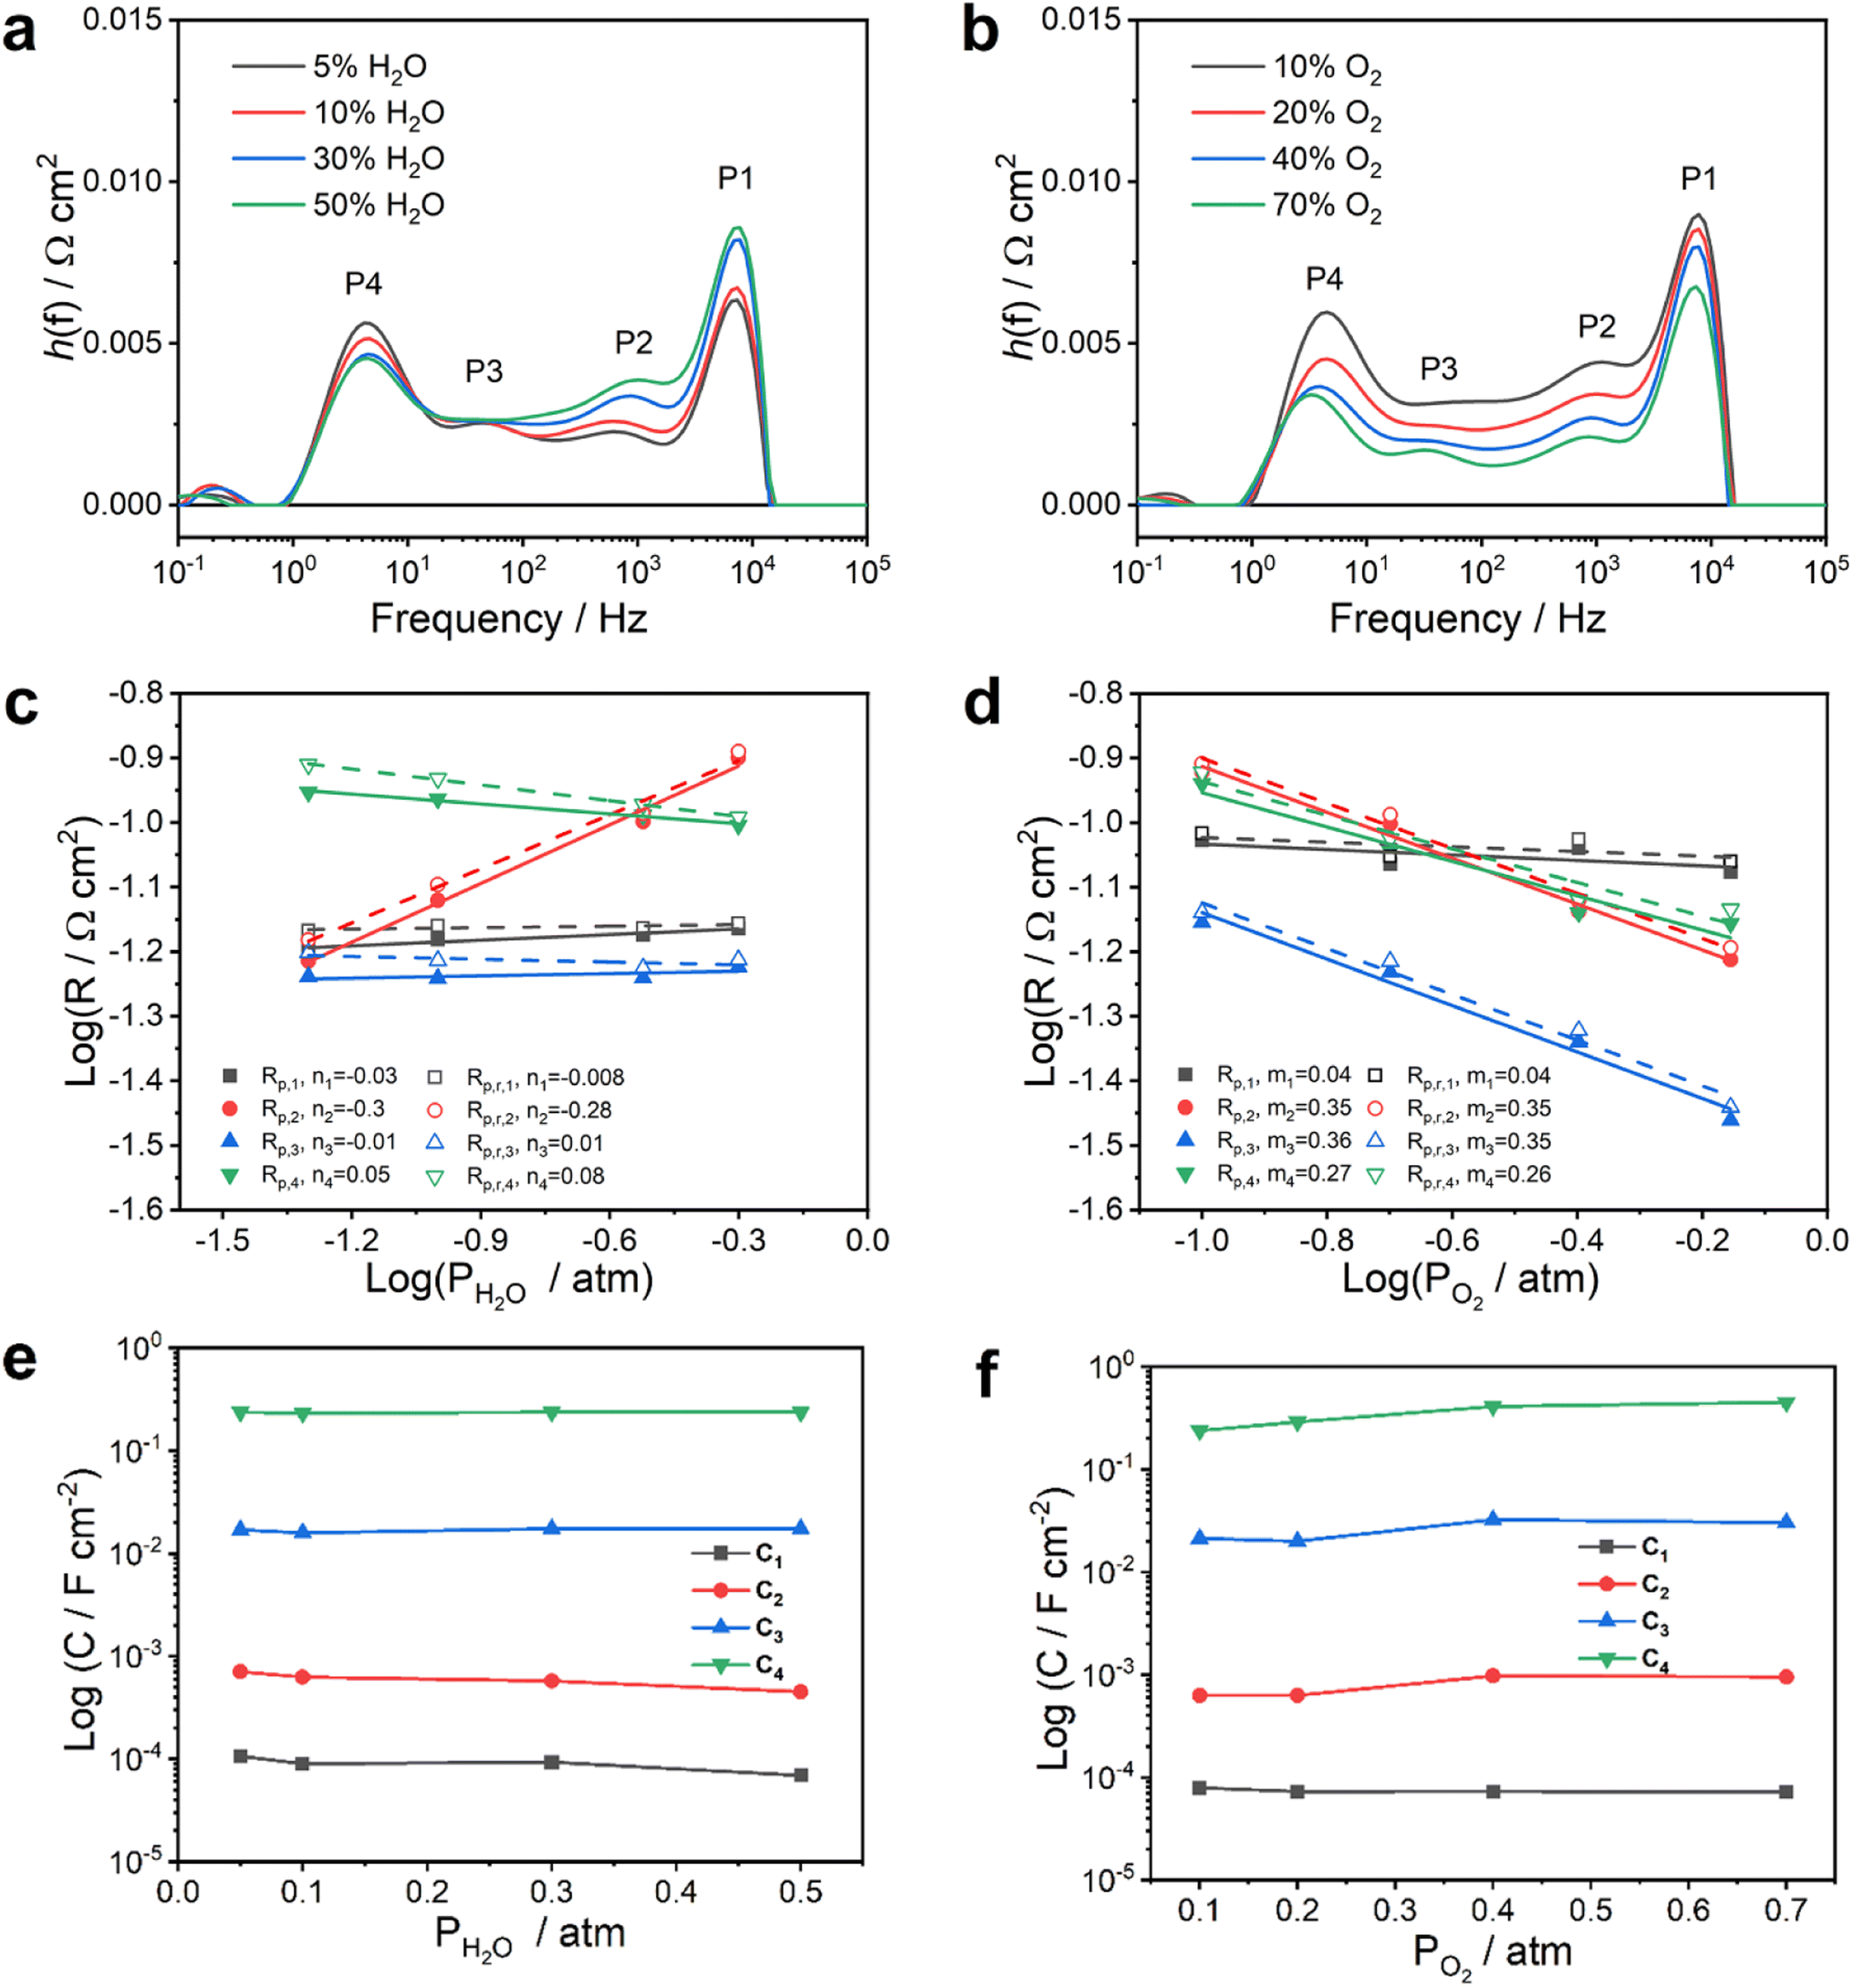
To deconvolute the total polarization resistance more precisely into individual processes, the distribution of relaxation time (DRT) analysis of the spectra was performed with the impedance responses to pH2O or pO2 variations, as shown in Fig. 7a and b. The DRT results identify that for both gas variations, the polarization response can be discretized into four main contributions or processes, namely P1, P2, P3 and P4, which appear at frequencies of approximately 104, 103, 101–102 and 100–101 Hz, respectively. Therefore, an equivalent circuit model was proposed with the elements L–R0–(R1Q1)–(R2Q2)–(R3Q3)–(R4Q4) (Fig. S7†), where L represents an inductance, R0 represents the ohmic resistance and the four RQ-elements represent the four peaks in the DRT plots. In this notation, Q represents a constant phase element (CPE). All fitting parameters are listed in Table S10.† Since this equivalent circuit model thread is parallel to an electronic resistance as well (see Fig. 3), a correction of R1–R4 was carried out after fitting to obtain the real resistance values according to the procedure described above (details are shown in Table S11†). Accordingly, the activation energy for R1, R2, R3 and R4 derived from Fig. 4c was calculated and presented in Fig. S8,† and the values are 0.59, 1.28, 1.07 and 0.81 eV, respectively.
 | ||
| Fig. 7 Distribution of relaxation time (DRT) results as functions of pH2O (a) and pO2 (b) at 600 °C. Dependence of P1, P2, P3 and P4 polarization resistances on (c) pH2O and (d) pO2, and dependence of the corresponding capacitances on (e) pH2O and (f) pO2, respectively. The fuel electrode side was fed with wet (∼3% H2O) 20% H2–80% N2. | ||
Based on these results, the resistance of all oxygen electrode-related loss processes can be empirically described according to
| Ri ∝ (pO2)−mi(pH2O)−ni | (13) |
As a result of the equivalent circuit fitting, the dependence of R4 on pO2−m and pH2O−n with m4 = 0.26 and n4 = 0.08, respectively, was obtained. The dependence on pH2O is very weak (n close to zero). P4 has a summit frequency between 100 and 101 Hz. The pseudo-capacitance C4 was calculated and showed a value of 10−1–100 F cm−2.18 Such values are in line with the reaction orders proposed when oxygen surface diffusion from the TPB to the BGLC surface is the rate-limiting step.44,46 Moreover, P4 has an Ea of 0.81 eV, which is close to the apparent activation energy of the oxygen surface exchange coefficient for ordered perovskite cobaltites (0.6–0.9 eV).47,48 The relative contribution of P4 to the total polarization decreased strongly by changing from a pure BGLC (C4 = 0.016 F cm−2) to a BGLC587–BZCY541 composite oxygen electrode (Fig. S9†). All in all, this suggests that P4 is related to a process occurring at the surface of the BGLC and that the TPB reaction at the contact point BGLC587–BZCY541 is favored over a pure DPB process at the surface of BGLC as illustrated in Fig. 8.
 | ||
| Fig. 8 The schematic diagram of the proposed reaction mechanisms in the BGLC587–BZCY541 oxygen electrode for steam electrolysis. | ||
Regarding the middle frequency range, the related index of P3 on pO2 is 0.35 and hence, close to 3/8, while it is relatively independent of pH2O (n3 = 0.01). These values are consistent with what has previously been proposed for the electron transfer of an adsorbed O− to the proton conductor and the formation of neutral oxygen. But it has to be pointed out that the existence of neutral oxygen on perovskite phases is considered to be energetically unfavorable.43,49 Comparing the corresponding Ea of 1.07 eV and related capacitance of 10−2 F cm−2,34 it could suggest a surface process involving a charge transfer on oxygen.
The capacitance C1 (10−4–10−5 F cm−2) associated with P1 is consistent with the high-frequency process in symmetrical BGLC cells.18,50 The capacitance values are significantly lower than what is generally observed for gas and surface diffusion processes and processes related to a chemical capacitance. The magnitude of the capacitance could rather indicate a charge transfer process associated with a double layer capacitance. In the present study, a weak dependence of R1 on pO2 (m1 = 0.04) and pH2O (n1 = −0.008) was observed, also consistent with a previous study where this process was assigned to a process at the buried interface between the electrolyte and the oxygen electrode in a symmetrical BGLC cell since such processes are generally considered to be independent of gas atmosphere variation. The activation energy of R1 is 0.59 eV, which is within an acceptable range for proton transfer despite being slightly higher than the Ea of Ri from Fig. 4f corresponding to protonic transport in the electrolyte and far below the value expected for oxygen ion diffusion.
The process P2 (103 Hz, 10−3–10−4 F cm−2) shows the indices m = 0.35 and n = −0.28 and based on these identified reaction orders no clear assignment based on the proposed framework can be made. By considering only the correlation with pO2, P2 may involve a charge transfer. But the dependency of P2 on pH2O should not exist. The increase in R2 was observed at high pH2O or low pO2, most likely because this step is dominated by electron–hole transfer related steps. As mentioned above, the high steam content atmosphere may promote the hydration process and could hinder oxygen incorporation to some extent, which results in an electronic conductivity decrease. On the other hand, low pO2 may decrease the electronic conductivity as well. Further studies are still demanded for better clarification of P2 in the composite oxygen electrode.
The experimental results show that oxygen reactions at the surface of BGLC are determining factors for the performance of the oxygen electrode in PCC cells and that a composite structure may be beneficial to achieve higher performance. It needs to be stated that the deconvolution of the PCC full cell impedance is challenging due to the lack of mechanistic studies on the processes. A mechanistic interpretation of the water splitting reaction should ideally be performed with electrodes of defined geometries. Conditions in realistic porous electrodes are frequently a lot more complex and thus, their analysis with the above-mentioned models as provided in the present study can explain major trends rather than unequivocally identify mechanisms.
2.4. Durability in steam electrolysis operation
To assess the stability of the full cells with the BGLC587–BZCY541 oxygen electrode for steam electrolysis, different stability tests and post-mortem degradation analysis were carried out and the results are provided in Fig. 9. The cell was first tested in galvanostatic mode at different current densities and temperatures. The voltage evolution suggests good short-term stability. A slight improvement was observed in each step, particularly at high current density, which could be attributed to slight heating caused by exothermic operation at voltages higher than VTN or improvement of contact between the Pt current collector and the oxygen electrode, resulting in a decrease in the ohmic resistance. Additionally, another fresh cell was investigated at −0.8 A cm−2 and 600 °C with 30% H2O (Fig. S11†). Within 60 h, the voltage decreased from 1.44 V to 1.37 V, and it reached a similar voltage as shown in Fig. 8b, indicating high reproducibility of the cells in this study. The reduction of the ohmic resistance from 0.635 Ω cm2 to 0.527 Ω cm2 was the main contribution to the overpotential decrease, resulting in the improvement of the cell performance, which is a common feature of improved contact over time by using a Pt current collector. | ||
| Fig. 9 Stability characteristics of the PCC cells with the BGLC587–BZCY541 oxygen electrode in steam electrolysis mode. The short-term stability of measured voltages as a function of time at different current densities as indicated on the left y-axis at 550 °C (a) and 600 °C (b). (c) Long-term stability of voltage evolution at 600 °C and a fixed current density of −0.4 A cm−2. (d) Cross-sectional images of the full cell and (e) the BGLC587–BZCY541 oxygen electrode after long term operation at different magnifications. | ||
After the short-term stability tests as shown in Fig. 9a and b, the cell was examined at −0.4 mA cm−2 and 600 °C for 366 h in total (Fig. 9c). The oscillation of the voltage was associated with an unstable steam supply. In the first 200 h at 10% H2O, the voltage remained constant at around 1.22 V. In the following 166 h at 30% H2O, the voltage increased slightly from 1.213 V to 1.219 V corresponding to a degradation rate of 36 mV per 1000 h. The durability results confirmed the high stability of the cell with the BGLC587–BZCY541 oxygen electrode. Post-mortem cross-sectional microstructures were obtained via SEM after operation. Fig. 9d shows a distinct three-layer structure, including the dense BZCY541 electrolyte layer, the porous Ni-BZCY541 fuel electrode and the BGLC587–BZCY541 oxygen electrode. After operation the fuel electrode (Fig. S12†) is more porous compared to that after manufacturing (Fig. 1f), due to the nickel particle shrinkage associated with the reduction of nickel oxide. Notably, electrolyte and the fuel electrode were still bonded well without any delamination after the operation under a high steam content atmosphere. Moreover, the interface between the BGLC587–BZCY541 oxygen electrode and electrolyte also remained crack-free without any evidence of delamination. The microstructure of the oxygen electrode shown in Fig. 9e exhibits well-distributed porosity, and the particles did not show any obvious agglomeration or growth after durability operation, which is consistent with the stable electrolysis voltage at different applied current densities and steam content. The durability results together with the microstructural analysis confirmed good prospects in terms of stability of the cell with the BGLC587–BZCY541 oxygen electrode.
3. Experimental section
3.1. Synthesis of Ba0.5Gd0.8La0.7Co2O6−δ
Ba0.5Gd0.8La0.7Co2O6−δ (BGLC587) powder was prepared using the EDTA-citrate complexing sol–gel method. The raw materials were Ba(NO3)2 (Alfa Aesar), Gd(NO3)3·6H2O (Alfa Aesar), La(NO3)3·6H2O (Alfa Aesar), and Co(NO3)2·6H2O (Alfa Aesar). The different precursor salts were dissolved in distilled water allowing for the targeted stoichiometric ratio to be achieved. For the solution, EDTA and citric acid were added as complexing agents with a molar ratio of 1![[thin space (1/6-em)]](https://www.rsc.org/images/entities/char_2009.gif) :1:1.5 (total metal ions:EDTA:citric acid). pH was adjusted to 8 by adding NH3·H2O. The obtained solution was heated at 80 °C under magnetic stirring until a viscous gel was obtained. The gel was fired at 240 °C for 10 h to form the precursor, which was subsequently crushed thoroughly in a mortar. Then the combusted powder was calcined at 1150 °C for 5 h in air.
:1:1.5 (total metal ions:EDTA:citric acid). pH was adjusted to 8 by adding NH3·H2O. The obtained solution was heated at 80 °C under magnetic stirring until a viscous gel was obtained. The gel was fired at 240 °C for 10 h to form the precursor, which was subsequently crushed thoroughly in a mortar. Then the combusted powder was calcined at 1150 °C for 5 h in air.
3.2. Cell manufacturing
Fuel electrode supported proton conducting ceramic cells with BGLC587–BZCY541 composite oxygen electrodes were fabricated.:4:1 and treated by planetary ball milling to obtain homogeneous mixtures. The mixed powder was dried and pressed in a 20 mm diameter pellet die with a uniaxial pressure of 60 MPa. The pellet was pre-sintered at 1150 °C for 2 h in air to obtain substrates.
:4. The corresponding electrode powders were mixed with a binder (6 wt% ethyl cellulose in terpineol) in a weight ratio of 65:35 to form a slurry. The slurry was screen-printed onto the BZCY541 electrolyte surface and subsequently sintered at 1000 °C for 2 h. Platinum paste (Heraeus GmbH, Germany) was brush-painted onto the surface of the oxygen electrode as a contact layer and sintered at 700 °C for 1 h. The active area of the full cell was 0.5 cm2.
3.3. Characterization
The synthesized powders and fabricated cells were investigated using X-ray diffractometers (Bruker AXS, Germany) for crystalline phase characterization. The morphology of the cells' functional layers was observed using a scanning electron microscope (Zeiss ULTRA PLUS SEM, Carl Zeiss AG, Germany). Dilatometry measurement was performed on a DIL 402C device (Netzsch, Germany) in the temperature range of 20–1200 °C with a heating rate of 3 °C min−1 in ambient air. A dense ceramic rod was prepared by isostatic pressing the powder in a latex tube at 460 MPa and sintering at 1200 °C for 10 h. The relative density of the sintered specimen was higher than 95%.Full cells were electrochemically investigated in fuel cell and electrolysis modes on a commercial test system (ProboStat, NORECS AS, Norway). On the fuel side, 50 sccm gas was fed into a bubbler at room temperature adding approximately 3% of steam. On the oxygen side, a humidifier (HumiStat, NORECS AS, Norway) was used to enable steam contents of 3–70%. The total gas flow rate on the oxygen side was fixed at 50 sccm. Platinum meshes were attached to both the fuel and the oxygen electrodes as the current collector. Each platinum mesh was connected with two platinum wires and the 2-electrode 4-probe method was used for electrochemical measurements. Cells were sealed using a ceramic sealant (Ceramabond 552, AREMCO, USA) and a glass paste (617, AREMCO, USA) to ensure gas-tight sealing. After the sealing process, the fuel electrode was reduced at 700 °C for 12 h with a 20% H2/80% N2 (wet, ∼3%) gas mixture while the oxygen electrode side was flushed with air. When reduction was complete and open circuit voltage (OCV) reached a steady state, the initial electrochemical cell performance was recorded first in fuel cell mode with wet air on the oxygen electrode side and humidified (∼3% H2O) H2 on the fuel side. All electrochemical measurements were performed using a Zennium XC (Zahner, Germany). Polarization curves were carried out from OCV to 0.3 V in fuel cell mode and from OCV up to 1.6 V in electrolysis mode with a scanning rate of 0.005 V s−1. Electrochemical impedance spectroscopy (EIS) was performed in a frequency range from 0.1 Hz to 100 kHz with an amplitude of 20 mV. Distribution of relaxation times (DRT) analysis was performed by using the modelling software ec-idea. A regularization parameter of 0.5 was chosen since it led to a small difference between the reconstructed and measured impedance spectra while avoiding over-regularization.51 Equivalent circuit model (ECM) fitting was carried out with ZView®.
For PCEC operation, 30% steam and 70% air were fed to the oxygen electrode side and a wet (∼3% H2O) gas mixture of 20% H2 and 80% N2 was fed to the fuel electrode side. During the test, polarization curves and EIS were recorded. The cells were operated in steady state operation for 30 min at current densities of −0.2, −0.4, −0.6, −0.8 and −1.0 A cm−2 at temperatures of 550 and 600 °C, respectively. Long-term stability was also examined at different partial pressures of steam (10% and 30%) and a current load of −0.4 A cm−2 and −0.8 A cm−2 for 366 h and 62 h, respectively. The production rate of H2 was analyzed using a mass spectrometer (EISense, V&F Analyse-und Messtechnik GmbH). The mass spectrometer was calibrated before each experiment. Then, the faradaic efficiency (ηFE) was calculated in steam electrolysis mode under various operating conditions as the ratio between the measured hydrogen production rate and the theoretical one:
 | (14) |
4. Conclusions
In summary, PCC cells with a BGLC587–BZCY541 composite oxygen electrode have been systematically investigated for fuel cell and steam electrolysis application at intermediate temperatures (500–700 °C). A peak power density of ∼400 mW cm−2 in fuel cell mode and a current density of −650 mA cm−2 at 1.3 V in steam electrolysis mode were reached at 600 °C, demonstrating good performance in both modes. The durability test in steam electrolysis up to 366 h at −0.4 A cm−2 and 30% steam content has shown an extrapolated degradation rate of 36 mV/1000 h which is at this stage very encouraging for further development.Detailed analysis of the impedance response of the PCC cells showed that the polarization resistance is dominated by the oxygen electrode. The oxygen evolution reaction was investigated by deconvolution of impedance spectra under various pO2 and pH2O atmospheres. In PCECs, the experimental results suggest that oxygen reactions at the surface of BGLC587 are determining factors for the cell performance. Furthermore, the study suggests that a triple phase boundary process at the contact point between gas phase, BGLC587 and BZCY541 is favored over a pure double phase boundary process at the surface of BGLC587. Approaches including morphological optimization, a decrease in the sintering temperatures and the use of finer grain sizes could be explored to enhance the exchange surface area of the oxygen electrode with the gas phase and thus further reduce the polarization resistance. The faradaic efficiency was shown to be strongly dependent on the atmosphere at the oxygen electrode. The variation of the faradaic efficiency upon pH2O, pO2 and current density revealed that operation at high pH2O and low pO2 could mitigate the issue of low faradaic efficiency by hindering the formation of electron holes and thus their diffusion throughout the electrolyte yielding current leakage. However, the current leakage became more severe at higher current density, that is at higher overpotential. For instance, the faradaic efficiency decreased from 80% to 68% when the applied current density was increased from −200 mA cm−2 to −800 mA cm−2 at 600 °C.
It is important to point out that this study was performed on cells with an active area of 0.5 cm2 and at relatively low steam conversion rates. In industrial operating conditions, for example, on cells with large active areas and at high steam conversion, the issue of current leakage through the electrolyte may become more prominent as the concentration of oxygen increases along the gas channel which is likely to affect the transport properties of the electrolyte. We anticipate that this as an important challenge to be addressed for the scale-up of planar PCC cells for electrolysis application.
Conflicts of interest
There are no conflicts to declare.Acknowledgements
The China Scholarship Council is acknowledged for the doctoral scholarship of Haoyu Zheng (201806160173). The German Federal Ministry for Education and Research is acknowledged for funding via the projects DAICHI (01DR18002) and ARCADE (03SF0580A). We would like to thank the University of Bayreuth, Chair for Electrical Energy Systems, for providing the impedance analysis and modelling software ec-idea (https://www.ees.uni-bayreuth.de/en/ec-idea).References
- Sunfire GmbH, Hydrogen the Renewable Feedstock and Energy Carrier, https://www.sunfire.de/en/hydrogen, 2020 Search PubMed.
- K. D. Kreuer, Annu. Rev. Mater. Res., 2003, 33, 333–359 CrossRef CAS.
- C. Duan, J. Tong, M. Shang, S. Nikodemski, M. Sanders, S. Ricote, A. Almansoori and R. O'Hayre, Science, 2015, 349, 1321–1326 CrossRef CAS PubMed.
- W. Wu, L.-C. Wang, H. Hu, W. Bian, J. Y. Gomez, C. J. Orme, H. Ding, Y. Dong, T. He, J. Li and D. Ding, ACS Catal., 2021, 11, 12194–12202 CrossRef CAS.
- M. Li, B. Hua, L.-C. Wang, J. D. Sugar, W. Wu, Y. Ding, J. Li and D. Ding, Nat. Catal., 2021, 4, 274–283 CrossRef CAS.
- V. Kyriakou, I. Garagounis, A. Vourros, E. Vasileiou and M. Stoukides, Joule, 2019, 4, 142 CrossRef.
- C. C. Duan, R. Kee, H. Y. Zhu, N. Sullivan, L. Z. Zhu, L. Z. Bian, D. Jennings and R. O'Hayre, Nat. Energy, 2019, 4, 230–240 CrossRef CAS.
- F. Baumann, J. Maier and J. Fleig, Solid State Ionics, 2008, 179, 1198–1204 CrossRef CAS.
- J. Fleig, Annu. Rev. Mater. Res., 2003, 33, 361–382 CrossRef CAS.
- J. Fleig and J. Maier, J. Eur. Ceram. Soc., 2004, 24, 1343–1347 CrossRef CAS.
- E. Fabbri, L. Bi, D. Pergolesi and E. Traversa, Energy Environ. Sci., 2011, 4, 4984–4993 RSC.
- L. Yang, C. Zuo, S. Wang, Z. Cheng and M. Liu, Adv. Mater., 2008, 20, 3280–3283 CrossRef CAS.
- A. A. Taskin, A. N. Lavrov and Y. Ando, Appl. Phys. Lett., 2005, 86, 091910 CrossRef.
- A. Taskin, A. Lavrov and Y. Ando, Prog. Solid State Chem., 2007, 35, 481–490 CrossRef CAS.
- D. Ávila-Brande, G. King, E. Urones-Garrote, A. Llobet and S. García-Martín, Adv. Funct. Mater., 2014, 24, 2510–2517 CrossRef.
- J. Kim, S. Sengodan, G. Kwon, D. Ding, J. Shin, M. Liu and G. Kim, ChemSusChem, 2014, 7, 2811–2815 CrossRef CAS PubMed.
- M. Papac, V. Stevanovic, A. Zakutayev and R. O'Hayre, Nat. Mater., 2020, 20, 301–313 CrossRef PubMed.
- R. Strandbakke, V. A. Cherepanov, A. Y. Zuev, D. S. Tsvetkov, C. Argirusis, G. Sourkouni, S. Prunte and T. Norby, Solid State Ionics, 2015, 278, 120–132 CrossRef CAS.
- E. Vøllestad, M. Schrade, J. Segalini, R. Strandbakke and T. Norby, J. Mater. Chem. A, 2017, 5, 15743–15751 RSC.
- J. Zhu, J. B. Guđmundsdóttir, R. Strandbakke, K. G. Both, T. Aarholt, P. A. Carvalho, M. H. Sørby, I. J. T. Jensen, M. N. Guzik, T. Norby, H. Haug and A. Chatzitakis, ACS Appl. Mater. Interfaces, 2021, 13, 20313–20325 CrossRef CAS PubMed.
- R. Strandbakke, E. Vøllestad, S. A. Robinson, M.-L. Fontaine and T. Norby, J. Electrochem. Soc., 2017, 164, F196–F202 CrossRef CAS.
- E. Vøllestad, R. Strandbakke, M. Tarach, D. Catalan-Martinez, M. L. Fontaine, D. Beeaff, D. R. Clark, J. M. Serra and T. Norby, Nat. Mater., 2019, 18, 752–759 CrossRef PubMed.
- H. Zhu and R. J. Kee, J. Power Sources, 2007, 169, 315–326 CrossRef CAS.
- K. Nomura and H. Kageyama, Solid State Ionics, 2007, 178, 661–665 CrossRef CAS.
- H. Zhu and R. J. Kee, Int. J. Hydrogen Energy, 2016, 41, 2931–2943 CrossRef CAS.
- R. J. Kee, H. Zhu, B. W. Hildenbrand, E. Vøllestad, M. D. Sanders and R. P. O'Hayre, J. Electrochem. Soc., 2013, 160, F290–F300 CrossRef CAS.
- C. Duan, J. Huang, N. Sullivan and R. O'Hayre, Appl. Phys. Rev., 2020, 7, 011314 CAS.
- K. Huang, H. Y. Lee and J. B. Goodenough, J. Electrochem. Soc., 1998, 145, 3220–3227 CrossRef CAS.
- S. Yamanaka, M. Fujikane, T. Hamaguchi, H. Muta, T. Oyama, T. Matsuda, S.-i. Kobayashi and K. Kurosaki, J. Alloys Compd., 2003, 359, 109–113 CrossRef CAS.
- S. Stotz and C. Wagner, Ber. Bunsenges. Phys. Chem., 1966, 70, 781–788 CAS.
- T. Schober, W. Schilling and H. Wenzl, Solid State Ionics, 1996, 86, 653–658 CrossRef.
- T. Norby and Y. Larring, Curr. Opin. Solid State Mater. Sci., 1997, 2, 593–599 CrossRef CAS.
- M. Liu and H. Hu, J. Electrochem. Soc., 1996, 143, L109–L112 CrossRef CAS.
- D. Poetzsch, R. Merkle and J. Maier, J. Power Sources, 2013, 242, 784–789 CrossRef CAS.
- Y. Zhou, E. Liu, Y. Chen, Y. Liu, L. Zhang, W. Zhang, Z. Luo, N. Kane, B. Zhao, L. Soule, Y. Niu, Y. Ding, H. Ding, D. Ding and M. Liu, ACS Energy Lett., 2021, 6, 1511–1520 CrossRef CAS.
- L. Yang, S. Wang, K. Blinn, M. Liu, Z. Liu, Z. Cheng and M. Liu, Science, 2009, 326, 126–129 CrossRef CAS PubMed.
- D. Han, X. Liu, T. S. Bjørheim and T. Uda, Adv. Energy Mater., 2021, 11, 2003149 CrossRef CAS.
- H. Hu and M. Liu, Solid State Ionics, 1998, 109, 259–272 CrossRef CAS.
- D. Huan, W. Wang, Y. Xie, N. Shi, Y. Wan, C. Xia, R. Peng and Y. Lu, J. Mater. Chem. A, 2018, 6, 18508–18517 RSC.
- S. Rajendran, N. K. Thangavel, H. Ding, Y. Ding, D. Ding and L. M. Reddy Arava, ACS Appl. Mater. Interfaces, 2020, 12, 38275–38284 CrossRef CAS PubMed.
- H. Ding, W. Wu, C. Jiang, Y. Ding, W. Bian, B. Hu, P. Singh, C. J. Orme, L. Wang, Y. Zhang and D. Ding, Nat. Commun., 2020, 11, 1907 CrossRef CAS PubMed.
- Y. Matsuzaki, Y. Tachikawa, Y. Baba, K. Sato, G. Kojo, H. Matsuo, J. Otomo, H. Matsumoto, S. Taniguchi and K. Sasaki, J. Electrochem. Soc., 2020, 167, 084515 CrossRef CAS.
- D. Poetzsch, R. Merkle and J. Maier, J. Electrochem. Soc., 2015, 162, F939–F950 CrossRef CAS.
- F. He, T. Wu, R. Peng and C. Xia, J. Power Sources, 2009, 194, 263–268 CrossRef CAS.
- H. Tian, W. Li, L. Ma, T. Yang, B. Guan, W. Shi, T. L. Kalapos and X. Liu, ACS Appl. Mater. Interfaces, 2020, 12, 49574–49585 CrossRef CAS PubMed.
- T. Kobayashi, K. Kuroda, S. Jeong, H. Kwon, C. Zhu, H. Habazaki and Y. Aoki, J. Electrochem. Soc., 2018, 165, F342–F349 CrossRef CAS.
- M. Burriel, J. Peña-Martínez, R. J. Chater, S. Fearn, A. V. Berenov, S. J. Skinner and J. A. Kilner, Chem. Mater., 2012, 24, 613–621 CrossRef CAS.
- M. V. Ananyev, V. A. Eremin, D. S. Tsvetkov, N. M. Porotnikova, A. S. Farlenkov, A. Y. Zuev, A. V. Fetisov and E. K. Kurumchin, Solid State Ionics, 2017, 304, 96–106 CrossRef CAS.
- R. Merkle and J. Maier, Phys. Chem. Chem. Phys., 2002, 4, 4140–4148 RSC.
- J. Dailly, F. Mauvy, M. Marrony, M. Pouchard and J.-C. Grenier, J. Solid State Electrochem., 2010, 15, 245–251 CrossRef.
- M. Hahn, S. Schindler, L.-C. Triebs and M. A. Danzer, Batteries, 2019, 5, 43 CrossRef CAS.
Footnote |
| † Electronic supplementary information (ESI) available. See DOI: https://doi.org/10.1039/d3ta01298k |
| This journal is © The Royal Society of Chemistry 2023 |