
 Open Access Article
 This Open Access Article is licensed under a
 Creative Commons Attribution 3.0 Unported Licence
Nanoparticle exsolution via electrochemical switching in perovskite fibers for solid oxide fuel cell electrodes†
Min
Xu
*abc,
Ran
Cao
ad,
Shitao
Wu
c,
JinGoo
Lee
e,
Di
Chen
 *a and
John T. S.
Irvine
*c
*a and
John T. S.
Irvine
*c
aThe Future Laboratory, Tsinghua University, Beijing 100084, China. E-mail: xumin2022@mail.tsinhua.edu.cn
bAcademy of Arts and Design, Tsinghua University, Beijing 100084, China
cSchool of Chemistry, University of St Andrews, Fife, St Andrews, KY16 9ST, UK. E-mail: jtsi@st-andrews.ac.uk
dWeiyang College, Tsinghua University, Beijing 100084, China
eAdvanced Energy Materials and Components R&D Group, Dongnam Division, Korea Institute of Industrial Technology, 33-1, Jungang-ro, Yangsan, Gyeongsangnam-do 50623, Republic of Korea
First published on 11th April 2023
Abstract
Metal nanoparticles support materials play a crucial role in many fields, including energy conversion/storage, catalysis and photochemistry. Here, the exsolution is reported as an in situ method to fabricate metal nanoparticles supported on perovskite (La0.52Ca0.28Ni0.06Ti0.94O3) powder and fiber materials. Significantly decreased polarisation resistance can be achieved by applying electrochemical switching within 3 min on the fiber electrode fuel cell to facilitate the exsolution. The fuel cell activated by electrochemical switching under wet hydrogen shows a promising performance with a maximum output power density of about 380 mW cm−2 at 900 °C in hydrogen. The phase-field model shows that the exsolution under extreme low oxygen partial pressure induced by electrochemical switching performs faster nucleation than the chemical-reduced case. This work provides a further understanding of electrochemically driven exsolution with fiber structure platform and simulation with phase-field models.
10th Anniversary StatementI have been a strong supporter of the Journal of Materials Chemistry as a strong vehicle for advancing Materials Chemistry as a core Chemistry Discipline since its inception by my colleague and mentor Tony West in Aberdeen. I served as an editorial board member before the journal's subdivision and am honoured when my articles are published in this key journal. |
1 Introduction
Supported nanoparticle materials received much attention over the last decades due to their prominent roles in many fields of modern industry.1–3 A recently studied cost- and time-efficient method named exsolution was widely investigated to fabricate fine and embedded metal nanoparticle decorated materials.4–6 The exsolution materials have been utilized in catalysis,7,8 solid oxide fuel/electrolysis cells,9,10 and membrane reactors.11,12 The number of applications based on exsolved functional materials greatly increases across multiple areas due to their compositional, structural and functional tunability.13–16The exsolution process can be simplified into three steps: diffusion, nucleation, and growth.4,6 The diffusion of cation is typically determined by the concentration and mobility of charges, thus could be affected by the crystal structure, geometry (mainly surface) and environment.6,17 The nucleation and growth are tuned by the free energy,18 temperature19 and other parameters.20 In general, the exsolution could be driven by the reduction,21 cation deficiency,22 strain23 and electrochemical switching.24 Among different driving forces, electrochemical switching by applying bias has been proven as an effective way to facilitate exsolution, enabling fast exsolution (within minutes) with homogeneous particle distribution compared with chemical treatment by hydrogen reduction.9,25,26 However, the process of electrochemical switching has been employed on few system and not been fully understood.27
Moreover, systems with high surface may afford larger interactive surfaces while guaranteeing the supply of cations, such as ordered microporous frame, thin film and fibers.19,28,29 The solid-state reaction was widely used to synthesis perovskite oxides by calcination at high temperature, for examples, above 1400 °C. The bulk or coarse powder displays a pure phase but low surface area due to the sintering under such a high calcination temperature. Differentiating from bulk samples and nano-powder, nanofibers offer a continuous structure to provide a unique pathway for the diffusion of ions.30 The hierarchical, porous and less tortuous pathway in the fiber electrode may contribute to a fast mass and charge transport.31 Besides, the nanofiber provides higher surface area which affords more active sites and resulting in better catalytic activity.32 The one-dimensional structure may provide a way to understand the diffusion of cations/vacancies in the support materials contributing to their unique structure and morphology, for example the surface effect and the continuity of support materials.33
Herein, the exsolution process of Ni particles was studied on both powder and fiber structure with the same composition, La0.52Ca0.28Ni0.06Ti0.94O3 (LCNT), to illustrate the surface and structure effects. The 20% A-site defect was designed to achieve oxygen stoichiometry to understand the influence of exsolution on the formation of oxygen deficiency.22 The results demonstrate that the fiber performed a faster exsolution process than the powder with hydrogen reduction. Furthermore, the electrochemical switching possesses an efficient exsolution process on the fiber electrode in wet H2 solid oxide fuel cell (SOFC) with the polarization resistance decreased from 6.02 to 0.69 Ω cm2. The phase-field model (thermodynamic function) shows that the extremely low pO2 achieved through electrochemical switching application provokes instant nucleation, thus facilitating particle exsolution.
2 Results and discussion
2.1. Characterization of Ni exsolution
The crystal structure evolution for perovskite samples before and after hydrogen reduction was examined during the exsolution. The LCNT powder samples were obtained by grinding the pellet prepared by solid-state reaction (SSR), while the fiber samples were prepared by electrospinning to achieve a continuous nano structure. Fig. 1(a) displays the XRD patterns of the powder and fiber samples, showing a similar perovskite structure. The crystal structure of the perovskite was investigated based on Rietveld refinement with GSAS II,34 revealing quite similar unit cell parameters (Fig. S1 and Table S2†). Indexing on a double cubic cell reveals that both (400) and (404) are single peaks without broadening. Weak reflections at (211) and (301) indicative of out-of-phase tilting are visualized from the crystal structure in Fig. 1(a). Thus, the most likely space group chosen based on the observation is tetragonal I4/mcm (a = b = 5.4769(0) Å, c = 7.7543(8) Å). Besides, there are small peaks (mark with diamond) indicate the presence of NiTiO3 (PDF No. 33-0960, rhombohedral, R![[3 with combining macron]](https://www.rsc.org/images/entities/char_0033_0304.gif) H space group).35 The formation of NiTiO3 phase can be avoid by reducing the doping amount to 0.03 (Fig. S2†).
H space group).35 The formation of NiTiO3 phase can be avoid by reducing the doping amount to 0.03 (Fig. S2†).
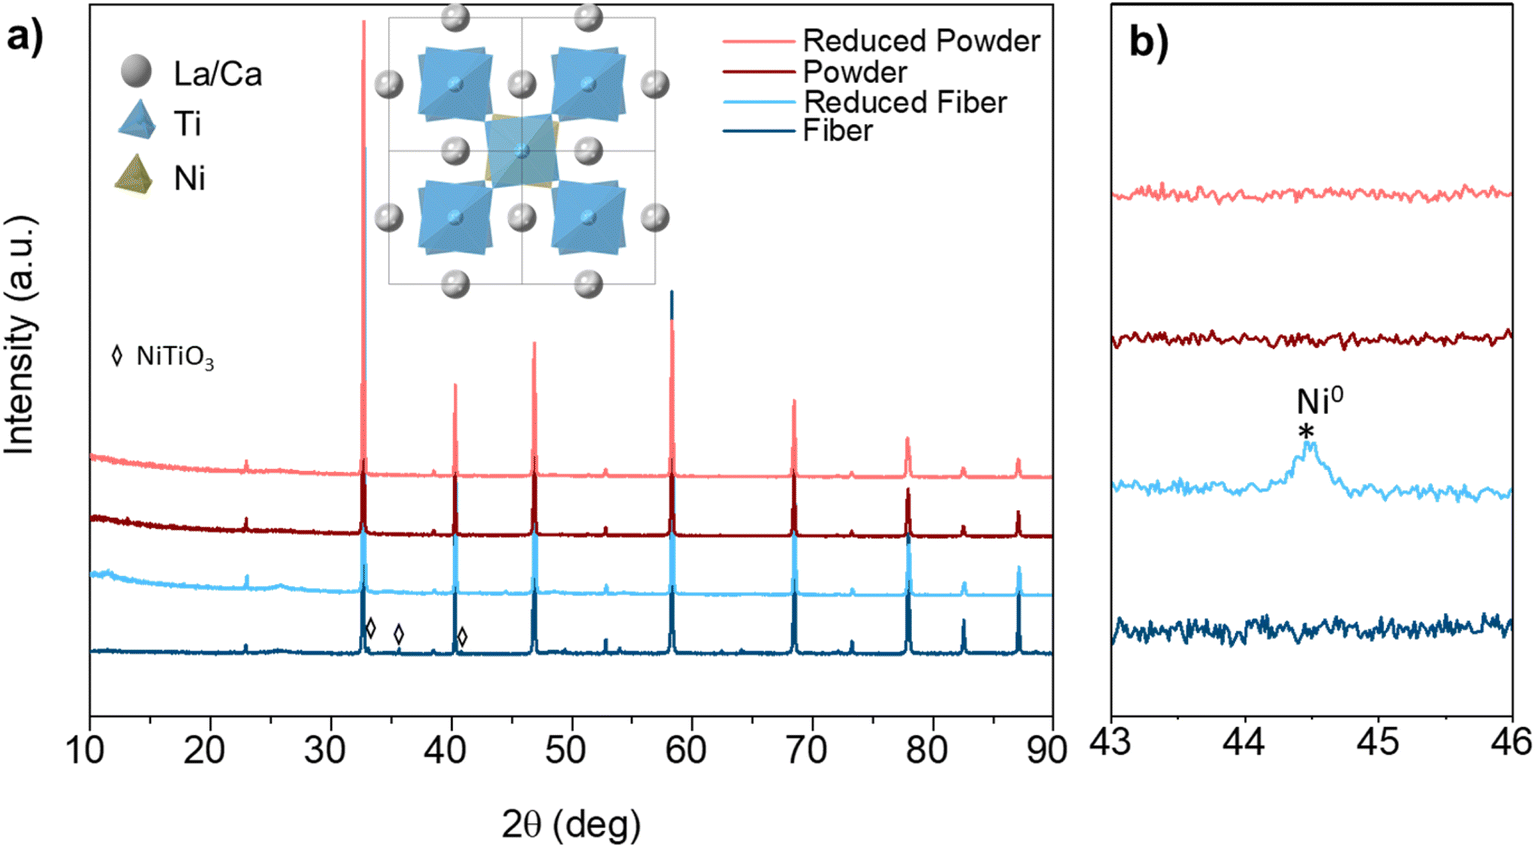 | ||
| Fig. 1 Exsolution of Ni nanoparticles from LCNT perovskite materials. (a) XRD pattern of powder and fibers samples before and after reduced in 5% H2/N2 at 800 °C for 4 h. (b) The magnified 2θ range between 43 to 46° to illustrate the presence of Ni phase. | ||
To trigger the exsolution of Ni nanoparticles, the samples were reduced in 5% H2/N2 at 800 °C for 4 h. There is no obvious peak shift shown in the XRD pattern before and after reduction indicates the perovskite structure was well retained. Obvious reflection around 44.5° show up for the fiber sample reveals the emergence of metallic Ni species, as shows in Fig. 1(b). However, the metallic Ni reflection cannot be observed for powder samples from the XRD pattern. The absence of metallic Ni reflection from the XRD may contribute to small nanoparticles and low exsolved Ni amount. The powder pieces exhibit a dense surface prepared by solid-state synthesis, as shown in Fig. 2(a and c). Sparse nanoparticles with an average size of about 15.9 nm exsolved from the powder surface reduced at 800 °C. A more significant number of nanoparticles decorated on the surface can be seen from the sample reduced at 900 °C (Fig. S3†).
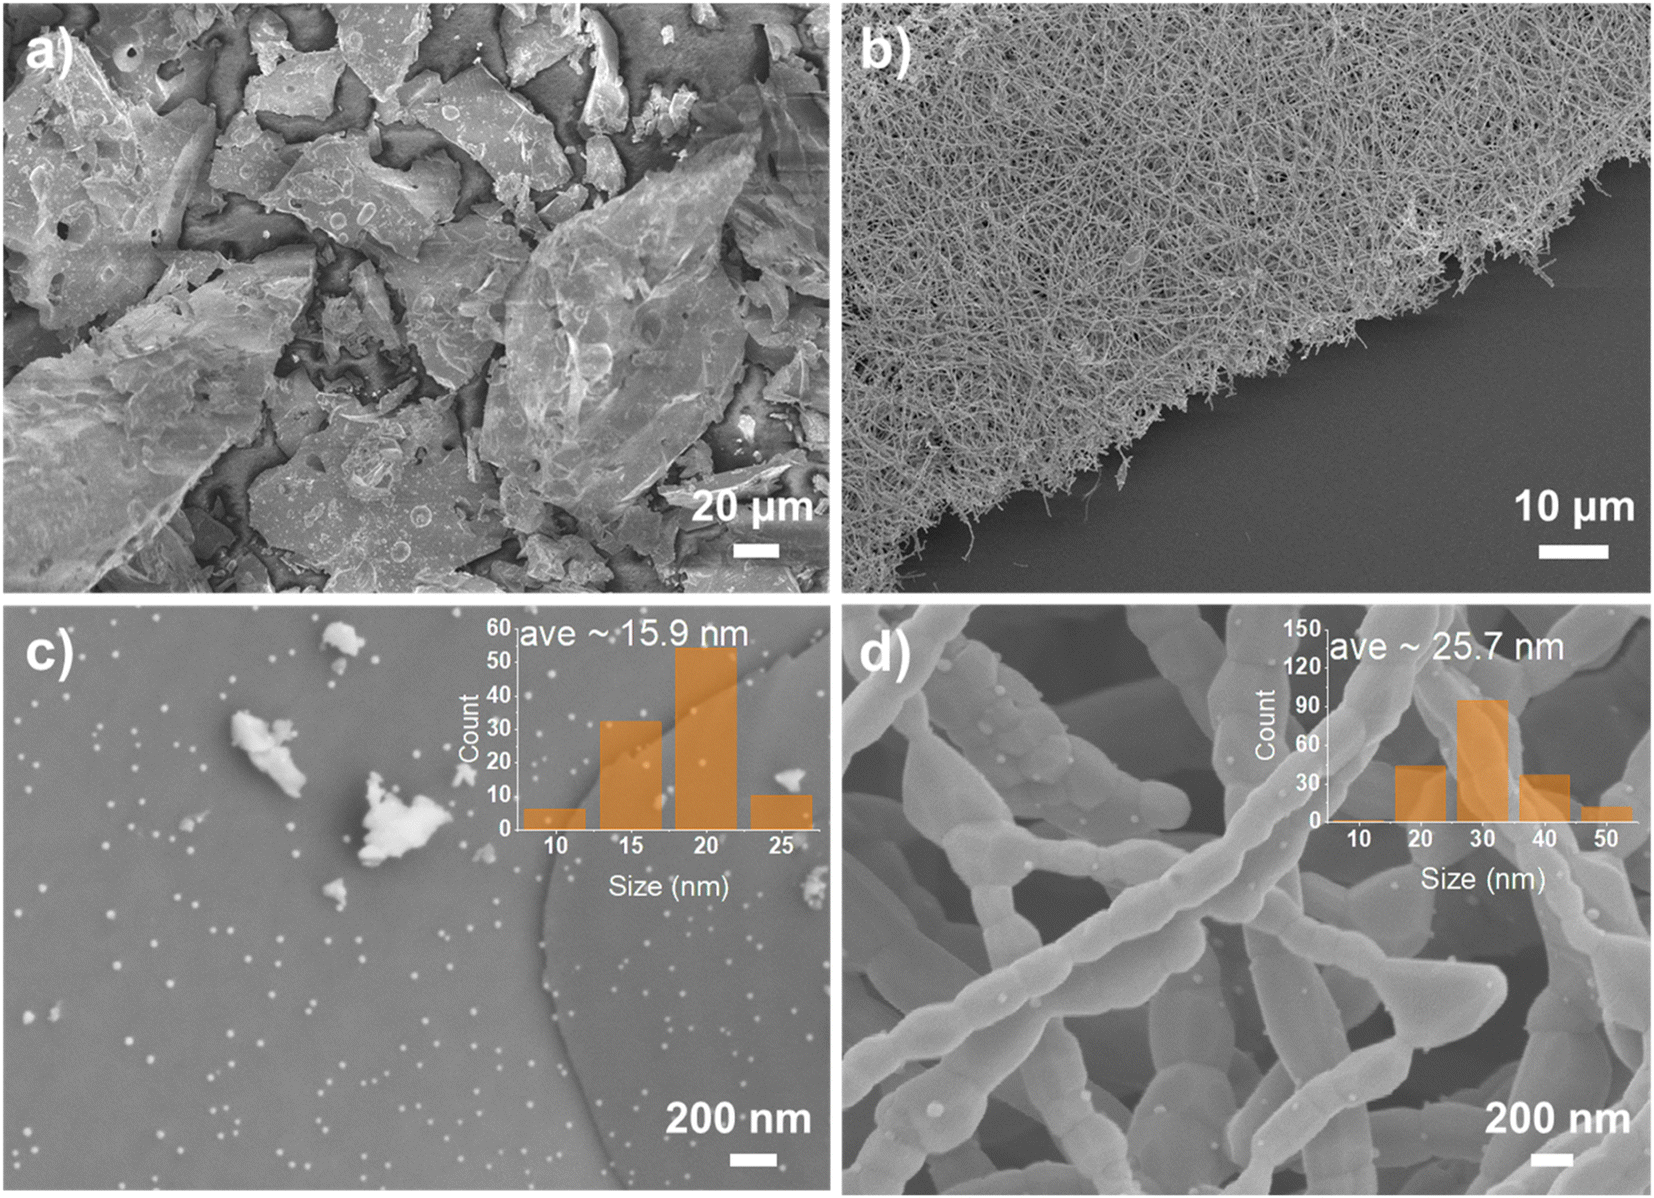 | ||
| Fig. 2 Morphology of exsolution of Ni nanoparticles from LCNT perovskite materials. SEM figures of (a and c) powder and (b and d) fiber reduced in 5% H2/N2 at 800 °C for 4 h. The insets show the size distribution of the exsolved nanoparticles. | ||
As the exsolved particles exhibit nano-size, thus, the microstructure of the samples was important to evaluate the degree of exsolution. The fiber calcined at 1100 °C consists of dense grains of about 200 nm (Fig. S4†). The smooth surface of fiber from high-resolution SEM figures indicates no particles on the surface before reduction. The fiber morphology was maintained after reduction, as shown in Fig. 2(b). Many nanoparticles formed on the surface of the nanofibers with an average size of about 25.7 nm, as shown in Fig. 2(d). The nanoparticles on fiber can be categorized into two types based on the location at the boundaries and on the facets of grains. Most nanoparticles are located on the grain with some particles on the grain boundary in which reduced surface energy was achieved.36 The nanoparticles size is larger on fibers than on pellets probably due to the lower surface energy and the short diffusion distance for the cations in lattice. The growth of exsolved nanoparticles may also benefit from the accumulation of cation diffusion through periphery grains.37
The Ni exsolution process of the fiber can be demonstrated from X-ray absorption spectra by the changes in oxidation state. Fig. 3(a) shows the X-ray absorption near-edge spectrum (XANES) at Ni K-edge for the reduced fiber samples. Significant absorption intensity suggests that Ni present in the high-oxidation state in fibers reduced at 400 and 600 °C, similar to Ni2+ in Ni(NO3)2 standard. XANES of the fiber sample under reduced below 600 °C almost stayed unchanged, while the sample reduced at 800 °C shows a decreased intensity for the absorption edge which reveals the formation of metallic species. However, the intensity of XANES of fiber reduced at 800 °C is still higher than the Ni foil, indicating mixed oxidation states with metallic and Ni2+.
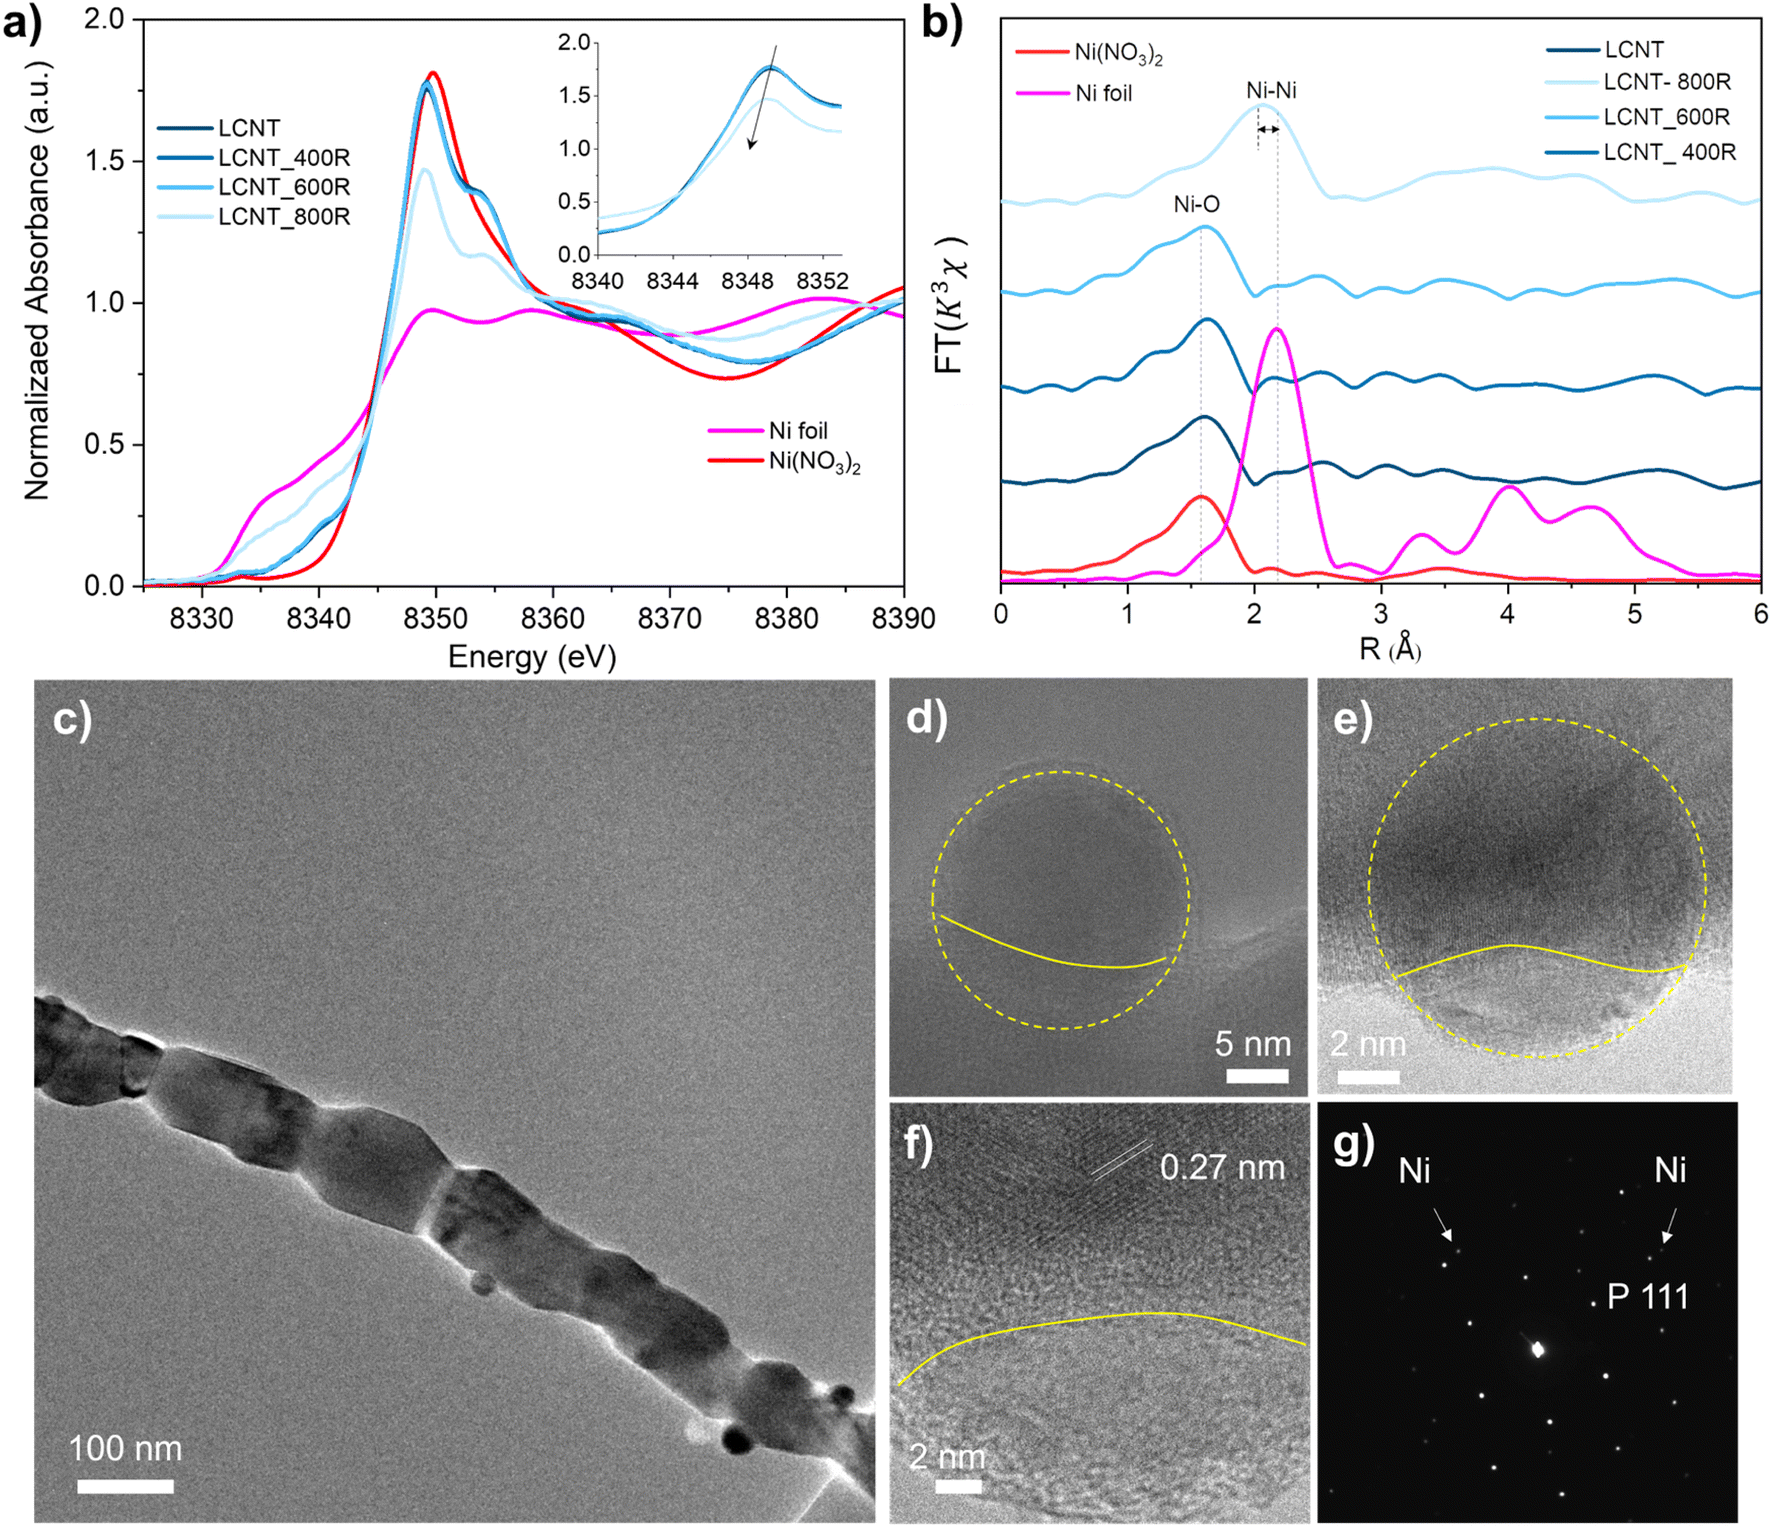 | ||
| Fig. 3 Characterization and microstructure of reduced LCNT perovskite fibers. (a) Ni K-edge XANES spectra and (b) Fourier-transformed k3x data for fibers reduced at 400, 600, and 800 °C with standard samples of Ni foil and Ni(NO3)2. (c) TEM images of reduced fiber. (d–f) TEM image of exsolved particle, (g) the corresponding SAED pattern of (c). | ||
Extended X-ray absorption fine spectra (EXAFS) at Ni K-edge were used to confirm the chemical states for Ni in the reduced fiber samples, as shown in Fig. 3(b). The Fourier transforms spectra in the R space from the k3-weighted EXAFS of fiber before reduction exhibits one predominant peak in the region ∼1.0–2.0 Å, assigned to the Ni–O bond indicating that Ni is in octahedra environment.38 The monotonous feature of samples before reduction and reduced at 400 and 600 °C consisted with Ni(NO3)2, indicating samples possessed a single coordination environment surrounding the Ni atoms. Regarding the sample reduced at 800 °C, the peak shift to a longer distance (about 2.1 Å) contributes to the arising from the Ni–Ni coordination.39 A small shift distance (about 0.2 Å) to the Ni–O bond in Ni(NO3)2 revealing some nickel presents in a higher oxidation state.
The nanoparticles embedded in the fiber can be seen from the TEM image in Fig. 3(c–f). The exsolved particles are spherical, with about 20 nm in diameter, and socketed into the fiber with various depths as shown in Fig. 3(d–f) and S5.† The lattice space for the support is about 0.27 nm corresponding to the spacings of (200) planes of perovskite. Fig. 3(g) shows the selected area electron diffraction pattern of areas shown in Fig. 3(e), indicating the coexistence of the exsolved metallic Ni and the perovskite support.
2.2. Surface effect on exsolution
In reduction conditions, the oxygen in the perovskite oxide will be stripped away from the lattice followed with the exsolution of cations form perovskite: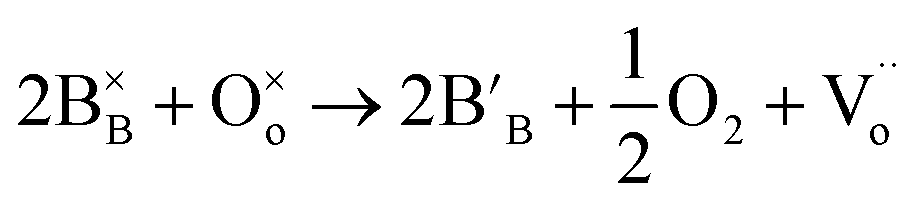 | (1) |
 ,
,  and
and  denote lattice cation, lattice oxygen and oxygen deficiency sites, respectively. The exsolution studied in this work can be simplified as cations diffusion in the solid followed by nucleation and growth.36 The diffusion of substitutional cation corresponds to the movement of the oxygen vacancies in another direction. By studying the formation of oxygen vacancies, the proceeding of exsolution can be elucidated to some extent. To further understand the influence of the structure of perovskite samples, the thermos-gravimetric analysis (TGA) was performed for samples in 5% H2/N2, as shown in Fig. 4(a) and S6.† The TGA with temperature curves shows the onset of weight loss at 670 and 800 °C for fibers and powder, respectively. The corresponding weight loss before dwelling at 800 °C for fibers is 0.31%, about 4.4 times higher than the powder with 0.07%. The fast weight loss for the fiber sample benefits from the present of NiTiO3 and also the higher specific surface due to the small grain size and connection of the individual grains. It seems that the higher surface area mainly contribute to the fast weight loss as the perovskite fiber without NiTiO3 phase displays a fast weight loss under the same reduction process, as shown in Fig. S7.† Moreover, it seems that the NiTiO3 endures a quick loss weight under 5% H2/N2 around 800 °C, as shown in Fig. S8.†
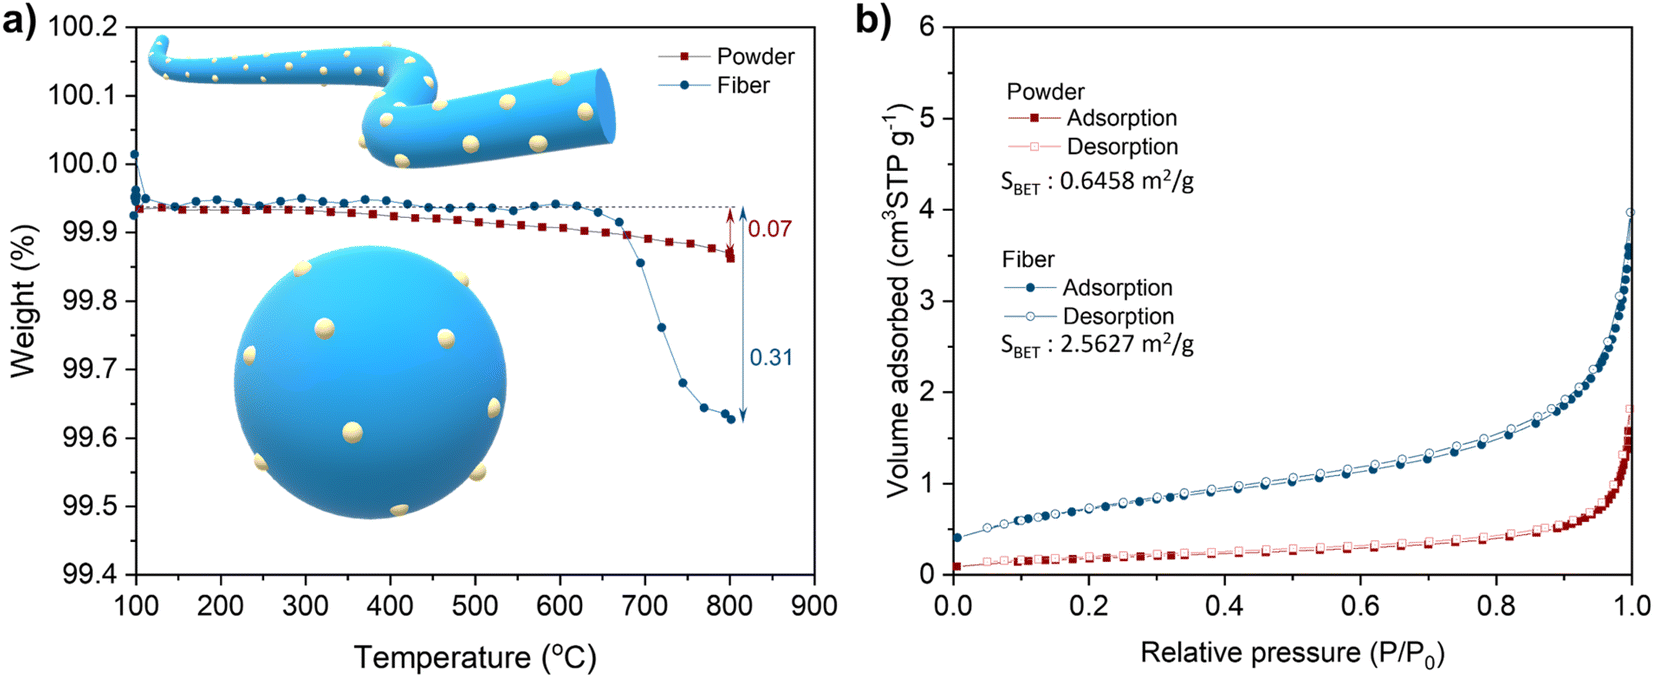 | ||
| Fig. 4 Exsolution process of LCNT perovskite materials under chemical reduction. (a) Weight loss of LCNT samples reduced in 5% H2/N2 from 100 to 800 °C, (b) N2 adsorption–desorption isotherms and BET surface area of samples. | ||
The oxygen deficiency formed in each sample can be calculated based on the weight loss. When increase the temperature, marginally oxygen was expelled from the bulk of the sample. Oxygen deficiency for the reduced samples can be calculated for the samples according to eqn (2):
 | (2) |
After being reduced at 800 °C for 10 h, the weight change reaches a plateau indicating a sufficient reduction (Fig. S5†). The weight loss is 0.45% and 0.27% for fiber and powder samples corresponding to oxygen deficiencies of 0.05 and 0.03.
The TGA results can be used to fit the particle growth model to understand the determining factors for the exsolution on materials. The fitting result is depicted in Fig. S9† and suggests that the reactant concentration limits the rate of reduction of the fibers. The powder reduction is too slow during the ramping step that none of the factors seems to fit the corresponding results well. When the reduction dwelled at 800 °C (shown in the range between 250–800 min), the reduction matched the diffusion-limited model. The reduction of fibers is well matched with the reactant limited model revealing that the exsolution in fibers was determined mainly by the concentration of Ni.
The difference in rate-limiting factors may due to the morphology variation of samples, such as surface area, grain size and continuity. The N2 adsorption–desorption isotherms data for LCNT powder and fibers show that specific surface areas (SBET) for samples are 0.6458 m2 g−1 and 2.5627 m2 g−1, respectively, as shown in Fig. 4b. The higher SBET comes from the nano-grain size of fiber indicating more exposed surface areas, as shown in the SEM figures of the powder and fibers (Fig. 2). Besides, the reduction of NiTiO3 may also contribute to this difference.
2.3. Electrochemically driven exsolution on fiber cells
Above discussions show that the fiber sample exhibits a fast exsolution, thus fiber fuel cells was built to further explored their electrochemical properties. The fiber was prepared in slurry and painted on both sides of the YSZ electrolyte to fabricate symmetric cells (LCNT fiber/YSZ/LCNT fiber). The symmetric cells were then loaded in a sealed quartz tube filled with 5% H2/N2 to simulate in situ reduction. The electrodes bond well with the electrolyte after calcined at 1100 °C on the YSZ electrolyte with an optimized thickness of about 20 μm. The woven structure was maintained and built up a rough and porous surface indicating the perovskite fibers were resistant to sintering with weaker contact between each other (Fig. S10†). A well-distributed interface was formed based on intimate contact between the electrolyte and electrode.The impedance spectra of the symmetric cell are shown in Fig. 5. The arc at high frequency is associated with the charge-transfer process and the interface. The low-frequency arc can be assigned to the gas adsorption and dissociation at the surface of the electrode. The offset resistance (Rs) represents the ohmic resistance that is contributed to the ionic and electronic conduction. The Rs is related to the electrode ohmic resistance, the contact resistance between electrode and electrolyte. The electronic resistance of both the YSZ electrolyte (which is generally stable in a wide range of hydrogen partial pressures) and electrodes. Rs for fiber-based symmetric cells decreased from 0.57 to 0.32 Ω cm2 after being reduced for 2 h indicating an improved electronic conductivity due to the increased electron carriers.33
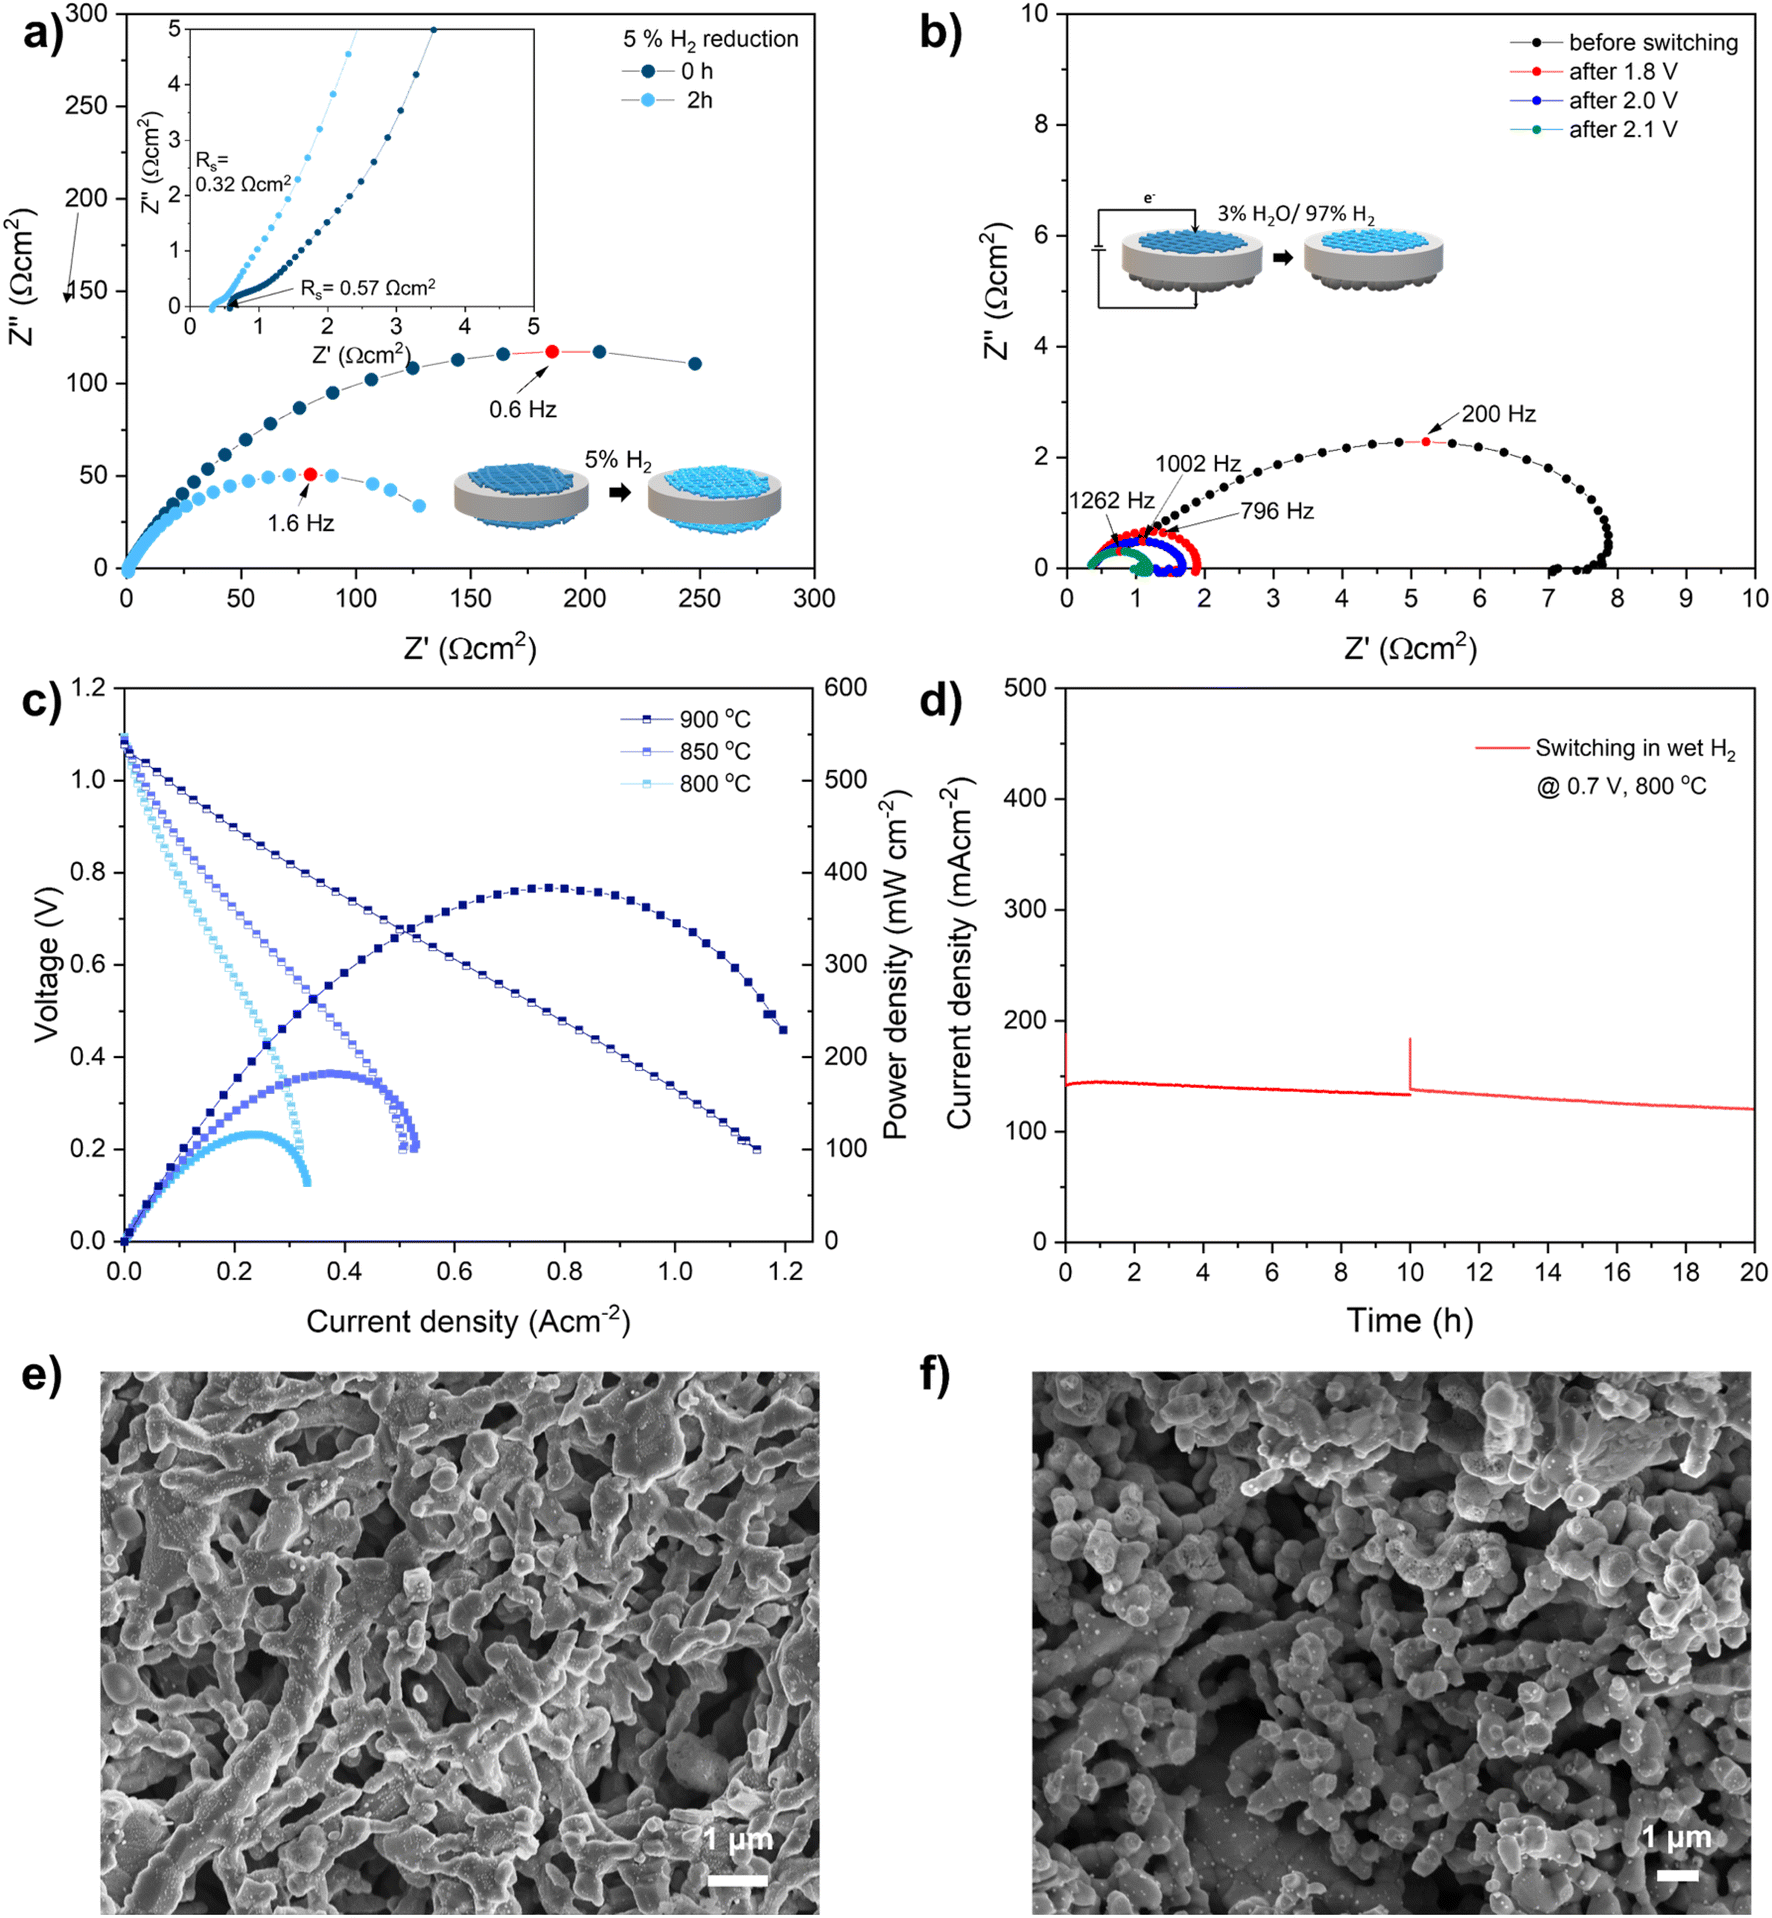 | ||
| Fig. 5 Performance and short-term stability of fiber electrode-based fuel cells. (a) Impedance spectra of the symmetric cells reduced at 800 °C in 5% H2/N2 for 0 and 2 h. (b) Impedance spectra after switching for 180 s at 900 °C at OCV in ∼3% H2O/97%H2, (c) current–voltage–power curves of the cell at different temperatures after switching in wet H2. (d) Short term stability in wet H2 for 20 h. SEM figure of (e) fiber electrode surface in symmetric cell after reduction, (f) fiber electrode in cell after stability test. | ||
Furthermore, the Rs of the fiber-based symmetric cell can be further decreased by reducing in pure hydrogen (Fig. S11†). The spectra arc at low frequency reflects the total polarization resistance (Rp) of the electrode, including fuel adsorption and decomposition. The total polarization resistance Rp (at 0 h) decreased from 300 Ω cm2 to 150 Ω cm2 at 800 °C after a reduction in 5% H2/N2 (Rp after 2 h) indicating the improvement of the electrochemical kinetics of the electrode surface.40 The summit frequency increased from 0.6 Hz to 1.6 Hz indicates the dominated process still at low-frequency which assign to the gas conversion and/or diffusion at the surface of the electrode.41 The resistance for powder based symmetric cell is comparable with fiber based electrode but slow reduction, as shown in Fig. S12.†
The activity of the electrode can be further improved by anodic polarization (refer as ‘switching’ later in this work) which facilitates exsolution in the steam.9,42 Electrochemically switching significantly decreases polarization resistance when applied potential from 1.8 V to 2.1 V, as shown in Fig. 5(b) and Table S3†. The Rp decreased from 6.02 to 1.10 Ω cm2 after switching at 1.8 V for 3 min which was further reduced to 0.69 Ω cm2 after switching at 2.1 V. As measured in an LSM half-cell measurement at OCV in air, it can be seen that the total polarisation resistance negligible contribution from the air electrode, as shown in Fig. S13.† The dramatic enhancement in cell performance was mainly due to the activation of fuel electrode. Moreover, the summit frequency for LCNT fiber based cell gradually increased from 200 Hz to 1262 Hz indicates the dominated reaction are mainly charge transfer process after switching.
The cell reaches a maximum output power density of about 380 mW cm−2, as shown in the IV curve in Fig. 5(c), which is compatible with the cell based on superior Zr0.89Sc0.1Ce0.01O2 (SSZ) electrolyte supported cell.40 The switched fiber cell demonstrates good short-term stability by operating in wet hydrogen at 800 °C for 20 h, as shown in Fig. 5(d). The current density decreased from 142 mA cm−2 to 120 mA cm−2 after the stability test. The surface and cross-section morphology of the symmetric cell and whole fiber cell were examined after measurement. A number of nanoparticles emerged on the surface and the cross-section of the electrodes, seen from the SEM images of cells switching in wet H2 (Fig. S14†). A careful inspection reveals a uniform distribution of nanoparticles decorating on the surface of the fiber electrode across the whole electrode, as fine nanoparticles are readily seen on the interface area and the surface. The small and uniform nanoparticle can be seen from both the surface of the electrode and the interface close to the electrolyte after reduction, as shown in Fig. 5(e) and S14(a).† The exsolved particles are uniform with slightly increased size after stability test, as shown in Fig. 5(f). A careful inspection reveals a uniform distribution of nanoparticles decorating on the surface of the fiber electrode across the whole electrode, as fine nanoparticles are readily seen on the interface area, as shown in Fig. S14(b).† The emergence of nanoparticles may contribute to the significantly reduced polarization resistance.
2.4. The phase-filed model on the exsolution under different driven cases
The electrochemical reduction creates a low oxygen partial pressure (estimated to be about 10−35 atm from the Nernst equation) which is much higher than chemical reduction-induced exsolution. The electrochemical switching provides an swift driving force for the formation of oxygen deficiency which significantly improves the exsolution, and simultaneously promoting the electrode performance compared with hydrogen reduction.9 However, it is not clear why the electrode display fast exsolution under electrochemical switching. Thus, we proposed that the applied bias provides an additional driving force for the creation of defective sites which serve as nucleation sites.43 To understand the exsolution process under different treatment condition, the phase-field model was used to simulate the emergence of nanoparticles under both chemical reduction and electrochemical switching (see ESI Section 1.4† for model details). The model results consist with classical development of phase transformation stages, as shown in the contour plots of xB′ (molar ratio of exsolved metal) under the reference condition in the inset pictures in Fig. 6(a), which describe the microstructure evolution at 0, 1 × 10⁴ steps and 1 × 10⁵ steps. The implicit relationship between pO2 and interaction energies between components was represented by Lij(pO2). The implicit relationship between interaction parameter and pO2 of Lij(pO2) simulates the thermodynamic basis of the exsolution. Noted that, herein the speculated constant values were employed in this work to simplify the model. More experimental and theoretical works are needed to provide the Lij for perovskite oxides.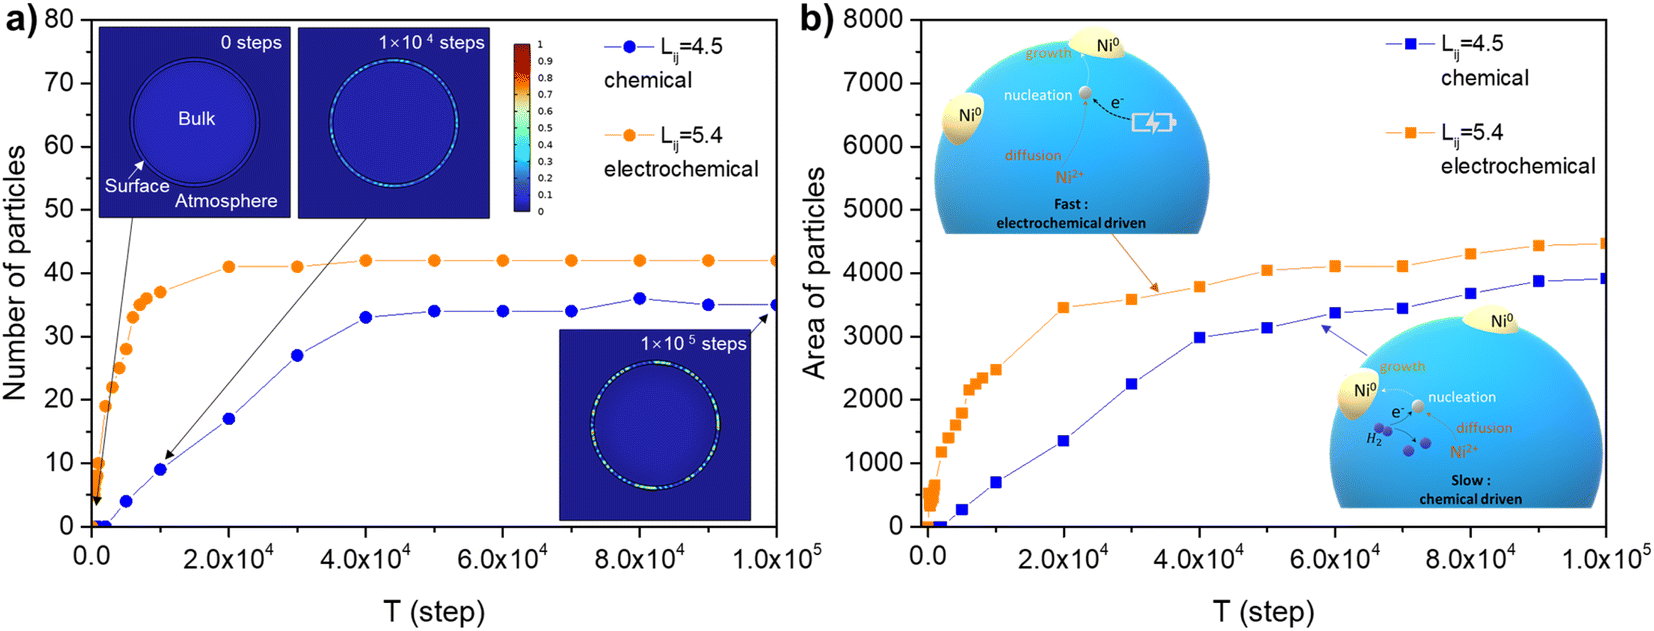 | ||
| Fig. 6 Phase-field simulation results for exsolution. (a) The number of particles and the exsolution particles profile vs. steps from the model, the insets show the contour plots of exsolved particles. (b) The area of particles and schematic of bias-driven exsolution of nanoparticles from perovskite fiber cells, the insets corresponding to the exsolution process under electrochemical and chemical driven, respectively. | ||
The value of Lij was set as 4.5 to achieve an oxygen partial pressure in chemical reduction situation (about 10−18 atm the 5% H2/N2). The nucleation rate reaches a plateau at 5 × 10⁴ steps, as shown in Fig. 6(a), which consistent to our experimental observation (Fig. 4(a)). The systems experienced different incubation states in which a metastable phase was initially reached and eventually stable (not revert to matrix) nuclei appeared. This quasi-steady state is followed by the continuous production of stable nuclei (state II in Fig. S15†).
The case with high Lij (5.4) represents an electrochemical switching system in which the number of stable particles rapidly increased. The high Lij was assigned to a fast transformation of metastable regions corresponding to fast oxygen extracting from the host by electrochemical switching. The number of particles for the electrochemical switching (Lij = 5.4) system is more than chemical reduced system (Lij = 4.5). Similar tendency can be seen from the area of emergent particles, as shown in Fig. 6(b). It is not surprising that the first incubation period is long for the system with a small interaction factor Lij = 3.4, which indicates a higher barrier under oxidation conditions (Fig. S16†). The model results indicate a rapid nucleation of metal occurred under electrochemical switching which offers a quickly activated exsolution process. The fast nucleation was consistent with the observation at high temperatures and under high vacuum.21 Besides, the nucleation in the high specific surface area fiber may be more important than ion diffusion in the bulk since the ions travel in short distances and faster in the continuous pathway.4,44
In the exsolution in perovskite, the formation of oxygen vacancies induces the subsequent ion diffusion and precipitating as well as the particle growth in the exsolution process. Our experimental and model results summarize that bias-driven exsolution was induced by the large pO2 gradient between the host lattice and the external environment. The oxygen stoichiometry variation via bias potential may also induce the generation of chemical strain and interfacial stress, followed by facilitation on nanoparticle exsolution. The bias to control the oxygen stoichiometry and induce the exsolution should be further investigated with quantitative techniques.45,46
4 Conclusion
This work developed a perovskite fiber catalyst as the fuel electrode of SOFC. The high surface fibers provide a special platform for investigating the surface/morphology effect on the exsolution of nanoparticles. The weight loss of the perovskite fiber under hydrogen reduction exhibits faster exsolution than powder, an indication corresponding to the formation of more oxygen deficiencies. Moreover, the exsolution on the fiber electrode was quick triggered by electrochemically switching. The electrolyte-supported solid oxide fuel cell based on fiber electrodes shows promising performance with the maximum power density reaching 380 mW cm−2 at 900 °C in hydrogen fuel after the electrochemically switching. Combined with the phase-field model simulation, we proposed that fast nucleation during electrochemical switching may contribute to extraordinary exsolution performance.Author contributions
M. X.: designed and carried out the experiments and wrote the manuscript; R. C: performed the modelling calculation; S. T. W.: TEM; D. C: funding acquisition and wrote the manuscript; J. T. S. I.: funding acquisition and resources, and wrote the manuscript. All authors discussed the results and commented on the manuscript.Conflicts of interest
There are no conflicts to declare.Acknowledgements
We thank the National Key Research and Development Program of China (no. 2021YFA0718900). We also thank the EPSRC for a Critical Mass project EP/R023522/1 and Electron Microscopy provision EP/R023751/1, EP/L017008/1; we also appreciate the support from National Research Foundation of Korea (NRF) grant funded by Korea government (MSIT) (no. 2021R1A2C2092130). Min acknowledges support from China Scholarship Council (no. 201706070126). We appreciate Prof. Alan Chadwick for assistant for the XAS data collection and Mr Guang Jiang for kind suggestions about the modelling, and Dr Hongyang Su for his kind comments.References
- Z. Li, S. Ji, Y. Liu, X. Cao, S. Tian, Y. Chen, Z. Niu and Y. Li, Well-defined materials for heterogeneous catalysis: from nanoparticles to isolated single-atom sites, Chem. Rev., 2020, 120(2), 623–682 CrossRef CAS PubMed.
- W.-J. Yin, B. Weng, J. Ge, Q. Sun, Z. Li and Y. Yan, Oxide perovskites, double perovskites and derivatives for electrocatalysis, photocatalysis, and photovoltaics, Energy Environ. Sci., 2019, 12(2), 442–462 RSC.
- J. T. S. Irvine, D. Neagu, M. C. Verbraeken, C. Chatzichristodoulou, C. Graves and M. B. Mogensen, Evolution of the electrochemical interface in high-temperature fuel cells and electrolysers, Nat. Energy, 2016, 1(1), 15014 CrossRef CAS.
- K. Kousi, C. Tang, I. S. Metcalfe and D. Neagu, Emergence and future of exsolved materials, Small, 2021, e2006479 CrossRef PubMed.
- C. Zhao, Y. Li, W. Zhang, Y. Zheng, X. Lou, B. Yu, J. Chen, Y. Chen, M. Liu and J. Wang, Heterointerface engineering for enhancing the electrochemical performance of solid oxide cells, Energy Environ. Sci., 2020, 13(1), 53–85 RSC.
- J. H. Kim, J. K. Kim, J. Liu, A. Curcio, J. S. Jang, I. D. Kim, F. Ciucci and W. Jung, Nanoparticle Ex-solution for supported catalysts: materials design, mechanism and future perspectives, ACS Nano, 2020, 15(1), 81–110 CrossRef PubMed.
- Y. Nishihata, J. Mizuki, T. Akao, H. Tanaka, M. Uenishi, M. Kimura and N. Hamada, Self-regeneration of a Pd-perovskite catalyst for automotive emissions control, Nature, 2002, 418(6894), 162–164 CrossRef PubMed.
- D. Neagu, T. S. Oh, D. N. Miller, H. Menard, S. M. Bukhari, S. R. Gamble, R. J. Gorte, J. M. Vohs and J. T. S. Irvine, Nano-socketed nickel particles with enhanced coking resistance grown in situ by redox exsolution, Nat. Commun., 2015, 6(1), 8120 CrossRef PubMed.
- J. H. Myung, D. Neagu, D. N. Miller and J. T. S. Irvine, Switching on electrocatalytic activity in solid oxide cells, Nature, 2016, 537(7621), 528–531 CrossRef CAS PubMed.
- O. Kwon, S. Sengodan, K. Kim, G. Kim, H. Y. Jeong, J. Shin, Y. W. Ju, J. W. Han and G. Kim, Exsolution trends and co-segregation aspects of self-grown catalyst nanoparticles in perovskites, Nat. Commun., 2017, 8, 15967 CrossRef CAS PubMed.
- D. Papargyriou and J. T. S. Irvine, Nickel nanocatalyst exsolution from (La,Sr) (Cr,M,Ni)O3 (M Mn,Fe) perovskites for the fuel oxidation layer of Oxygen Transport Membranes, Solid State Ionics, 2016, 288, 120–123 CrossRef CAS.
- G. Dimitrakopoulos, A. F. Ghoniem and B. Yildiz, In situ catalyst exsolution on perovskite oxides for the production of CO and synthesis gas in ceramic membrane reactors, Sustainable Energy Fuels, 2019, 3(9), 2347–2355 RSC.
- J. Zhang, M. R. Gao and J. L. Luo, In–situ exsolved metal nanoparticles: a smart approach for optimization of catalysts, Chem. Mater., 2020, 32(13), 5424–5441 CrossRef CAS.
- T. Cao, O. Kwon, R. J. Gorte and J. M. Vohs, Metal exsolution to enhance the catalytic activity of electrodes in solid oxide fuel cells, Nanomaterials, 2020, 10(12), 2445 CrossRef CAS PubMed.
- B. A. Rosen, Progress and opportunities for exsolution in electrochemistry, Electrochem, 2020, 1(1), 32–43 CrossRef.
- J. Spring, E. Sediva, Z. D. Hood, J. C. Gonzalez-Rosillo, W. O'Leary, K. J. Kim, A. J. Carrillo and J. L. M. Rupp, Toward controlling filament size and location for resistive switches via nanoparticle exsolution at oxide interfaces, Small, 2020, 16(41), e2003224 CrossRef PubMed.
- M. S. Islam, Computer modelling of defects and transport in perovskite oxides, Solid State Ionics, 2002, 154, 75–85 CrossRef.
- K. J. Kim, H. Han, T. Defferriere, D. Yoon, S. Na, S. J. Kim, A. M. Dayaghi, J. Son, T. S. Oh, H. M. Jang and G. M. Choi, Facet-dependent in situ growth of nanoparticles in epitaxial thin films: the role of interfacial energy, J. Am. Chem. Soc., 2019, 141(18), 7509–7517 CrossRef CAS PubMed.
- Y. R. Jo, B. Koo, M. J. Seo, J. K. Kim, S. Lee, K. Kim, J. W. Han, W. Jung and B. J. Kim, Growth kinetics of individual Co particles ex-solved on SrTi0.75Co0.25O3−δ polycrystalline perovskite thin films, J. Am. Chem. Soc., 2019, 141(16), 6690–6697 CrossRef CAS PubMed.
- J. Li and F. L. Deepak, In Situ Kinetic Observations on Crystal Nucleation and Growth, Chem. Rev., 2022, 122(23), 16911–16982 CrossRef CAS PubMed.
- D. Neagu, V. Kyriakou, I. L. Roiban, M. Aouine, C. Tang, A. Caravaca, K. Kousi, I. Schreur-Piet, I. S. Metcalfe, P. Vernoux, M. C. M. van de Sanden and M. N. Tsampas, In situ observation of nanoparticle exsolution from perovskite oxides: from atomic scale mechanistic insight to nanostructure tailoring, ACS Nano, 2019, 13(11), 12996–13005 CrossRef CAS PubMed.
- D. Neagu, G. Tsekouras, D. N. Miller, H. Menard and J. T. S. Irvine, In situ growth of nanoparticles through control of non-stoichiometry, Nat. Chem., 2013, 5(11), 916–923 CrossRef CAS PubMed.
- H. Han, J. Park, S. Y. Nam, K. J. Kim, G. M. Choi, S. S. P. Parkin, H. M. Jang and J. T. S. Irvine, Lattice strain-enhanced exsolution of nanoparticles in thin films, Nat. Commun., 2019, 10(1), 1471 CrossRef PubMed.
- A. K. Opitz, A. Nenning, C. Rameshan, R. Rameshan, R. Blume, M. Havecker, A. Knop-Gericke, G. Rupprechter, J. Fleig and B. Klotzer, Enhancing electrochemical water-splitting kinetics by polarization-driven formation of near-surface iron(0): an in situ XPS study on perovskite-type electrodes, Angew. Chem., Int. Ed., 2015, 54(9), 2628–2632 CrossRef CAS PubMed.
- A. K. Opitz, A. Nenning, V. Vonk, S. Volkov, F. Bertram, H. Summerer, S. Schwarz, A. Steiger-Thirsfeld, J. Bernardi, A. Stierle and J. Fleig, Understanding electrochemical switchability of perovskite-type exsolution catalysts, Nat. Commun., 2020, 11(1), 4801 CrossRef CAS PubMed.
- W. Zhang, H. Wang, X. Chen, X. Liu and J. Meng, Manipulation of rare earth on voltage-driven in-situ exsolution process of perovskite cathodes for low-temperature solid oxide fuel cells, Chem. Eng. J., 2022, 446, 136934 CrossRef CAS.
- W. Fan, B. Wang, R. Gao, G. Dimitrakopoulos, J. Wang, X. Xiao, L. Ma, K. Wu, B. Yildiz and J. Li, Anodic shock-triggered exsolution of metal nanoparticles from perovskite oxide, J. Am. Chem. Soc., 2022, 144(17), 7657–7666 CrossRef CAS PubMed.
- H. Arandiyan, Y. Wang, J. Scott, S. Mesgari, H. Dai and R. Amal, In situ exsolution of bimetallic Rh-Ni nanoalloys: a highly efficient catalyst for CO2 methanation, ACS Appl. Mater. Interfaces, 2018, 10(19), 16352–16357 CrossRef CAS PubMed.
- Y.-Q. Zhang, H.-B. Tao, J. Liu, Y.-F. Sun, J. Chen, B. Hua, T. Thundat and J.-L. Luo, A rational design for enhanced oxygen reduction: Strongly coupled silver nanoparticles and engineered perovskite nanofibers, Nano Energy, 2017, 38, 392–400 CrossRef CAS.
- J. Xue, T. Wu, Y. Dai and Y. Xia, Electrospinning and electrospun nanofibers: methods, materials, and applications, Chem. Rev., 2019, 119(8), 5298–5415 CrossRef CAS PubMed.
- Y. Chen, Y. Bu, B. Zhao, Y. Zhang, D. Ding, R. Hu, T. Wei, B. Rainwater, Y. Ding, F. Chen, C. Yang, J. Liu and M. Liu, A durable, high-performance hollow-nanofiber cathode for intermediate-temperature fuel cells, Nano Energy, 2016, 26, 90–99 CrossRef CAS.
- Y. Zhu, W. Zhou, Y. Zhong, Y. Bu, X. Chen, Q. Zhong, M. Liu and Z. Shao, A Perovskite Nanorod as Bifunctional Electrocatalyst for Overall Water Splitting, Adv. Energy Mater., 2017, 7(8), 1602122 CrossRef.
- D. Neagu and J. T. S. Irvine, Structure and properties of La0.4Sr0.4TiO3 ceramics for use as anode materials in solid oxide fuel cells, Chem. Mater., 2010, 22(17), 5042–5053 CrossRef CAS.
- B. H. Toby and R. B. Von Dreele, GSAS-II: the genesis of a modern open-source all purpose crystallography software package, J. Appl. Crystallogr., 2013, 46(2), 544–549 CrossRef CAS.
- L. Yang, X. Xue and K. Xie, Spatially confined catalysis-enhanced high-temperature carbon dioxide electrolysis, Phys. Chem. Chem. Phys., 2015, 17(17), 11705–11714 RSC.
- Y. Gao, D. Chen, M. Saccoccio, Z. Lu and F. Ciucci, From material design to mechanism study: nanoscale Ni exsolution on a highly active A-site deficient anode material for solid oxide fuel cells, Nano Energy, 2016, 27, 499–508 CrossRef CAS.
- H. I. Yoon, D. K. Lee, H. B. Bae, G. Y. Jo, H. S. Chung, J. G. Kim, S. L. Kang and S. Y. Chung, Probing dopant segregation in distinct cation sites at perovskite oxide polycrystal interfaces, Nat. Commun., 2017, 8(1), 1417 CrossRef PubMed.
- X. Zhao, Y. Wang, H. Wu, L. Fang, J. Liang, Q. Fan and P. Li, Insights into the effect of humic acid on Ni(II) sorption mechanism on illite: Batch, XPS and EXAFS investigations, J. Mol. Liq., 2017, 248, 1030–1038 CrossRef CAS.
- T. Zheng, K. Jiang, N. Ta, Y. Hu, J. Zeng, J. Liu and H. Wang, Large-scale and highly selective CO2 electrocatalytic reduction on nickel single-atom catalyst, Joule, 2019, 3(1), 265–278 CrossRef CAS.
- M. Chanthanumataporn, J. Hui, X. Yue, K. Kakinuma, J. T. S. Irvine and K. Hanamura, Electrical reduction of perovskite electrodes for accelerating exsolution of nanoparticles, Electrochim. Acta, 2019, 306, 159–166 CrossRef CAS.
- S. D. Ebbesen and M. Mogensen, Electrolysis of carbon dioxide in solid oxide electrolysis cells, J. Power Sources, 2009, 193(1), 349–358 CrossRef CAS.
- X. Yue, A. Pukhova, S. He and N. Zhang, Examining operando generated Ni-based alloy nanomaterials as fuel electrodes in solid oxide cells, J. Electrochem. Soc., 2021, 168(10), 104514 CrossRef CAS.
- J. Wang, J. Yang, A. K. Opitz, W. Bowman, R. Bliem, G. Dimitrakopoulos, A. Nenning, I. Waluyo, A. Hunt, J.-J. Gallet and B. Yildiz, Tuning point defects by elastic strain modulates nanoparticle exsolution on perovskite oxides, Chem. Mater., 2021, 33(13), 5021–5034 CrossRef CAS.
- F. N. Agüero, A. M. Beltrán, M. A. Fernández and L. E. Cadús, Surface nickel particles generated by exsolution from a perovskite structure, J. Solid State Chem., 2019, 273, 75–80 CrossRef.
- Y. Tao, S. D. Ebbesen, W. Zhang and M. B. Mogensen, Carbon nanotube growth on nanozirconia under strong cathodic polarization in steam and carbon dioxide, ChemCatChem, 2014, 6(5), 1220–1224 CAS.
- C. Graves, S. D. Ebbesen, S. H. Jensen, S. B. Simonsen and M. B. Mogensen, Eliminating degradation in solid oxide electrochemical cells by reversible operation, Nat. Mater., 2015, 14(2), 239–244 CrossRef CAS PubMed.
Footnote |
| † Electronic supplementary information (ESI) available. See DOI: https://doi.org/10.1039/d3ta00535f |
| This journal is © The Royal Society of Chemistry 2023 |