
 Open Access Article
 This Open Access Article is licensed under a Creative Commons Attribution-Non Commercial 3.0 Unported Licence
Effect of terminations on the hydrogen evolution reaction mechanism on Ti3C2 MXene†
Ling
Meng
 ab,
Li-Kai
Yan
*b,
Francesc
Viñes
*a and
Francesc
Illas
a
ab,
Li-Kai
Yan
*b,
Francesc
Viñes
*a and
Francesc
Illas
a
aDepartament de Ciència de Materials i Química Física, Institut de Química Teòrica i Computacional (IQTCUB), Universitat de Barcelona, c/Martí i Franquès 1, 08028 Barcelona, Spain. E-mail: francesc.vines@ub.edu
bInstitute of Functional Material Chemistry, Key Laboratory of Polyoxometalate Science of Ministry of Education, Faculty of Chemistry, Northeast Normal University, Changchun 130024, P. R. China. E-mail: yanlk924@nenu.edu.cn
First published on 27th February 2023
Abstract
Two-dimensional (2D) MXene materials are proposed as high-efficiency hydrogen evolution reaction (HER) electrocatalysts. Most computational studies addressed the HER assuming a fully O-termination, even if as-synthesized MXenes feature a mixture of –O, –OH, –F, or even –H surface groups. To better understand the electrocatalytic surface composition and mechanism under HER equilibrium conditions in the Ti3C2 MXene model material, we composed Pourbaix diagrams considering ca. 450 topologically different surface terminations, including pristine Ti3C2, full –O, –OH, –F, and –H terminations, and binary and ternary situations with different group ratios. Realistic models built from Pourbaix diagrams near HER equilibrium conditions of low pH and U were used to investigate the Volmer–Heyrovsky and Volmer–Tafel mechanisms, with the particularity of considering, or not, the participation of H atoms from –OH or –H termination groups at different reaction stages. Results pointed out that the models close to the HER equilibrium line, O2/3OH1/3, F1/3O1/3OH1/3, and F3/9O4/9OH2/9, require an almost negligible overpotential of 0.01 V, while surface charges explain the impact of higher ratios of –O groups on modulating the H bond, and the positive influence of having surface –F groups.
1. Introduction
The long-term problem of reaching a sustainable future by using clean and renewable energy sources has remained unsolved. A prospective candidate, hydrogen (H2), has attracted great attraction as a possible clean and renewable energy source thanks to its high energy density and non-polluting properties when used as fuel,1,2 especially when it is obtained from a renewable source such as wind and solar energy. The hydrogen thus obtained is usually referred to as green hydrogen to differentiate from that obtained from methane steam reforming, so far the most used source. When electricity can be obtained from these renewable sources, the electrocatalytic water reduction becomes a highly appealing way of producing H2,3,4 and here high-performing electrocatalysts are key to maximize the efficiency of the hydrogen evolution reaction (HER) process. Hitherto, Pt has been the most efficient electrocatalyst for the HER,5,6 although its intrinsic HER activity is limited by mass-transport.7 Moreover, the scarcity and high cost of Pt hinder its applications for large-scale electrocatalytic hydrogen production, and, therefore, the development of non-precious, Earth-abundant HER electrocatalysts, with high activities is essential to make the field move forward.Recently, great research endeavors have been placed at meeting this goal by exploring non-precious metal substitutes such as Ni or Ni-based alloys.8,9 However, while Ni is widely commercially used as a HER electrocatalyst, it is naturally unstable in acidic solutions, similar to other electrocatalysts used for the HER. Beyond Ni, various promising noble metal free two-dimensional (2D) materials with high activity towards the HER were proposed, including molybdenum dichalcogenides (MoS2),10–12 metal phosphides,13 g-C3N4,14–16 and graphene-based compounds.17 However, one crucial weakness of these 2D catalysts is that they often exhibit a semiconducting nature, and have poor charge transfer properties.10 Even if 1T-MoS2 overcomes this handicap by being a relatively good conductor, it has been found to be unstable under ambient conditions.12 Another drawback is that the catalytically active sites are normally restricted to edge or defective atoms, whilst most in-plane atoms are catalytically inert,18 reducing the overall atomic efficiency and performance of the electrocatalyst. Therefore, a constant search for new stable 2D HER electrocatalysts with good charge transfer kinetics while displaying multiple, regular catalytic active sites is of utmost importance.
It is just in this aspect that MXenes have attracted great attention as electrocatalysts for the HER. MXenes are 2D transition metal carbide, nitride, or carbonitride materials with the general chemical formula of Mn+1XnTx, where normally n = 1–3, M is an early transition metal, and X = C and/or N.19 The most-extended MXene synthesis involves the selective etching of the A element from a MAX phase precursor material, using F-containing etchants such as hydrofluoric acid (HF), or with HF produced in situ by mixing lithium fluoride (LiF) with hydrochloric acid (HCl). As a result, the as-synthesized MXenes display diverse surface functional groups on their basal planes, usually denoted as Tx, normally being –O, –OH, –H, or –F.20,21 Aside from the above methods, F-free synthesis procedures have been reported,22 with recent advances in controlling the surface termination with a variety of functionalities,23 and even procedures and treatments to obtain MXenes with no surface termination.23,24
Note that these procedures may lead to the appearance of internal or external defects,25 which, actually, can also be inherited from the precursor MAX phase. The presence of such defects can be affected by the synthesis methodologies and other factors, e.g. acid concentration, etching time, etc.,26 and their existence may be influenced by the surface termination; e.g., metal vacancy formation has been found to be more difficult on –O terminations than on –OH ones.27 Still, given, normally, a low concentration of defects, the surface chemical activity of MXenes is mostly determined by regular, defect-free sites, and the surface terminations they display. Such MXenes have attracted considerable attention in heterogeneous catalysis given their high surface area, high electronic conductivity, and high chemical and catalytic activities, with abundant active sites, while their composition, width, and surface terminations are the sandbox based on which tailor-made MXenes can be set up for specific applications.28
In the particular context of the HER, previous theoretical and experimental studies have shown that some members of the MXene family are promising candidates for the HER.18,29–34 However, these earlier computational studies assumed that the MXene basal plane functional group Tx consisted exclusively of either only –O or only –OH moieties, even though experimentally a diversity of –O, –OH, and –F moieties is detected.35 Also, theoretical assessments point to mixtures of moieties as being energetically more stable.36 In addition, MXenes have affinity towards H adatoms,37 and water is an easy supplier of –H terminations,38 even if it is difficult to unequivocally experimentally detect them. Actually, it is critical to realistically represent the MXene surface termination under HER working conditions of pH and applied potential, U. This aspect is crucial to understand the influence of the different types of functionalization in the HER potential determining step and the reaction mechanism. Here we focus on acidic environments, where proton (H+) activity is larger, avoiding alkaline conditions where HER performance is found to be more sluggish.39,40
This is indeed tackled here on the prototypical Ti3C2 MXene, extensively experimentally synthesized with various functionalizations,41–43 considering first the computed stability of hundreds of topologically different surface models with different ratios of –O, –OH, –H, and –F groups, used to build Pourbaix diagrams of surface termination stability dependent on pH and the applied potential, U. The obtained surface models suitable for HER conditions, considering both F-containing and F-free situations, allowed for a proper and detailed description of the reaction mechanism, highlighting (i) the presence of fluorine on the Ti3C2 surface unless obtained in F-absent situations, (ii) that, at variance with previous studies,18,44–46 not only –O termination is regarded as a possible HER active site, but it may involve surface –OH groups, implying two different hydrogen sources, either protons (H+) present in the medium, or surface H atoms, which make the reaction mechanism more complex, (iii) that –F groups can be beneficial at modulating the H bond strength, and not per se detrimental, and, finally, (iv) that the HER performance of the realistic models reveal that O-rich/OH-poor models, and stable ternary mixtures containing –F, –O, and –OH groups may lead to almost negligible estimated overpotentials, making such Ti3C2 terminated models excellent materials for the HER electrocatalysis.
2. Theoretical aspects
2.1. Computational details
The results reported in the present work were obtained from periodic density functional theory (DFT) calculations carried out using the Vienna ab initio simulation package (VASP).47 The core electrons and their effect on the valence electron density were described by the projector augmented wave (PAW) method.48 The exchange–correlation interaction was approximated by the Perdew–Burke–Ernzerhof (PBE) generalized gradient approximation functional.49 A basis set of plane waves was used, employing a kinetic energy cutoff of 415 eV. An energetic electronic optimization convergence criterion of 10−5 eV was used, while atomic optimizations were finalized once all forces acting on atoms were below 0.01 eV Å−1. The necessary numerical integrations in the reciprocal space were carried out using k-points Γ-centred Monkhorst–Pack meshes of 5 × 5 × 1 dimensions.50 The effect of dispersion was accounted for using Grimme's D3 approach (PBE-D3).51 Note that present and past test calculations varying the optimization thresholds, k-point density, and the size of the basis set led to variations in the total energy well below chemical accuracy, i.e., below ∼0.04 eV —1 kcal mol−1.52 Vibrational frequencies of H2 molecule in vacuum (see below) and the corresponding ones in the terminated Ti3C2 models were obtained by construction and diagonalization of the Hessian matrix, whose elements were computed by finite differences of analytical gradients with finite displacements of 0.03 Å in length. Note that such frequencies were obtained only for the terminations and adsorbed species, while atoms in the Ti3C2 MXene substrate were kept fixed in the optimized geometry. In this way, vibrational degrees of freedom on the surface terminations and adsorbed moieties are decoupled from Ti3C2 phonons, an approximation with negligible impact in the computed frequencies.37,38,52Pristine and fully –O, –OH, –H, and –F covered Ti3C2 were firstly evaluated using a p(2 × 2) supercell. The cases mixing different moieties were evaluated using either a p(2×2) or a p(3 × 3) supercell. A maximum monolayer (ML) coverage is defined when having one surface moiety per each surface metal atom, four or nine for the p(2 × 2) or a p(3 × 3) supercell, respectively. In the case of the p(2 × 2) supercell, ½ ML vs. ½ ML binary coverages were evaluated, as well as ¼ vs. ¾ of a ML. Ternary situations were explored as well, considering ¼, ¼, and ½ of a ML. For the p(3 × 3) supercell ⅓ vs. ⅔ binary situations were examined, as well as ternary situations with ⅓ of each component. The slab models contained 20 Å of vacuum to properly isolate the models explored.
2.2. HER reaction mechanisms
In general, there are two possible well-agreed mechanisms for the HER reaction, namely the Volmer–Tafel and Volmer–Heyrovsky mechanisms.53 In both cases, the first step is the same, the Volmer step, where a proton, H+, is reduced on the electrocatalytic surface by an electron, e−;| H+ + e− + * → H*, | (1) |
| 2H* → H2 + 2*. | (2) |
Notice that this mechanism is somehow similar to the Langmuir–Hinshelwood one in gas-phase heterogeneous catalysis, i.e., all reactants must first adsorb, prior to the reaction among them. Furthermore, one should be aware that generally the Volmer–Tafel mechanism does not consider the H2* moiety, i.e., it assumes that whenever H2 is formed, it automatically desorbs. Still, in case the H2 molecule is moderately adsorbed, one could rephrase the full Volmer–Tafel mechanism as
| (2×) H+ + e− + * → H*, | (3) |
| 2H* → H2* + *, | (4) |
| H2* → H2 + *. | (5) |
In the Volmer–Heyrovsky mechanism, the second proton is reduced directly over the previously reduced proton of the previous Volmer step, directly generating, again, the H2 molecule. Thus
| H* + H+ + e− → H2 + *. | (6) |
Indeed, this mechanism is reminiscent of the Eley–Rideal mechanism in gas-phase heterogeneous catalysis; i.e., only one reactant is adsorbed, and the other one directly attacks the adsorbed one from the gas phase. Still, the H2* moiety is generally ignored, but the Volmer–Heyrovsky mechanism could be rewritten as
| H+ + e− + * → H*, | (7) |
| H+ + e− + H* → H2*, | (8) |
| H2* → H2 + *. | (9) |
In the present study we regarded all the possible reaction mechanisms and elementary reaction steps, although in most examples in the literature,18,44–46 the Volmer–Heyrovsky was the only mechanism considered, and, moreover, regarding only the H reduction on fully O-terminated MXenes, like Ti3C2O2, even when high H coverage situations were involved. Thus, in addition to O-termination, we regarded –H, –OH, and –F full terminations, and binary and ternary combinations of them, as explained above. Notice that the inclusion of –OH and –H terminations implies that the reaction sequence can involve hydrogen atoms from surface terminations. Thus, instead of starting through the reduction of one or two H+ from the aqueous medium, for either Volmer–Heyrovsky or Volmer–Tafel mechanisms, the reaction may start through one or two H atoms of –OH and/or –H terminations. For example, on a –OH terminated Ti3C2, the Volmer–Heyrovsky reaction sequence could well be
| H+ + e− + –OH → –O + H2*, | (10) |
| H2* → H2 + *, | (11) |
| H+ + e− + –O → –OH. | (12) |
Notice that the direct formation of water upon a Volmer step on a surface –OH moiety has been disregarded as competitive since water removal requires the energetic cost of a surface O removal, plus free MXene surface sites are known to very easily adsorb H2O and dissociate it.38,54 While for the Volmer–Tafel mechanism, the formation of H2 from two H atoms from –OH surface groups could occur first, and then followed by the regeneration of the –OH moieties. Thus
| 2–OH → 2–O + H2*, | (13) |
| H2* → H2 + *, | (14) |
| (2×) H+ + e− + –O → –OH. | (15) |
In the present work, all these alternative reaction step sequences have been thoroughly investigated in all the surface models, to have a clear, holistic picture of the reaction mechanism.
2.3. Thermodynamic approach
For any of the above-mentioned mechanisms, we first consider the reaction thermodynamic profile by calculating the Gibbs free energy of hydrogen adsorption, obviously considering only minima in the potential energy surface. Note that the deliberate use of this approach neglects further kinetic aspects, succinctly assuming that energy barriers are simply differences in Gibbs free energies between minima. This approach has to be taken with a grain of salt, since, on one hand, one neglects that electrochemical steps involve a transition state, and the involved energy barriers will be larger than Gibbs free energy differences. The thermodynamic approach can be justified from the Brønsted–Evans–Polanyi (BEP) relationship that usually holds true,55,56 and so energy barriers would be linearly proportional to the Gibbs free energy difference, although bearing in mind the kinetics on the coupled proton–electron transfer steps may imply breaking these relationships. In any case, the kinetic aspects could be important, as shown, e.g., in the chlorine evolution reaction (CER), oxygen evolution reaction (OER), and oxygen reduction reaction (ORR).57,58 Further than that, other aspects could be critical in the proper HER performance, such as mass transport limitations.7 In any case, such detailed analyses are out of the scope of the present study, which aims at determining how surface terminations affect the HER reaction landscape, and for that we rely on the thermodynamic approach as a first educated guess, as extendedly used in the past.5,6,11–13,18,24–29Following the seminal work of Nørskov et al. introducing the computational hydrogen electrode (CHE),59 one can consider standard equilibrium conditions of pH = 0, U = 0 V, temperature, T, of 298.15 K, and a partial pressure of H2, pH2, of 1 bar. Under these standard working conditions, the complete HER pathway can be described as
| H(aq)+ + e− → ½H(g)2, ΔG° = 0 eV, | (16) |
| ΔGH = ΔEH + ΔEZPE − TΔSH, | (17) |
| ΔEH = EnH/MXene − E(n−1)H/MXene − ½EH2, | (18) |
 | (19) |
 are the ZPE energies of the MXene having n adsorbed H adatoms, n − 1 adsorbed H adatoms, or the H2 molecule in vacuum, respectively. The ZPE energy term, EZPE, is obtained from the computed vibrational frequencies, so that
 | (20) |
| ΔSH = SnH/MXene − S(n−1)H/MXene − ½SH2, | (21) |
 | (22) |
2.4. Surface Pourbaix diagrams
The Pourbaix diagram analysis is a key aspect to be regarded since the diagrams provide information about the surface composition under electrocatalytic conditions. In the case of the studied MXenes they allow determining which is the thermodynamically most stable surface termination under working conditions of pH and U.62 Details of the computational estimate of these diagrams can be found elsewhere,63 but let us here briefly explain the procedure. For any surface composition, the ΔG of formation is obtained, using certain molecular references. In the present case, one uses H(g)2 and F(g)2 references at 1 bar and 298.15 K for –H and –F terminations, using the standard hydrogen electrode (SHE) and standard fluorine electrode (SFE) under equilibrium conditions, so that| H+(aq) + e− ↔ ½H(g)2, | (23) |
| ½F(g)2 + e− ↔ F−(aq). | (24) |
Here, values of 0 and −2.87 eV are used for the reduction potentials of hydrogen, U, and of fluorine, UF, respectively.64 In the case of –OH and –O terminations, water vapor is used as a reference, taken at 0.035 bar and 298.15 K, conditions under which water vapor is in equilibrium with liquid water, that is, their chemical potentials or Gibbs free energies are equal.59 The computational Pourbaix diagram construction makes use of the CHE63 and the computational fluorine electrode (CFE), so that, under the aforementioned equilibrium conditions
 | (25) |
 | (26) |
Making use of these references and of the gas phase ones, one can calculate the formation energy of a given surface termination at zero pH and U, ΔG(0,0), as
| ΔG(0,0) = ΔG = ΔE + ΔEZPE − TΔS, | (27) |
with the different contributions obtained in a similar fashion as detailed above for ΔGH, and gas phase molecule entropy taken from thermodynamic tables.65 Once ΔG(0,0) is obtained, the pH and U dependent ΔG, ΔG(pH,U), can be obtained, as derived,63,66 from the following equation:
ΔG(pH,U) = ΔG(0,0) − υ(H+)kBT![[thin space (1/6-em)]](https://www.rsc.org/images/entities/char_2009.gif) ln10 pH − υ(e−)eU − υ(F−)eUF, ln10 pH − υ(e−)eU − υ(F−)eUF, | (28) |
| 3H2O + 3F2 + 9* → 3O* + 6F* + 3H2, | (29) |
for the ΔG(0,0) term considering gas phase species, but when considering pH and U, and the presence of H+ and F− species in solution, the equation can be rewritten as
| 3H2O + 6F− + 9* → 3O* + 6F* + 6H+ + 12e−, | (30) |
Following the above recipe, one can get the ΔG for any surface termination as a function of pH and U. Thus, the relative stability of different terminations under realistic conditions can be determined, the most stable at a given pH and U being the one with the lowest ΔG. Such info can be used to draw the Pourbaix diagrams by either making a fine grid of points and evaluating ΔG values of all the explored situations while taking the minima, or finding equilibrium lines in between competing surface terminations, for conditions in between phases A and B where ΔG(A) = ΔG(B). Note that, computationally, one can directly relate the computed ΔGs when using the same supercell; however, it is worth pointing out that, when using different supercells, ΔGs must be normalized and compared as given per surface area.
3. Results and discussion
3.1. Surface termination analysis
Prior to finding suitable models for evaluating the HER on Ti3C2 MXene, the four different surface termination moieties, namely –O, –OH, –H, and –F were considered on the Ti3C2p(3 × 3) supercell at high-symmetry top metal (T), bridge (B), three-fold hollow C (HC), and three-fold hollow Ti (HTi) positions, see Fig. 1, thus sampling at low-coverage regimes. Along with previous records with the same computational setup,37,38,52 the HTi site is regularly preferred. To further confirm the preference of surface termination moieties towards HTi sites, the full –OH terminated and a mixture of ⅔ of –O and ⅓ of –OH were examined here, both occupying HC or HTi, finding a clear preference for the latter by −0.23 to −0.64 eV per moiety unit, respectively, see Fig. S1 in the ESI.† Accordingly, the posterior surface termination samplings were examined only on HTi sites.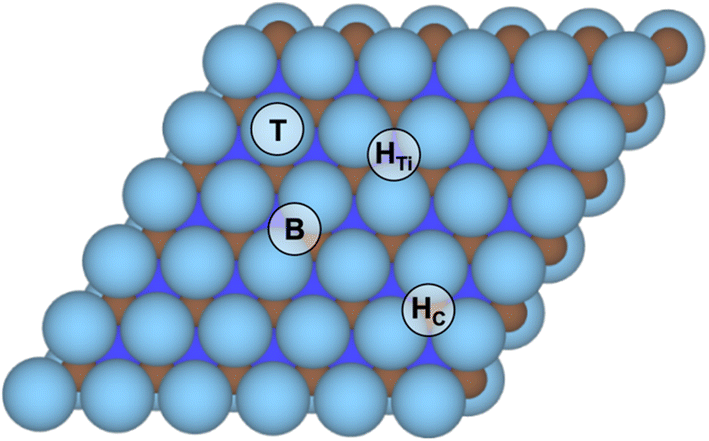 | ||
| Fig. 1 Top view of the Ti3C2 MXene model (0001) surface, where brown spheres denote C atoms, and light and dark blue spheres surface and subsurface Ti atoms, respectively. High-symmetry sites are tagged. | ||
In this way, 95 different surface terminations were explored considering mono, binary, and ternary situations combining –OH, –O, –H, –F, and free sites. For binary and ternary cases, different surface compositions were also considered, and for each one, different topologically distinct arrangements were studied, see Fig. S2–S7 in the ESI,† leading to a final number of 385 distinct surface terminations, making the present study the most complete so far regarding Pourbaix diagram evaluation of the Ti3C2 MXene model (0001) surface.63
Let us start the discussion with the simplest Pourbaix diagrams, regarding only full coverage situations of –O, –OH, –H, or –F. Fig. 2 shows two versions either considering F-free synthesis, thus in the absence of fluorine anions,67–69 or regarding fluorine explicitly useful, e.g., for MXenes synthesized using HF or in situ HF.19–21 The Pourbaix diagrams in Fig. 2 agree with previous assessments,18,70 particularly in the sense that generally the Ti3C2 (0001) surface is O-terminated at positive U with respect to the reversible hydrogen electrode (RHE) reference, or, in other words, above the HER equilibrium potential line, noting that, just below it, the –OH termination is preferred, in accordance with a favorable H+ reduction. Only at very negative potentials the H-termination becomes preferable, while free surface metal sites without termination are never found to be preferred. The equilibrium line in between –O and –OH terminations is actually very close to the HER equilibrium line, which suggests the existence of binary systems in between. Finally, note that –F has a small, yet key region of influence around the HER equilibrium line, particularly for very low pH values, up to pH = 2, exactly the region where HER conditions are sought, i.e., U values close to the HER equilibrium line, and a strong acidic medium, with a high concentration of H+ reactant. Thus, binary and even ternary surface terminations are in principle to be considered in duly modeling the HER on the Ti3C2 (0001) surface, and at this stage only free sites and –H terminations could be, in principle, ruled out, unless working at very low U.
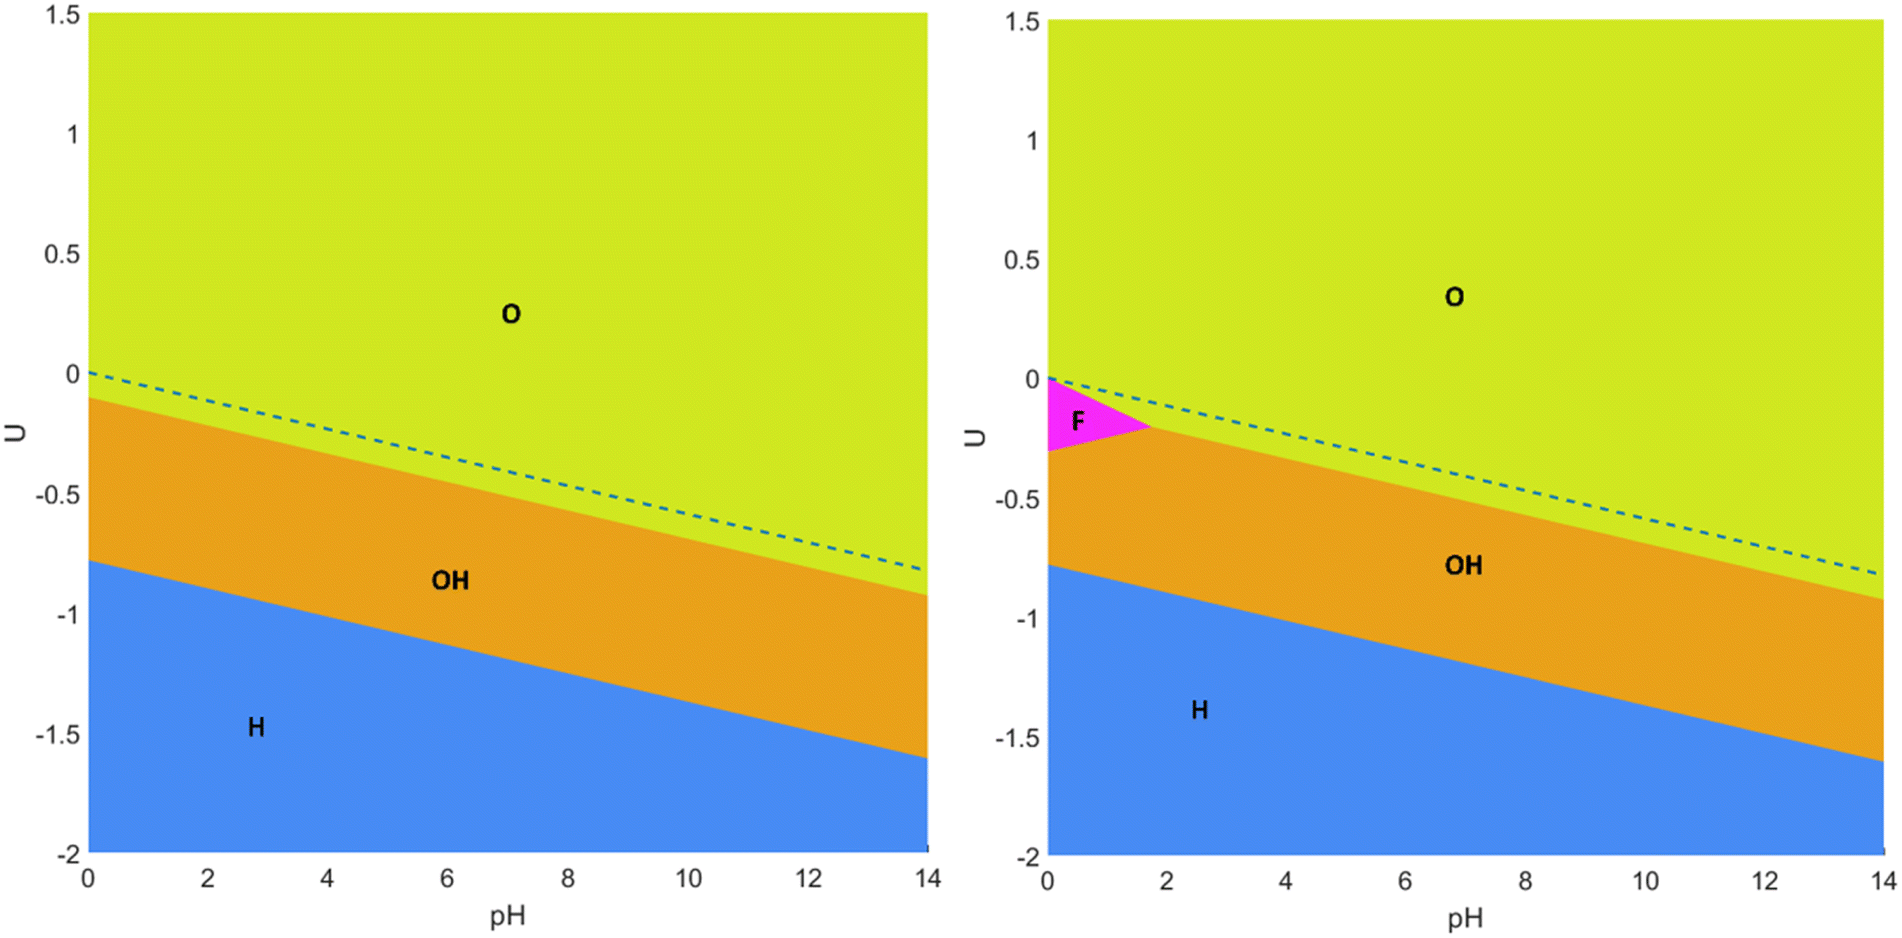 | ||
| Fig. 2 Pourbaix diagrams for the Ti3C2 MXene (0001) surface regarding fully –O, –OH, and –H terminated surfaces (left), or including as well fully –F terminated surfaces (right). Regions of preferred stability are colored and tagged. The blue, dashed line indicates the HER equilibrium potential using the RHE. | ||
In order to explicitly address this issue, the aforementioned mixed terminations were considered, and the resulting Pourbaix diagrams, either for F-containing or F-free situations, are shown in Fig. 3. From these diagrams, several aspects need to be pointed out. On one hand, the large regions of fully –O, –OH, or –H terminations as observed in the simplified Pourbaix diagrams of Fig. 2 are not realistic, and mixed situations constitute actually the preferred situation in the vicinity of the HER equilibrium line. Thus, the O-termination just above the HER equilibrium line, commented when discussing Fig. 2, is indeed an O-rich case, but containing a fraction of OH moieties, as observed by the sequential preference of the O2/3OH1/3 model, followed by the O3/4OH1/4 model, and only fully –O terminations are found ca. 0.4 V above the HER equilibrium line. Likewise, the –OH region under the HER equilibrium line in Fig. 2 is, in fact, an OH-rich mixture as denoted firstly by the OH1/2O1/2 model, followed by the OH2/3O1/3 model, and only the fully –OH model is found ca. −0.3 V below the HER equilibrium line. Only by going to more negative potentials, more than −0.8 V below the HER equilibrium line, would one reach the fully –H terminated model.
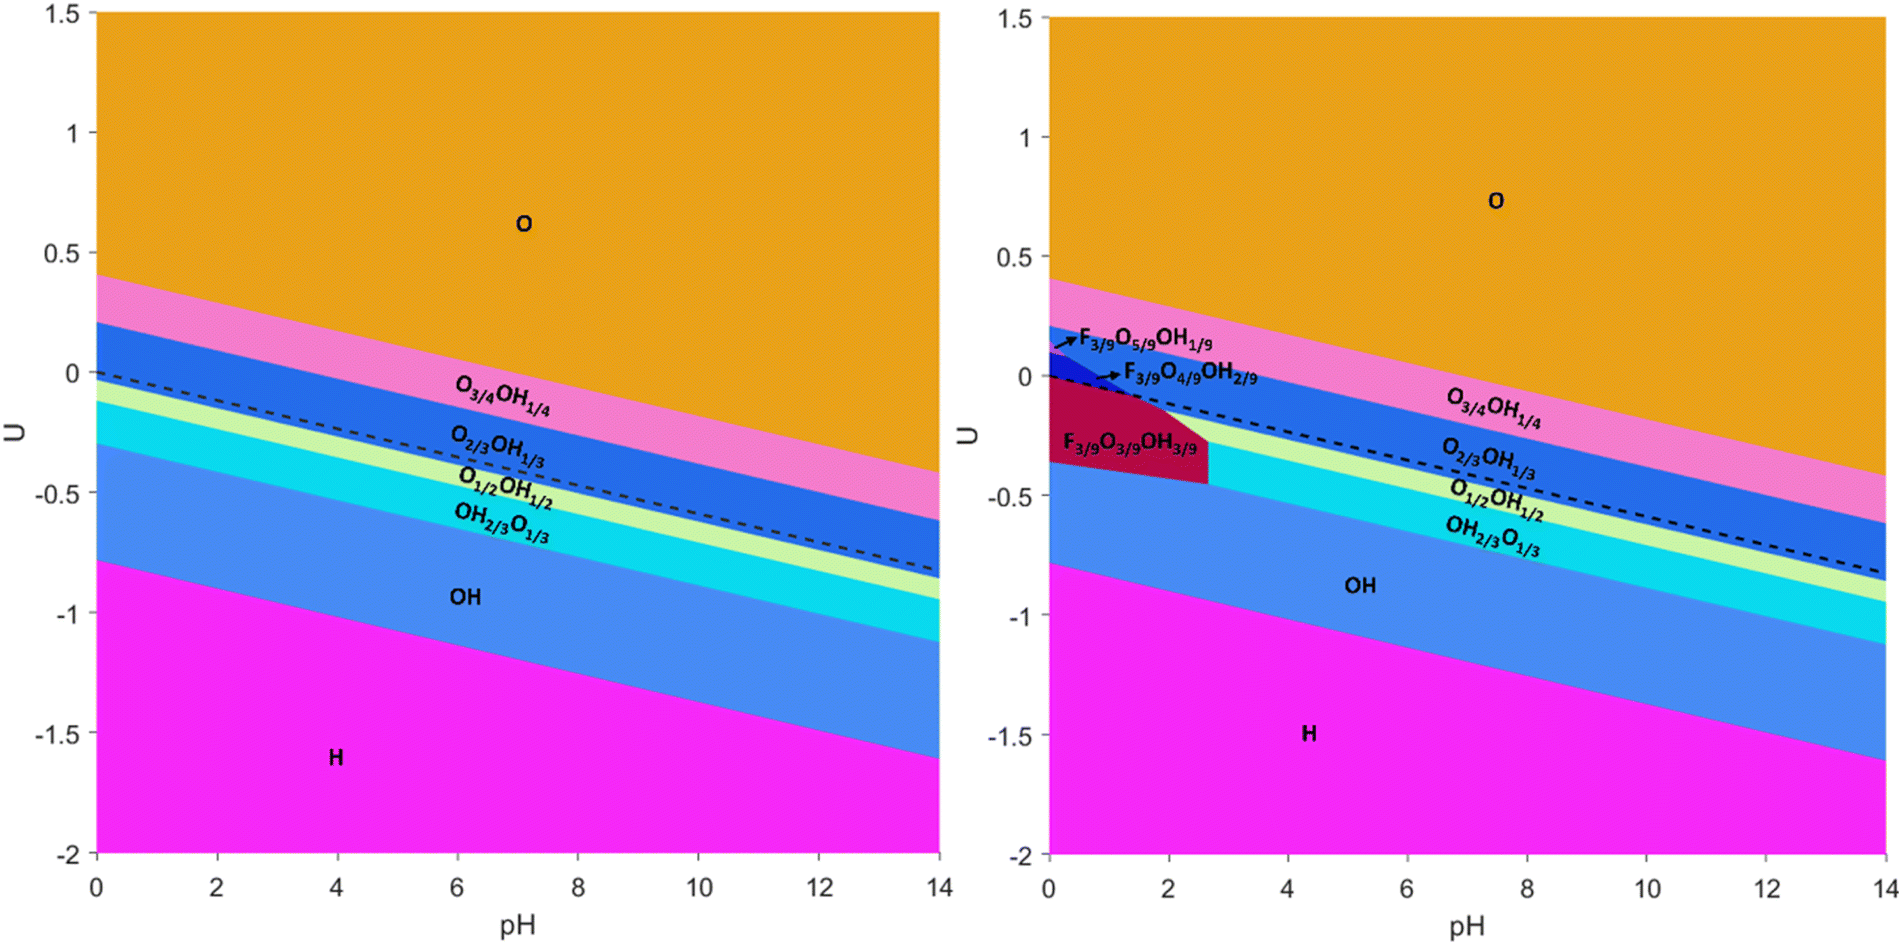 | ||
| Fig. 3 Pourbaix diagrams for the Ti3C2 MXene (0001) surface regarding all single, binary, and ternary surface compositions including –O, –OH, –H, and –F terminations, as well as free sites. The left image corresponds to situations without any –F termination, while the right image corresponds to situations when considering –F termination. The black, dashed line indicates the HER equilibrium potential with respect to the RHE reference. | ||
Moreover, the present F-free Pourbaix diagram, see Fig. 3, reinforces previous assessments18,63 in which in the vicinity of HER equilibrium conditions the Ti3C2 (0001) surface involves a mixture of –O and –OH terminations, –OH rich at U values more negative than HER equilibrium line and –O rich at U values more positive than HER equilibrium line, but essentially ruling out having fully –O terminated Ti3C2 as a viable model for the HER.71,72 Furthermore, the –OH termination is just preferred over a certain potential margin, and not stable at very low potentials as sometimes claimed in the literature,18 neither essentially non-existing as pointed out in others,63 plus the fully –H termination is viable at very low potentials, rather than the ideal, non-terminated surface.18
Still, the obtained Pourbaix diagram underscores the O-affinity of the Ti3C2 (0001) surface, plus the H-affinity of Ti3C2O2, given the appearance of a certain ratio of –OH moieties above the HER equilibrium line. As forecasted from fully single-terminated situations in Fig. 2, the Pourbaix diagram becomes disrupted when regarding –F moieties, see Fig. 3. There, one has to first highlight the stability of the F1/3O1/3OH1/3 model up to a pH of 2.87 and particularly close but below the HER equilibrium line, shown as a black dashed line in Fig. 3, with the region of prevalence of F1/3O1/3OH1/3 being exactly the ideal conditions to carry out the HER. Actually, a previous study73 claimed that the HER catalytic activity of Ti-based MXenes is experimentally and computationally correlated with the ratio of –F and –O functional groups, where large amounts of –F show poor catalytic activity and selectivity compared to low amounts of –F, plus the observation that a monotonous increase of –O termination increases the electrochemical potential.
In any case, the above commented Pourbaix diagram already underscores the need to account for such –F moieties, at least on Ti3C2Tx, when obtained through F-containing synthetic procedures. To further inspect this, additional ternary models containing –F, –O, and –OH moieties were calculated by increasing or decreasing the –O/–OH ratio, that is, through F3/9O5/9OH1/9, F3/9O4/9OH2/9, F3/9O2/9OH4/9, and F3/9O1/9OH5/9 models. These four models involved the systematic exploration of the topologically different arrangements, see Fig. S8 and S9 in the ESI,† accounting for 64 extra surface terminations. The impact of these terminations is only observed at very low pH and just above the HER equilibrium line, where small regions are observed for the F3/9O4/9OH2/9 and F3/9O5/9OH1/9 models, in which the presence of –F is maintained, while the surface becomes –O richer at the expense of the –OH groups. In any case, Fig. 3 reveals a number of surface terminations that could be relevant in the HER, either for F-containing or F-free Ti3C2Tx.
One still has to keep in mind that the present Pourbaix diagrams are the result of a series of terminations and topological arrangements that are anyway constrained by the employed supercells, and so, other arrangements could and would be possible. Besides, situations shown in Fig. 3 correspond to the most stable cases, but there are other arrangements which are close in energy that could well be appearing on the surface, especially when having in mind the inherent energy accuracy limitation of DFT-based calculations. Thus, a number of close possibilities should be regarded when inspecting the HER on Ti3C2Tx, as shown in detail below.
Last but not least, when considering the terminations in Fig. 2 and 3 for electrocatalytic HER applications, one should first regard whether the material remains conductive, or becomes a semiconductor, since the latter would handicap the electronic transference. To tackle this issue, the density of states (DOS) and projected DOS (PDOS) were obtained and are shown in Fig. S10 of the ESI,† revealing, briefly, that pristine Ti3C2, any fully terminated Ti3C2Tx, and any binary or ternary combinations of surface terminations lead to a metallic system, with the characteristic bonding, non-bonding, and anti-bonding regions of parent three-dimensional transition metal carbide (TMC) bulk structures,74 with the participation of Ti d orbitals, C and Tx = O, OH, F p orbitals, and H s orbitals. Notice that by mixing Ti d states with O, OH, F p or H s orbitals, new states appear close to the Fermi level, EF, arising from terminations, which may have a key impact in the H+ adsorption, and, consequently, on the HER electrocatalysis.
Aside from the above, charge density difference (CDD) plots, shown in Fig. S11 of the ESI,† reveal that, while Ti atoms become positively charged at the expense of giving their electron density to C atoms,75 any –O, –OH, –H and –F groups also become negatively charged, again at the expense of the electron density of surface Ti atoms. This leads to charge accumulations which are more prominent for –O terminations, compared to –F and –OH groups, in line with a formal −2e charge of O adatoms, while –F and –OH would have a charge close to −1e. In the case of –H, there is some electron accumulation, but more attenuated. Finally, on the binary and ternary systems, one clearly observes charge distributions, which can be easily interpreted as compatible with local rearrangements similar to the just mentioned full-terminated cases.
3.2. HER electrocatalysis mechanisms
Having established the surface stabilities through the computationally derived Pourbaix diagrams, and the overall electronic picture, it is now the turn of inspecting the HER performance on selected, representative cases. Let us begin with pristine Ti3C2 and fully terminated cases, that is, with –O, –OH, –F, and –H terminations. As aforementioned, both Volmer–Heyrovsky and Volmer–Tafel mechanisms are studied, and also considering the possible involvement of H atoms from –H and –OH terminations. Fig. 4 shows the Gibbs free energy reaction profiles for these five cases under standard working conditions —T = 298.15 K, pH2 = 1 bar, pH = 0, U = 0 V— regarding different reaction mechanisms and sequences, depending on whether surface termination coming from –H or –OH groups is involved or not.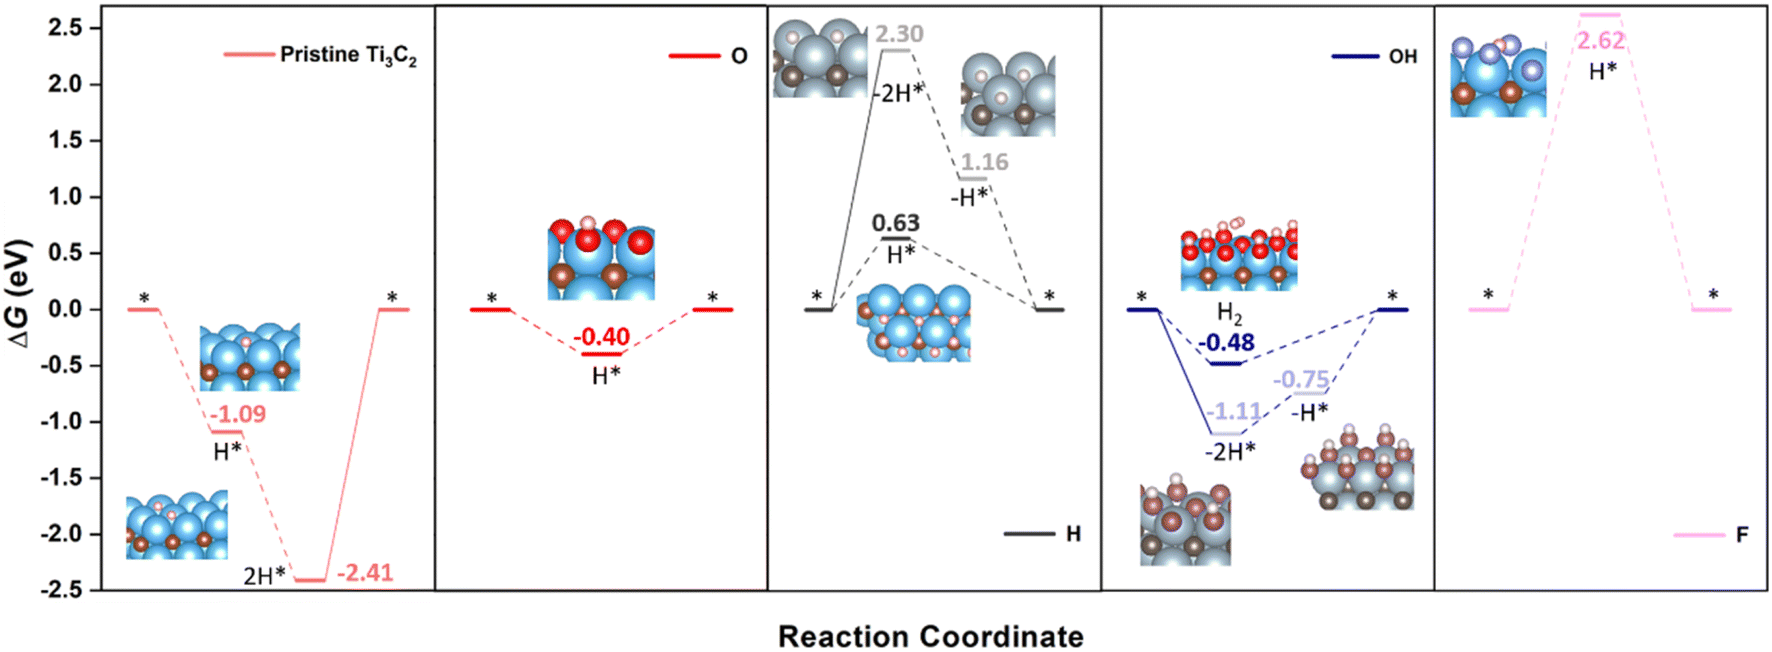 | ||
| Fig. 4 Gibbs free energy, ΔG, diagram of the HER on pristine or fully –O, –OH, –F, or –H terminated Ti3C2 (0001) surface under standard working conditions. Solid lines represent the chemical step of the as-generated H2 desorption, while dashed lines represent the electrochemical steps of proton coupled electron transfer (PCET). Inset images are side or eagle-eye views of the reaction intermediates, except for the H* state on –H termination, which depicts a top view to better observe the H* allocation on a surface empty HC site. Color coding as in Fig. 1, plus H, O, and F atoms are shown as white, red, and violet spheres. Preferred reaction mechanism and associated images are shown with bright coloring, while shadowed colors and images refer to other, non-preferred mechanisms. | ||
Let us first inspect the most extreme surface termination, which would be pristine Ti3C2. Pristine Ti3C2 is excessively chemically active, binding too strongly to the H adatom, with sequential computed ΔGs of −1.09 and −1.32 eV for the reduction of two protons following a Volmer–Tafel mechanism. Even though the two proton coupled electron transfers (PCETs) are energetically downhill, the formation of H(g)2 through the H* recombination in a chemical step is uphill by 2.41 eV, which implies a prohibitive annealing while trying to maintain the electrochemical conditions. Here basically the pristine Ti3C2 (0001) surface would be too reactive, and would successively reduce protons or hydroxyl groups coming from water so as to achieve a suitable surface termination according to the Pourbaix diagram (cf.Fig. 3). On the other extreme, one would have the –F terminated Ti3C2 surface with a severely decimated H-affinity, and a greatly unfavored first H+ reduction, with a ΔG = 2.62 eV, which could only work by applying a negative U of −2.62 V to lower the first electron transfer. The second PCET would rather follow here the Volmer–Heyrovsky mechanism. This result goes along with the aforementioned statement that large amounts of –F surface moieties imply poorer electrocatalytic activities and selectivities.73
Focusing on more suited surface terminations, the –O termination chemical activity gets attenuated in a large proportion, featuring a ΔG of −0.40 eV for first H+ reduction following the Volmer–Heyrovsky mechanism, thus requiring a U of −0.40 V to reduce the energetic costs of the second PCET, although at such overpotentials, the Ti3C2 surface would be mostly terminated by –OH groups, see Fig. 2 and 3. Actually, when inspecting –OH termination, the reaction energetics and mechanism already become more complicated. On one hand, one could consider a situation where two neighboring –OH termination moieties react to create two –O moieties plus a H(g)2 molecule. This chemical step has a ΔG of −1.11 eV, and would be followed by two consecutive H+ reductions on the as-generated –O termination sites to regenerate the electrocatalyst surface. In the literature, the corresponding overpotential is calculated, whenever considered, assuming that both H+ reduction steps are equally costly, and so the applied overpotential would be ca. −0.56 V, while the direct H+ reduction on an –OH surface moiety, following a Volmer–Heyrovsky mechanism, to directly generate H(g)2 has a ΔG of −0.48 eV, to be followed by the reduction of a H+ on the as-generated –O moiety to regenerate the electrocatalyst surface.
By this simpler view, one would consider that both mechanisms, considering one or two –OH terminations, could be somewhat competitive, differing by only 0.08 eV in the potential determining step, with a preference though on the Volmer–Heyrovsky mechanism. However, a closer inspection of the mechanism involving two surface –OH terminations leads to an easier first H+ reduction, with a ΔG of 0.36 eV, while the second H+ reduction is more costly, with a ΔG of 0.75 eV, acting as a rate and potential determining step. Thus, a Volmer–Heyrovsky reaction sequence as depicted in eqn (10)–(12) seems to be the most preferred one in –OH terminated Ti3C2, with a U of 0.48 V, in line with the overpotential of the OH-terminated phase as seen in the Pourbaix diagrams of Fig. 3.
Finally, in the H-terminated model, the Volmer–Tafel mechanism involving first the –H moiety recombination is found to be energetically quite costly, by 2.30 eV, making it prohibitive, even though the posterior electrocatalyst regeneration is quite downhill, with first and second H+ reduction steps involving ΔGs of −1.14 and −1.16 eV, respectively. Actually, on a fully H-terminated Ti3C2 (0001) model, the first H+ reduction is a Volmer step, occupying a HC site, with no direct formation of H(g)2, and with a ΔG of 0.63 eV, while the second H+ reduction would follow a Heyrovsky step. Note here as well that the potential determining step implies a U of −0.63 V, which is close to the region of prevalence of –H termination on the Pourbaix diagrams, see Fig. 3.
However, as seen in Fig. 3, at low pH and seeking low U working values, one should not use the fully terminated models, and consider models with binary and/or ternary situations, depending on whether one would have fluorine or not. This is evaluated in Fig. 5 for a list of suitable terminations derived from the realistic Pourbaix diagrams including F-free O1/3OH2/3, O1/2OH1/2, and O2/3OH1/3, but also the F-containing F1/3O1/3OH1/3 and F3/9O4/9OH2/9 models. Focusing on F-free models, one has different proportions of –O and –OH moieties, but their mutual existence opens three possible reaction mechanisms; (i) the H+ reduction occurs on an –O site, followed by a Heyrovsky step on top to directly generate H(g)2, hereafter denoted as O-TER, (ii) the H+ reduction occurs on a –OH site, following a Heyrovsky step, and a subsequent H+ reduction on the as-generated free –O site, hereafter denoted as OH-TER, and (iii) a Tafel step between two surface –OH moieties, followed by two subsequent Volmer steps to regenerate the –OH sites, by reducing the as-freed –O sites, named TER–TER.
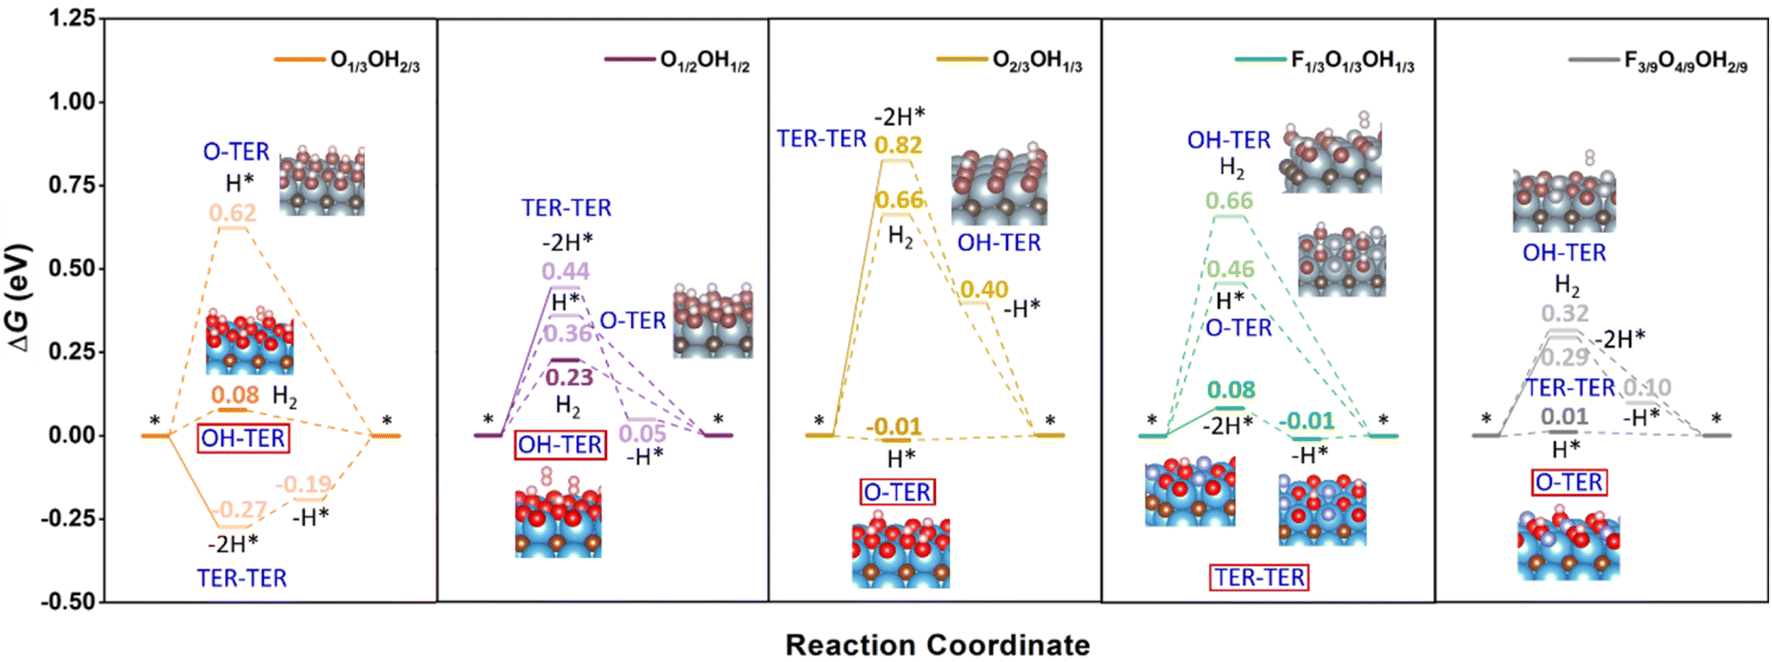 | ||
| Fig. 5 Gibbs free energy, ΔG, diagram of the HER on selected binary and ternary terminations of the Ti3C2 (0001) surface combining –O, –OH, and –F moieties, under standard working conditions. Solid lines represent the chemical step of the as-generated H2 desorption, while dashed lines represent the electrochemical PCET steps. Color coding as in Fig. 4. | ||
Keeping this in mind, the O1/2OH1/2 model shows a TER–TER profile where H(g)2 formation is moderately costly, by ΔG = 0.44 eV, followed by two consecutive H+ reductions with ΔG values of −0.39 and −0.05 eV, respectively. Actually, the first chemical step in this mechanism is unavoidably endergonic, and cannot be reduced by a potential application, which could otherwise lower the electrochemical steps just by applying a U of −0.05 V. This does not happen in either the OH- or the O-TER mechanism. In the latter, the first Volmer step has a positive ΔG of 0.36 eV, higher than that of the Heyrovsky step of OH-TER of ΔG 0.23 eV. Thus, the OH-TER path could make the full process exergonic by applying a U of −0.23 V, close to the O1/2OH1/2 stability region on the F-free Pourbaix diagram in Fig. 3.
The results discussed just above involve a model with equal number of –OH and –O groups; by unbalancing this ratio by having more –O groups, like in the O2/3OH1/3 model, see Fig. 5, the TER–TER mechanism gets more endergonic in the first Tafel step, with a ΔG of 0.82 eV, and even the first replenishment H+ reduction Volmer step, with ΔG of −0.42 eV, is located 0.40 eV above the equilibrium ΔG = 0 eV line, and so a U of −0.42 V would be needed to make the full process exergonic. The same situation is found in the OH-TER mechanism, where the first Heyrovsky step involves a ΔG up to 0.66 eV. Thus, compared to the O1/2OH1/2 model, the Tafel step increases in free energy by 0.38 eV and the OH-TER Heyrovsky step by a similar 0.43 eV. On the other hand, compared to the U of −0.23 V in the O1/2OH1/2 model, the O-TER step has a first Volmer step of solely −0.01 eV, implying the need of a U only slightly more negative than −0.01 V to make the full process exergonic. Clearly, the imbalance towards increasing the number of –O moieties favours the O-TER mechanism, while it is a handicap to the other mechanisms involving –OH moieties, namely, the OH-TER and TER–TER, plus the resulting overpotential falls well within the stability region of the O2/3OH1/3 model, quite in the HER equilibrium line, see Fig. 3.
Compared to the O1/2OH1/2 model, when the –O/–OH ratio imbalance is applied in the other direction, that is, when having more –OH moieties than –the O ones, as in the O1/3OH2/3 model, the O-TER is destabilized, with a first Volmer step rising up 0.26 eV up to a value of 0.62 eV. On the other hand, the OH-TER path gets its Heyrovsky step stabilized by 0.15 eV to a final value of ΔG = 0.08 eV. Finally, the TER–TER path changes from being quite endergonic in the recombination chemical step of 0.44 eV in the O1/2OH1/2 model, to sensibly exergonic by −0.27 eV in the OH-rich O1/3OH2/3 model. In the last situation, the OH-TER path is preferred, with a potential determining step of U = −0.08 V, while on the TER–TER path, a U of −0.19 V for the second PCET is required to make the full process exergonic. Particularly, the overpotential of the last mechanism falls within the O1/3OH2/3 stability line as shown in the Pourbaix diagram of Fig. 3.
Up to this point, we tackled F-free models only, but the question regarding the effect of –F moieties on the HER performance remains open. Let us first address the F1/3O1/3OH1/3 model which is the most stable one at low pH and low U with respect to the RHE (cf.Fig. 3). Here one can compare with the O2/3OH1/3 reference, where half of the –O moieties are replaced by –F groups. Consequently, the observed stabilization of the O-TER path under the O-rich conditions in the O2/3OH1/3 model is decimated and, consequently, the H* intermediate after a Volmer step involves a ΔG increase of 0.47 eV up to a final value of 0.46 eV. A similar effect is observed on the OH-TER and TER–TER paths when compared to the OH-rich O1/3OH2/3 reference. The stabilization of such paths involving –OH groups is now hampered, making it rise the Heyrovsky step of OH-TER by 0.58 eV up to a final value of 0.66 eV. However, this is not so adverse for the TER–TER path, which was slightly exergonic. In the F1/3O1/3OH1/3 model, the chemical H* recombination step is barely endergonic by 0.08 eV, and the potential determining step is the second recovering Volmer step requiring only a U of −0.01 V, ideally fitting in the model stability region shown by the Pourbaix diagram (cf.Fig. 3), and essentially matching the HER equilibrium potential vs. RHE. Here the –F surface moiety has no longer been considered as the active site given the very high overpotential found in the fully –F terminated model of 2.62 V compared to the values of 0.40 and 0.48 V for fully –O and –OH models. Besides, charge density difference (CDD) plots in Fig. S11 of the ESI† reveal a lower electron accumulation on –F moieties compared to –O and –OH groups, implying that the former is less attractive towards H+ reactants.
Further support to the –O termination role favouring the O-TER path is provided by the F3/9O4/9OH2/9 model, where a –OH moiety is substituted by an –O one. From the previous reasoning, it should stabilize O-TER, and that is indeed what happens. In going from the F1/3O1/3OH1/3 to the F3/9O4/9OH2/9 model, O-TER gets stabilized by 0.45 eV to a final ΔG value of the Volmer step of solely 0.01 eV. On the other hand, the TER–TER path is no longer the preferred patch, since the Tafel step is more endergonic, by 0.21 eV up to a value of 0.29 eV, and the subsequent first Volmer step is 0.10 eV above the HER equilibrium, requiring a U of −0.10 V to make the full electrochemical steps exergonic. With respect to the OH-TER path, it still gets disfavoured, with an initial Heyrovsky step of 0.32 eV. In any case, the F-containing models are those that adjust best their U with the HER working conditions.
Having analysed the influence of mixed terminations on several HER mechanisms, one may wonder whether the standard Volmer–Tafel path could be competitive on such models. Fig. 6 shows that, for the fully O-terminated case, the binary and ternary models would require working at excessively low U overpotentials. The standard Volmer–Tafel path has not been considered for pristine Ti3C2 since it is excessively active, vide supra, whereas the fully F-terminated case has also been disregarded since it is excessively inactive (cf.Fig. 4). Also, the fully OH-terminated case has not been investigated because there is simply no room for Volmer steps and this is also the situation for the fully H-terminated case. Inspecting the profiles in Fig. 6, one realizes that PCET steps are exergonic in the fully O-terminated case, because of the strong affinity towards H. Note that this termination would be only stable at high U values, see Fig. 3. As per the binary and ternary cases, the Volmer steps are quite endergonic for O1/3OH2/3, O1/2OH1/2, and F1/3O1/3OH1/3, with potential determining steps with U values of −0.74, −0.74, and −0.58 V, respectively. The F3/9O4/9OH2/9 model is not so endergonic, but with a sensible U value of −0.46 V. Indeed, the only viable Volmer–Tafel mechanism is found in the case of O2/3OH1/3, with very low ΔGH values for the two consecutive Volmer steps, and a U value of solely −0.09 V, competitive to the value of −0.01 V for the same model following the O-TER Volmer–Heyrovsky mechanism, but not preferred to this last one, though. Thus, except perhaps for the last commented possible competitive pathway, the standard Volmer–Tafel mechanism is not preferred in any of the explored models, but other sequencing of the mechanisms, like the TER–TER, are actually favourable in some models as already commented.
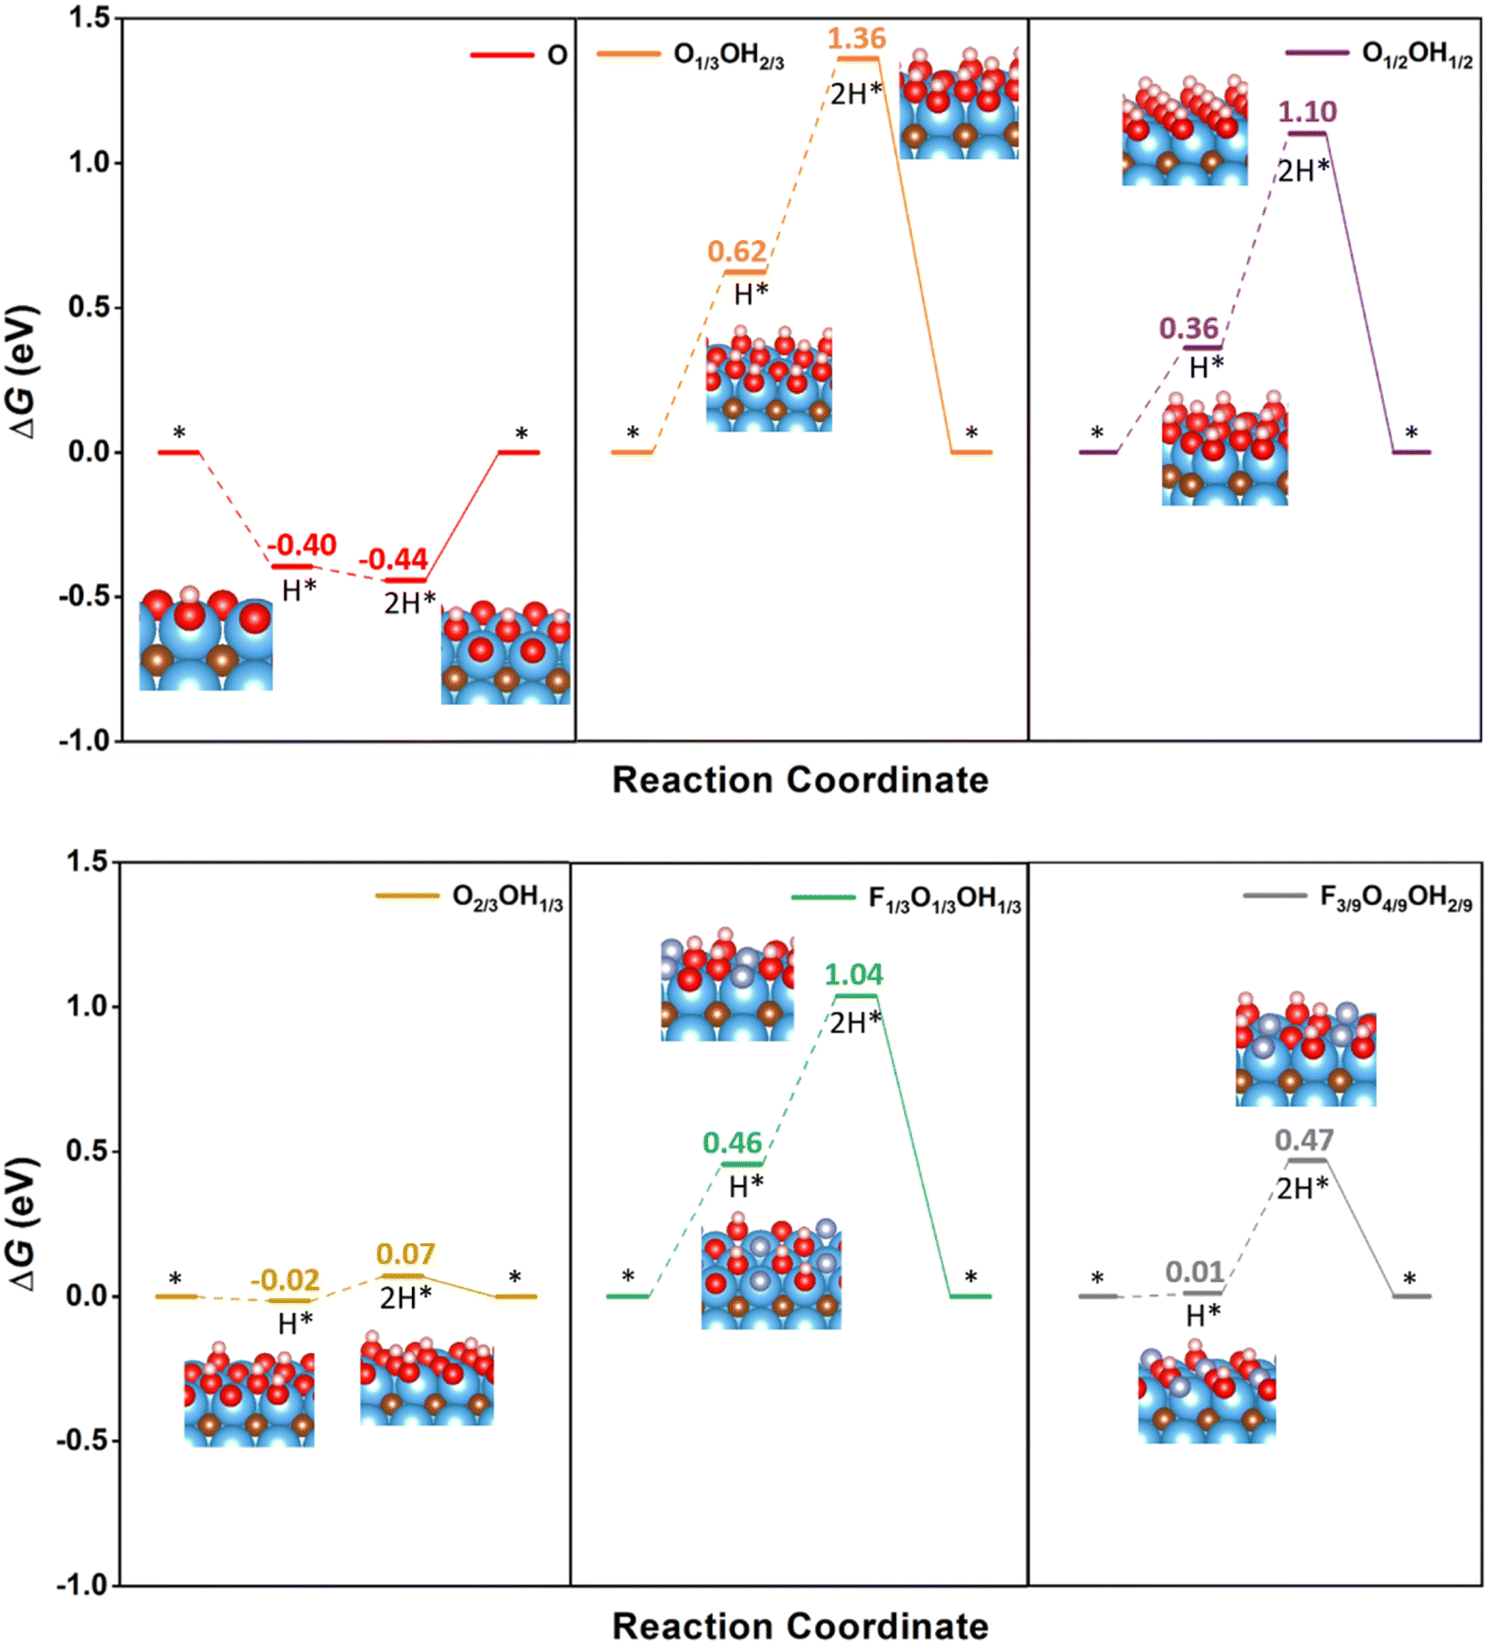 | ||
| Fig. 6 Gibbs free energy, ΔG, diagram of the HER on selected binary and ternary terminations of the Ti3C2 (0001) surface combining –O, –OH, and –F moieties, under standard working conditions, following the standard Volmer–Tafel mechanism sequence. Solid lines represent the chemical step of the as-generated H2 desorption, while dashed lines represent the electrochemical PCET steps. Color coding as in Fig. 4. | ||
3.3. HER electrocatalysis performance
All in all, an optimal HER catalyst should have a very small ΔGH, ideally going to 0, implying no overpotential. This is because an excessively low ΔGH makes it difficult for H* adatoms to combine and form H2, while excessively positive ΔGH leads to slow HER kinetics.76 In general, it is well accepted that a good HER activity would follow the classical rule of |ΔGH| < 0.2 eV,77 adopted as well in discussing the present calculations. On the other hand, F-free models can also display very low U values, ranging from −0.01 to −0.23 V, while these overpotentials are either within or close to those where the stability regions of the considered models lie, meaning that these can be regarded as valid, in particular when accounting for the DFT inherent accuracy, vide supra.Thus, having –F groups on the surface is not necessarily detrimental, and indeed helps understanding previous experimental observations,73 in the sense that large –F coverages, approaching the full –F situation, make HER unpracticable. However, according to the present study, low coverages of –F moieties, like F1/3, can further improve the HER process by reducing the |ΔGH| constraint beyond that encountered in the F-free situations. This is probably due to subtle lateral interactions, and also helping to avoid having patches of only –O termination, which became excessively active towards H leading to a passivated surface. Aside from this, the observed increase of concentration of –O moieties is beneficial for the HER,73 but up to a certain degree, e.g. O2/3, since a fully O-terminated situation is too active towards hydrogen, plus actually not stable under working conditions according to the Pourbaix diagrams in Fig. 3.
With the previous reaction profiles, one can get estimates of the theoretical overpotential, η = URHE − U, at which the HER could be carried out. These are encompassed in Tables 1 and S1 of the ESI† for the most likely reaction mechanism, and the values represented in Fig. 7 on a typical volcano plot,78 where the abscissa represents the ΔGH descriptor while the ordinate represents the overpotential. Notice that values on the left and right branches of the volcano plot represent strong and weak H* adsorptions, respectively. In any case, one can readily observe that any Ti3C2 MXene with mixed termination groups feature better HER activity than those fully terminated, and that, in particular, F-free O-rich situations such as the one in the O2/3OH1/3 model, and F-containing situations as in the F1/3O1/3OH1/3 and F3/9O4/9OH2/9 models appear to be optimal for the HER, the latter being stable under the working conditions of applied potential, see Pourbaix diagrams in Fig. 3.
| Model | Mechanism | Subtype | ΔGH/eV | η/V |
|---|---|---|---|---|
| Pristine Ti3C2 | — | — | −1.32 | — |
| O | VH | — | −0.40 | 0.40 |
| H | VH | — | 0.63 | 0.63 |
| OH | VH | — | −0.48 | 0.48 |
| F | VH | — | 2.62 | 2.62 |
| O1/3OH2/3 | VH | OH-TER | 0.08 | 0.08 |
| O1/2OH1/2 | VH | OH-TER | 0.23 | 0.23 |
| O2/3OH1/3 | VH | O-TER | −0.01 | 0.01 |
| F1/3O1/3OH1/3 | VT | TER–TER | −0.01 | 0.01 |
| F3/9O4/9OH2/9 | VH | O-TER | 0.01 | 0.01 |
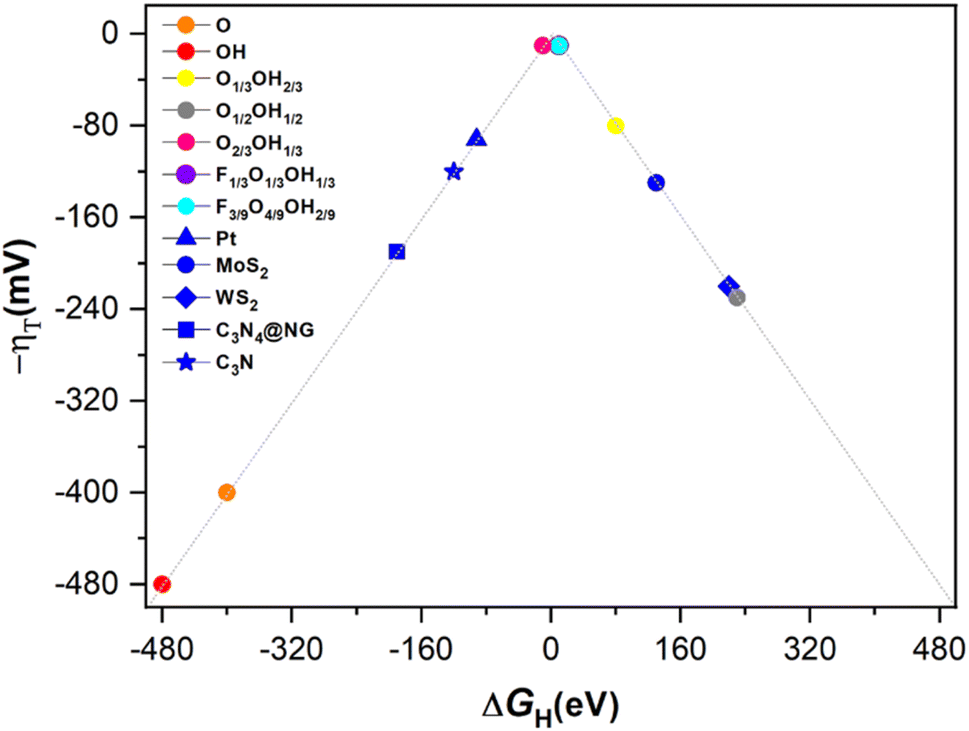 | ||
| Fig. 7 Volcano plot of −η vs. ΔGH on the different terminated Ti3C2 surface models, including fully O- and OH-terminated cases, as well as binary situations represented by the O1/3OH2/3, O1/2OH1/2, and O2/3OH1/3 models, and ternary ones as in the F1/3O1/3OH1/3 and F3/9O4/9OH2/9 models. In addition, reference values for Pt, MoS2, WS2, C3N4@NG, and C3N are included for comparison. | ||
According to the previous discussion, some of the Ti3C2 terminated MXenes could be competitive or even better electrocatalysts for the HER when compared to other materials reported in the literature, estimated, e.g., with similar DFT exchange–correlations and coverages, including Pt,79 MoS2,80 WS2,81 graphitic carbonitride with N-doped graphene, i.e., C3N4@NG,82 and C3N material,83 to include just some of the most prominent ones. In particular, as stated above, situations corresponding to the O2/3OH1/3, F1/3O1/3OH1/3, and F3/9O4/9OH2/9 models appear to be the optimal cases, even if accounting for DFT inherent accuracy. Thus, proper surface terminated Ti3C2 MXenes emerge as a promising material for the HER, especially when accounting for their high surface area, abundance and lightness of the constituent elements, which fosters high performances per unit area or materials grams. Still, one should not consider these as definitive situations, but rather as indicative, since other stoichiometries and arrangements surely exist which are not regarded in the present study when constructing the Pourbaix diagrams, and also regarding the inherent accuracy of DFT. But, clearly, O-rich binary terminations admixing –O and –OH groups can be claimed as responsible for a good HER activity at low pH and F-free conditions, while ternary systems mixing –F, –O, and –OH groups are responsible for the same performance in F-containing situations.
Last but not least, one could attempt at understanding the main trends favoring the predicted HER mechanism. This is tackled here by calculating the Bader charges of the termination groups, as shown in Fig. 8. Let us consider first binary situations with different ratios of –O and –OH surface groups. As observed in Fig. 8, the negative net charge of –O groups increases with the –O ratio, and would reach a limit of −1.09e for a fully O-terminated model. Inversely, the negative net charge of –OH groups decreases when the O concentration increases (or the OH one decreases), from an ideal value of −0.73e for the fully OH-terminated case. Thus, the larger the net negative charge on –O moieties, the stronger the H+ attraction and, consequently, the more stable the H* becomes. However, a suitable value of −0.01 eV is found for O2/3OH1/3, since fully O-terminated Ti3C2 attaches the H adatoms too strongly, with a ΔGH of −0.40 eV, which is detrimental for the HER process.
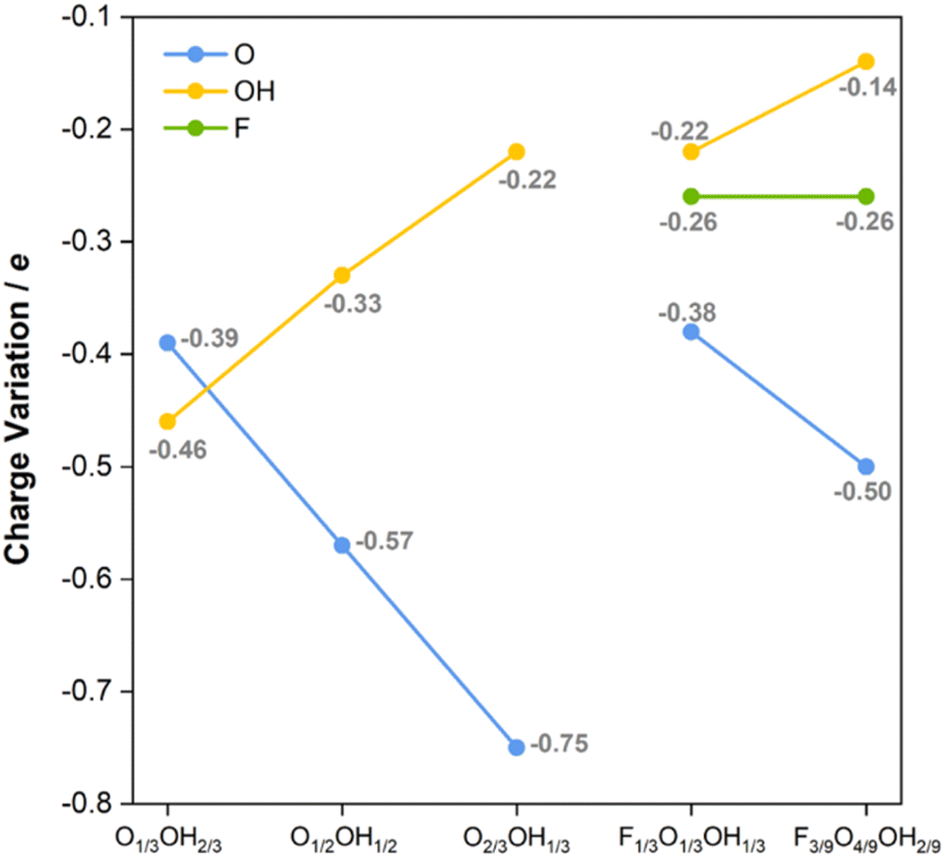 | ||
| Fig. 8 Bader charges, in e, of –F, –O, and –OH groups on the diverse binary (admixing –O and –OH moieties) and ternary (admixing –F, –O, and –OH moieties). | ||
The observed trends in net charges of –OH and –O groups are maintained when having –F groups at the surface. For instance, the Bader charges of –O and –OH groups in the F1/3O1/3OH1/3 model are −0.38 and −0.22e, respectively, similar to those found for the same ratios of −0.39 and −0.22e on O1/3OH2/3 and O2/3OH1/3 models, respectively. Moreover, the net charge at –O of −0.57e in O1/2OH1/2 is similar and follows the observed trend when compared to the F3/9O4/9OH2/9 of −0.50e, and actually the –OH charge of −0.14e follows the trend when decreasing the OH ratio. Finally, the –F net charge is maintained constant at −0.26e for both F1/3O1/3OH1/3 and F3/9O4/9OH2/9, thus irrespective of the –O/–OH ratio. Thus, charges on a moiety are largely independent of the presence of other moieties, in line with the information obtained from CDD plots in Fig. S11 of the ESI,† and solely affected by their surface concentration. Keeping this in mind, but also regarding the trend of ΔGH with respect to the –O charge, one may wonder which is the origin of the small overpotentials on the F-containing models, when the charge on –O decreases. The answer seems to be related, on one hand, to the negative charge on –F groups, and, on the other hand, to the larger electronic affinity of –F. The resulting net generates a stronger attractive electric field towards the H+ reactant, which may favor the adsorption, but in a more moderate fashion. This agrees with previous experimental results,84,85 stating that the higher the featured –F coverage, the lower the HER activity on Ti3C2Tx, whereas compared to –O terminations, lower –F coverage promotes the H+ adsorption and decreases the Gibbs free energy change of the HER.
4. Conclusions
In the present work we studied the potential HER performance of Ti3C2 MXene and, in particular, the effect of terminations by considering fully –O, –OH, –F, and –H terminations, as well as a pristine surface, but also mixed terminations, either binary or ternary, considering as well different ratios of surface moieties. To assess the most likely terminations under HER conditions of low pH and U, Pourbaix diagrams were built after examining the stability of ca. 450 different surface terminations, with variances in composition, species ratios, and topologically different arrangements. The cases with –F terminations were treated separately since there are synthetic procedures that do not use this element as the etchant. On top of that, different Volmer–Tafel and Volmer–Heyrovsky HER mechanisms were investigated on the obtained surface models, considering the initial or later involvement of surface H atoms from –H or –OH groups.The reported results highlight that, at variance with a number of previous studies, fully –O, –OH, and –H terminations are possible, but only at very positive (–O) or negative (–OH and –H) potentials with respect to the RHE reference. Interestingly, close to the HER equilibrium conditions, binary models admixing –O and –OH moieties are predicted to be preferred for F-free situations, while ternary models also containing –F are relevant in F-containing samples. In particular, based on the O2/3OH1/3 and F3/9O4/9OH2/9 models using –O moieties as the active center the Volmer–Heyrovsky mechanism is found to be optimal with almost negligible overpotential. For a lower –F content, as in the F1/3O1/3OH1/3 model, a Volmer–Tafel like mechanism, where a Tafel step is initially carried out involving surface –OH groups, followed by two Volmer steps to regenerate the electrocatalysts as-generated –O centers, is also found to be optimal featuring an almost inexistent overpotential of 0.01 V. These two situations appear to be quite competitive when compared to other electrocatalysts used for the HER in the literature, such as Pt, MoS2, or WS2.
The analysis of electronic structure and charge density reveals that larger the concentration of –O moieties on the Ti3C2 surface, the more negatively charged they become with a concomitant stronger ability for H+ reduction, reaching moderate bond strengths when the –O coverage is ⅔. The presence of –F groups is not detrimental per se, and actually, their negative charge and the stronger electric field they generate contribute to favoring the H+ reduction with moderate adsorption strength even when having a lower –O coverage of ca. ⅓, as in the F3/9O4/9OH2/9 and F1/3O1/3OH1/3 models, which explains and reconciles previous experimental reports pointing out to better performances when having a higher presence of –O groups, and a lower presence of –F ones.73 Finally, the present study underscores the tunability of these surface terminations to maximize the HER performance, while addressing their stability under working conditions of pH and U.
Conflicts of interest
There are no conflicts of interest to declare.Acknowledgements
The research carried out at the Universitat de Barcelona has been supported by the Spanish MCIN/AEI/10.13039/501100011033 PID2021-126076NB-I00 project, funded partially by FEDER Una manera de hacer Europa, and María de Maeztu CEX2021-001202-M grants, including funding from the European Union and, in part, by COST Action CA18234. A significant part of the computational resources has been provided by the Red Española de Supercomputación (RES) QHS-2022-1-0004 and QHS-2021-3-0012. L. M. thanks the HPC-EUROPA3 (HPC17OOIBY) project supported by the EC Research Innovation Action under the H2020 Programme. L. M. thanks the China Scholarship Council (CSC) for financing her PhD (CSC202108390032).References
- M. Dresselhaus and I. Thomas, Nature, 2001, 414, 332–337 CrossRef CAS PubMed.
- J. A. Turner, Science, 2004, 305, 972–974 CrossRef CAS PubMed.
- S. Chu and A. Majumdar, Nature, 2012, 488, 294–303 CrossRef CAS PubMed.
- S. E. Hosseini and M. A. Wahid, Renewable Sustainable Energy Rev., 2016, 57, 850–866 CrossRef CAS.
- J. Greeley, T. F. Jaramillo, J. Bonde, I. Chorkendorff and J. K. Nørskov, Nat. Mater., 2006, 5, 909–913 CrossRef CAS PubMed.
- X. X. Zou and Y. Zhang, Chem. Soc. Rev., 2015, 44, 5148–5180 RSC.
- J. N. Hansen, H. Prats, K. K. Toudahl, N. M. Secher, K. Chan, J. Kibsgaard and I. Chorkendorff, ACS Energy Lett., 2021, 6, 1175–1180 CrossRef CAS PubMed.
- D. E. Brown, M. N. Mahmood, M. C. M. Man and A. K. Turner, Electrochim. Acta, 1984, 29, 1551–1556 CrossRef CAS.
- I. A. Raj and K. I. Vasu, J. Appl. Electrochem., 1990, 20, 32–38 CrossRef CAS.
- M. A. Lukowski, A. S. Daniel, F. Meng, A. Forticaux, L. Li and S. Jin, J. Am. Chem. Soc., 2013, 135, 10274–10277 CrossRef CAS PubMed.
- T. F. Jaramillo, K. P. Jørgensen, J. Bonde, J. H. Nielsen, S. Horch and I. Chorkendorff, Science, 2007, 317, 100–102 CrossRef CAS PubMed.
- G. Gao, Y. Jiao, F. Ma, Y. Jiao, E. Waclawik and A. Du, J. Phys. Chem. C, 2015, 119, 13124–13128 CrossRef CAS.
- J. Kibsgaard, C. Tsai, K. Chan, J. D. Benck, J. K. Nørskov, F. Abild-Pedersen and T. F. Jaramillo, Energy Environ. Sci., 2015, 8, 3022–3029 RSC.
- Y. Zheng, Y. Jiao, J. Chen, J. Liu, J. Liang, A. Du, W. Zhang, Z. Zhu, S. C. Smith, M. Jaroniec, G. Q. Lu and S. Z. Qiao, J. Am. Chem. Soc., 2011, 133, 20116–20119 CrossRef CAS PubMed.
- G. Gao, Y. Jiao, F. Ma, Y. Jiao, E. Waclawik and A. Du, J. Catal., 2015, 332, 149–155 CrossRef CAS.
- G. Gao, Y. Jiao, F. Ma, Y. Jiao, E. Waclawik and A. Du, Phys. Chem. Chem. Phys., 2015, 17, 31140–31144 RSC.
- H. Fei, J. Dong, M. J. Arellano-Jiménez, G. Ye, N. Dong Kim, E. L. G. Samuel, Z. Peng, Z. Zhu, F. Qin, J. Bao, M. J. Yacaman, P. M. Ajayan, D. Chen and J. Tour, Nat. Commun., 2015, 6, 8668 CrossRef CAS.
- G. P. Gao, A. P. O'Mullane and A. J. Du, ACS Catal., 2017, 7, 494–500 CrossRef CAS.
- B. Anasori, M. R. Lukatskaya and Y. Gogotsi, Nat. Rev. Mater., 2017, 2, 16098 CrossRef CAS.
- M. Naguib, M. Kurtoglu, V. Presser, J. Lu, J. Niu, M. Heon, L. Hultman, Y. Gogotsi and M. W. Barsoum, Adv. Mater., 2011, 23, 4248–4253 CrossRef CAS PubMed.
- M. Ghidiu, M. R. Lukatskaya, M. Q. Zhao, Y. Gogotsi and M. W. Barsoum, Nature, 2014, 516, 78–81 CrossRef CAS PubMed.
- X. Yu, X. Cai, H. Cui, S. W. Lee, X. F. Yu and B. Liu, Nanoscale, 2017, 9, 17859–17864 RSC.
- V. Kamysbayev, A. S. Filatov, H. Hu, X. Rui, F. Lagunas, D. Wang, R. Klie and D. V. Talapin, Science, 2020, 369, 979–983 CrossRef CAS PubMed.
- I. Persson, J. Halim, H. Lind, T. W. Hansen, J. B. Wagner, L.-Å. Näslund, V. Darakchieva, J. Palisaitis, J. Rosen and P. O. Å. Persson, Adv. Mater., 2019, 31, 1805472 CrossRef PubMed.
- X. Sang, Y. Xie, M.-W. Lin, M. Alhabeb, K. L. Van Aken, Y. Gogotsi, P. R. C. Kent, K. Xiao and R. R. Unocic, ACS Nano, 2016, 10, 9193–9200 CrossRef CAS.
- J. Xie, X. Yang and Y. Xie, Nanoscale, 2020, 12, 4283–4294 RSC.
- R. He, Y. Wan, P. Zhao, P. Guo, Z. Jiang and J. Zheng, Comput. Theor. Chem., 2019, 1150, 26–39 CrossRef CAS.
- J. Peng, X. Chen, W. J. Ong, X. Zhao and N. Li, Chem, 2019, 5, 18–50 CAS.
- J. Ran, G. Gao, F. T. Li, T. Y. Ma, A. Du and S. Z. Qiao, Nat. Commun., 2017, 8, 13907 CrossRef CAS PubMed.
- C. Ling, L. Shi, Y. Ouyang and J. Wang, Chem. Mater., 2016, 28, 9026–9032 CrossRef CAS.
- Z. W. Seh, K. D. Fredrickson, B. Anasori, J. Kibsgaard, A. L. Strickler, M. R. Lukatskaya, Y. Gogotsi, T. F. Jaramillo and A. Vojvodic, ACS Energy Lett., 2016, 1, 589–594 CrossRef CAS.
- H. Pan, Sci. Rep., 2016, 6, 32531 CrossRef CAS PubMed.
- J. Xie, J. Qi, F. Lei and Y. Xie, Chem. Commun., 2020, 56, 11910–11930 RSC.
- J. Xie and Y. Xie, ChemCatChem, 2015, 7, 2568–2580 CrossRef CAS.
- M. A. Hope, A. C. Forse, K. J. Griffith, M. R. Lukatskaya, M. Ghidiu, Y. Gogotsi and C. P. Grey, Phys. Chem. Chem. Phys., 2016, 18, 5099–5102 RSC.
- R. Ibragimova, M. J. Puska and H.-P. Komsa, ACS Nano, 2019, 13, 9171–9181 CrossRef CAS PubMed.
- M. López, Á. Morales-García, F. Viñes and F. Illas, ACS Catal., 2021, 11, 12850–12857 CrossRef.
- J. D. Gouveia, Á. Morales-García, F. Viñes, F. Illas and J. R. B. Gomes, Appl. Catal., B, 2020, 260, 118191 CrossRef CAS.
- J. Durst, A. Siebel, C. Simon, F. Hasché, J. Herranz and H. A. Gasteiger, Energy Environ. Sci., 2014, 7, 2255–2260 RSC.
- P. J. Rheinländer, J. Herranz, J. Durst and H. A. Gasteiger, J. Electrochem. Soc., 2014, 161, F1448 CrossRef.
- S. Li, P. Tuo, J. Xie, X. Zhang, J. Xu, J. Bao, B. Pan and Y. Xie, Nano Energy, 2018, 47, 512–518 CrossRef CAS.
- C. Liu, H. Wu, X. Wang, J. Fan, H. Su, D. Yang, Y. Wei, F. Du, Y. Dall'Agnese and Y. Gao, Energy Storage Mater., 2023, 54, 164–171 CrossRef.
- H. Xu, J. Fan, H. Su, C. Liu, G. Chen, Y. Dall'Agnese and Y. Gao, Nano Lett., 2023, 23, 283–290 CrossRef CAS PubMed.
- S. Ma, X. L. Fan, Y. R. An, D. X. Yang, Z. F. Luo, Y. Hu and N. J. Guo, J. Mater. Sci., 2019, 54, 11378–11389 CrossRef CAS.
- H. C. Yang, Y. D. Ma, X. S. Lv, B. B. Huang and Y. Dai, J. Catal., 2020, 387, 12–16 CrossRef CAS.
- N. Li, Z. L. Zeng, Y. W. Zhang, X. Z. Chen, Z. Z. Kong, Arramel, Y. Li, P. Zhang and B. S. Nguyen, ACS Omega, 2021, 6, 23676–23682 CrossRef CAS PubMed.
- G. Kresse and J. Furthmüller, Phys. Rev. B: Condens. Matter Mater. Phys., 1996, 54, 11169 CrossRef CAS PubMed.
- G. Kresse and D. Joubert, Phys. Rev. B: Condens. Matter Mater. Phys., 1999, 59, 1758 CrossRef CAS.
- J. P. Perdew, K. Burke and M. Ernzerhof, Phys. Rev. Lett., 1996, 77, 3865 CrossRef CAS PubMed.
- H. J. Monkhorst and J. D. Pack, Phys. Rev. B: Solid State, 1976, 13, 5188 CrossRef.
- S. Grimme, J. Antony, S. Ehrlich and H. Krieg, J. Chem. Phys., 2010, 132, 154104 CrossRef PubMed.
- R. Morales-Salvador, J. D. Gouveia, Á. Morales-García, F. Viñes, J. R. B. Gomes and F. Illas, ACS Catal., 2021, 11, 11248–11255 CrossRef CAS.
- B. E. Conway and B. V. Tilak, Electrochim. Acta, 2002, 47, 3571–3594 CrossRef CAS.
- X. Huang, J. Wang, H. B. Tao, H. Tian, Z. Zhang and H. Xu, J. Catal., 2020, 389, 461–467 CrossRef CAS.
- J. N. Brønsted, Chem. Rev., 1928, 5, 231–338 CrossRef.
- M. G. Evans and M. Polanyi, Trans. Faraday Soc., 1938, 34, 11–24 RSC.
- K. S. Exner, J. Anton, T. Jacob and H. Over, Angew. Chem., Int. Ed., 2016, 55, 7501–7504 CrossRef CAS PubMed.
- K. S. Exner and H. Over, Acc. Chem. Res., 2017, 50, 1240–1247 CrossRef CAS PubMed.
- J. K. Nørskov, J. Rossmeisl, A. Logadottir, L. Lindqvist, J. R. Kitchin, T. Bligaard and H. Jónsson, J. Phys. Chem. B, 2004, 108, 17886–17892 CrossRef.
- NIST Standard Reference Database, SRD Number 69, 1901, DOI:10.18434/T4D303.
- Q. Li, Y. Ouyang, S. Lu, X. Bai, Y. Zhang, L. Shi, C. Ling and J. Wang, Chem. Commun., 2020, 56, 9937–9949 RSC.
- M. Pourbaix, Atlas of Electrochemical Equilibria in Aqueous Solutions, National Association of Corrosion Engineers (NACE), Houston, Texas, USA, 1974 Search PubMed.
- M. López, K. S. Exner, F. Viñes and F. Illas, Adv. Theory Simul., 2022, 2200217 CrossRef.
- D. F. Sriver and P. W. Atkins, Inorganic Chemistry, Freeman, W.H. and Company, New York, 5th edn, 2009 Search PubMed.
- D. R. Lide, CRC Handbook of Chemistry and Physics, CRC Press, Boca Raton, Florida, 102nd edn, 2004 Search PubMed.
- H. A. Hansen, I. C. Man, F. Studt, F. Abild-Pedersen, T. Bligaard and J. Rossmeisl, Phys. Chem. Chem. Phys., 2010, 12, 283–290 RSC.
- N. Xue, X. Li, L. Han, H. Zhu, X. Zhao, J. Zhuang, Z. Ga and X. Tao, J. Mater. Chem. A, 2022, 10, 7960–7967 RSC.
- S. Yang, P. Zhang, F. Wang, A. G. Ricciardulli, M. R. Lohe, P. W. M. Blom and X. Feng, Angew. Chem., Int. Ed., 2018, 19, 15717–15721 CrossRef.
- S.-Y. Pang, Y.-T. Wong, S. Yuan, Y. Liu, M.-K. Tsang, Z. Yang, H. Huang, W.-T. Wong and J. Hao, J. Am. Chem. Soc., 2019, 141, 9610–9616 CrossRef CAS PubMed.
- J. Gan, F. Li, Y. Tang and Q. Tang, ChemSusChem, 2020, 13, 6005–6015 CrossRef CAS PubMed.
- Y. Jiang, T. Sun, X. Xie, W. Jiang, J. Li, B. Tian and C. Su, ChemSusChem, 2019, 12, 1368–1373 CrossRef CAS PubMed.
- C. Ling, L. Shi, Y. Ouyang and J. Wang, Chem. Mater., 2016, 28, 9026–9032 CrossRef CAS.
- A. D. Handoko, H. T. Chen, Y. W. Lum, Q. F. Zhang, B. Anasori and Z. W. She, iScience, 2020, 23, 101181 CrossRef CAS PubMed.
- F. Viñes, C. Sousa, P. Liu, J. A. Rodriguez and F. Illas, J. Chem. Phys., 2005, 122, 174709 CrossRef PubMed.
- M. Khazaei, M. Arai, T. Sasaki, C. Y. Chung, N. S. Venkataramanan, M. Estili, Y. Sakka and Y. Kawazoe, Adv. Funct. Mater., 2013, 23, 2185–2192 CrossRef CAS.
- G. P. Gao, A. P. O'Mullane and A. J. Du, ACS Catal., 2017, 7, 494–500 CrossRef CAS.
- B. Huang, N. G. Zhou, X. Z. Chen, W. J. Ong and N. Li, Chem.–Eur. J., 2018, 24, 18479–18486 CrossRef CAS PubMed.
- N. Li, Z. L. Zeng, Y. W. Zhang, X. Z. Chen, Z. Z. Kong, Arramel, Y. Li, P. Zhang and B. S. Nguyen, ACS Omega, 2021, 6, 23676–23682 CrossRef CAS PubMed.
- J. K. Nørskov, T. Bligaard, A. Logadottir, J. Kitchin, J. G. Chen, S. Pandelov and U. Stimming, J. Electrochem. Soc., 2005, 152, J23–J26 CrossRef.
- L. Lin, N. Miao, Y. Wen, S. Zhang, P. Ghosez, Z. Sun and D. A. Allwood, ACS Nano, 2016, 10, 8929–8937 CrossRef CAS PubMed.
- J. Bonde, P. G. Moses, T. F. Jaramillo, J. K. Nørskov and I. Chorkendorff, Faraday Discuss., 2009, 140, 219–231 RSC.
- Y. Zheng, Y. Jiao, Y. Zhu, L. H. Li, Y. Han, Y. Chen, A. Du, M. Jaroniec and S. Z. Qiao, Nat. Commun., 2014, 5, 3783 CrossRef PubMed.
- S. Yao, X. Zhang, A. Chen, Z. Zhang, M. Jiao and Z. Zhou, J. Mater. Chem. A, 2019, 7, 19290–19296 RSC.
- A. D. Handoko, K. D. Fredrickson, B. Anasori, K. W. Convey, L. R. Johnson, Y. Gogotsi, A. Vojvodic and Z. W. Seh, ACS Appl. Energy Mater., 2018, 1, 173–180 CrossRef CAS.
- Y. Zhang, L. Chen, Y. Gui and L. Liu, Appl. Surf. Sci., 2022, 592, 153334 CrossRef CAS.
Footnote |
| † Electronic supplementary information (ESI) available. See DOI: https://doi.org/10.1039/d3ta00261f |
| This journal is © The Royal Society of Chemistry 2023 |