
Size-matching encapsulation of a high-nuclearity Ni-containing polyoxometalate into a light-responsive MOF for robust photogeneration of hydrogen†
Ruijie
Wang
,
Yeqin
Feng
,
Le
Jiao
,
Yuanyuan
Dong
 ,
Hui
Zhou
,
Tianfu
Liu
*,
Xuemeng
Jing
and
Hongjin
Lv
*
,
Hui
Zhou
,
Tianfu
Liu
*,
Xuemeng
Jing
and
Hongjin
Lv
*
MOE Key Laboratory of Cluster Science, School of Chemistry and Chemical Engineering, Beijing Institute of Technology, Beijing 102488, P. R. China. E-mail: hlv@bit.edu.cn; liutf@bit.edu.cn
First published on 7th February 2023
Abstract
The development of robust host–guest composite photocatalysts has been considered as an interesting research direction for efficient photo-driven hydrogen evolution. In this work, an interesting size-matching strategy was adopted to construct the Ni16As4P4@NU-1000 composite by encapsulating a high-nuclearity Ni-containing polyoxometalate, [{Ni4(OH)3AsO4}4(B-a-PW9O34)4]28− (Ni16As4P4), guest into a mesoporous Zr-based MOF (NU-1000) host. Under optimized conditions, the resulting Ni16As4P4@NU-1000 composite photocatalyst shows outstanding long-term photo-driven hydrogen evolution activity, achieving a hydrogen evolution of 1120 mmol g−1 and a TON of 28![[thin space (1/6-em)]](https://www.rsc.org/images/entities/char_2009.gif) 600 after 120-hour Xe-lamp irradiation. The photocatalytic activity remains essentially unchanged for at least four successive recycling tests. Mechanistic insights revealed that the excellent and robust photocatalytic activity of the Ni16As4P4@NU-1000 composite could be attributed to the synergistic cooperation of good light-responsive ability of the NU-1000 host, reversible multi-electron-catalytic properties of the structurally intact Ni16As4P4 cluster, and the suitable host–guest size-matching effect.
600 after 120-hour Xe-lamp irradiation. The photocatalytic activity remains essentially unchanged for at least four successive recycling tests. Mechanistic insights revealed that the excellent and robust photocatalytic activity of the Ni16As4P4@NU-1000 composite could be attributed to the synergistic cooperation of good light-responsive ability of the NU-1000 host, reversible multi-electron-catalytic properties of the structurally intact Ni16As4P4 cluster, and the suitable host–guest size-matching effect.
Introduction
Green hydrogen fuel has been considered as one of the most promising chemical energy carriers due to its high energy density, free of greenhouse gas and volatile organic compound (VOC) emission, etc. Solar-driven hydrogen production has been widely considered as a promising approach in transforming and storing intermittent solar energy into chemical bonds (H2 gas).1–4 Polyoxometalates (POMs), a class of structurally well-defined inorganic metal oxygen clusters, have been widely utilized in solar-driven water splitting for hydrogen generation, due to their structural diversity and tunability, multi-electron-transfer properties, reversible redox chemistry, good structural stability, and thermal stability.5–8 However, the high solubility of POMs in reported homogeneous or pseudo-homogeneous systems leads to the difficulty of recyclability during the catalytic processes.9 To address these issues, a number of efficient and robust POM-based composite materials have therefore been developed,10–16 which integrated POM catalytic active units and the support materials (such as TiO2,17 zeolite,18 silica,19 activated carbon,20 metal–organic frameworks (MOFs),21–24 macro/supramolecules,25etc.) to construct heterogeneous hybrids. Among these different types of support materials, MOFs, composed of metal nodes and multi-topology organic linkers,26 have been regarded as very attractive supports to incorporate functional units/catalysts due to their good photosensitivity, rich porous properties, and tunable host–guest interaction.21–23,27–31To date, there are a few representative reports on POM@MOF composites used in photocatalytic hydrogen production systems.32–38 For instance, Lin's group reported the one-pot synthesis of POM@MOF composites by integrating the photosensitizing [Ru(bpy)3]2+-derived dicarboxylate ligands, Zr6(μ3-O)4(μ3-OH)4 secondary building units, and Wells–Dawson-type POMs. The resulting POM@MOF composites exhibited enhanced multielectron injection from the photoactive framework to the encapsulated redox-active POMs upon photoexcitation, leading to efficient visible-light-driven hydrogen production.33 In addition, Zhang and co-workers constructed a series of Wells–Dawson-type POM@PSs@MOF composite materials (POMs = P2W15V3, P2W17Ni, and P2W17Co; PS = [Ru(bpy)3]2+) via a charge-regulated sequential adsorption method, which exhibited higher heterogeneous photocatalytic activity than that of the corresponding homogeneous catalytic system.35 To address the challenge of using noble metal photosensitive units ([Ru(bpy)3]2+, [Ir(ppy)2(bpy)]+) in these POM@MOF composites, we have recently reported two noble-metal-free POM@MOF composites, Ni3PW10@NU-1000 and Ni3P2W16@NU-1000, by incorporating a tri-Ni-substituted Keggin-type K6Na[Ni3(H2O)3PW10O39H2O] (Ni3PW10) and a Wells–Dawson-type Na4Li5[Ni3(OH)3(H2O)3P2W16O59] (Ni3P2W16) POMs into a mesoporous photo-responsive Zr-based metal–organic framework (NU-1000).37 Due to the better size match between the Ni3P2W16 POM guest and MOF, the Ni3P2W16@NU-1000 composite exhibited superior long-term stability and reusability in the solar-driven water splitting reaction compared to that of the Ni3PW10@NU-1000 composite. In this context, it would be of great interest to explore the appropriate size match between the POM guest clusters and the pores of the NU-1000 MOF host for more robust light-driven hydrogen generation.
In this work, we have constructed a Ni16As4P4@NU-1000 composite photocatalyst by integrating a high-nuclearity Ni-containing polyoxometalate, [{Ni4(OH)3AsO4}4(B-a-PW9O34)4]28− (Ni16As4P4), into a mesoporous Zr-based MOF (NU-1000) via a well-established impregnation method. The molecular size of the Ni16As4P4 (21.2 Å × 21.3 Å) guest cluster appropriately matches with the mesopores (31 Å × 31 Å) of the NU-1000 host. Under optimized conditions, the resulting Ni16As4P4@NU-1000 composite exhibited outstanding photocatalytic performance with a hydrogen evolution of 1120 mmol g−1 and turnover number (TON) of 28600 under Xe lamp illumination. Recycling photocatalytic tests and long-term illumination experiments indicated that the Ni16As4P4@NU-1000 composite showed superior long-term stability and reusability.
Results and discussion
The synthetic approaches for the Ni16As4P4 POM cluster and NU-1000 MOF are described in detail in the Experimental section, and different Ni16As4P4@NU-1000 composites were prepared using a well-established impregnation method.37Fig. 1 shows the scanning electron microscopy (SEM) and high-resolution transmission electron microscope (HR-TEM) images of NU-1000 only and the 0.1-Ni16As4P4@NU-1000 composite. The similar SEM images (Fig. 1a and b) illustrated that the encapsulation of the POM guest cluster had no effect on the morphology of the NU-1000 host. The corresponding energy dispersive X-ray spectroscopy (EDS) mapping images suggested the existence and the uniform distribution of Ni16As4P4 cluster in the NU-1000 host (Fig. 1). Compared to the HR-TEM image of NU-1000 (Fig. 1c), deep dark dots were clearly observed in the image of the 0.1-Ni16As4P4@NU-1000 composite (Fig. 1d), further indicating the successful incorporation of Ni16As4P4 clusters into the NU-1000 host. The powder X-ray diffraction (PXRD) patterns of Ni16As4P4, NU-1000, and 0.1-Ni16As4P4@NU-1000 are shown in Fig. S1.† It is noted that no characteristic diffraction peak of Ni16As4P4 was observed in the PXRD pattern of 0.1-Ni16As4P4@NU-1000, which could be attributed to the good dispersion of Ni16As4P4 guest clusters in the pores of the NU-1000 host. In addition, the slight decrease in the PXRD diffraction intensity of the 0.1-Ni16As4P4@NU-1000 composite indicated that the introduction of Ni16As4P4 guest clusters still can partially affect the crystallinity of NU-1000 during the solution-based impregnation process. In addition, we have also further characterized the physical properties of NU-1000 and the 0.1-Ni16As4P4@NU-1000 composite through Brunauer–Emmett–Teller (BET) measurement. The hysteresis loops observed in the low-temperature N2 adsorption–desorption isotherms of NU-1000 only and the 0.1-Ni16As4P4@NU-1000 composite (Fig. 2a) were basically associated with the typical microporous and mesoporous channels of the NU-1000 host (Fig. 2b). The calculated specific surface area of NU-1000 and 0.1-Ni16As4P4@NU-1000 were 2063 and 873 m2 g−1, respectively. The significantly decreased specific surface area provided solid evidence that Ni16As4P4 clusters have been successfully embedded into the NU-1000 host, which was further supported by the changes in the low-temperature N2 adsorption–desorption isotherms and pore size distribution curves of NU-1000 and 0.1-Ni16As4P4@NU-1000 (Fig. 2). According to the pore texture of NU-1000 and the molecular size of the Ni16As4P4 cluster, it is speculated that the mesopores of the NU-1000 host should be mainly occupied by the Ni16As4P4 cluster (Scheme 1). However, the intensity of micropores in the pore distribution curves (Fig. 2b) also decreased a bit, which might be caused by the incomplete removal of solvent molecules or the occupation of the Ni16As4P4 cluster via a different orientation. It is also noted that the encapsulation of Ni16As4P4 cluster does not completely block the mesopores of the NU-1000 host, which should be attributed to a relatively low loading quantity of POM clusters. In addition, linear EDS analysis was further carried out to prove the existence of POM clusters in the pores of the NU-1000 host (Fig S2†). The counts of Zr element exhibited rich and consistent abundance along the scanning direction shown in Fig S2b.† In contrast, the counts of W and Ni elements displayed a volcano shape (Fig S2c and d),† indicating that Ni16As4P4 clusters were mainly incorporated into the specific channels of NU-1000 instead of simply on the surface of the NU-1000 host. And the lower counts of Ni and W elements were attributed to their relatively low loading quantity in the 0.1-Ni16As4P4@NU-1000 sample. | ||
| Fig. 1 SEM images of (a) NU-1000 only and the (b) 0.1-Ni16As4P4@NU-1000 composite, and HR-TEM images of (c) NU-1000 only and the (d) 0.1-Ni16As4P4@NU-1000 composite. | ||
 | ||
| Fig. 2 (a) Low-temperature N2 adsorption–desorption isotherms and (b) the pore size distribution curves of NU-1000 and 0.1-Ni16As4P4@NU-1000. | ||
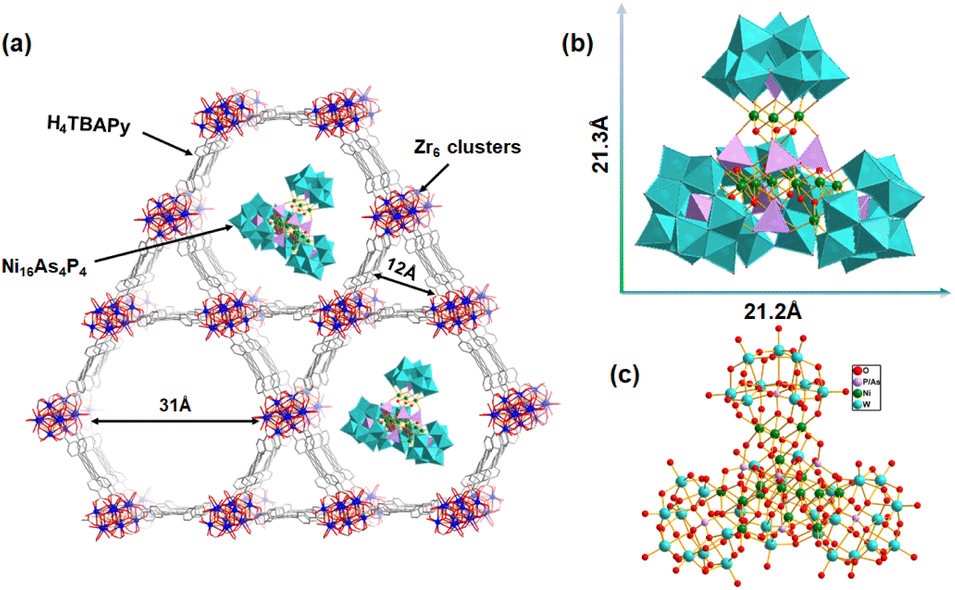 | ||
| Scheme 1 (a) Schematic representation of the possible structure for the Ni16As4P4@NU-1000 composite. (b) Polyhedral and (c) ball-and-stick representations of the Ni16As4P4 cluster. | ||
The successful immobilization of the Ni16As4P4 cluster as well as the physicochemical interactions were further investigated by the Fourier transform infrared (FT-IR) spectra measurements as shown in Fig. 3a. The characteristic IR signals from 700 to 1100 cm−1 were attributed to the typical W–O and P–O vibrational bands of the Ni16As4P4 cluster, while the bands from 650 to 1200 cm−1 were assigned to the Zr–O vibrational modes and carboxylate stretches in NU-1000. Obviously, the FT-IR spectrum of 0.1-Ni16As4P4@NU-1000 contained the characteristic IR vibration peaks of the Ni16As4P4 guest cluster and NU-1000 host. Moreover, a slight shift of the vibrational peaks of the Ni16As4P4 cluster was observed in the spectra of the 0.1-Ni16As4P4@NU-1000 composite, which to some extent implied the electrostatic interaction between the Ni16As4P4 cluster and NU-1000 host. Moreover, UV–Vis diffuse reflectance spectra (UV-DRS) were also utilized to characterize the optical absorption properties of these series of samples. The enhanced light absorption ability and the extended absorption edge of 0.1-Ni16As4P4@NU-1000 further confirmed the electronic interaction between the host and guest (Fig. 3b).
 | ||
| Fig. 3 (a) FT-IR spectra and (b) UV–Vis diffuse reflectance spectra of 0.1-Ni16As4P4@NU-1000, NU-1000, and Ni16As4P4. | ||
The photocatalytic hydrogen evolution tests were carried out in a custom-built reactor equipped with a quartz window under external light illumination under constant magnetic stirring. The detailed procedures have been described in the Experimental section. To achieve optimal photocatalytic conditions, a series of parameters have been optimized regarding the preparation and photocatalytic systems of the Ni16As4P4@NU-1000 composite, including the feedstock molar ratio of Ni16As4P4 to NU-1000 in different composites, the pH of the reaction solution, the concentration of AA, and the usage amount of the photocatalyst. Specifically, the amount of hydrogen production increased with the increasing feedstock molar ratio of Ni16As4P4 to NU-1000, reaching a peak value of 59180 μmol g−1 with an apparent quantum yield (AQY) of 1.715% (see calculation details in the ESI†) at the feedstock molar ratio of 0.1 after 6-hour catalysis, and then decreased with the further increased feedstock molar ratio (Fig. 4a). Such volcanic trends of hydrogen production could be attributed to the changes in the pore textures of the Ni16As4P4@NU-1000 composite. According to the results of BET measurement, both the BET surface area and the adsorption volume of 0.1-Ni16As4P4@NU-1000 greatly declined compared to that of NU-1000 only (Fig. 2), revealing that the pores of the NU-1000 host would be mostly blocked on further increasing the feeding amount of Ni16As4P4. The highly blocked pores in the composite would decrease the mass-transfer processes during photocatalysis, thereby resulting in a decrease in the photocatalytic hydrogen evolution activities. The photocatalytic activities of 0.1-Ni16As4P4@NU-1000 also depended on the pH value of the reaction solution; the optimized pH value was obtained as pH = 5.5 because AA works as an efficient hole scavenger at this pH (Fig. S3†). Meanwhile, the concentration of AA was optimized as 1 mol L−1 (Fig. S4†). In addition, the TON of the 0.1-Ni16As4P4@NU-1000-catalyzing system reached 3080 at an optimized 0.1 mg photocatalyst usage (Fig. S5†), corresponding to a hydrogen evolution of 120460 μmol g−1. The higher photocatalyst usage resulted in a decrease in hydrogen production, which was probably caused by the strong light scattering effect, leading to a waste of incident photons.
 | ||
| Fig. 4 (a) The hydrogen production of x-Ni16As4P4@NU-1000 photocatalysts with different feedstock molar ratios of Ni16As4P4/NU-1000 (1.0–0.05). (b) Comparison profiles of the photocatalytic hydrogen production using different catalysts and reaction conditions. (c) Long-term photocatalytic hydrogen evolution test of 0.1-Ni16As4P4@NU-1000. (d) Recycling photocatalytic tests for 0.1-Ni16As4P4@NU-1000. Conditions: (a) 2 mg (b) 5 mg (c) 0.1 mg (d) 5 mg of photocatalyst, 20 mL of 1 M AA aqueous solution at pH = 5.5, Xe-lamp (full spectrum, 300 W, 20 °C). | ||
Our previous studies revealed that the synergistic cooperation between the NU-1000 host and POM guest catalyst is beneficial to efficient photocatalytic hydrogen evolution.37 Herein, control experiments in the absence of each component (NU-1000, Ni16As4P4, and AA) yield no or negligible hydrogen production, indicating the importance of each component in the photocatalytic system for efficient catalysis (Fig. 4b). Further control experiments using Ni16As4P4 + NU-1000 and NiCl2 + NU-1000 as comparative catalysts have been also performed for photocatalytic hydrogen production under otherwise similar conditions (Fig. 4b). It is obvious that the 0.1-Ni16As4P4@NU-1000 composite photocatalyst exhibited the best photocatalytic activity, indicating that the close integration of Ni16As4P4 and NU-1000 as confirmed by FT-IR (Fig. 3a) and UV-Vis analyses (Fig. 3b) can facilitate the multiple photoelectron injection from the excited NU-1000 host to Ni16As4P4 cluster for subsequent photocatalysis. Moreover, the catalytic systems of using either 0.1-Ni16As4P4@NU-1000 or Ni16As4P4 + NU-1000 both exhibited better performance than that of NiCl2 + NU-1000, strongly implying that the unique structural integrity of nickel substitution in the Ni16As4P4 cluster played a crucial role in effective photocatalytic hydrogen production. In addition, various spectroscopic analyses including FT-TR spectra (Fig. S6†), and SEM (Fig. S7†), and TEM images (Fig. S8†) also confirmed the structural intactness of the 0.1-Ni16As4P4@NU-1000 composite after photocatalysis, demonstrating the good photocatalytic stability and strong host–guest interaction in the composite.
To further evaluate the photocatalytic stability of the 0.1-Ni16As4P4@NU-1000 composite, long-term photocatalytic hydrogen evolution was performed under the optimal photocatalytic conditions (Fig. 4c). With prolonged photocatalysis, the amount of hydrogen production gradually increased, achieving a hydrogen production of 1120 mmol g−1 and a TON of 28600 after 120-hour illumination. Table S1† compared the photocatalytic activities of our present 0.1-Ni16As4P4@NU-1000 composite with that of other reported POM@MOF composites for photocatalytic hydrogen evolution. It is clear that the 0.1-Ni16As4P4@NU-1000 composite exhibited the best photocatalytic hydrogen evolution activity; the increased number of Ni centers may offer more active sites for catalysis.37Fig. 4d shows the recycling stability test results for the 0.1-Ni16As4P4@NU-1000 composite. After four successive recycles, the hydrogen production remained largely unchanged, illustrating the good recycling stability of the 0.1-Ni16As4P4@NU-1000 composite. The slight increase in hydrogen evolution activity after the first run could be ascribed to the improved utilization of absorbed photons due to better dispersion of the photocatalyst during photocatalysis. It is worth mentioning that the Keggin- or Dawson-type POM@NU-1000 composites exhibited decreased catalytic activity with recycling times as reported in our previous work, and the larger size of POM is beneficial for more robust catalysis.37 Also, the long-term TON of the catalytic system using 0.1-Ni16As4P4@NU-1000 was more than twice of the reported system using Ni3P2W16@NU-1000, further implying that the appropriate size-matching strategy between the POM guest and the MOF host was beneficial for good photocatalytic performance. Based on the above experimental results and our previous observation,37 it is concluded that the optimal size match between the Ni16As4P4 guest clusters and the pores of the NU-1000 host could effectively prevent the leakage of the Ni16As4P4 cluster during photocatalysis, thereby resulting in great recycling stability of the 0.1-Ni16As4P4@NU-1000 composite.
In order to investigate the photocatalytic mechanism, the steady-state luminescence spectra of NU-1000 and the 0.1-Ni16As4P4@NU-1000 composite were first collected using 365 nm laser light excitation (Fig. 5a). Upon excitation, an obviously strong photoluminescence signal was observed for the pristine NU-1000 host, which can be dramatically quenched after incorporating Ni16As4P4 clusters, indicating the efficient migration of photogenerated electrons from the excited NU-1000 framework to Ni16As4P4 cluster in the Ni16As4P4@NU-1000 composite. The photoluminescence decay kinetics analyses were further employed to study the photogenerated charge carrier dynamics in pristine NU-1000 and the 0.1-Ni16As4P4@NU-1000 composite (Fig. 5b). The decay curves were optimally fitted with a three-exponential decay function and the fitting results are summarized in Table S2.† Compared to the pristine NU-1000 host, the photoluminescence lifetimes of the 0.1-Ni16As4P4@NU-1000 composite significantly decreased, which further revealed the effective transfer of photogenerated electrons between the NU-1000 host and Ni16As4P4 guest.
 | ||
| Fig. 5 (a) Luminescence spectra of 0.1-Ni16As4P4@NU-1000 and NU-1000 with the excitation wavelength of 365 nm. (b) Normalized luminescence decay kinetics curves of NU-1000 and 0.1-Ni16As4P4@NU-1000. | ||
In addition, the X-ray photoelectron spectroscopy (XPS) technique was further employed to determine the chemical oxidation states of Zr, W, and Ni elements in both the NU-1000 host and 0.1-Ni16As4P4@NU-1000 composite (Fig. 6). The XPS signal of Zr can be deconvoluted into two peaks located at 184.4 eV (Zr 3d3/2) and 182.0 eV (Zr 3d5/2), respectively, revealing the existence of Zr4+ species in the NU-1000 framework (Fig. 6a). There was an obvious positive shift (∼0.89 eV) observed for Zr 3d signal peaks after immobilization of Ni16As4P4 into the NU-1000 framework, suggesting the shift of electron density around {Zr6} nodes of NU-1000 to Ni16As4P4 guest clusters due to strong electronic interactions. These results were consistent with the results of steady-state and time-resolved photoluminescence quenching behavior of NU-1000 after the incorporation of Ni16As4P4 clusters. After photocatalysis, the Zr 3d signal peaks shifted back to a similar value to that of Zr 3d signal peaks in NU-1000 only, which should be attributed to the slight reduction of {Zr6} nodes under the strong reducing environment. The XPS peaks of Ni were deconvoluted into Ni 2p1/2 and Ni 2p3/2 peaks with the corresponding binding energies of 874.4 eV and 856.5 eV in the Ni16As4P4@NU-1000 composite, revealing the +2 oxidation state of the Ni centers in the POM clusters (Fig. 6b). The binding energies of W 4f5/2 and 4f7/2 were located at 38.0 eV and 35.9 eV corresponding to the +6 oxidation state of W (Fig. 6c). Both the Ni 2p and W 4f signal peaks shifted (∼0.82 eV and ∼0.17 eV) to the negative binding energy after photocatalysis, which indicated that Ni16As4P4 is partially reduced during the photocatalytic hydrogen evolution reaction.
 | ||
| Fig. 6 High-resolution XPS spectra of (a) Zr 3d in NU-1000 and 0.1-Ni16As4P4@NU-1000 before and after photocatalysis. The high-resolution XPS spectra of (b) Ni 2p and (c) W 4f of 0.1-Ni16As4P4@NU-1000 before and after photocatalysis. | ||
Based on the above experimental observations and detailed analyses, the schematic energy level diagram to illustrate the photocatalytic hydrogen evolution mechanism was proposed as shown in Scheme 2. The HOMO–LUMO data of NU-1000 was obtained from a literature report,39 while the LUMO position of Ni16As4P4 was determined to be −0.220 V vs. NHE by the cyclic voltammetry (CV) test (Fig. S9†). During photocatalysis, the photo-responsive NU-1000 host can efficiently harvest photons and generate photoexcited states upon light irradiation, subsequently followed by the fast migration of photogenerated electrons to the Ni16As4P4 guest clusters. To finish a complete catalytic cycle, the oxidation state of NU-1000 can be reduced back to the initial state using the sacrificial AA reagent; meanwhile, the reduced Ni16As4P4 cluster catalyst will effectively reduce the adsorbed H+ species to release hydrogen. Overall, the synergistic cooperation of the good light-responsive ability of the NU-1000 host, the reversible multi-electron-catalytic properties of the structurally intact Ni16As4P4 cluster, and the suitable host–guest size-matching effect could greatly contribute to the superior photocatalytic activity of the Ni16As4P4@NU-1000 composite.
 | ||
| Scheme 2 Schematic energy level diagram of photocatalytic hydrogen production of the Ni16As4P4@NU-1000 composite. | ||
Conclusions
In summary, we have successfully constructed a POM@MOF composite by immobilizing a high-nuclearity Ni-containing polyoxometalate, [{Ni4(OH)3AsO4}4(B-a-PW9O34)4]28− (Ni16As4P4), into a mesoporous Zr-based MOF (NU-1000) via a well-established impregnation approach. Various characterization techniques were employed to confirm the successful incorporation of Ni16As4P4 into the NU-1000 framework. Under optimized conditions, Ni16As4P4@NU-1000 exhibited outstanding long-term photocatalytic activity with a hydrogen evolution of 1120 mmol g−1 and a TON of 28600 during 120-hour Xe-lamp irradiation. Photophysical and spectroscopic analyses revealed that the excellent and robust photocatalytic activity of the Ni16As4P4@NU-1000 composite can be attributed to the synergistic cooperation of good light-responsive ability of the NU-1000 host, reversible multi-electron-catalytic properties of the structurally intact Ni16As4P4 cluster, and the suitable host–guest size-matching effect. This work not only presented an interesting size-matching strategy for constructing a POM@MOF host–guest composite but also provided great potential in exploring more POM@MOF functional materials through host–guest interaction.
Experimental
Materials and methods
Chemicals were purchased from commercial sources and used without further purification. The scanning electron microscopy (SEM) images and energy dispersive X-ray spectroscopy (EDS) images were obtained on a ZEISS supra55. Fourier transform infrared (FT-IR) spectra were recorded on a Bruker Tensor II with KBr pellets. UV–Vis diffuse reflectance spectra (DRS) were recorded on a Techcomp UV 2600 spectrophotometer. Inductively coupled plasma emission spectroscopy (ICP-AES) data were obtained on a Spectro Arcos EOP (axial view inductively coupled plasma spectrometer). X-ray photoelectron spectroscopy (XPS) data were collected on a PHI 5000 VersaProbe III scanning XPS microprobe. Powder X-ray diffraction (PXRD) patterns were measured on a MiniFlex 600 diffractometer with a Cu Kα X-ray radiation source. The Brunauer–Emmett–Teller (BET) tests were performed on a Quantachrome Instruments ASiQMVH002-5 using a low-temperature N2 adsorption–desorption method by pretreating the samples for 12 h under vacuum at 120 °C to obtain the clean surface. The fluorescence quenching spectra were collected on an Edinburgh FS50. Transmission electron microscope (TEM) images were obtained on a JEOL JEM-2100. Cyclic voltammetry (CV) curves were collected using a CHI660E electrochemical potentiostat with a three-electrode system comprising a glassy carbon working electrode, a Pt wire auxiliary electrode, and a saturated Ag/AgCl reference electrode. The amount of hydrogen production was determined using a Techcomp GC7900 gas chromatograph equipped with a thermal conductivity detector (TCD).Synthetic procedures
0.58 g (0.78 mmol) of TBAPy and 100 mL of THF/water (ratio 1:1) solution containing 1.5 g (37.5 mmol) NaOH were added into a 250 mL round bottom flask, and then the mixture was refluxed at 100 °C overnight under stirring. The excess solvent THF was removed by rotary evaporation and the resulting solid residue was re-dissolved in water to form a clear yellow solution, which was stirred at room temperature for 2 h and adjusted the pH to 1 with concentrated HCl. Upon washing with water several times, the resulting solid was re-dissolved in boiled DMF and then cooled down to room temperature and recrystallized with dichloromethane. The final product was dried in a vacuum oven at 120 °C for 72 h.37,41,42
Photocatalytic hydrogen evolution experiments
The photocatalytic hydrogen evolution test was carried out in a custom-built reactor equipped with a quartz window under external light illumination under constant magnetic stirring. The typical photocatalytic hydrogen evolution experiment is described in detail as follows. A certain amount of Ni16As4P4@NU-1000 was uniformly dispersed into 20 mL ascorbic acid solution (AA, at different concentrations and pH values) under magnetic stirring and degassed with Ar/CH4 (4/1) to remove air, where CH4 was used as an internal standard. The reactor was irradiated using a 300 W Xe lamp (full spectrum, PCX50C, Beijing Perfectlight Technology Co., Ltd.) cutoff filter as a light source. The reaction temperature was maintained at 20 °C using a water-cooling system. During photocatalysis, the headspace gas (100 μL) was withdrawn from the glass reactor using a Hamilton air-tight syringe and then injected into a gas chromatograph (Techcomp GC7900) equipped with a TCD and a 5 Å molecular sieve capillary column with argon carrier gas. The amount of generated H2 was calculated based on the calibration curve corrected using the CH4 internal standard. The TON of H2 was calculated according to the following equation as commonly used in similar systems:37,43,44
Author contributions
Ruijie Wang: methodology, data curation, formal analysis, investigation, writing – original draft preparation. Yeqin Feng, Le Jiao, Hui Zhou and Xuemeng Jing: software, visualization, validation. Yuanyuan Dong: formal analysis, validation. Tianfu Liu: funding acquisition, project administration. Hongjin Lv: funding acquisition, project administration, conceptualization, supervision, validation, writing – reviewing and editing.Conflicts of interest
There are no conflicts of interest to declare.Acknowledgements
We gratefully acknowledge the financial support from the National Natural Science Foundation of China (21871025 and 21571018), the Recruitment Program of Global Experts (Young Talents) and BIT Excellent Young Scholars Research Fund and the start-up funding of BIT. The instrumental support from the Analysis and Testing Center of Beijing Institute of Technology is also highly appreciated.References
- J. Hong, X. Xia, Y. Wang and R. Xu, J. Mater. Chem., 2012, 22, 15006–15012 RSC.
- B. Mahler, V. Hoepfner, K. Liao and G. A. Ozin, J. Am. Chem. Soc., 2014, 136, 14121–14127 CrossRef CAS PubMed.
- H. Zhang, P. Zhang, M. Qiu, J. Dong, Y. Zhang and X. W. D. Lou, Adv. Mater., 2019, 31, 1804883 Search PubMed.
- J. Zhang, Y. Wang, J. Jin, J. Zhang, Z. Lin, F. Huang and J. Yu, ACS Appl. Mater. Interfaces, 2013, 5, 10317–10324 CrossRef CAS PubMed.
- H. Lv, Y. V. Geletii, C. Zhao, J. W. Vickers, G. Zhu, Z. Luo, J. Song, T. Lian, D. G. Musaev and C. L. Hill, Chem. Soc. Rev., 2012, 41, 7572–7589 RSC.
- W. Guo, H. Lv, Z. Chen, K. P. Sullivan, S. M. Lauinger, Y. Chi, J. M. Sumliner, T. Lian and C. L. Hill, J. Mater. Chem. A, 2016, 4, 5952–5957 RSC.
- M. Zhang, H. Li, J. Zhang, H. Lv and G.-Y. Yang, Chin. J. Catal., 2021, 42, 855–871 CrossRef CAS.
- T. Cui, L. Qin, F. Fu, X. Xin, H. Li, X. Fang and H. Lv, Inorg. Chem., 2021, 60, 4124–4132 CrossRef CAS PubMed.
- J. J. Walsh, A. M. Bond, R. J. Forster and T. E. Keyes, Coord. Chem. Rev., 2016, 306, 217–234 CrossRef CAS.
- Y. Ren, C. Du, S. Feng, C. Wang, Z. Kong, B. Yue and H. He, CrystEngComm, 2011, 13, 7143–7148 RSC.
- X.-X. Lu, Y.-H. Luo, C. Lu, X. Chen and H. Zhang, J. Solid State Chem., 2015, 232, 123–130 CrossRef CAS.
- Y. Guo and C. Hu, J. Mol. Catal. A: Chem., 2007, 262, 136–148 CrossRef CAS.
- B. Chakraborty, G. Gan-Or, M. Raula, E. Gadot and I. A. Weinstock, Nat. Commun., 2018, 9, 4896 CrossRef PubMed.
- H. Ma, B. Liu, B. Li, L. Zhang, Y. G. Li, H. Q. Tan, H. Y. Zang and G. Zhu, J. Am. Chem. Soc., 2016, 138, 5897–5903 CrossRef CAS PubMed.
- X. Gao, J. Wang, Q. Xue, Y.-Y. Ma and Y. Gao, ACS Appl. Nano Mater., 2021, 4, 2126–2135 CrossRef CAS.
- P. Wang, L. Jiang, X. Zou, H. Tan, P. Zhang, J. Li, B. Liu and G. Zhu, ACS Appl. Mater. Interfaces, 2020, 12, 25910–25919 CrossRef CAS PubMed.
- Y. Yang, Q. Wu, Y. Guo, C. Hu and E. Wang, J. Mol. Catal. A: Chem., 2005, 225, 203–212 CrossRef CAS.
- S. Pourbeyram, M. Moosavifar and V. Hasanzadeh, J. Electroanal. Chem., 2014, 714–715, 19–24 CrossRef CAS.
- Y. Yang, Y. Guo, C. Hu, Y. Wang and E. Wang, Appl. Catal., A, 2004, 273, 201–210 CrossRef CAS.
- F. M. Toma, A. Sartorel, M. Iurlo, M. Carraro, P. Parisse, C. Maccato, S. Rapino, B. R. Gonzalez, H. Amenitsch, T. Da Ros, L. Casalis, A. Goldoni, M. Marcaccio, G. Scorrano, G. Scoles, F. Paolucci, M. Prato and M. Bonchio, Nat. Chem., 2010, 2, 826–831 CrossRef CAS PubMed.
- C. M. Granadeiro, P. Silva, V. K. Saini, F. A. A. Paz, J. Pires, L. Cunha-Silva and S. S. Balula, Catal. Today, 2013, 218–219, 35–42 CrossRef CAS.
- N. Maksimchuk, M. Timofeeva, M. Melgunov, A. Shmakov, Y. Chesalov, D. Dybtsev, V. Fedin and O. Kholdeeva, J. Catal., 2008, 257, 315–323 CrossRef CAS.
- J. W. Sun, P. F. Yan, G. H. An, J. Q. Sha, G. M. Li and G. Y. Yang, Sci. Rep., 2016, 6, 25595 CrossRef CAS PubMed.
- Y. Benseghir, A. Lemarchand, M. Duguet, P. Mialane, M. Gomez-Mingot, C. Roch-Marchal, T. Pino, M. H. Ha-Thi, M. Haouas, M. Fontecave, A. Dolbecq, C. Sassoye and C. Mellot-Draznieks, J. Am. Chem. Soc., 2020, 142, 9428–9438 CrossRef CAS PubMed.
- L. X. Cai, S. C. Li, D. N. Yan, L. P. Zhou, F. Guo and Q. F. Sun, J. Am. Chem. Soc., 2018, 140, 4869–4876 CrossRef CAS PubMed.
- A. Dhakshinamoorthy, A. M. Asiri and H. Garcia, Angew. Chem., Int. Ed., 2016, 55, 5414–5445 CrossRef CAS PubMed.
- G. Paille, M. Gomez-Mingot, C. Roch-Marchal, B. Lassalle-Kaiser, P. Mialane, M. Fontecave, C. Mellot-Draznieks and A. Dolbecq, J. Am. Chem. Soc., 2018, 140, 3613–3618 CrossRef CAS PubMed.
- W. Salomon, F. J. Yazigi, C. Roch-Marchal, P. Mialane, P. Horcajada, C. Serre, M. Haouas, F. Taulelle and A. Dolbecq, Dalton Trans., 2014, 43, 12698–12705 RSC.
- E. V. Ramos-Fernandez, C. Pieters, B. van der Linden, J. Juan-Alcañiz, P. Serra-Crespo, M. W. G. M. Verhoeven, H. Niemantsverdriet, J. Gascon and F. Kapteijn, J. Catal., 2012, 289, 42–52 CrossRef CAS.
- S.-X. L. Chun-Yan Sun, D.-D. Liang, K.-Z. Shao, Y.-H. Ren and Z.-M. Su, J. Am. Chem. Soc., 2009, 131, 1883–1888 CrossRef PubMed.
- L. Zeng, X. Guo, C. He and C. Duan, ACS Catal., 2016, 6, 7935–7947 CrossRef CAS.
- J. Han, D. Wang, Y. Du, S. Xi, Z. Chen, S. Yin, T. Zhou and R. Xu, Appl. Catal., A, 2016, 521, 83–89 CrossRef CAS.
- Z. M. Zhang, T. Zhang, C. Wang, Z. Lin, L. S. Long and W. Lin, J. Am. Chem. Soc., 2015, 137, 3197–3200 CrossRef CAS PubMed.
- X. J. Kong, Z. Lin, Z. M. Zhang, T. Zhang and W. Lin, Angew. Chem., Int. Ed., 2016, 55, 6411–6416 CrossRef CAS PubMed.
- H. Li, S. Yao, H.-L. Wu, J.-Y. Qu, Z.-M. Zhang, T.-B. Lu, W. Lin and E.-B. Wang, Appl. Catal., B, 2018, 224, 46–52 CrossRef CAS.
- D. Shi, R. Zheng, C. S. Liu, D. M. Chen, J. Zhao and M. Du, Inorg. Chem., 2019, 58, 7229–7235 CrossRef CAS PubMed.
- L. Jiao, Y. Dong, X. Xin, L. Qin and H. Lv, Appl. Catal., B, 2021, 291, 120091 CrossRef CAS.
- L. Jiao, Y. Dong, X. Xin, R. Wang and H. Lv, J. Mater. Chem. A, 2021, 9, 19725–19733 RSC.
- P. P. Bag, X.-S. Wang, P. Sahoo, J. Xiong and R. Cao, Catal. Sci. Technol., 2017, 7, 5113–5119 RSC.
- H. Lv, Y. Chi, J. van Leusen, P. Kögerler, Z. Chen, J. Bacsa, Y. V. Geletii, W. Guo, T. Lian and C. L. Hill, Chem.–Eur. J., 2015, 21, 17363–17370 CrossRef CAS PubMed.
- J. E. Mondloch, W. Bury, D. Fairen-Jimenez, S. Kwon, E. J. DeMarco, M. H. Weston, A. A. Sarjeant, S. T. Nguyen, P. C. Stair, R. Q. Snurr, O. K. Farha and J. T. Hupp, J. Am. Chem. Soc., 2013, 135, 10294–10297 CrossRef CAS PubMed.
- T. C. Wang, N. A. Vermeulen, I. S. Kim, A. B. F. Martinson, J. F. Stoddart, J. T. Hupp and O. K. Farha, Nat. Protoc., 2015, 11, 149–162 CrossRef PubMed.
- X. J. Kong, Z. Lin, Z. M. Zhang, T. Zhang and W. Lin, Angew. Chem., Int. Ed., 2016, 55, 6411–6416 CrossRef CAS PubMed.
- J. Tian, Z. Y. Xu, D. W. Zhang, H. Wang, S. H. Xie, D. W. Xu, Y. H. Ren, H. Wang, Y. Liu and Z. T. Li, Nat. Commun., 2016, 7, 11580 CrossRef CAS PubMed.
Footnote |
| † Electronic supplementary information (ESI) available. See DOI: https://doi.org/10.1039/d2ta09606d |
| This journal is © The Royal Society of Chemistry 2023 |