
 Open Access Article
 This Open Access Article is licensed under a Creative Commons Attribution-Non Commercial 3.0 Unported Licence
Probing the activity and stability of MoO2 surface nanorod arrays for hydrogen evolution in an anion exchange membrane multi-cell water electrolysis stack†
Francesco
Bartoli
ab,
Laura
Capozzoli
a,
Tailor
Peruzzolo
a,
Marcello
Marelli
 c,
Claudio
Evangelisti
d,
Karel
Bouzek
e,
Jaromir
Hnát
e,
Giulia
Serrano
f,
Lorenzo
Poggini
a,
Kevin
Stojanovski
g,
Valentín
Briega-Martos
g,
Serhiy
Cherevko
g,
Hamish A.
Miller
*a and
Francesco
Vizza
a
c,
Claudio
Evangelisti
d,
Karel
Bouzek
e,
Jaromir
Hnát
e,
Giulia
Serrano
f,
Lorenzo
Poggini
a,
Kevin
Stojanovski
g,
Valentín
Briega-Martos
g,
Serhiy
Cherevko
g,
Hamish A.
Miller
*a and
Francesco
Vizza
a
aInstitute of Chemistry of Organometallic Compounds-National Research Council of Italy (ICCOM-CNR), Via Madonna del Piano 10, 50019 Sesto Fiorentino (Florence), Italy. E-mail: hamish.miller@iccom.cnr.it
bDepartment of Biotechnology, Chemistry and Pharmacy, University of Siena, Via Aldo Moro 2, 53100 Siena, Italy
cIstituto di Scienze e Tecnologie Chimiche “Giulio Natta”, CNR-SCITEC, 20138 Milano, Italy
dInstitute of Chemistry of Organometallic Compounds-National Research Council of Italy (ICCOM-CNR), Via G. Moruzzi 1, 56124 Pisa, Italy
eUniversity of Chemistry and Technology, Prague, Department of Inorganic Technology, Technická 5, 166 28, Prague 6, Czech Republic
fDepartment of Industrial Engineering (DIEF) and INSTM Research Unit, University of Florence, Via Santa Marta 3, 50139 Florence, Italy
gForschungszentrum Jülich GmbH, Helmholtz Institute Erlangen-Nürnberg for Renewable Energy (IEK-11), Cauerstr. 1, 91058 Erlangen, Germany
First published on 26th January 2023
Abstract
The development of sustainable electrocatalysts is essential for promoting anion exchange membrane water electrolysis (AEMWE) technology. Ni–Mo and MoO2 materials have enhanced alkaline hydrogen evolution reaction (HER) activity. This study investigates an active HER catalyst synthesized from MoNiO4 nano-rod arrays on nickel foam using high-temperature reductive annealing. Complete characterization of the nanostructure by SEM, HR-TEM and XPS indicates that during synthesis the crystalline MoNiO4 structure of individual rods segregates a surface enriched polycrystalline MoO2 layer rather than a Ni4Mo alloy as reported previously. Mo and Ni electrochemical dissolution was studied by the scanning flow cell technique coupled with inductively coupled plasma mass spectrometry (SFC-ICP-MS). It was found that only Mo undergoes detectable dissolution phenomena, with the MoO2/Ni cathode prepared at 600 °C being the most stable. Tests in an AEMWE with a Ni foam anode demonstrate a current density of 0.55 A cm−2 (2 V) at 60 °C and H2 production was stable for more than 300 h (0.5 A cm−2). The synthesis procedure was scaled up to prepare electrodes with an area of 78.5 cm2 that were employed and evaluated in a three-cell AEM electrolyser stack.
1 Introduction
H2 produced from electrochemical water splitting powered with renewable energy (green hydrogen) is currently of great interest, driven by the increasing demand for energy based on clean resources.1–3 Since the late 1950s, steam methane reforming (SMR) has been the dominant H2 technology, followed by coal gasification. Water electrolysis (WE) contributes 2–4% of today's global H2 production.4–6 The cost of SMR, which is in the range of 2 € per kg H2, is economically attractive.5 WE can accept high current inputs per surface area, operate in dynamic modes and be ramped up quickly, which are all requirements for storage of intermittent renewable energy sources.7,8 Estimates of WE H2 cost are greater than 3.8 € per kg H2, making it currently uncompetitive.5 It has been predicted that with the advantages of economies of scale WE will become competitive in the future.9,10 The components of proton exchange membrane water electrolysers (PEMWEs) are costly due to the highly corrosive nature of the membrane. Bipolar plates (BPs) are made of titanium accounting for up to 51% of the stack costs, followed by the manufacturing costs of the MEA (10%) and the cost of cathode (9%) and anode (8%) current collectors. The cost of a PEMWE anode catalyst and membrane is comparable at 6 and 5%, respectively, and the cathode at 1%.11 The alkaline environment of anion exchange membrane water electrolysis (AEMWE) widens the window of options in materials choices,12 for example, stainless steel BPs13 and platinum group metal (PGM) free catalysts.14,15 Few systems have reached a commercial scale despite promising laboratory results. Recently, 1 A cm−2 was demonstrated with a pure water feed. However, this activity was achieved with high loadings of Pt and IrO2 catalysts.16 Exceptional current densities of 8 A cm−2 at 2 V with PGMs and 1 M KOH have also been reported.17 One of the key challenges involves developing low-cost and sustainable catalysts for both the HER and OER that match the activity and stability of PGMs.18 Regarding the HER, Pt is still the most active catalyst; however slower kinetics means high loadings are required.19 As alternatives, intermetallic compounds of Ni and Mo including Ni7Mo7, Ni3Mo and Ni4Mo all show enhanced activity.20 The activities of MoNi4/MoO2@Ni, MoO3−x/NiMoO4 or Ni4Mo are similar to that of Pt/C when tested in 1 M KOH. High HER activity has been shown for MoNi4/MoO3−x nanorod arrays grown on nickel foam. The activity was assigned to the presence of surface MoNi4 alloy nanoparticles.21 However, after a short 20 h test under electrolysis conditions the presence of Mo0 and Ni0 XPS peaks ascribable to the MoNi4 alloy were almost completely lost despite the fact that HER performance was stable. In this study, we investigate in more detail the nature of the surface composition that is stable during the HER. A series of Mo–Ni on Ni foam type (here named MoO2/Ni) catalysts are prepared and the synthesis parameters are varied to identify the conditions that produce the most active material. A volcano type curve of activity with respect to synthesis temperature exists with 600 °C being the best annealing temperature, which online electrochemical scanning flow cell combined with inductively coupled plasma mass spectrometry (SFC-ICP-MS) also showed to be the most stable. The structure of the catalyst formed at this temperature is a surface enriched with MoO2 confirmed by XPS, SEM and HR-TEM. The activity in a complete AEMWE is evaluated over two weeks of operation together with a Ni foam anode and a commercial AEM. The synthesis was scaled up to prepare electrodes with an active area of 78.5 cm2 and electrodes were employed in a three-cell electrolyser stack.2 Experimental section
All metal salts and reagents were purchased from Merck and used as received. All the solutions were freshly prepared with doubly distilled deionized water. A Fumasep FAA-3-PK130 membrane was purchased from Fumatech GmbH (Germany).2.1 Synthesis
![[thin space (1/6-em)]](https://www.rsc.org/images/entities/char_2009.gif) :N2 (5:95, v/v). Samples were prepared by varying the annealing temperature. Five samples were prepared at 400, 500, 600, 700 and 800 °C. Each sample is denoted using the preparation temperature. ICP-OES analysis of the detached needles from the sample prepared at 600 °C gave Mo 43 wt% and Ni 29 wt% (28 wt% O).
:N2 (5:95, v/v) for 2 h. The as obtained material is referred to as MoO2/Ni (78.5 cm2).
:N2 (5:95, v/v). Samples were prepared by varying the annealing temperature. Five samples were prepared at 400, 500, 600, 700 and 800 °C. Each sample is denoted using the preparation temperature. ICP-OES analysis of the detached needles from the sample prepared at 600 °C gave Mo 43 wt% and Ni 29 wt% (28 wt% O).
:N2 (5:95, v/v) for 2 h. The as obtained material is referred to as MoO2/Ni (78.5 cm2).
2.2 Electrochemical measurements
All the glassware was cleaned with a H2O2/H2SO4 conc. solution overnight and rinsed several times with Milli-Q water before use. An aqueous solution of KOH 0.1 M (using Milli-Q water) was prepared and poured into the cell, and then it was purged with N2 or H2, for 30 minutes before the tests (all measures were conducted under gas flux). Cyclic voltammetry was carried out in a three-electrode system. As a working electrode, a disc of 1 cm2 of MoO2/Ni was cut from the original electrode and placed on a PTFE holder; a standard Ag/AgCl sat. electrode and Au wire coated in a glass tube were used as the reference and counter-electrodes, respectively. The cell potential was referenced to RHE by adding 0.964 V (0.197 + 0.059 × pH), to a 0.1 M KOH aqueous solution. All voltages and potentials were corrected to eliminate electrolyte resistances and all measurements were performed at 25 °C. The electrochemical tests were carried out using a Parstat 2273 (Princeton Applied Research), using the software “PowerSuit” which allowed setting the different types of scans and recording the obtained data. Polarization (linear sweep voltammetry, LSV) experiments were performed in a 0.1 M KOH solution (pH 13) saturated with hydrogen (30 minutes of pure hydrogen bubbling) at a scan rate of 1 mV s−1. The hydrogen evolution reaction was evaluated by performing scans between 0 and −0.4 V vs. RHE. Electrochemical impedance spectroscopy (EIS) measurements were carried out in a 0.1 M KOH solution, under an N2 atmosphere (30 minutes of pure nitrogen bubbling), with a frequency range spanning from 100 kHz to 0.01 Hz, at a potential of 100 mV. The data and the equivalent circuit were elaborated with “Zwiev4” and “EC lab” software. The double-layer capacitances (Cdl) were measured, by conducting cyclic voltammetry in 1.0 M KOH with different scan rates from 20 to 100 mV s−1 in a potential window of 0.7 to 0.8 V (vs. RHE). The capacitor charging current jc and discharging current ja at 1.075 V were plotted versus the scan rate v according to the equation: |j| = v × Cdl, where Cdl is the slope of the linear fit.2.3 On-line electrochemical dissolution tests
Stability of the MoO2/Ni cathodes was investigated by an on-line SFC-ICP-MS technique. This setup consists of a custom-designed and manufactured propylene carbonate scanning flow-cell (SFC).22 The outlet of the cell was coupled to the inlet of an ICP-MS (PerkinElmer NexION 350×). A glassy carbon rod was used as a counter electrode and was connected to the SFC via a T-connector on the inlet side. A Ag/AgCl/3 M KCl reference electrode (Metrohm) was connected to the cell via a capillary channel on the outlet side. The Ar-purged 0.05 M KOH electrolyte flow was controlled by the peristaltic pump of the ICP-MS (Elemental Scientific, M2 pump) with an average flow-rate of 193 μl min−1. The potentials are reported against the reversible hydrogen electrode (RHE).Electrocatalyst spots were drop-cast on a GC plate (SIGRADUR, area of 25 cm2), which was used as the working electrode. First, powder catalysts were recovered from nickel foam-supported materials by sonicating the Ni lamina into a 2-propanol solution, after which they were left to dry.
Inks were prepared in a vial by weighing 12 mg of powder catalyst, then adding 1.2 ml of a solution of H2O:2-propanol 3:1 (v/v) and adjusting it to pH 12, and finally adding 10 μl of Nafion 5% wt. The catalyst suspension was then drop-cast (0.25 μl) onto a polished glassy carbon plate resulting in spot diameters between 1200 and 1500 μm. The working electrode was sitting on an XYZ translation stage (Physik Instrumente M-403), allowing rapid screening between the samples. Electrochemical protocols were performed using a Gamry Reference 600 potentiostat. In-house developed LabVIEW software controlled all instruments, including the stages, gas control box, force sensor, mass flow controllers and potentiostat. The ICP-MS was calibrated daily using a four-point calibration slope prepared from standard solutions (Ni, Mo – Merck Centripur). 58Co and 103Rh were used as internal standards. The sample and internal standard streams were merged via a Y-connector right before the nebulizer of the ICP-MS.
A protocol consisting of a series of electrochemical measurements was employed in order to stress the material. Contact with the SFC was established at −0.2 V vs. RHE. The system was held at this potential for 10 min (Step I), followed by 2 cycles between −0.35 and 0.61 V RHE by applying a 2 mV s−1 scan rate (Step II). The upper potential limit for Step II was calculated considering the average values of open circuit potential (OCP) of the MoO2/Ni series. Finally, the system was left for 5 minutes under OCP conditions in Step III.
2.4 AEM water electrolysis cell testing
Membrane electrode assemblies (MEAs), with 5 cm2 cathode electrodes MoO2/Ni, (400, 500, 600, 700 or 800 °C) and a 5 cm2 Ni foam anode, were assembled together with a FAA-3-PK-130 membrane (Fumatech) using appropriate gaskets and graphite plates and a stainless steel Scribner testing cell (Scribner Corp. USA). A 4 Nm torque closing force was used. The AEM was pre-activated by feeding the cells with KOH 1 M for 12 hours at 60 °C before each experiment. An 8 channel Arbin LBT21084 battery test station (Arbin Instrument) potentiostat/galvanostat was used to control the electrolysis cell; a peristaltic pump (Gilson Mini Pulse) was used to feed the electrolyser with an aqueous solution of KOH (1 M) at the anode with a 1 ml min−1 flow rate, while no solution was fed to the cathode. The cathode compartment was connected to a Bronkhorst EL-Flow flow meter in order to quantify the H2 produced by the cell. Scan voltage curves were acquired between 0 and 2 V at a 10 mV s−1 scan rate. Galvanostatic experiments were performed by applying a constant current load of 0.5 A cm−2 to the cell while monitoring the cell voltage. The internal ohmic resistance was estimated using an external potentiometer, connected to the heads of the cell.2.5 Zero-gap laboratory-scale anion exchange membrane alkaline water electrolysis stack
Ni foam and MoO2/Ni electrodes of a geometric area of 78.5 cm2 (circular shape, 10 cm diameter) were tested as cathodes in an alkaline water electrolysis cell (Fig. S9†). Bare Ni foam without any pre-treatment was used as an anode in all tests. A chlorinated block copolymer of styrene-ethylene-butylene-styrene (PSEBS-CM) with 1,4-diazabicyclo 2.2.2 octane (DABCO) functional groups was used as a membrane/separator of the electrode compartments. Detailed information on this separator can be found in ref. 23. The thickness of the separator was 180 μm and 270 μm in the dry and wet states, respectively. As liquid electrolyte, 1 M KOH was used. Reservoirs of the liquid electrolyte were heated in a water bath to keep the temperature on the outlet of the cell at 25 or 40 °C, respectively. The flow rate of the liquid electrolyte was 1 cm3 min−1 cm−2. Before the experiments, the cell was equilibrated in several steps at currents of 0.8, 1.6, 3.2, 4.8 and 6.4 A for 10 minutes each. The short-term electrochemical characterisation was performed by means of the load curve measurement using a Metrohm potentiostat/galvanostat with a 20 A booster in the range of 0–19 A with a continuous current increase of 7.6 mA s−1. Stability measurement was performed for 55 hours in 1 M at 25 °C. A constant current density of 0.2 A cm−2 was applied while the cell voltage was recorded. Electrochemical impedance spectroscopy of the single cell of a geometric area of 78.5 cm2 was performed in the frequency range of 25 kHz–0.01 Hz at maximal amplitude of a perturbing signal of 30 mV at cell voltages ranging from 1.5–1.8 V with a step of 0.05 V. The equivalent electrical circuit used for the evaluation of the measured spectra is shown in Fig. 1. | ||
| Fig. 1 Equivalent circuit used for evaluation of the electrochemical impedance spectra of a 78.5 cm2 single cell. L – inductance, Rs – high frequency resistance, CPE1 – capacitance of the double layer of the first reaction, Rp1 – polarisation resistance of the first reaction, C1 – capacitance of the pore walls, Rpor – resistance of the pores filled with solution, CPE2 – capacitance of the double layer of the second reaction, and Rp2 – polarisation resistance of the second reaction. | ||
The proposed equivalent electrical circuit is literature and experience based. We have considered circuit C1 and Rpor, to simulate the capacitance of the pore walls and resistance of the pores filled with liquid electrolyte respectively.24,25 Rp1, CPE1, Rp2 and CPE2 elements were then considered to be related to the electrochemical reactions.
The short-stack in a bipolar configuration consisting of three cells was tested under the same conditions using the same equipment as for the single cell characterization. The stack hardware was recently described in detail in ref. 26. EIS characterization of the short-stack was modified, due to the presence of more cells connected in series. Each bipolar electrode was in contact with silver wires 0.3 mm thick, which allowed the characteristic of each particular cell in the short-stack to be measured. In this case, working and counter electrodes were connected to terminal electrodes (which act as the anode and cathode, respectively), meanwhile sensing electrodes were connected to the silver wires in contact with the electrodes of the particular cell. EIS was conducted under the conditions of the alkaline water electrolysis in galvanostatic mode at current densities of 0.01, 0.05 and 0.1 A cm−2. The maximal amplitude was ±5% of the current range. The frequency range used was 40 kHz to 0.01 Hz. As the EIS spectra of the short-stack showed only one time constant related to the electrochemical reaction, they were evaluated based on the simplified equivalent electrical circuit, which consists of only L1, Rs, CPE1, Rp1, C1 and Rpor elements.
2.6 Physical characterization
SEM and EDX sample characterization studies were performed using a TESCAN Gaia 3 FIB/SEM. The microscope hosts a 30 kV Triglav electron column and a Cobra focused gallium ion beam column. SEM images of the sample surfaces were acquired using two in-beam secondary electron (SE) and back scattered electron (BSE) detectors. EDX maps on the cross-sections were acquired by using the instrument EDAX HI-OCTANE detector.(HR)-TEM, selected area electron diffraction (SAED) and STEM measurements were performed using a ZEISS LIBRA200FE instrument equipped with an Oxford (X-stream 2) EDX probe. SAED indexing was performed using CrystBox software.27 Samples were prepared by detaching the Mo–Ni powder from the Ni-foam support under an ultrasonic bath and dipping samples in 2-propanol. The powder suspensions were dropped onto a lacey carbon Cu TEM grid.
X-ray diffraction (XRD) scans were acquired at room temperature with a PANalytical X’PERT PRO diffractometer, employing CuKα radiation (λ = 1.54187 Å) and a PW3088/60-graded multilayer parabolic X-ray mirror for Cu radiation. The diffractograms were acquired in the 2θ range from 22.0 to 88, using a continuous scan mode with an acquisition step size of 2θ = 0.02638 and a counting time of 49.5 s. QualX2 software and the COD database were used to qualitatively assign the peaks to the structures.
X-ray photoelectron spectroscopy (XPS) analyses were carried out in a UHV chamber with a base pressure lower than 10−9 mbar. The chamber was equipped with non-monochromatized Al radiation (hv = 1486.6 eV) and a hemispherical electron/ion energy analyzer (VSW mounting a 16-channel detector). The operating power of the X-ray source was 150 W (15 kV and 10 mA) and photoelectrons were collected normal to the sample surface, maintaining the analyzer angle between the analyzer axis and X-ray source fixed at 54.5°. All the samples were adsorbed on carbon tape and XPS spectra were acquired in a fixed analyzer transmission mode with a pass energy of 44.0 eV. The spectra were analyzed by using the CasaXPS software. Linear or Shirley functions have been used to subtract the background. The de-convolution of the XPS spectra has been carried out by applying a combination of Gaussian and Lorentzian functions (70/30-ratio). Binding energies (B.E.) were calibrated upon fixing the C 1s component of the carbon tape at 285.1 eV.29
The BET-specific surface area was determined by nitrogen adsorption at 77 K using a Micromeritics ASAP 2020 analyzer. The samples were pretreated with 30 μm Hg at 393 K for 15 h. The BET surface area was calculated in the pressure range between 0.1 and 0.22 p/p0 while the pore volume was calculated with the BJH method (17.00–3000.00 Å range).
3 Results and discussion
3.1 Synthesis and characterization
Hydrothermal treatment (150 °C, 6 h) of surface cleaned nickel foam in a solution of Ni(NO3)2·6H2O and (NH4)6Mo7O24·4H2O results in the growth of cluster-like structures on the nickel foam surface. These structures are composed of multiple rods with smooth surfaces as shown by SEM analysis (Fig. 2a). This precursor material was further heat treated under flowing 5% H2 in a N2 mixture at temperatures ranging from 400 °C to 800 °C (respective SEM images are shown in Fig. 2b–f). A clear increase in surface roughness with increasing annealing temperature is observed. In the 500 and 600 °C samples, the rod-like morphology is maintained with the growth of nanostructures on the smooth surface. Above 700 °C, a collapse in the rod structure is observed. The sample prepared at 800 °C shows a collapsed agglomerated structure.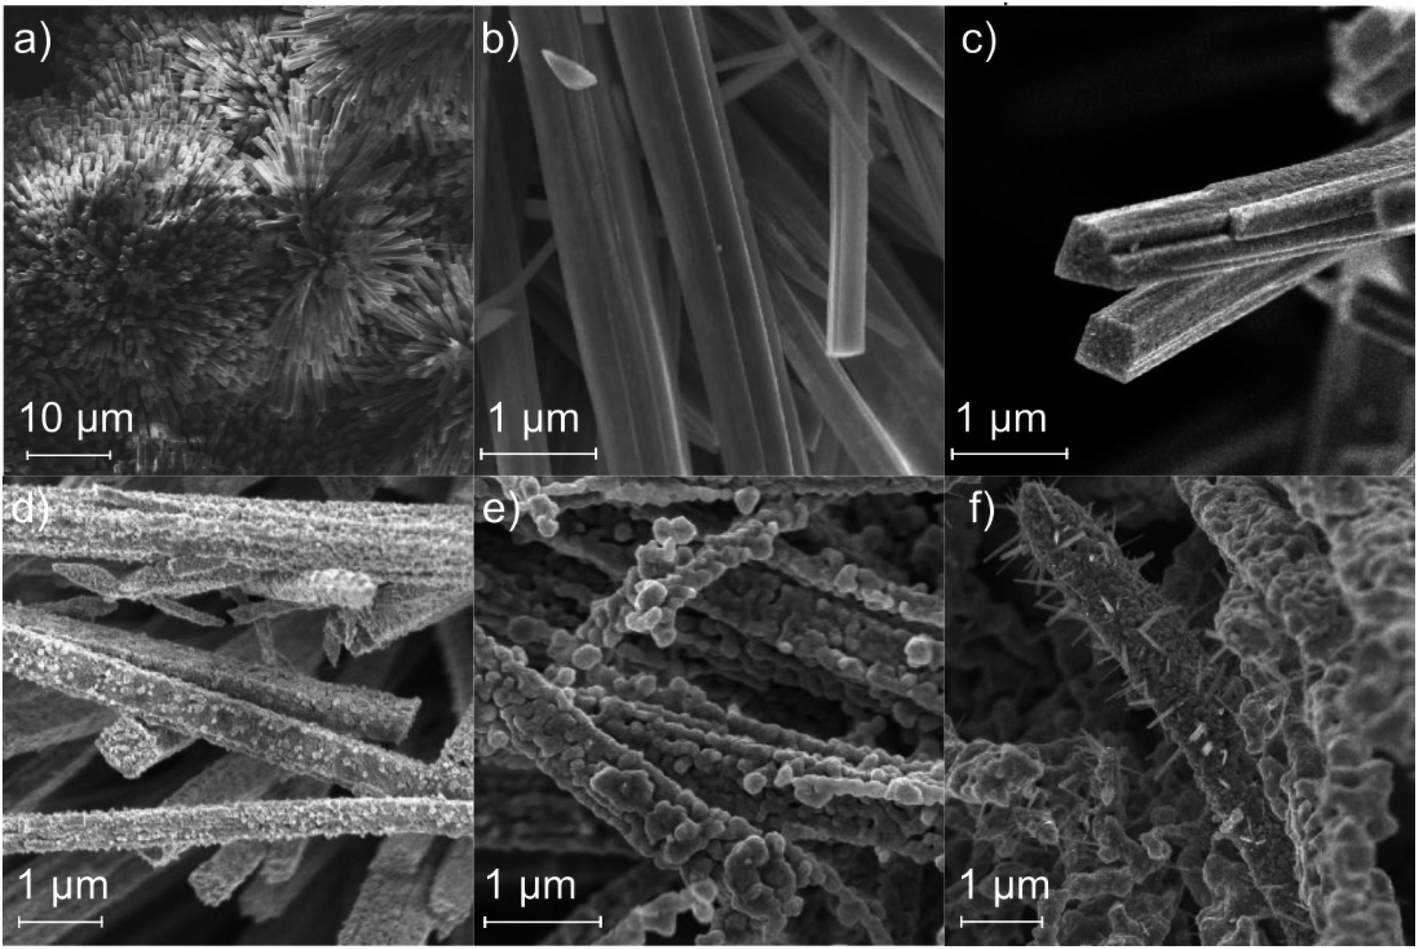 | ||
| Fig. 2 SEM images of (a) MoNiO4 on nickel foam and (b–f) after reductive heat treatment at 400, 500, 600, 700 and 800 °C, respectively. | ||
The chemical composition of the surface of each sample was investigated by XPS (Fig. 3). Regarding the precursor, the surface is composed of a mixture of Ni and Mo species. The nature of the Ni component from the XPS spectra is mostly ascribable to Ni(OH)2 and NiO or a mixture of both. Regarding Ni(OH)2 it is not clear if it is only the hydroxide or g-NiOOH.28 The Mo composition is characteristic of MoNiO4 with Mo(VI) as the major species present.21 Subsequent annealing in a H2/N2 atmosphere dehydrates and partially decomposes NiMoO4 to form surface species such as MoNi4 and MoO2. The degree of formation of these species was studied as a function of annealing temperature. The high-resolution Mo 3d signal can be deconvoluted into four typical components at 227.9, 229.2, 230.4, and 232.2 eV corresponding to Mo0, Mo4+, Mo5+, and Mo6+, respectively. The relative concentrations are listed in Table S1.† Except for Mo6+ and Ni2+, the low-valence states of Mo (Mo5+ and Mo4+) imply the formation of MoO2 with oxygen vacancies. The XPS analysis shows that the Ni species present do not change significantly with increasing temperature as a mix of oxides/hydroxides (Fig. S1†). These spectroscopic results corroborated with the surface NiMoO4 being partially reduced to MoO2.29,30 At high annealing temperatures (700–800 °C) the Mo(0) signal is suppressed suggesting some decomposition of the structure.
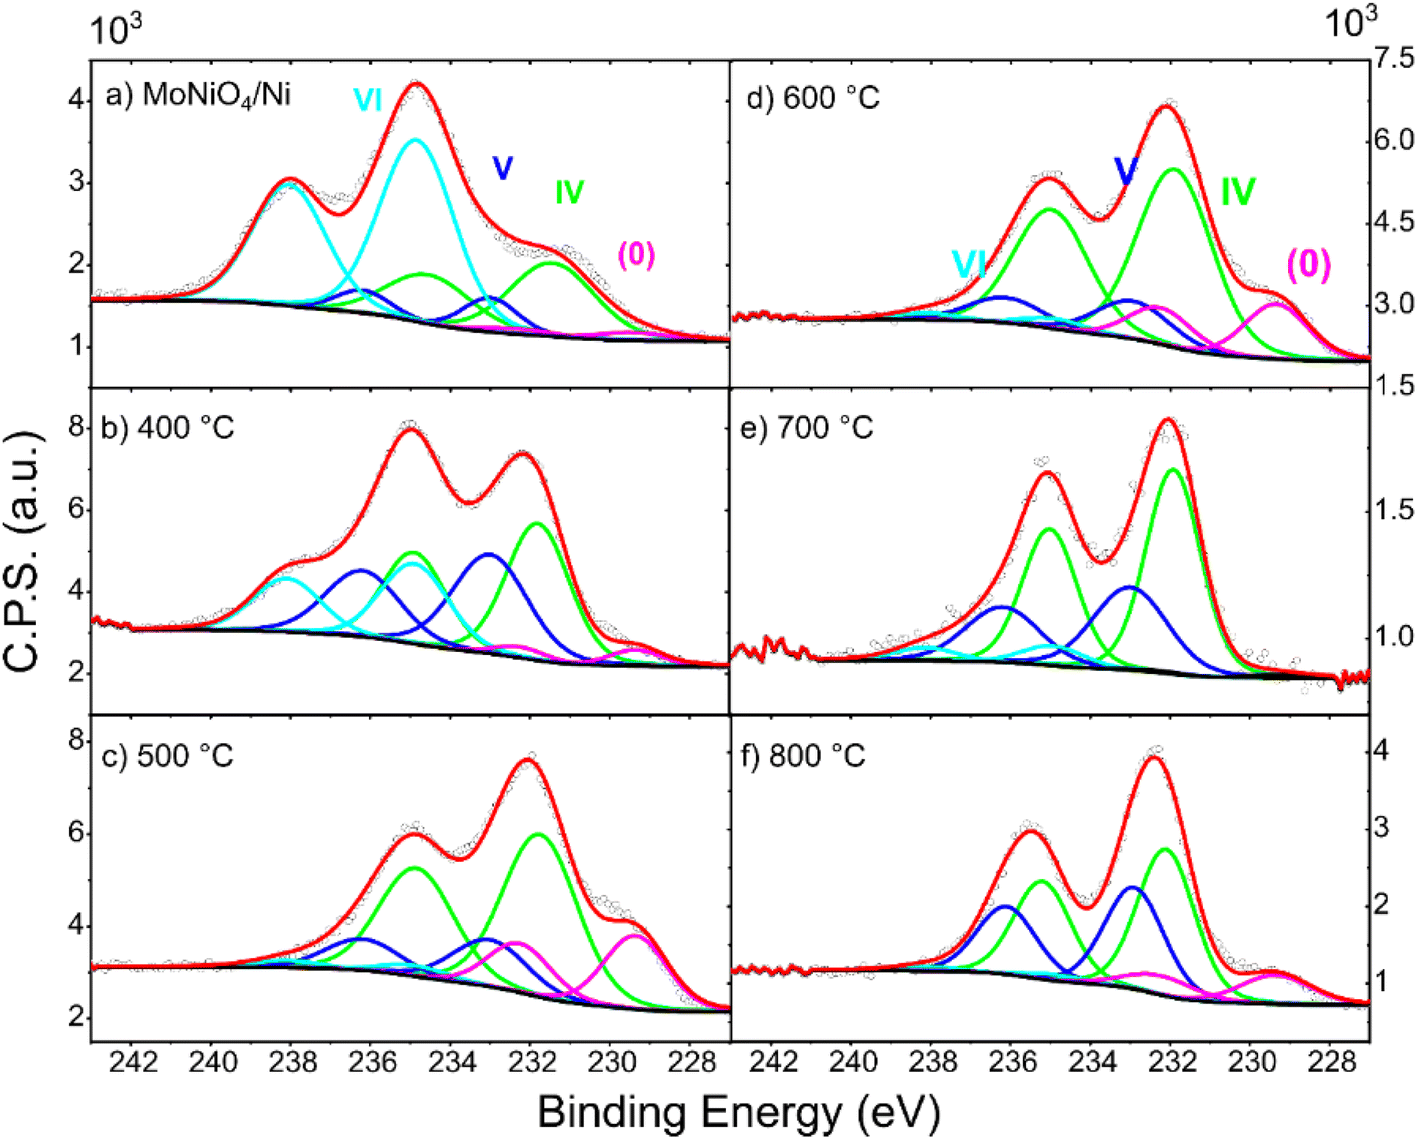 | ||
| Fig. 3 Mo XPS spectra of (a) MoNiO4 and (b–f) MoO2/Ni treated at various annealing temperatures. | ||
Transmission electron microscopy (TEM) and scanning TEM (STEM) micrographs (Fig. 4) of the sample treated at 400 °C show a relatively low surface roughness of the rods with no apparent formation of nanoparticle structures. High-resolution TEM (HRTEM) analysis reveals an extended crystalline structure along all the rods. Selected area electron diffraction (SAED) analysis confirms lattice fringes that can be indexed as NiMoO4 (see also Fig. S6†).
 | ||
| Fig. 4 MoO2/Ni (400) sample: representative STEM micrograph (left side, scale bar 200 nm); HRTEM micrograph (center, scale bar 10 nm) and selected area HRTEM image (right side, scale bar 4 nm) with related FFT (false color). | ||
After annealing at 600 °C, STEM and TEM micrographs show a marked roughening of the rod surfaces which rather than being smooth appear more like agglomerated particles (Fig. 5). HRTEM analysis carried out at the surface of this sample shows mainly nanostructured crystallites that by lattice fringes analysis can be ascribed to MoO2 (see also Fig. S7†). The results suggest migration of Mo species to the surface of the rods, leading to the formation of a polycrystalline surface including mostly MoO2 and a smaller amount of Ni-enriched Mo mixed oxide nano-crystallites. STEM EDX mapping and analysis of a selected area transversal to the main rod-length confirm the Mo-enrichment on the outer layer of about 200–250 nm (Fig. 6).
 | ||
| Fig. 5 MoO2/Ni – 600 °C sample: representative STEM micrograph (left side top, above scale bar 200 nm); TEM micrograph (left side bottom, above scale bar 100 nm); HRTEM micrograph (center, scale bar 20 nm) and selected area HRTEM images (right side, both scale bar 2 nm) with related FFT (false color). | ||
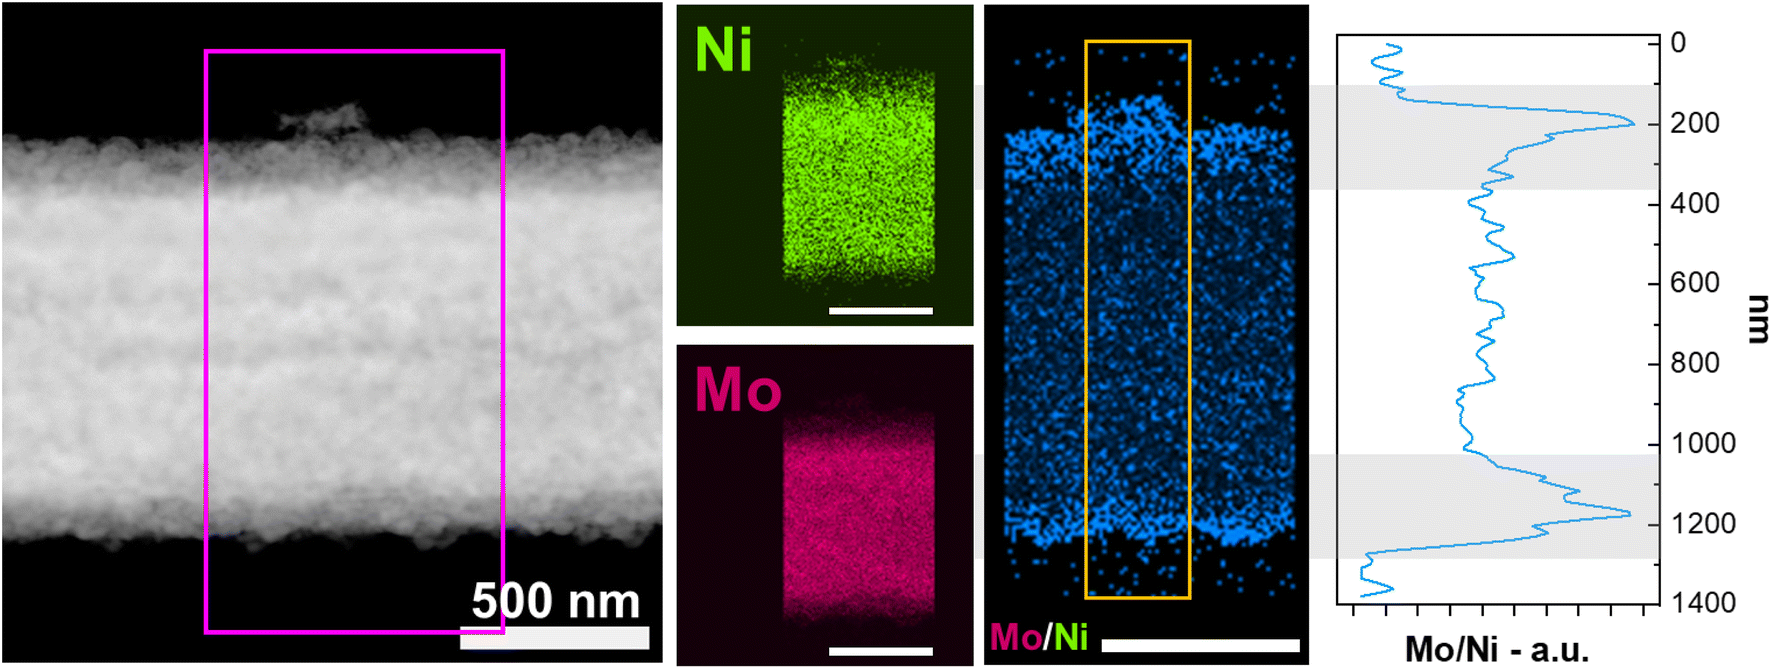 | ||
| Fig. 6 STEM micrograph and related EDX elemental mapping for Ni and Mo and the calculated Mo/Ni ratio for MoO2/Ni (600). | ||
STEM analysis of the sample prepared at 800 °C reveals a drastic change in the morphology of the sample; the rod-like appearance is replaced by a smoothed and twisted collapsed structure (Fig. S8†). The presence of Ni is confirmed by elemental analysis; however, no evidence of surface Ni4Mo alloy formation (XPS) and no distinct Ni4Mo surface alloy particles are observed (HR-TEM). By contrast, the surface is enriched with Mo rather than Ni. Previously it has been claimed that these synthesis conditions favor the formation of distinct Ni4Mo alloy particles on the surface of MoO2 rods and attribute increased HER activity to these sites.31,32 The results reported here attribute activity enhancement to the formation of a MoO2 enriched surface.33 MoO2 possesses a nanorod-like structure with a high surface area and also a high electrical conductivity because it has a distorted rutile structure34 and its bonding involves delocalization of some of the Mo electrons in the conduction band.35–38
3.2 AEM water electrolysis cell testing
The 5 cm2 MoO2/Ni cathodes were incorporated into a commercial AEM (Fumatech FAA-3-PK-130) together with a 5 cm2 nickel foam as an OER anode electrode in a water electrolysis test cell. The cell was fed with 1 M KOH on the anode side, while the cathode compartment was connected to a flow meter to monitor the H2 produced. The electrolysis cells were evaluated by obtaining polarization curves from 0 to 2 V at 10 mV s−1. The cell temperature was controlled at 60 °C.The polarization curves obtained at 25 and 60 °C are shown in Fig. 7a and b. At both cell temperatures (25 and 60 °C), the cathode prepared at 600 °C exhibits the highest current density reaching 0.55 A cm−2 at 2 V. A volcano type plot is observed when the current density recorded at 2 V is plotted against annealing temperature (Fig. 7c). The LSV and EIS results for the cathodes confirm the best HER activity and conductivity for MoO2/Ni (600) (Fig. S2–S4†). The current state of the art alkaline HER catalyst is nanoparticle Pt/C. The LSV HER curve of MoO2/Ni (600) is compared to that of a commercial Pt/C catalyst in Fig. S2.† The LSV curve of the precursor NiMoO4/Ni is also shown in Fig. S2.† The high surface area nanoparticle Pt catalyst has higher HER activity than the non PGM Ni–Mo materials. The improvement in activity after reductive annealing is clear from the comparison between MoO2/Ni (600) and NiMoO4/Ni. The increase in the porous structure of MoO2/Ni (600) should provide more active sites for electrolysis. In order to estimate the increase in surface area, the electrochemically active surface area (ECSA) was measured to obtain the double-layer capacitance (Cdl) using a cyclic voltammetry technique, which is linearly proportional to the ECSA. As shown in Fig. S13 and Table S3,† the Cdl of MoO2/Ni (600) (3.22 mF cm−2) is in the range of Cdl values of similar materials recently reported. Additionally, the Brunauer–Emmett–Teller (BET) technique was also performed to measure the specific surface area (13 m2 g−1). The precursor NiMoO4/Ni has a much smaller surface area that could not be measured reliably using the BET method.
 | ||
| Fig. 7 Linear sweep voltammetry carried out at (a) 25 and (b) 60 °C, and the extrapolated volcano plot (c). (d) Cell voltage and H2 production monitored at 0.5 A cm−2, 60 °C, and 1 M KOH to the anode. | ||
The practical use in an industrial AEM electrolyser will require stability over many thousands of hours. To this end, we have tested the best performing cathode MoO2/Ni (600) in the electrolyser fed with 1 M KOH at 60 °C for two weeks. The cell was set at a constant current density of 0.5 A cm−2 and the cell voltage and hydrogen production were monitored over the period of the test (Fig. 7d). During the test, the cell voltage remained stable at around 1.85 V with a cell voltage-based energy cost of 49.4 kW h kg−1 H2. The faradaic efficiency based on the measured H2 at the cathode outlet is 82.4%. Analysis of the cathode electrode after the two-week test was undertaken. XPS analysis does not evidence significant changes in the speciation of the cathode electrode surface while SEM images indicate no change in the surface morphology after operation (Fig. S11 and S12†). With no evidence of other parasitic reactions or degradation of membranes or electrodes, we believe that non gas tight tubing and gaskets are responsible for the faradaic efficiency below 100%. A comparison of the AEMWE performance of the MoO2/Ni(600) – FAA-3-PK130 – nickel foam MEA with recent reports of cell data with Ni–Mo cathode catalysts is shown in Table S4.† Clearly, cell performance also depends on the nature of the anode catalyst as well as the membrane used. We have used reference materials (commercial membrane and simple nickel foam) to concentrate on comparing the cathode materials. Appropriate combinations with high performance AEMs and ionomers can produce higher performance.39 Long term stability required for AEM electrolysers operating at 80+ °C for many thousands of hours will also require alternative membranes that avoid quaternary ammonium groups on the backbone polymer.40
3.3 Electrochemical stability characterization
The SFC-ICP-MS technique was used to study the electrochemical dissolution of Ni and Mo for each of the MoO2/Ni cathodes prepared at 400, 500, 600 and 700 °C (Fig. 8). Regarding nickel, the signal was always below the detection limit (1 ppt), demonstrating that only molybdenum electrochemically dissolves under these conditions. In Step I, a potential of −0.2 V vs. RHE was applied in order to evaluate dissolution during hydrogen evolution. A major contribution to the dissolution of Mo occurs for all samples initially upon coming into contact with the electrolyte solution (known as the contact peak).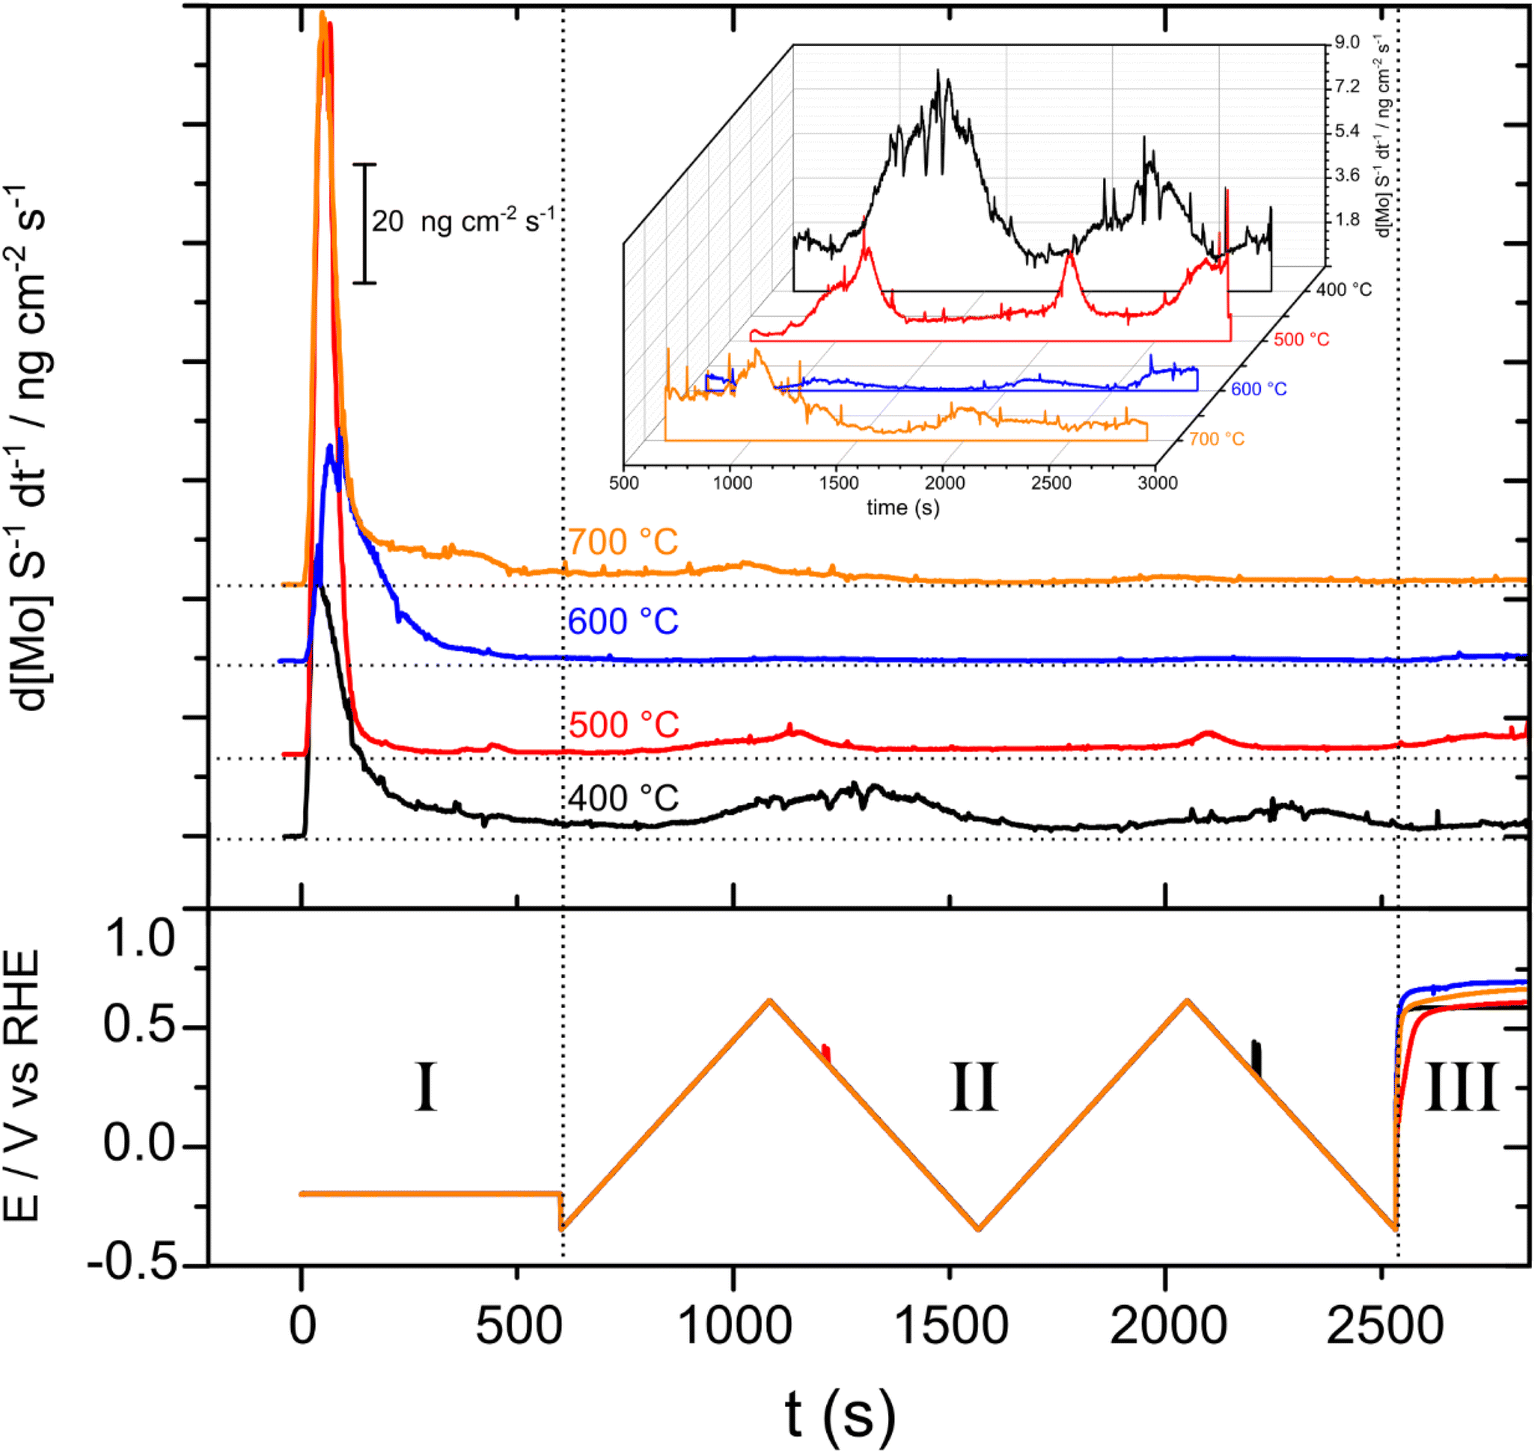 | ||
| Fig. 8 Dissolution profiles obtained by the SFC-ICP-MS technique for each sample. Top: dissolution rate as a function of time; bottom: applied potential as a function of time during the electrochemical protocol. The inset shows in detail the region from 500 s to 2900 s. | ||
During Step II, two consecutive CVs were recorded over a wide potential window in order to determine the onset potential for dissolution and the amount of dissolved species. From here two major features associated with Mo dissolution are clearly visible. The onset of dissolution differs for each sample (measured during the first CV) (Table S2†). It is interesting that the highest onset potential for Mo electrochemical dissolution belongs to the MoO2/Ni (600 °C) sample which shows the best performance for the HER and also the lowest dissolved amounts among the series (Fig. S10†). Lastly, in Step III, the working electrode is held at OCP, so any Mo dissolution under these conditions arises due to corrosion occurring at the OCP (which as can be seen is at anodic potentials above 0.5 V). As reported previously, the dissolution of Mo has been shown to occur from surface Ni–Mo alloys under HER relevant conditions.22,41 An activity decrease at a positive potential due to the dissolution of Mo oxides is a cause of performance loss. This will present stability issues, especially during the intermittent operation of industrial electrolyzers (the cathode potential changes in the anodic direction immediately after the electrolyzer is disconnected from the power source).42 The results reported here show that the MoO2 surface that forms at 600 °C during synthesis is less prone to Mo electrochemical dissolution. The amount of Mo dissolution from MoO2/Ni (600) during the electrochemical experiments was estimated to be 0.05%, using the initial Mo loading deposited on the working electrode (0.1148 mg) and the amount of dissolved Mo (53.8 ng). These results suggest that strategies may be developed to avoid such a dissolution phenomenon by appropriate tuning of the surface speciation.
3.4 Zero-gap laboratory-scale anion exchange membrane alkaline water electrolysis stack
We prepared larger MoO2/Ni electrodes as circular 10 cm diameter disks (geometrical area 78.5 cm2). First, a single electrode was tested. A comparison of the load curves measured with bare Ni foam and MoO2/Ni cathodes is shown in Fig. 9. The MoO2/Ni cathode exhibits enhanced activity compared to bare nickel foam. At 25 °C a current density of 230 mA cm−2 was achieved at cell voltages of 2.28 and 2.0 V for bare and MoO2/Ni respectively. At 40 °C performance improved for both cells. In the case of the Ni foam cathode, the cell voltage decreases approximately by 0.11 V (4.8%), while the cell voltage with MoO2/Ni drops by 0.14 V (7.0%). At 40 °C MoO2/Ni operates at a cell voltage of 0.31 V (14.3%) lower than bare Ni foam. This confirms the general trend of improved performance with higher temperature and high activity for MoO2/Ni. A stability test at a constant current density of 0.2 A cm−2 (25 °C) using MoO2/Ni showed stable performance as the cell voltage increase evaluated by linear regression of the measured points was 7.4 μV hour−1. The average value of the cell voltage was (1.948 ± 0.003) V, i.e. the average cell voltage fluctuates by only 0.15% during the test. | ||
| Fig. 9 Load curves of the alkaline water electrolysis using different cathodes (blue), nickel foam and (red) MoO2/Ni 600 °C. The Ni foam anode, geometrical area: 78.5 cm2, 1 mol dm−3 KOH, liquid electrolyte flow rate: 1 cm3 min−1 cm−2, at 25 °C (1 and 3) and 40 °C (2 and 4), PSEBS-CM-DABCO membrane. Stability testing using a MoO2/Ni (600) modified Ni foam cathode. Ni foam anode, geometrical area: 78.5 cm2, 1 mol dm−3 KOH, liquid electrolyte flow rate: 1 cm3 min−1 cm−2, temperature indicated in the figure inset, PSEBS-CM-DABCO membrane, current density: 200 mA cm−2, temperature: 25 °C. | ||
EIS was used to characterize the single cell performance in order to gain deeper insight into the behaviour of the MoO2/Ni electrode. The data obtained by EIS are summarised in Fig. 10.
 | ||
| Fig. 10 Dependence of the Rp1, Rp2 and Rpor with cell voltage evaluated from EIS data by the equivalent circuit method, cell operating temperatures: 25 and 40 °C. A Ni foam anode, MoO2/Ni cathode, 78.5 cm2 electrode geometrical area, frequency range of 25 kHz–0.01 Hz and maximal amplitude of the perturbing signal of 30 mV were used. | ||
Based on the results shown in Fig. 10 and due to the experimental setup used, an attempt to relate Rp values to defined phenomena can be made, although it is based only on indirect evidence. Rp1 and Rp2 values show exponential dependence on the cell voltage, identifying them as the polarisation resistances of the electrochemical reactions. As the oxygen evolution reaction was in this particular case not catalysed and because of the nature of the OER (more complex process with 4 electrons exchanged), higher polarisation resistance (Rp1) is attributed to the anodic reaction. This is in agreement with observation of Vincent et al.,43 who showed that anode resistance is higher at particular cell voltages when compare to cathode resistance. Correspondingly, polarisation resistance Rp2 is assigned to the cathodic hydrogen evolution reaction. The Rpor value then corresponds to the resistance of the liquid electrolyte in the pores of the Ni foam electrodes. This assignment is in agreement with the dependence of the Rpor values on the cell voltage showing linear character.
In the next step, a short-stack consisting of three cells was assembled. The performance of the short-stack in the form of polarisation curves is shown in Fig. 11.
 | ||
| Fig. 11 Load curves of the short-stack. Cathode: MoO2/Ni; anode: Ni foam; geometrical area: 78.5 cm2; 1 mol dm−3 KOH solution; flow rate: 1 cm−3 cm−2 min−1; separator: PSEBS-CM-DABCO (180 μm in the dry state) anion-selective polymer membrane. | ||
Load curves recorded for the short stack indicate lower performance when compared to the single cell experiment, as can be seen in Fig. 11, which derive from stack architecture and mass transport phenomenon. In order to understand this observation, EIS of the short stack was performed. The information obtained for the selected current densities for the average value of the cell in the short-stack is summarised in Fig. 12. Ohmic resistance per single cell under open circuit conditions in the short stack increased from 0.011 and 0.009 Ω observed for the single cell experiment, to 0.020 and 0.016 Ω for 25 and 40 °C respectively. This observation is also confirmed by the load curve shape showing clear linear dependence at higher current loads. The reason for this is a more complex arrangement of the stack leading to more significant ohmic losses. In order to obtain more information on the ohmic resistance, EIS was used to determine the Rs value.
 | ||
| Fig. 12 Values of the one average cell in short-stack resistance (Rs) evaluated by EIS on a 3 cell short-stack under current load. Cathode: MoO2/Ni; anode: Ni foam; geometrical area: 78.5 cm2; 1 mol dm−3 KOH solution; flow rate: 1 cm−3 cm−2 min−1; separator: PSEBS-CM-DABCO (180 μm in the dry state) anion-selective polymer membrane. Frequency range: 40 kHz–0.01 Hz; current amplitude ±5% of the current range. | ||
From Fig. 12, it is possible to see that the Rs value increases with the current density at both temperatures. This indicates accumulation of the gaseous phase in the short-stack, which increases the ohmic resistance of the electrolyte by filling the porous structure of the electrode. At the same time, the values of Rs are lower for a temperature of 40 °C, which is given by the higher ionic conductivity of both liquid and polymer electrolytes. Interestingly, Rs values decreased initially under the current load. This might be due to the presence of additional transport phenomena, which are present under current load (electroosmotic flux). Rs values obtained for 50 and 100 mA cm−2 show the same values at a temperature of 25 °C, but a slight increase at 40 °C.
4 Conclusions
In this article, we investigate the surface nanostructure-activity relationship for the alkaline hydrogen evolution reaction on MoO2/Ni electrodes prepared by hydrothermal and reductive annealing treatment. A volcano plot of HER activity with respect to annealing temperature is obtained with the best activity shown after annealing at 600 °C. XPS, SEM and HR-TEM analyses indicate that the increase in activity is associated with an enriched MoO2 surface of the nano-rod arrays. Our results also suggest that the Ni4Mo alloy is not involved in the enhanced HER activity as reported previously as this species was not found on the surface of the rods. On-line electrochemical dissolution studies have pointed out how MoO2/Ni obtained at 600 °C exhibits improved stability compared to the other materials, due to the formation of more stable MoO2 phases on the surface. In the second phase of this investigation circular MoO2/Ni cathode electrodes of 78.5 cm2 area were prepared and incorporated into a three-cell AEM electrolyser stack. This study demonstrates that MoO2/Ni cathodes with optimized surface structures can be readily prepared with large geometric surface areas and be employed in multi-cell AEM electrolysers. This study hence opens the door to the future application of these electrodes on an industrial scale.Conflicts of interest
There are no conflicts to declare.Acknowledgements
The authors thank the Italian ministry MISE for funding through the FISR 2019 project AMPERE (FISR2019_01294), the Italian ministry MUR through the PRIN 2017 Project (2017YH9MRK), “Novel Multilayered and Micro-Machined Electrode Nano-Architectures for Electrocatalytic Applications (Fuel Cells and Electrolysers)” and the project MISSION INNOVATION” POA 2021-2023, Hydrogen demo valley: Infrastructure polifunzionali per la sperimentazione e dimostrazione delle tecnologie dell'idrogeno. We also thank B. Cortigiani for his assistance in using the CeTeCS platform and acknowledge “progetto Dipartimenti di Eccellenza 2018–2022 (ref. no. B96C1700020008)” and Fondazione Ente Cassa di Risparmio di Firenze for financial support. We also thank the European Regional Development Fund Project “Fuel Cells with Low Platinum Content” (No. CZ.02.1.01/0.0/0.0/16_025/0007414).References
- J. Andrews and B. Shabani, Int. J. Hydrogen Energy, 2012, 37, 1184–1203 CrossRef CAS.
- I. Staffell, D. Scamman, A. V. Abad, P. Balcombe, P. E. Dodds, P. Ekins, N. Shah and K. R. Ward, Energy Environ. Sci., 2019, 12, 463–491 RSC.
- D. Apostolou, P. Enevoldsen and G. Xydis, Int. J. Hydrogen Energy, 2019, 44, 9675–9689 CrossRef CAS.
- K. Schoots, F. Ferioli, G. J. Kramer and B. C. C. van der Zwaan, Int. J. Hydrogen Energy, 2008, 33, 2630–2645 CrossRef CAS.
- J. Proost, Int. J. Hydrogen Energy, 2019, 44, 4406–4413 CrossRef CAS.
- P. Nikolaidis and A. Poullikkas, Renewable Sustainable Energy Rev., 2017, 67, 597–611 CrossRef CAS.
- M. Carmo, D. L. Fritz, J. Merge and D. Stolten, Int. J. Hydrogen Energy, 2013, 38, 4901–4934 CrossRef CAS.
- S. Sabihuddin, A. E. Kiprakis and M. Mueller, Energies, 2015, 8, 172–216 CrossRef.
- O. Schmidt, A. Gambhir, I. Staffell, A. Hawkes, J. Nelson and S. Few, Int. J. Hydrogen Energy, 2017, 42, 30470–30492 CrossRef CAS.
- S. M. Saba, M. Muller, M. Robinius and D. Stolten, Int. J. Hydrogen Energy, 2018, 43, 1209–1223 CrossRef CAS.
- Hydrogen Science and Engineering, Vol. 1 and 2: Materials, Processes, Systems, and Technology, ed. P. D. D. Stolten and D. B. Emonts, Wiley-VCH, 2016 Search PubMed.
- Y. X. Yang, P. Li, X. B. Zheng, W. P. Sun, S. X. Dou, T. Y. Ma and H. G. Pan, Chem. Soc. Rev., 2022, 1209–1223 Search PubMed.
- K. E. Ayers, E. B. Anderson, C. B. Capuano, B. D. Carter, L. T. Dalton, G. Hanlon, J. Manco and M. Niedzwiecki, Polymer Electrolyte Fuel Cells 10, Pts 1 and 2, Springer Handbook of Electrochemical Energy, 2010, pp. 649–711 Search PubMed.
- S. A. Grigoriev, V. N. Fateev, D. G. Bessarabov and P. Millet, Int. J. Hydrogen Energy, 2020, 45, 26036–26058 CrossRef CAS.
- H. A. Miller, K. Bouzek, J. Hnat, S. Loos, C. I. Bernaecker, T. Weissgarber, L. Rontzsch and J. Meier-Haack, Sustainable Energy Fuels, 2020, 4, 2114–2133 RSC.
- G. A. Lindquist, S. Z. Oener, R. Krivina, A. R. Motz, A. Keane, C. Capuano, K. E. Ayers and S. W. Boettcher, ACS Appl. Mater. Interfaces, 2021, 13, 51917–51924 CrossRef CAS PubMed.
- N. Chen, S. Y. Paek, J. Y. Lee, J. H. Park, S. Y. Lee and Y. M. Lee, Energy Environ. Sci., 2021, 14, 6338–6348 RSC.
- P. Z. Chen and X. L. Hu, Adv. Energy Mater., 2020, 10, 2002285 CrossRef CAS.
- Y. Yang, C. R. Peltier, R. Zeng, R. Schimmenti, Q. H. Li, X. Huang, Z. F. Yan, G. Potsi, R. Selhorst, X. Y. Lu, W. X. Xu, M. Tader, A. V. Soudackov, H. G. Zhang, M. Krumov, E. Murray, P. T. Xu, J. Hitt, L. X. Xu, H. Y. Ko, B. G. Ernst, C. Bundschu, A. Luo, D. Markovich, M. X. Hu, C. He, H. S. Wang, J. Y. Fang, R. A. DiStasio, L. F. Kourkoutis, A. Singer, K. J. T. Noonan, L. Xiao, L. Zhuang, B. S. Pivovar, P. Zelenay, E. Herrero, J. M. Feliu, J. Suntivich, E. P. Giannelis, S. Hammes-Schiffer, T. Arias, M. Mavrikakis, T. E. Mallouk, J. D. Brock, D. A. Muller, F. J. DiSalvo, G. W. Coates and H. D. Abruna, Chem. Rev., 2022, 122, 6117–6321 CrossRef CAS PubMed.
- N. Y. Du, C. Roy, R. Peach, M. Turnbull, S. Thiele and C. Bock, Chem. Rev., 2022, 122, 11830–11895 CrossRef CAS PubMed.
- Y. Y. Chen, Y. Zhang, X. Zhang, T. Tang, H. Luo, S. Niu, Z. H. Dai, L. J. Wan and J. S. Hu, Adv. Mater., 2017, 29, 1703311 CrossRef PubMed.
- M. Schalenbach, F. D. Speck, M. Ledendecker, O. Kasian, D. Goehl, A. M. Mingers, B. Breitbach, H. Springer, S. Cherevko and K. J. J. Mayrhofer, Electrochim. Acta, 2018, 259, 1154–1161 CrossRef CAS.
- J. Hnát, M. Plevová, J. Žitka, M. Paidar and K. Bouzek, Electrochim. Acta, 2017, 248, 547–555 CrossRef.
- A. Lasia, Modeling of Impedance of Porous Electrodes, in Modeling and Numerical Simulations, Modern Aspects of Electrochemistry, Springer, New York, NY, 2008, vol. 43, pp. 67–137 Search PubMed.
- P. Girault, J. L. Grosseau-Poussard, J. F. Dinhut and L. Marechal, Nucl. Instrum. Methods Phys. Res., Sect. B, 2001, 174, 439–452 CrossRef CAS.
- J. Hnat, R. Kodym, K. Denk, M. Paidar, J. Zitka and K. Bouzek, Chem.-Ing.-Tech., 2019, 91, 821–832 CrossRef CAS.
- M. Klinger, J. Appl. Crystallogr., 2017, 50, 1226–1234 CrossRef CAS.
- M. C. Biesinger, L. W. M. Lau, A. R. Gerson and R. S. C. Smart, Phys. Chem. Chem. Phys., 2012, 14, 2434–2442 RSC.
- D. O. Scanlon, G. W. Watson, D. J. Payne, G. R. Atkinson, R. G. Egdell and D. S. L. Law, J. Phys. Chem. C, 2010, 114, 4636–4645 CrossRef CAS.
- J. Baltrusaitis, B. Mendoza-Sanchez, V. Fernandez, R. Veenstra, N. Dukstiene, A. Roberts and N. Fairley, Appl. Surf. Sci., 2015, 326, 151–161 CrossRef CAS.
- J. Zhang, T. Wang, P. Liu, Z. Q. Liao, S. H. Liu, X. D. Zhuang, M. W. Chen, E. Zschech and X. L. Feng, Nat. Commun., 2017, 8, 15437 CrossRef CAS PubMed.
- E. Zschech, E. Topal, K. Kutukova, J. Gluch, M. Loeffler, S. Werner, P. Guttmann, G. Schneider, Z. Q. Liao and J. Timoshenko, Micron, 2022, 158 Search PubMed.
- Y. S. Jin and P. K. Shen, J. Mater. Chem. A, 2015, 3, 20080–20085 RSC.
- J. Horkans and M. W. Shafer, J. Electrochem. Soc., 1977, 124, 1202–1207 CrossRef CAS.
- T. Yang, Y. S. Xu, H. H. Lv, M. Wang, X. J. Cui, G. B. Liu and L. H. Jiang, ACS Sustainable Chem. Eng., 2021, 9, 13106–13113 CrossRef CAS.
- X. Liu, K. Ni, C. J. Niu, R. T. Guo, W. Xi, Z. Y. Wang, J. S. Meng, J. T. Li, Y. W. Zhu, P. J. Wu, Q. Li, J. Luo, X. J. Wu and L. Q. Mai, ACS Catal., 2019, 9, 2275–2285 CrossRef CAS.
- J. A. Bau, S. M. Kozlov, L. M. Azofra, S. Ould-Chikh, A. H. Emwas, H. Idriss, L. Cavallo and K. Takanabe, ACS Catal., 2020, 10, 12858–12866 CrossRef CAS.
- S. F. Deng, X. P. Liu, T. Huang, T. H. Zhao, Y. Lu, J. Y. Cheng, T. Shen, J. N. Liang and D. L. Wang, Electrochim. Acta, 2019, 324, 134892 CrossRef CAS.
- D. G. Li, E. J. Park, W. L. Zhu, Q. R. Shi, Y. Zhou, H. Y. Tian, Y. H. Lin, A. Serov, B. Zulevi, E. D. Baca, C. Fujimoto, H. T. Chung and Y. S. Kim, Nat. Energy, 2020, 5, 378–385 CrossRef CAS.
- H. H. Li, M. R. Kraglund, A. K. Reumert, X. R. Ren, D. Aili and J. S. Yang, J. Mater. Chem. A, 2019, 7, 17914–17922 RSC.
- L. Rossner, H. Schwarz, I. Veremchuk, R. Zerdoumi, T. Seyller and M. Armbruster, ACS Appl. Mater. Interfaces, 2021, 13, 23616–23626 CrossRef PubMed.
- H. A. Miller, Curr. Opin. Electrochem., 2022, 36, 101122 CrossRef CAS.
- I. Vincent, E. C. Lee and H. M. Kim, Sci. Rep., 2021, 11, 293 CrossRef CAS PubMed.
Footnote |
| † Electronic supplementary information (ESI) available. See DOI: https://doi.org/10.1039/d2ta09339a |
| This journal is © The Royal Society of Chemistry 2023 |