 Open Access Article
Self-assembly of metal–organosilicate on porous silica substrates for efficient CO2 hydrogenation to methanol†
Yu
Shao
 and
Hua Chun
Zeng
*
Integrative Sciences and Engineering Program, NUS Graduate School, Department of Chemical and Biomolecular Engineering, College of Design and Engineering, National University of Singapore, 10 Kent Ridge Crescent, 119260, Singapore. E-mail: chezhc@nus.edu.sg
First published on 6th January 2023
Abstract
CuZn-based nanocatalysts for the application of MeOH synthesis from the hydrogenation of CO2 have been well-studied in the past few decades. However, many research endeavours have focused on individual aspects of the catalyst design such as the engineering of the support structure alone. In this study, we demonstrate the multiplying effect of an integrated design of both the active phase and support architecture. An active phase consisting of Cu–ZnO nanoparticles embedded inside a microporous silica matrix was derived from a self-assembled copper–organosilicate shell coated on a porous spherical silica support. The surface-silanol-induced self-assembly was carried out via simple one-pot synthesis. The obtained catalyst achieved a specific MeOH yield of 1634 mg MeOH per g Cu per h at 260 °C, 30 barg, as well as long-term stability over a 200 h on-stream operation. These results are attributed to the small Cu–ZnO nanoparticle dimensions with their decent dispersion and blending facilitating the strong metal–support interaction (SMSI) and the spatial confinement effect of the microporous silica matrix. Moreover, the appropriate silica substrate not only promoted self-assembly during the catalyst synthesis but also enhanced the fluid dynamics inside the packed bed. As a result, a higher single-pass CO2 conversion was attained by the porous silica-supported active phase.
1 Introduction
Methanol (MeOH) synthesis from the hydrogenation of carbon dioxide (CO2) is one of the promising approaches for CO2 capture and utilization.1–4 The prevailing commercial catalysts for this application (e.g., Cu/ZnO/Al2O3) are usually prepared by the coprecipitation method.5,6 They are favoured by the facile preparation procedure and high metal content,5,6 yet this type of catalyst usually suffers from issues such as poor metal dispersion, high reverse water–gas shift (RWGS) activity, and underwhelming catalyst stability due to metal sintering under working conditions.1,2,7Fundamental studies on this application have recommended several desired features of CuZn-based catalysts. (i) Small-sized Cu nanoparticles with ZnO as a promoter. The major active sites for CuZn-based catalysts are widely recognized to be Cu edges and steps decorated with partially reduced ZnO5,6,8,9 owing to the strong metal–support interaction (SMSI).2,5,6,10,11 The smaller dimensions of Cu nanoparticles not only lead to better metal dispersion and utilization but also favour higher edge and step contents. Moreover, prior experimental and computational evidence suggests that smaller Cu nanoparticles facilitate the formation of CuZn alloy at the Cu–ZnO interface and hence improve catalytic performance.12 (ii) The containment of Cu agglomeration. Active Cu in commercial catalysts is prone to agglomeration, as experimental evidence has indicated a 25% reduction in the metal surface area under a reductive atmosphere in just over 6 h.8 During the reaction, water-induced Cu sintering can cause a near 50% drop in MeOH yield for commercial catalyst at 240 °C.12 (iii) The appropriate catalyst architecture. Although the mass transfer barrier is often considered negligible for this gas-phase reaction, previous studies have demonstrated the significance of catalyst architecture.12,13 It was found that for an identical catalyst composition, an ingeniously designed multivoid silica sphere demonstrated to be a superior support as compared to conventional mesoporous and rigid silica spheres.12
Due to the rapid development of nanotechnology over the past decades, researchers can prepare and engineer supported nanocatalysts with greater precision.14–17 Newer CuZn-based nanocatalysts usually consist of Cu and ZnO nanoparticles supported on cost-efficient materials (e.g., CuZn/SiO2), and they are endowed with the fine dispersion of active metal components and long-term catalyst stability.18–21 Although many endeavours were made toward the smart design of cost-effective and functional support materials, the introduction of the active phase is mostly done via incipient wetness impregnation.21,22 This method is simple, straightforward, and in many cases has resulted in the satisfactory dispersion of the metal components.23,24 However, this conventional approach has relatively poor control over the composition and morphology of individual metal nanoparticles, let alone the desired interaction between different metal components in the product catalysts. On the contrary, some researchers have focused their attention on the ingenious design and engineering of catalytic nanoparticles, yet only embedding them onto simple supports such as commercial silica gel.21 It is known that catalyst performance is a comprehensive result of various aspects of catalyst design.25 Therefore, one's attention should be directed toward an integrated design of nanocatalysts.
3-Aminopropyl trimethoxysilane (APTMS) is widely employed as a surface modifier in the incipient wetness impregnation approach.12,26–28 Interacting with the surface hydroxyl groups of substrates like SiO2 and TiO2 under anhydrous conditions, APTMS forms a self-assembled monolayer that facilitates the subsequent adsorption and dispersion of metal cations (Fig. S1a–c†).22,29 However, due to the lack of confinement after the removal of aminopropyl moieties during the heat treatment, the obtained nanoparticles usually exhibit less appreciable resistance against sintering. For instance, a recognizable performance drop was observed during the stability test for mesoporous silica-supported CuZn nanoparticles prepared by the surface modification–impregnation approach.12 Furthermore, for Cu nanoparticles embedded in small mesopores prepared via this method, pore blockage might occur and further impede the metal utilization. In our previous work, it was found that higher dimensional Cu2+–APTMS-derived material could generate a better confinement effect and catalyst stability.8 Under moist conditions, polymerized APTMS were found to form “mounds” on the substrate (Fig. S1d†).29 However, they have a less ordered structure for a controlled dispersion of metal cations. Alternatively, preparations of ordered multilayer structures from APTMS were reported with head-to-tail and head-to-head configurations, respectively (Fig. S1e and f†).30,31 Unfortunately, the formation of these multilayer configurations relies on electrostatic interactions and the positively charged ammonium cations are immobilized, which discourages the subsequent introduction of metal cations via ion-exchange.
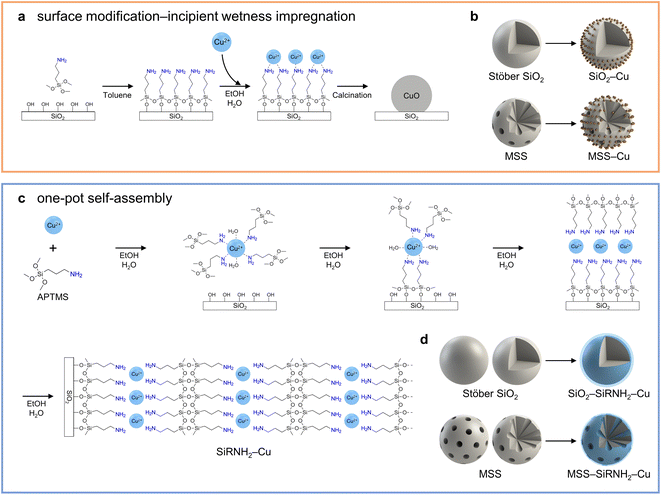
For preparations of silica-supported nanocatalysts, the conventional surface modification-incipient wetness impregnation method relies on the surface silanol or the coated APTMS monolayer to accommodate incoming metal ions, followed by calcination to immobilize the metal species (Scheme 1a). This multistep approach was also applied to different silica substrates as counterexamples in this work (Scheme 1b). Inspired by the charge-switching construction of multilayered assemblies, we present a one-pot synthesis of self-assembled metal–organosilicate (SiRNH2–Cu) on silica substrates (Scheme 1c). After the initial rapid Cu2+–amine complexation in aqueous media, the trimethoxysilane moieties react with the surface silanol of the silica substrate to form a monolayer. Under moist conditions, the exposed APTMS molecules further react to form a multilayered structure with alternative silicate tetrahedrons and Cu2+–alkylamine complexes. This approach was demonstrated to be versatile for different silica substrates (Scheme 1d), which allowed us to further investigate the structural effects of different supports. Unlike our previous work adopting a dissolution–polycondensation strategy,8 the copper–organosilicate is obtained via a bottom-up approach starting from molecular precursors in the present work to boost the atom economy of transition metals (i.e., copper and zinc) in heterogeneous catalysis. Moreover, after the introduction of the ZnO promoter and calcination workup, the obtained catalysts exhibited excellent catalytic performance in the MeOH synthesis from the hydrogenation of CO2.
2 Experimental section
2.1 Chemicals
The following chemicals were used as received without further purification: absolute ethanol (EtOH, Fisher, 99.99%), tetraethyl orthosilicate (TEOS, Aldrich, 99%), cetyltrimethylammonium bromide (CTAB, Aldrich, 96%), ammonia solution (NH3, Merck, 25% in water), 3-aminopropyl trimethoxysilane (APTMS, Sigma-Aldrich, 97%), copper(II) nitrate trihydrate (Cu(NO3)2·3H2O, Sigma-Aldrich, >99%), zinc(II) nitrate hexahydrate (Zn(NO3)2·6H2O, Sigma-Aldrich, 98%), and toluene (Fisher, analytical reagent grade). Deionized water was collected through an Elga Micromeg Purified Water system.2.2 Synthesis of macro-meso-microporous silica spheres (MSS)
The synthetic protocol of MSS was adopted from a previous study.32 In brief, 180 μL of TEOS, 150 mg of CTAB, and 600 μL of toluene were dissolved in 24 mL of ethanol via 10 min of stirring. Next, 0.75 mL of ammonia solution was mixed with 26 mL of deionized water. The two solutions were then mixed and aged at ambient temperature for 4 h. The product was collected via centrifugation, washed three times with ethanol, and dried in an electric oven at 60 °C overnight. The dried product was then calcined at 500 °C for 4 h in static laboratory air to remove the organic templates, with a ramp rate of 10 °C min−1.2.3 Synthesis of MSS–SiRNH2–Cu: the coating of MSS with a copper–organosilicate (SiRNH2–Cu) shell
In a typical synthesis, 400 mg of the as-prepared MSS sample (Section 2.2) was dispersed in 50 mL of deionized water via 15 min of ultrasonication; 80–400 mg of Cu(NO3)2·3H2O was dissolved in another 50 mL of deionized water. The MSS-suspension and Cu2+-solution were then added to a 500 mL round-bottom flask containing 100 mL of deionized water and 160 mL of ethanol, and the mixture was stirred at 55 °C for 15 min. Next, 520 μL of APTMS was added and the mixture was stirred at 55 °C for 20 h. The product was separated via centrifugation, washed with ethanol three times, and dried in an electric oven at 60 °C overnight.2.4 Synthesis of MSS–SiRNH2–Cu–Zn: introduction of Zn via heat-treatment
Here, 200 mg of the synthesised MSS–SiRNH2–Cu sample (Section 2.3) was dispersed in 40 mL of deionized water via 15 min of ultrasonication. A pre-decided amount (0 to 1250 mg) of Zn(NO3)2·6H2O was dissolved in the MSS–SiRNH2–Cu suspension in an 80 mL Teflon liner. The mixture was then sealed in an autoclave and heat-treated at 80 °C for 6.5 h. The product was collected through centrifugation, washed with ethanol twice, and dried overnight in an electric oven at 60 °C.2.5 Preparation of MSS–Si–Cu–Zn catalyst: calcination treatment
The MSS–SiRNH2–Cu–Zn sample (Section 2.4) was ground into a fine powder and calcined at 500 °C for 2 h in static laboratory air, with a ramp rate of 3 °C min−1.2.6 Synthesis of other substrates and catalysts
Detailed preparation procedures for other catalysts can be found in the ESI.†2.7 Catalytic hydrogenation of CO2 for MeOH synthesis
The MeOH synthesis via the catalytic CO2 hydrogenation reaction was performed with a continuous flow packed bed reactor. In a typical experiment, 200 mg of the evaluated catalyst (e.g., MSS–Si–Cu–Zn) was loaded into a 3/8-inch stainless steel tube reactor. The catalyst was reduced onsite at 300 °C for 3 h in a pure H2 flow (20 mL min−1) with a ramp rate of 10 °C min−1 from room temperature. The reactor was then pressurized to 30 barg after switching to a reaction gas mixture (72 vol% H2, 24 vol% CO2, and 4 vol% N2). Then, the flow rate was maintained at 50 STP mL min−1 (weight hourly space velocity (WHSV) of 15![[thin space (1/6-em)]](https://www.rsc.org/images/entities/char_2009.gif) 000 L h−1 kgcat−1) and the catalytic activity was evaluated at 200 to 280 °C with 20 °C intervals. The outlet gas stream was analysed with gas chromatography (GC, Agilent 7890A) coupled with a thermal conductivity detector (TCD) and a flame ionization detector (FID).
000 L h−1 kgcat−1) and the catalytic activity was evaluated at 200 to 280 °C with 20 °C intervals. The outlet gas stream was analysed with gas chromatography (GC, Agilent 7890A) coupled with a thermal conductivity detector (TCD) and a flame ionization detector (FID).
2.8 Materials characterisation
Compositional analysis was conducted with energy-dispersive X-ray spectroscopy (EDX, Oxford Instruments, model 7426) and inductively coupled plasma optical emission spectrometry (ICP-OES, Optima 7300DV, PerkinElmer). UV-visible spectra were obtained with a Shimadzu UV-2450. Sample morphology was characterised by field emission scanning electron microscopy (FESEM, JSM-7610FPlus, 5.0 kV, working distance: 6.7 mm), transmission electron microscopy (TEM, JEM-2010, 200 kV), and field emission TEM (FETEM, JEM-2100F, 200 kV). Surface texture information was obtained via N2 physisorption at 77 K (Micromeritics 3Flex). The surface compositions of the studied samples were analysed with X-ray photoelectron spectroscopy (XPS, AXIS-HSi, Kratos Analytical, Al Kα radiation, hν = 1486.71 eV). The binding energies of the studied elements were corrected against the characteristic adventitious carbon C 1s peak at 284.5 eV. Crystallographic information of the materials was revealed by powder X-ray diffraction (XRD, Bruker D8 Advance, Cu Kα radiation, λ = 1.5406 Å). Investigation of chemical bonding in studied materials was carried out with Fourier-transform infrared spectroscopy (FTIR, ATR, Bruker).3 Results and discussion
3.1 Surface silanol-induced self-assembly of copper–organosilicate (SiRNH2–Cu) on silica substrates
A thin shell of copper–organosilicate (SiRNH2–Cu) derived from Cu(NO3)2 and APTMS was successfully coated on different silica substrates, including rigid spheres (SiO2) and macro-meso-microporous silica spheres (MSS) with large mesopores (>20 nm), via a one-pot synthesis (Scheme 1c and d). As illustrated in Fig. S2,† SiO2 nanospheres (NSs) were prepared by a typical Stöber process.33 The monodisperse SiO2 NSs feature a solid interior and smooth surface (Fig. S3†), with a measured surface area of 8.7 m2 g−1. The MSS substrate was prepared in a CTAB-stabilized oil-in-water microemulsion system and the macro-, meso-, and micropores were derived from CTAB-stabilized toluene droplets and ethanol micelles (Fig. S2†).32 The prepared MSS substrate exhibited a hierarchical pore structure and a high surface area of 774 m2 g−1. When observed under TEM, numerous large conical pores (>20 nm) appeared to be the key feature of the MSS substrate, apart from the rough surface ensuing from the micro- and small mesopores (Fig. S4†). Both spherical substrates were ca. 500 nm in diameter.The self-assembly process was initiated with a drastic colour change of the synthetic mixture to deep blue upon mixing the silica substrates, APTMS, and Cu(NO3)2 in a water–ethanol mixture, indicating the spontaneous formation of Cu2+–amine (APTMS) complexes in the aqueous medium. The transition from [Cu(H2O)6]2+ to [Cu(RNH2)x(H2O)6−x]2+ (2 ≤ x ≤ 4) was substantiated by the blue shift of the UV-vis absorbance (Fig. S5†).34,35 After 24 h of reaction, the pale white silica samples (SiO2 and MSS) became a light cyan colour. A newly formed shell of SiRNH2–Cu was observed in their TEM images (Fig. 1). No Cu nanoparticles were detected for both samples (SiO2–SiRNH2–Cu and MSS–SiRNH2–Cu). In addition, we performed the control experiments: in the absence of APTMS, a mixture of MSS and Cu(NO3)2 resulted in the negligible adsorption of Cu species; in the absence of the MSS substrate, the mixture of APTMS and Cu(NO3)2 generated no precipitate in 3 days. Therefore, the simultaneous presence of a silica substrate, APTMS, and Cu(NO3)2 is crucial for this synthesis.
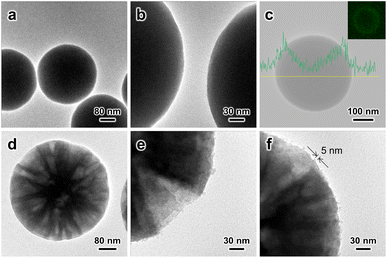 | ||
| Fig. 1 TEM images of (a, b) SiO2–SiRNH2–Cu and (d–f) MSS–SiRNH2–Cu. (c) EDX carbon element line profile of the SiO2–SiRNH2–Cu sample (inset: carbon element mapping). | ||
For the preparation of SiO2–SiRNH2–Cu (Fig. S6†), the initial SiRNH2–Cu loading was very low (estimated by Cu weight fraction, 0.32 wt%) due to the limited surface area of the SiO2 substrate (Fig. S6a–c†). Therefore, we attempted to promote the APTMS polycondensation by introducing ammonia and only obtained 0.35 wt% Cu (Fig. S6d–f†). This suggests that ammonia could not effectively facilitate the formation of SiRNH2–Cu, at least for the incorporation of Cu. Interestingly, it was found that by increasing the concentration of the SiO2 substrate to 10-fold while maintaining the same concentrations for other reactants, the Cu weight fraction in the obtained SiO2–SiRNH2–Cu could be increased to 0.74 wt% despite the much higher substrate amount (Fig. S6g–i†). This suggests that the formation of SiRNH2–Cu is closely related to the abundance of substrate surface silanol. The tremendous surface silanol due to the presence of the 10-fold concentration of substrate effectively promoted the self-assembly of SiRNH2–Cu, achieving a much higher total Cu loading than the ammonia-catalysed process (0.74 wt% × 10 vs. 0.35 wt%). The EDX line profile and mapping of carbon element in SiO2–SiRNH2–Cu also univocally evidence the SiRNH2–Cu shell formation (Fig. 1c). Hence, we may conclude that both ammonia and surface silanol can promote the APTMS hydrolysis and polymerization, but an appropriate amount of surface silanol is crucial for the gradual incorporation of Cu. Therefore, larger amounts of SiRNH2–Cu may be coated on the MSS (4.5 wt% Cu) support due to its remarkably higher surface area of 774 m2 g−1 (Fig. 1d–i). For the MSS substrate, threadlike SiRNH2–Cu was formed, which can be identified by TEM (ca. 5 nm; Fig. 1f). With the sufficiently large mesopores (>20 nm) being the key feature of the MSS substrate, pore congestion might become an issue that impedes the accessibility of the Cu species in the desired heterogeneous catalysis. A previous study has indicated that with the pore dimension being adequately large, the confined growth of the organosilica shell should not lead to pore-filling.36 It was subsequently verified by our N2 physisorption studies that the large pores were preserved in the obtained MSS–SiRNH2–Cu and its derived catalysts.
The one-pot self-assembly process was carried out in an aqueous medium (water–ethanol, Scheme 1c), which should be distinguished from the conventional surface modification under anhydrous conditions (toluene, Scheme 1a). The latter leads to the formation of a self-assembled monolayer that could only accommodate a limited amount of incoming metal ions. More importantly, the monolayer usually decomposes during the calcination treatment and could not provide any spatial confinement of the generated metal nanoparticles. On the other hand, in contrast to other synthesis processes conducted in aqueous media, our approach requires no acid/base catalyst and incorporates metal species in a one-pot synthesis. Notably, other multilayer organosilicas do not encourage the uptake of metal cations because of the chemical environment around the amine groups (Fig. S1†).
3.2 Synthesis of the MSS-supported CuZn catalyst
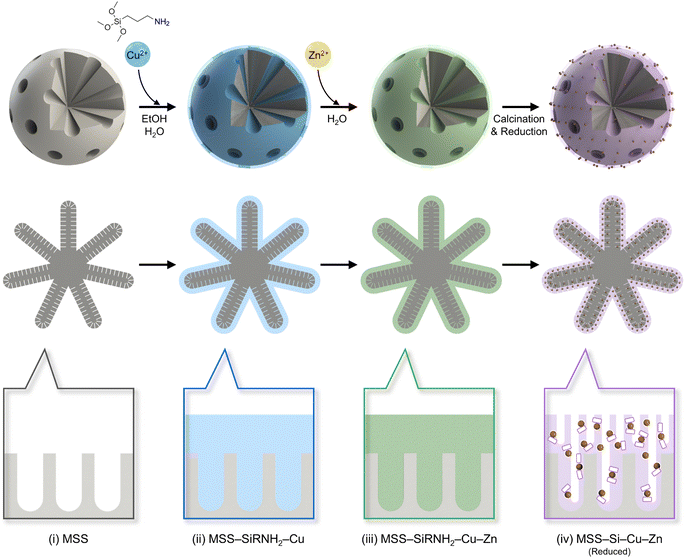
As discussed above, the self-assembly of SiRNH2–Cu was successfully performed on both SiO2 NS and MSS substrates. Here, we exemplify the work-up process to obtain supported CuZn nanocatalysts from MSS (Scheme 2).The MSS substrate shows a hybrid type I/IV isotherm for N2 physisorption with a high adsorption volume at low P/P0 and a hysteresis loop (Fig. 2a), indicating a hierarchy of macro-meso-micropores.37 The hysteresis loop is unlikely to be a result of particle aggregation according to our TEM observation (Fig. S4†). The pore size distribution was further calculated based on NLDFT and BJH methods (Fig. S7 and S8†). Owing to the abundant micropores, MSS exhibited an extraordinarily large surface area of 774 m2 g−1 and is therefore rich in surface silanol groups. However, after coating the SiRNH2–Cu shell, the surface area decreased sharply to 96 m2 g−1 and the small micro- and mesopores (<5 nm) essentially diminished, implying a full coverage of the original surface texture (Fig. 2b). In contrast, since the observed SiRNH2–Cu threads were only 5 nm thick (Fig. 1f), larger pores (>20 nm) were well-preserved (Fig. 2c). Therefore, the obtained MSS–SiRNH2–Cu adopted the original contour of the MSS substrate as illustrated in Scheme 2. Moreover, by adjusting the Cu(NO3)2 amount, the Cu contents could be controlled between 3.4 to 6.2 wt% (Table S1 and Fig. S9–S13†).
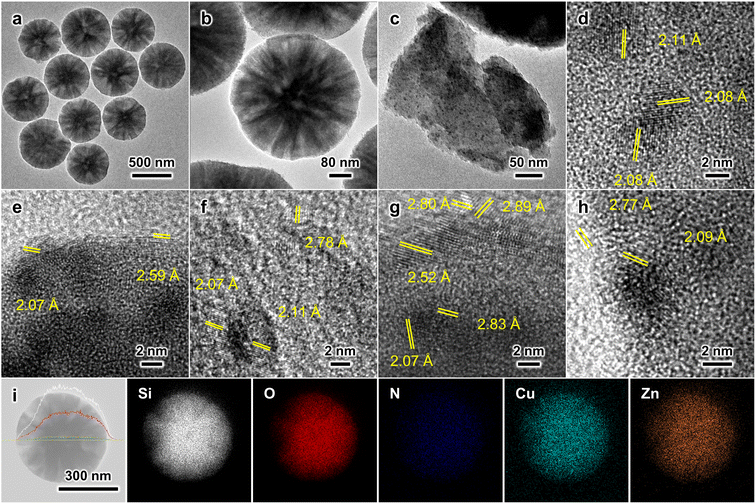
Next, Zn species were introduced via simple heat treatment in water with Zn(NO3)2 precursor. ZnO is widely reported to be an effective promoter of MeOH synthesis from the hydrogenation of CO2.6,9 First, being a physical spacer, ZnO improves the Cu dispersion while mitigating the Cu sintering.2,5,6 Second, through the well-documented SMSI, partially reduced ZnO migrates to the Cu edges potentially via the Kirkendall effect,38 and such a Cu–ZnO interface is considered a major active site for binding crucial intermediates.5 The formation of the CuZn alloy at the interface is frequently reported and the favoured intermediate binding is endorsed by computational studies.12 After Zn introduction, the particle surface became rather coarse, and the emerging granules were recognized to be ZnO nanoparticles from the characteristic lattice fringes of ZnO(100) with a d-spacing of ∼2.78 Å (Fig. 3a–f). EDX elemental analysis corroborates the co-existence of Cu and Zn in the MSS–SiRNH2–Cu–Zn sample (Fig. 3g). The sample has a Type IV N2 physisorption isotherm with a type H4 hysteresis loop resulting from slit-like mesopores of 4.7 nm, which are likely the grooves between the newly formed ZnO nanoparticles (Fig. 2c). Furthermore, Zn can be incorporated in different amounts by simply adjusting the precursor concentration (Fig. S14–S24†). As a result, the Cu and Zn contents in the obtained catalysts can be manipulated at our discretion (Table S1†). Since Zn2+ and Cu2+ ions share identical charges and similar radii, Zn2+ ions easily migrate into the SiRNH2–Cu matrix with a surplus of alkylamine ligands and mix well with Cu2+. The excess Zn(NO3)2 then ended up as hydroxides on the external surface of the particle and decomposed into ZnO.
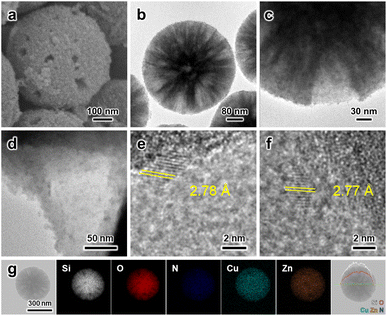 | ||
| Fig. 3 (a–f) SEM and TEM images of MSS–SiRNH2–Cu–Zn. (g) EDX elemental mapping and line scan of MSS–SiRNH2–Cu–Zn. | ||
The obtained MSS–SiRNH2–Cu–Zn samples were then subjected to calcination treatment to remove the alkylamine ligands and transform all the Cu and Zn species into their oxides. It is important to immobilize the metal species at this stage to prevent sintering during reduction, as well as to blend them into a mixed oxide with improved metal dispersion. TEM observation revealed smaller granules of ZnO on the external surface, which suggests an improved dispersion (Fig. 4a–d). The characteristic Zn(100) lattice fringe in a d-spacing of 2.81 Å was again observed for nanoparticles at the edges; meanwhile, Cu(111) lattice fringes (d-spacing = 2.06 Å) were recognized after continued exposure under the TEM electron beam (Fig. 4e and f). Lastly, the composition of the MSS–Si–Cu–Zn sample was verified by EDX analysis (Fig. 4g). The N2 physisorption isotherm was similar to the uncalcined sample, except for a higher adsorption volume at low P/P0, due to an increased micropore volume (Fig. 2a). Unlike the micropores in the MSS substrate, the newly formed micropores should originate from the evacuated gallery space of the layered SiRNH2–M (M = Cu, Zn) structure.8 They ensure the accessibility of the embedded Cu and Zn species during the subsequent reaction as illustrated in Scheme 2, and also lead to a restored surface area of 349 m2 g−1.
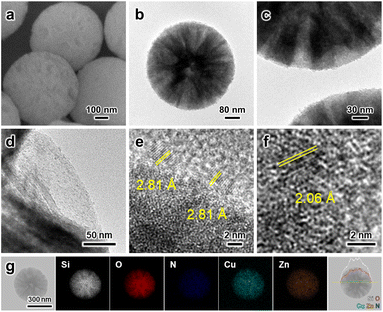 | ||
| Fig. 4 (a–f) SEM and TEM images of MSS–Si–Cu–Zn. (g) EDX elemental mapping and line scan of MSS–Si–Cu–Zn. | ||
Compositional evolution of the surface region was tracked with the XPS technique, reflecting the sequential coating of SiRNH2–Cu, the introduction of Zn, and the removal of alkylamine ligands (Fig. S25†). Detailed XPS and XAES analyses were performed on the MSS–SiRNH2–Cu, MSS–SiRNH2–Cu–Zn, and MSS–Si–Cu–Zn samples to probe the chemical states of major elements. In the MSS–SiRNH2–Cu sample (Fig. S26†), the majority of the N species were in the form of alkylamine,39 while all the Cu species existed in the 2+ valence state.40 These are in good agreement with the proposed structure (Scheme 1c). For the MSS–SiRNH2–Cu–Zn sample (Fig. S27†), N remains as R-NH2, and both Cu and Zn are in the 2+ valence state,40,41 corresponding to amine-coordinated Cu/Zn and ZnO. After the calcination treatment, all N 1s signals vanished, signifying the complete removal of alkylamine ligands in the gallery space, while both XPS and XAES analyses of Cu and Zn species suggest that they were transformed into their oxide forms (Fig. S28 and S29†). Deconvolution of the Cu 2p3/2 region suggests a combination of Cu2+ (935.5 eV, with satellite features) and Cu+ (933.2 eV) valence states,42,43 while the Cu LMM Auger peak corroborates the two chemical states. Meanwhile, the Zn 2p3/2 peak indicates a unimodal Zn2+ chemical state (1022.4 eV),44 with the Zn LMM peak found at 986.9 eV accompanying a shoulder feature attributed to Zn(1+δ)+.45 Furthermore, we performed XRD and FTIR analyses on MSS–Si–Cu–Zn catalysts at different synthetic stages, as well as various compositions (Fig. S30–S37†). Nonetheless, only the characteristic XRD reflections of amorphous SiO2 at 2θ = 23° were pronounced for all synthetic stages, due to the thin shell thickness of SiRNH2–Cu and the derived CuZn–silicate phase (Fig. S30†). Owing to their high degree of dispersion, typical CuO and ZnO reflections are not recognizable. Meanwhile, some FTIR absorptions were detected at 1085, 800, and 445 cm−1, which are ascribed to the asymmetric, symmetric stretching, and bending vibrations of Si–O–Si in SiO4 tetrahedra, respectively (Fig. S31†).46–48 The Si–OH stretching vibration was also found at 963 cm−1.49
Overall, starting with the MSS substrate with a hierarchical macro-meso-microporous structure, a thin layer of SiRNH2–Cu could be coated via a self-assembly process induced by the rich surface groups of silanol. According to our previous study, Cu2+ should achieve an atom-level dispersion in this precursor owing to the coordinating effect of alkylamine ligands.8 The layered structure also facilitated the introduction, fine dispersion, and mixing of Zn species. Eventually, after a calcination step, the SiRNH2–Cu–Zn phase was transformed into CuZn mixed-oxides confined within a microporous silica matrix, where the micropores ensued from the vacated gallery space previously occupied by metal–alkylamine complexes.8 Owing to the excellent dispersion of the CuZn mixed-oxides and the confinement effect of the microporous silica matrix, the obtained MSS–Si–Cu–Zn should derive a competent catalyst for the MeOH synthesis from the hydrogenation of CO2.
3.3 MSS–Si–Cu–Zn as a catalyst for MeOH synthesis from the hydrogenation of CO2
The as-prepared MSS–Si–Cu–Zn catalysts with various compositions were tested in the CO2-to-MeOH reaction, with commercial Cu/ZnO/Al2O3 catalyst as the performance benchmark. The reaction was performed under a mild pressure of 30 barg and at temperatures ranging from 200 to 280 °C at a 20 °C interval, using a feed mixture gas stream (72% H2, 24% CO2, 4% N2) at a weight hourly space velocity (WHSV) of 15![[thin space (1/6-em)]](https://www.rsc.org/images/entities/char_2009.gif) 000 L h−1 kgcat−1. Under steady-state operation, MeOH and CO were the only products detected and measured by GC in the effluent stream, while water was discarded and not measured. It is worth noting that sometimes the CO quantity is below the detection threshold of the GC instrument, and hence the reported 100% MeOH selectivity may not be accurate (at low reaction temperatures). Other anticipatable products such as methane, dimethyl ether, and ethanol were not detected. Catalytic activities of various MSS–Si–Cu–Zn catalysts are presented in Fig. 5, mainly focusing on three performance indicators: the Cu-specific MeOH yield (mg MeOH per g Cu per h), MeOH selectivity (%), and Cu-specific CO2 activity (mmol CO2 reacted per g Cu per h).
000 L h−1 kgcat−1. Under steady-state operation, MeOH and CO were the only products detected and measured by GC in the effluent stream, while water was discarded and not measured. It is worth noting that sometimes the CO quantity is below the detection threshold of the GC instrument, and hence the reported 100% MeOH selectivity may not be accurate (at low reaction temperatures). Other anticipatable products such as methane, dimethyl ether, and ethanol were not detected. Catalytic activities of various MSS–Si–Cu–Zn catalysts are presented in Fig. 5, mainly focusing on three performance indicators: the Cu-specific MeOH yield (mg MeOH per g Cu per h), MeOH selectivity (%), and Cu-specific CO2 activity (mmol CO2 reacted per g Cu per h).
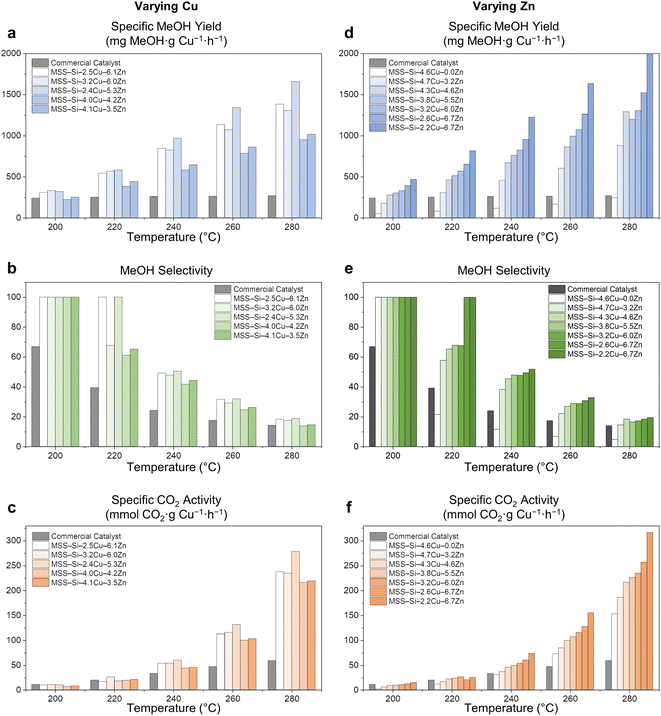 | ||
Fig. 5 Catalytic performance evaluation of MSS–Si–Cu–Zn catalysts with various Cu and Zn loadings. (a, d) Cu-specific MeOH yield (mg MeOH per g Cu per h). (b, e) MeOH selectivity (%). (c, f) Cu-specific CO2 activity (mmol CO2 per g Cu per h). Left column: catalyst samples with varying Cu precursors but the same Zn precursor (Table S1,† entries 10, 13–16); right column: catalyst sample prepared with the same Cu precursor but varying Zn precursors (Table S1,† entries 6–12) (reaction conditions: 200 mg catalyst, reaction mixture gas (72 vol% H2, 24 vol% CO2, and 4 vol% N2) with space velocity of 15![[thin space (1/6-em)]](https://www.rsc.org/images/entities/char_2009.gif) 000 L h−1 kgcat−1, 30 barg, 200–280 °C with 20 °C steps). Nomenclature for samples: MSS–Si–xCu–yZn denotes samples with x wt% Cu and y wt% Zn. 000 L h−1 kgcat−1, 30 barg, 200–280 °C with 20 °C steps). Nomenclature for samples: MSS–Si–xCu–yZn denotes samples with x wt% Cu and y wt% Zn. | ||
Charts on the left manifest the results of catalysts prepared with varied Cu(NO3)2 precursor amounts, with a fixed amount of Zn(NO3)2 (Table S1,† entries 10, 13–16), while charts on the right display those of catalysts prepared with fixed Cu and varied Zn (Table S1,† entries 6–12). Overall, the Zn-containing sample mostly exhibited better catalytic performance, with higher specific MeOH yield, specific CO2 activity, and MeOH selectivity, as compared to the benchmark commercial catalyst (Cu/ZnO/Al2O3), Alfa Aesar, 60–68 wt% CuO (more information is available in Fig. S38†) at all temperatures tested (200–280 °C). Regardless of the varied composition of our MSS-supported CuZn catalysts, they exhibited better specific CO2 activity than the commercial catalyst due to the improved Cu–ZnO dispersion since a high Cu surface area was attested to be crucial in this application.1,6 In particular, the specific CO2 activity at 280 °C for MSS–Si–2.2Cu–6.7Zn could be as high as 7-fold that for the commercial catalyst (Fig. 5f). To the best of our knowledge, the obtained specific MeOH yields by our catalysts are among the best of the state-of-the-art CuZn/SiO2 catalysts in the literature (Table S2†). The incorporation of Zn is pivotal in modulating the catalyst selectivity toward MeOH, as evidenced by the results of two catalysts with similar Cu contents, MSS–Si–4.6Cu–0Zn and MSS–Si–4.7Cu–3.2Zn (Fig. 5d and e), while its effect on CO2 activity seems to be less remarkable (Fig. 5f). Since the CuZn catalyst for CO2 hydrogenation to MeOH reaction has been well studied, it is commonly accepted that ZnO functions as a physical spacer that improves the Cu dispersion,2,5,6 which is accountable for the improvement in specific CO2 activity. More importantly, the synergistic SMSI between the ZnO and Cu phases remarkably improves the electronic structure at the Cu–ZnO interface and results in a higher MeOH yield.2 Overall, lower Cu-to-Zn ratios in the catalyst samples seem to correlate with better catalyst performance (Fig. 5), corroborating our previous finding that higher Zn content could effectively improve the dispersion of the Cu phase and lead to higher catalyst activity.8 It is noteworthy that our catalysts can accommodate more Zn, with the Zn-to-Cu ratio easily going beyond 1. In comparison, in conventional malachite-type catalysts derived from the coprecipitation method, the Zn proportion hardly exceeds 30% because of the difference between Zn2+ and the Jahn–Teller ion Cu2+.6 Although a multistep protocol is required, our catalyst is superior in many aspects: (i) its cost-efficiency, due to the better utilization or higher atom economy of transition metals; (ii) its controlled synthesis and tailorable composition; (iii) its improved selectivity and enduring stability.
A stability test was performed with MSS–Si–3.2Cu–6.0Zn at a pressure of 30 barg, a temperature of 260 °C, and WHSV of 15![[thin space (1/6-em)]](https://www.rsc.org/images/entities/char_2009.gif) 000 L h−1 kgcat−1 (Fig. 6). The continuous online test lasted for more than 200 h and the catalyst delivered a stable performance, demonstrating its excellent stability. Furthermore, it was noticed that the specific yield of MeOH gradually increased, accompanying a decline in the CO production (Fig. 6). This observation was explained by a minor in situ reconfiguration of the catalyst under a reductive environment, leading to strengthened SMSI and more active sites.12 The MSS–Si–3.2Cu–6.0Zn catalyst underwent the 200 h stability test, was quenched to ambient temperature and purged with N2, before its catalytic activity was again tested with the standard procedure between 200 to 280 °C (Fig. S39†). The improved catalytic performance could be well replicated for the catalyst. Therefore, we may conclude that our catalyst demonstrated excellent stability, without observable activity deterioration in the MeOH yield over 200 h.
000 L h−1 kgcat−1 (Fig. 6). The continuous online test lasted for more than 200 h and the catalyst delivered a stable performance, demonstrating its excellent stability. Furthermore, it was noticed that the specific yield of MeOH gradually increased, accompanying a decline in the CO production (Fig. 6). This observation was explained by a minor in situ reconfiguration of the catalyst under a reductive environment, leading to strengthened SMSI and more active sites.12 The MSS–Si–3.2Cu–6.0Zn catalyst underwent the 200 h stability test, was quenched to ambient temperature and purged with N2, before its catalytic activity was again tested with the standard procedure between 200 to 280 °C (Fig. S39†). The improved catalytic performance could be well replicated for the catalyst. Therefore, we may conclude that our catalyst demonstrated excellent stability, without observable activity deterioration in the MeOH yield over 200 h.
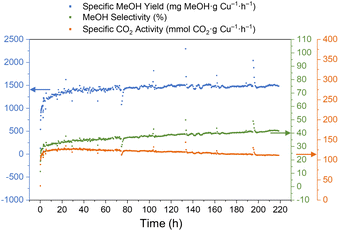 | ||
Fig. 6 The 200 h stability test results (test conditions: 200 mg MSS–Si–3.2Cu–6.0Zn catalyst, 30 barg, 260 °C with 50 mL min−1 mixture gas (WHSV = 15![[thin space (1/6-em)]](https://www.rsc.org/images/entities/char_2009.gif) 000 L h−1 kgcat−1)). 000 L h−1 kgcat−1)). | ||
3.4 Ex situ characterisation of MSS–Si–Cu–Zn catalysts
TEM images revealed that the structure of individual MSS–Si–Cu–Zn particles remained intact after the CO2 hydrogenation, and no particle agglomeration took place (Fig. 7a and b). Nanoparticles of high image contrast emerged after the reaction, and they are more conspicuous on a thin fragment exfoliated from the spherical catalyst (Fig. 7c). Interpretation of the lattice fringes (2.08 Å) manifested by these nanoparticles confirmed their identity to be metallic Cu (Fig. 7d). Measurements indicate that these Cu nanoparticles are <5 nm in diameter; such a small size of Cu nanoparticles is crucial to the high catalytic activity observed: (i) smaller nanoparticles lead to higher specific surface area and more Cu atoms exposed, which was reported to be linearly proportional to the catalyst activity.9,50,51 (ii) Smaller nanoparticles possess more edges, steps, and other defects compared to bulk particles. Under-coordinated Cu was found to be the species responsible for binding reaction intermediates in the hydrogenation of the C–O bond.52 (iii) Smaller nanoparticles favour the CuZn alloy formation at particle edges. Recently, our group has demonstrated the stronger affinity of important intermediates (e.g., formate) toward Zn-incorporated Cu edges on smaller CuZn alloy nanoparticles with direct experimental evidence and density functional theory (DFT) calculations.12 On the contrary, the Cu crystallite size in the spent Cu/ZnO/Al2O3 catalyst was estimated to be 9.5 nm (Fig. S38†). In addition, we have identified ZnO nanoparticles displaying lattice fringes with d-spacings of 2.52, 2.59 and 2.80 Å corresponding to ZnO(101), (002), and (100), respectively. More importantly, these low-contrast ZnO nanoparticles are present in close vicinity to the high-contrast Cu nanoparticles (Fig. 7e–h), favouring the synergy between Cu and ZnO.5,6 EDX elemental mappings confirmed that there is no metal agglomeration (Fig. 7i). Additional TEM and SEM characterisation of the spent MSS–Si–Cu–Zn catalysts with various compositions can also be found in Fig. S40–S50.†XPS and XAES analyses indicate that a large fraction of copper showed a valence state of Cu0/1+ (Cu 2p3/2 of 932.7 eV),42 which are both deemed as the active species in CO2 hydrogenation (Fig. S51 and S52†).52 Cu2+ peaks with satellite features (Cu 2p3/2 of 935.1 eV) are attributed to oxidized surface Cu during the sample preparation in ambient conditions.42,43 As for the Zn LMM XAES spectrum, apart from the component representing the major ZnO phase (987.4 eV), a considerably intensified shoulder feature was observed (Fig. S52b†), indicating a higher fraction of partially reduced Zn(1+δ)+ due to the SMSI at the Cu–ZnO interface.45 Moreover, a separate minor peak is observed at ca. 1000 eV, characteristic of metallic Zn. This is attributed to reduced Zn incorporated into the Cu defect sites, forming the CuZn alloy, which was also observed in our previous studies.8,45 Therefore, the catalyst surface composition substantiates the occurrence of SMSI between the adjacent Cu and ZnO nanoparticles. The XRD and FTIR results of the spent MSS–Si–Cu–Zn catalysts are less informative due to the preeminent features of the silica substrate (Fig. S53 and S54†). Overall, the ex situ characterisations of the spent catalyst revealed the fine dispersion of active species (Cu–ZnO) as small, neighbouring nanoparticles. XPS and XAES analyses also confirmed the partial reduction of ZnO and formation of CuZn alloy at their interface via SMSI.
3.5 SiRNH2–Cu-derived catalyst vs. incipient wetness impregnation
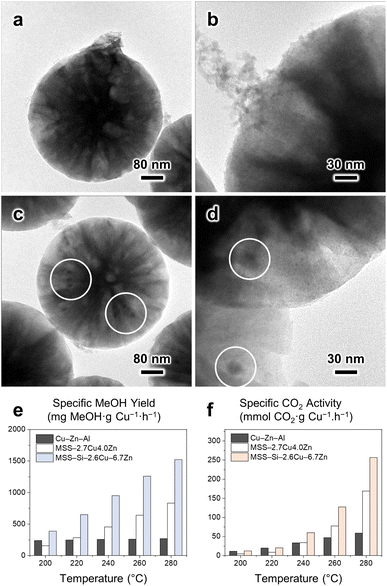
CuZn-based nanocatalysts supported on prefabricated structures are conventionally prepared via the incipient wetness impregnation method (Scheme 1a).12,21,23 To demonstrate the advantages of our SiRNH2–Cu self-assembly approach (Scheme 1c), we compared the CuZn catalysts prepared by the two methods on SiO2 (rigid sphere) and MSS substrates. The catalyst preparation was adopted from another study,12 where the silica substrate is first amine-functionalized with APTMS to improve its surface affinity toward incoming metal cations; then, Cu2+ and Zn2+ are introduced via amine-assisted metal adsorption using their nitrate salts under aqueous conditions, followed by a calcination treatment to immobilize them (Scheme 1b, denoted as MSS–CuZn and SiO2–CuZn).Due to the monolayer arrangement of APTMS coated under conventional anhydrous conditions (in toluene, Scheme 1a), much less Cu2+ and Zn2+ can be accommodated by the limited amount of surface alkylamine. The excess metal nitrates introduced ended up as aggregates of oxide nanoflakes loosely bound to the MSS substrate (Fig. 8a, b and S55†). To obtain better metal dispersion by eliminating such aggregates, a plausible answer would be increasing the surface alkylamine population to accommodate more metal cations. However, reported methods either led to “mounds” of entangled APTMS or organized multilayers containing no metal cation (Fig. S1d–f†). Unfortunately, neither of them has additional exposed amine moieties to accept extra incoming metal cations. In contrast, the simultaneous silane polycondensation and Cu–amine complexation resulted in the self-assembly of SiRNH2–Cu multilayers (Scheme 1c), which could accommodate higher metal content without forming aggregates on substrates with a given surface area. As expected, no agglomeration of oxide nanoparticle was detected in our SiRNH2–Cu-derived catalyst (Fig. 4). In addition, the SiRNH2–Cu approach was able to disperse the metal species in the outermost thin layer, and upon activation, the generated Cu–ZnO nanoparticles are highly accessible by the reactant molecules. As a result, the finer metal dispersion in the pre-catalyst and high reactant accessibility in the working catalyst led to better MeOH yield and catalyst activity (Fig. 8e, f and S56†).
In the spent MSS–CuZn catalyst, the metal species were found to agglomerate into large nanoparticles (∼20 nm, circled area; Fig. 8c and d) during the reaction. This is attributed to the lack of confinement after the removal of the surface APTMS monolayer (Scheme 1a). On the contrary, in SiRNH2–Cu-derived MSS–Si–Cu–Zn catalysts, the growth of Cu nanoparticles was suppressed to <5 nm (Fig. 7). During the calcination treatment, the alkylamine groups decomposed but the silica phase remained intact. This led to the formation of microporous gallery spaces between the silica layers,8 as detected via N2 physisorption (Fig. 2). The micropores were effective in confining the metal agglomeration and led to smaller Cu nanoparticles. Furthermore, it also led to enhanced catalyst stability (Fig. 6). In contrast, catalysts derived from surface modification-incipient wetness impregnation usually do not exhibit such high stability.12
The confinement effect is more remarkable with SiO2 substrates, where spatial confinement by the support architecture is not applicable (Fig. S57†). SiO2–CuZn was prepared with a similar surface modification-incipient wetness impregnation method. Without the spatial confinement of the porous structure, oxide and metal aggregates spanning across >400 nm were detected (Fig. S57†). As expected, we observed a significant drop in catalyst activity after the SiO2–CuZn catalyst was operated at 280 °C for 3 h (Fig. S58†). Clearly distinguished reflections of metal and metal oxides were also recognized in the fresh and spent catalysts prepared with the incipient wetness impregnation approach (Fig. S59†).
3.6 Enhanced flow patterns in a packed bed: MSS vs. SiO2
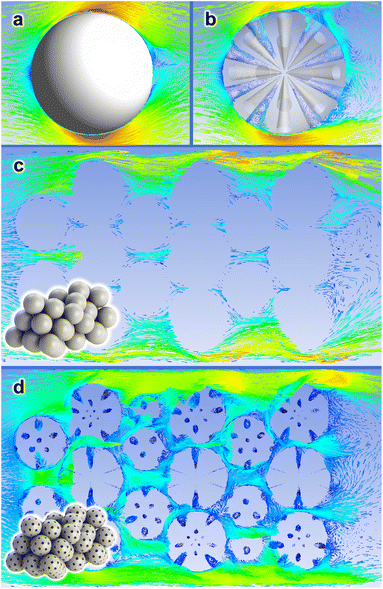
In Section 3.1, we demonstrated that the self-assembly of the SiRNH2–Cu shell can be induced by different silica substrates (SiO2 and MSS); in Section 3.5, the technical merits of this approach over conventional incipient wetness impregnation have been testified, as it may accommodate higher metal loading and provide better confinement. As discussed above (Fig. 2), the SiRNH2–Cu shell essentially covered up the microscopic surface texture including micro- and mesopores (<5 nm); meanwhile, the conical large pores (>20 nm) of MSS substrates are well-preserved in the final MSS–Si–Cu–Zn catalyst. Therefore, we may approximate the contours of the working catalysts (SiO2–Si–Cu–Zn and MSS–Si–Cu–Zn) with SiO2 and MSS substrates, respectively. In contrast to rigid SiO2 spheres, MSS supports having large pores (>20 nm) may generate an improved flow pattern for the targeted gas-phase reaction.For a demonstrative illustration, the flow behaviours of a gas stream against different catalyst configurations are approximated by CFD simulations (ANSYS Fluent 19.0R software). Scheme 3 depicts these behaviours by velocity vector plots over a cross-sectional plane intersecting the studied configurations. First, we studied the flow pattern around an isolated particle and the gas stream is “slipping” on the surface of a rigid SiO2 sphere (Scheme 3a). On the contrary, the flow pattern appears turbulent for MSS, and many vortexes were spotted inside the pores (Scheme 3b). This may imply an extended residence time of the reactant molecules and a higher chance of their collision with the active catalyst species. On the one hand, for a packed bed of rigid spheres placed in a narrow enclosure, which resembles the actual packed catalyst bed, the gas stream slips through the voids among the particles rather smoothly (Scheme 3c). On the other hand, for a packed bed of MSS, the flow pattern is distorted, and the gas stream appears to travel across a more tortuous pathway (Scheme 3d). The velocity vectors are less well-aligned with the overall flow direction and vortexes are detected inside the pores. Overall, we should expect a higher residence time of the reactants and thus fuller interactions with surface active components by the MSS substrate than the SiO2 in a packed bed.
CFD simulations recommend more tortuous flow pathways of a gas stream across the packed bed of MSS, and vortexes inside the large pores (>20 nm) with significantly lower velocity (Scheme 3). The effective dilation of the gas stream leads to longer residence time and thus we expect higher single-pass conversion in MSS than its spherical counterparts. Moreover, limited by the small surface area of SiO2 NS (8.7 m2 g−1), the Cu loading is still limited to 0.74 wt% (SiO2–SiRNH2–Cu). The same preparation procedures were applied to the SiO2–SiRNH2–Cu to obtain a SiO2–Si–Cu–Zn catalyst (0.3 wt% Cu and 0.9 wt% Zn, Fig. S60†). Unlike its counterpart prepared with the incipient wetness impregnation method (Fig. S57†), the Cu nanoparticles were confined to a diameter of ca. 5 nm. This apparent difference advocates for the excellent confinement effect of the microporous silica matrix derived from the SiRNH2–Cu precursor.
The single-pass conversions of the SiO2 and MSS-supported CuZn catalysts (SiO2–CuZn, SiO2–Si–Cu–Zn, MSS–CuZn, and MSS–Si–Cu–Zn) are compared in Fig. 9. Due to the serious agglomeration of metal species in the two impregnation-derived catalysts, they exhibit considerably low single-pass conversion despite having similar Cu and Zn contents to our SiRNH2–Cu-derived CuZn active phase. For impregnation-derived catalysts, SiO2–CuZn and MSS–CuZn have similar metal contents, and MSS–CuZn exhibits higher single-pass conversion than SiO2–CuZn (Fig. 9). This is attributed to a combined effect of the spatial constraint on the metal agglomeration imposed by the porous structure and the improved fluid pattern in the different packed beds. For SiRNH2–Cu-derived catalysts, SiO2–Si–Cu–Zn operated at a rather low WHSV of 2500 L h−1 kgcat−1 and displayed similar single-pass conversions to those of MSS–Si–Cu–Zn operated at a much higher space velocity of 15![[thin space (1/6-em)]](https://www.rsc.org/images/entities/char_2009.gif) 000 L h−1 kgcat−1. At 280 °C, SiO2–Si–Cu–Zn manifested a single-pass conversion between those of MSS–Si–Cu–Zn operated at WHSVs of 15
000 L h−1 kgcat−1. At 280 °C, SiO2–Si–Cu–Zn manifested a single-pass conversion between those of MSS–Si–Cu–Zn operated at WHSVs of 15![[thin space (1/6-em)]](https://www.rsc.org/images/entities/char_2009.gif) 000 and 6000 L h−1 kgcat−1. In conclusion, due to the improvement of the fluid dynamic inside the packed bed, MSS-supported catalysts achieved higher single-pass conversion than SiO2 NS-supported catalysts, with a lower or the same space velocity for both impregnation and SiRNH2–Cu-derived catalysts (Fig. 9).
000 and 6000 L h−1 kgcat−1. In conclusion, due to the improvement of the fluid dynamic inside the packed bed, MSS-supported catalysts achieved higher single-pass conversion than SiO2 NS-supported catalysts, with a lower or the same space velocity for both impregnation and SiRNH2–Cu-derived catalysts (Fig. 9).
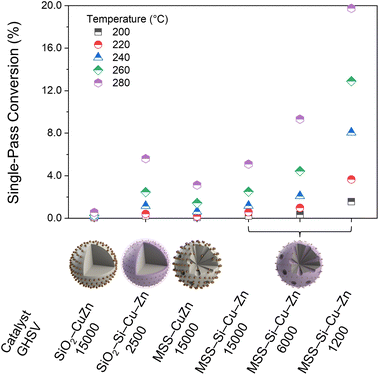 | ||
| Fig. 9 Single-pass conversions (%) of CO2 for various SiO2 NS and MSS-supported CuZn catalysts derived from incipient wetness impregnation and Cu–organosilicate coating methods. | ||
4 Conclusion
In this work, we demonstrate the integration of an advanced active phase design with an appropriate support architecture, resulting in a synergistic effect as compared to simple combinations of the two components. On the one hand, the MSS substrate facilitated the self-assembly of the SiRNH2–Cu shell with its high surface area; on the other hand, the porous structure of MSS was advantageous over conventional non-porous or mesoporous spherical silica supports in terms of fluid dynamics enhancement. The SiRNH2–Cu exhibited outstanding catalytic performance and long-term stability due to the derived fine Cu–ZnO nanoparticles and spatial confinement of the obtained microporous silica matrix. To achieve a higher atom economy of active metal elements for heterogeneous catalysis, we hope the integrated design and synthesis showcased in this study will inspire more comprehensive considerations in future nanocatalyst development.Conflicts of interest
There are no conflicts to declare.Acknowledgements
The authors gratefully acknowledge the financial supports provided by the National University of Singapore and the National Research Foundation (NRF), Prime Minister's Office, Singapore, under its Campus for Research Excellence and Technological Enterprise (CREATE) program.References
- X. Jiang, X. Nie, X. Guo, C. Song and J. G. Chen, Chem. Rev., 2020, 120, 7984–8034 CrossRef CAS PubMed.
- J. Zhong, X. Yang, Z. Wu, B. Liang, Y. Huang and T. Zhang, Chem. Soc. Rev., 2020, 49, 1385–1413 RSC.
- S. Zhou and H. C. Zeng, ACS Catal., 2022, 12, 9872–9886 CrossRef CAS.
- J. Wang, G. Zhang, J. Zhu, X. Zhang, F. Ding, A. Zhang, X. Guo and C. Song, ACS Catal., 2021, 11, 1406–1423 CrossRef CAS.
- M. Behrens, F. Studt, I. Kasatkin, S. Kuhl, M. Havecker, F. Abild-Pedersen, S. Zander, F. Girgsdies, P. Kurr, B. L. Kniep, M. Tovar, R. W. Fischer, J. K. Norskov and R. Schlogl, Science, 2012, 336, 893–897 CrossRef CAS PubMed.
- S. Zander, E. L. Kunkes, M. E. Schuster, J. Schumann, G. Weinberg, D. Teschner, N. Jacobsen, R. Schlögl and M. Behrens, Angew. Chem., Int. Ed., 2013, 52, 6536–6540 CrossRef CAS PubMed.
- F. Zhao, G. Zhan and S. F. Zhou, Nanoscale, 2020, 12, 13145–13156 RSC.
- Y. Shao, M. Kosari, S. Xi and H. C. Zeng, ACS Catal., 2022, 12, 5750–5765 CrossRef CAS.
- S. Natesakhawat, J. W. Lekse, J. P. Baltrus, P. R. Ohodnicki, B. H. Howard, X. Deng and C. Matranga, ACS Catal., 2012, 2, 1667–1676 CrossRef CAS.
- T. Lunkenbein, J. Schumann, M. Behrens, R. Schlögl and M. G. Willinger, Angew. Chem., Int. Ed., 2015, 54, 4544–4548 CrossRef CAS PubMed.
- J. Schumann, M. Eichelbaum, T. Lunkenbein, N. Thomas, M. C. Álvarez Galván, R. Schlögl and M. Behrens, ACS Catal., 2015, 5, 3260–3270 CrossRef CAS.
- M. Kosari, U. Anjum, S. Xi, A. M. H. Lim, A. M. Seayad, E. A. J. Raj, S. M. Kozlov, A. Borgna and H. C. Zeng, Adv. Funct. Mater., 2021, 31, 2102896 CrossRef CAS.
- B. Li, T. Wang, Q. Le, R. Qin, Y. Zhang and H. C. Zeng, Nano Mater. Sci., 2022 DOI:10.1016/j.nanoms.2022.05.001.
- X. Xie, M. A. van Huis and A. van Blaaderen, Nanoscale, 2021, 13, 10925–10932 RSC.
- J. E. S. van der Hoeven, J. Jelic, L. A. Olthof, G. Totarella, R. J. A. van Dijk-Moes, J. M. Krafft, C. Louis, F. Studt, A. van Blaaderen and P. E. de Jongh, Nat. Mater., 2021, 20, 1216–1220 CrossRef CAS PubMed.
- X. Wang, M. Fujii, X. Wang and C. Song, Ind. Eng. Chem. Res., 2020, 59, 7267–7273 CrossRef CAS.
- Y. Ai, L. Liu, Z. N. Hu, J. Li, S. Ren, J. Wu, Y. Long, H. b. Sun and Q. Liang, ChemNanoMat, 2020, 6, 629–638 CrossRef CAS.
- J. Yu, M. Yang, J. Zhang, Q. Ge, A. Zimina, T. Pruessmann, L. Zheng, J.-D. Grunwaldt and J. Sun, ACS Catal., 2020, 10, 14694–14706 CrossRef CAS.
- C. Paris, A. Karelovic, R. Manrique, S. Le Bras, F. Devred, V. Vykoukal, A. Styskalik, P. Eloy and D. P. Debecker, ChemSusChem, 2020, 13, 6409–6417 CAS.
- H. Yang, P. Gao, C. Zhang, L. Zhong, X. Li, S. Wang, H. Wang, W. Wei and Y. Sun, Catal. Commun., 2016, 84, 56–60 CrossRef CAS.
- Z.-Q. Wang, Z.-N. Xu, S.-Y. Peng, M.-J. Zhang, G. Lu, Q.-S. Chen, Y. Chen and G.-C. Guo, ACS Catal., 2015, 5, 4255–4259 CrossRef CAS.
- R. Herbert, D. Wang, R. Schomacker, R. Schlogl and C. Hess, ChemPhysChem, 2009, 10, 2230–2233 CrossRef CAS PubMed.
- T. Witoon, S. Bumrungsalee, M. Chareonpanich and J. Limtrakul, Energy Convers. Manage., 2015, 103, 886–894 CrossRef CAS.
- J. D. Lee, J. B. Miller, A. V. Shneidman, L. Sun, J. F. Weaver, J. Aizenberg, J. Biener, J. A. Boscoboinik, A. C. Foucher, A. I. Frenkel, J. E. S. van der Hoeven, B. Kozinsky, N. Marcella, M. M. Montemore, H. T. Ngan, C. R. O'Connor, C. J. Owen, D. J. Stacchiola, E. A. Stach, R. J. Madix, P. Sautet and C. M. Friend, Chem. Rev., 2022, 122, 8758–8808 CrossRef CAS PubMed.
- H. C. Zeng, ChemCatChem, 2020, 12, 5303–5311 CrossRef CAS.
- Y. Dai, V. Pavan Kumar, C. Zhu, M. J. MacLachlan, K. J. Smith and M. O. Wolf, ACS Appl. Mater. Interfaces, 2018, 10, 477–487 CrossRef CAS PubMed.
- L. Song, J. Chen, Y. Bian, L. Zhu, Y. Zhou, Y. Xiang and D. Xia, J. Porous Mater., 2014, 22, 379–385 CrossRef.
- J. Li, X. Xu, Z. Hao and W. Zhao, J. Porous Mater., 2007, 15, 163–169 CrossRef.
- P. A. Heiney, K. Grüneberg, J. Fang, C. Dulcey and R. Shashidhar, Langmuir, 2000, 16, 2651–2657 CrossRef CAS.
- Y. Kaneko, N. Iyi, T. Matsumoto, K. Fujii, K. Kurashima and T. Fujita, J. Mater. Chem., 2003, 13, 2058–2060 RSC.
- A. K. Chauhan, D. K. Aswal, S. P. Koiry, S. K. Gupta, J. V. Yakhmi, C. Sürgers, D. Guerin, S. Lenfant and D. Vuillaume, Appl. Phys. A, 2007, 90, 581–589 CrossRef.
- Y. Sheng and H. C. Zeng, ACS Appl. Mater. Interfaces, 2015, 7, 13578–13589 CrossRef CAS PubMed.
- B. Xi, Y. C. Tan and H. C. Zeng, Chem. Mater., 2015, 28, 326–336 CrossRef.
- D. M. Grant and R. Kollrack, J. Inorg. Nucl. Chem., 1961, 23, 25–29 CrossRef CAS.
- J. Bjerrum, C. J. Ballhausen, C. K. Jørgensen and N. A. Sörensen, Acta Chem. Scand., 1954, 8, 1275–1289 CrossRef CAS.
- H. Zou, J. Dai, J. Suo, R. Ettelaie, Y. Li, N. Xue, R. Wang and H. Yang, Nat. Commun., 2021, 12, 4968 CrossRef CAS PubMed.
- M. Thommes, K. Kaneko, A. V. Neimark, J. P. Olivier, F. Rodriguez-Reinoso, J. Rouquerol and K. S. W. Sing, Pure Appl. Chem., 2015, 87, 1051–1069 CrossRef CAS.
- A. Le Valant, C. Comminges, C. Tisseraud, C. Canaff, L. Pinard and Y. Pouilloux, J. Catal., 2015, 324, 41–49 CrossRef CAS.
- G. Jakša, B. Štefane and J. Kovač, Surf. Interface Anal., 2013, 45, 1709–1713 CrossRef.
- S. Poulston, P. M. Parlett, P. Stone and M. Bowker, Surf. Interface Anal., 1996, 24, 811–820 CrossRef CAS.
- I. Grohmann, B. Peplinski and W. Unger, Surf. Interface Anal., 1992, 19, 591–594 CrossRef CAS.
- V. Hayez, A. Franquet, A. Hubin and H. Terryn, Surf. Interface Anal., 2004, 36, 876–879 CrossRef CAS.
- Y. Sheng and H. C. Zeng, Chem. Mater., 2015, 27, 658–667 CrossRef CAS.
- M. N. Islam, T. B. Ghosh, K. L. Chopra and H. N. Acharya, Thin Solid Films, 1996, 280, 20–25 CrossRef CAS.
- S. Kuld, C. Conradsen, P. G. Moses, I. Chorkendorff and J. Sehested, Angew. Chem., Int. Ed., 2014, 126, 6051–6055 CrossRef.
- S. M. Holmes, V. L. Zholobenko, A. Thursfield, R. J. Plaisted, C. S. Cundy and J. Dwyer, J. Chem. Soc., Faraday Trans., 1998, 94, 2025–2032 RSC.
- A. Beganskienė, V. Sirutkaitis, M. Kurtinaitienė, R. Juškėnas and A. Kareiva, J. Mater. Sci., 2004, 10, 287–290 Search PubMed.
- M. T. Kim, Thin Solid Films, 1997, 311, 157–163 CrossRef CAS.
- R. Takahashi, S. Sato, T. Sodesawa, M. Kawakita and K. Ogura, J. Phys. Chem. B, 2000, 104, 12184–12191 CrossRef CAS.
- K.-W. Jun, W.-J. Shen, K. S. Rama Rao and K.-W. Lee, Appl. Catal., A, 1998, 174, 231–238 CrossRef CAS.
- W. Pan, J. Catal., 1988, 114, 440–446 CrossRef CAS.
- Y. Wang, Y. Shen, Y. Zhao, J. Lv, S. Wang and X. Ma, ACS Catal., 2015, 5, 6200–6208 CrossRef CAS.
Footnote |
| † Electronic supplementary information (ESI) available. See DOI: https://doi.org/10.1039/d2ta08830d |
| This journal is © The Royal Society of Chemistry 2023 |

