 Open Access Article
Failure mechanism of LiNi0.6Co0.2Mn0.2O2 cathodes in aqueous/non-aqueous hybrid electrolyte†
Leilei
Du‡
a,
Xu
Hou‡
b,
Debbie
Berghus
a,
Lars
Frankenstein
a,
Richard
Schmuch
 a,
Jun
Wang
 c,
Elie
Paillard
 d,
Martin
Winter
ab,
Tobias
Placke
*a and
Jie
Li
 *bd
*bd
aMEET Battery Research Center, Institute of Physical Chemistry, University of Münster, Corrensstr. 46, Münster 48149, Germany. E-mail: tobias.placke@uni-muenster.de
bHelmholtz-Institute Münster (HI MS), IEK-12, Forschungszentrum Jülich GmbH, Corrensstr. 46, 48149, Münster, Germany
cSchool of Innovation and Entrepreneurship, Southern University of Science and Technology, Shenzhen 518055, China
dDepartment of Energy, Politecnico di Milano, Via Lambruschini 4, Milano, 20156, Italy. E-mail: jie1.li@polimi.it
First published on 13th January 2023
Abstract
The urgent need for improving the energy density of aqueous lithium ion batteries (ALIBs) can be addressed by the implementation of advanced electrode materials and electrolytes. The utilization of layered oxide cathodes, particularly Li[NixCoyMnz]O2 (NCM) materials, is an effective strategy, as they can offer high specific capacities in an appropriate voltage range. However, due to the strong effect of humidity on the degradation of Ni-rich layered oxide cathodes, using these materials together with highly concentrated aqueous electrolytes is critical. In this work, the underlying mechanisms responsible for the degradation of Li[Ni0.6Co0.2Mn0.2]O2 (NCM622)‖TiO2@LiTi2(PO4)3 (P/N = 1.2![[thin space (1/6-em)]](https://www.rsc.org/images/entities/char_2009.gif) :
:![[thin space (1/6-em)]](https://www.rsc.org/images/entities/char_2009.gif) 1) full-cells are systematically explored by comprehensive studies, involving the evolution of the lattice structure of NCM622 and electrochemical impedance dependent on the operating voltage range (0.7–2.8 V or 0.7–2.9 V). It is found that in aqueous/non-aqueous hybrid electrolyte, in addition to the discharge process, proton intercalation into NCM622 also takes place during the charging process, which is dramatically severe at higher upper cut-off voltage (2.9 V), leading to a rapid degradation of the cathode material. The intercalated protons not only aggravate the electrochemical impedance by blocking Li+ diffusion, but also activate the higher potential redox pairs. This experimental study offers an in-depth understanding about the failure mechanism of NCM622 cathode materials in aqueous electrolytes.
1) full-cells are systematically explored by comprehensive studies, involving the evolution of the lattice structure of NCM622 and electrochemical impedance dependent on the operating voltage range (0.7–2.8 V or 0.7–2.9 V). It is found that in aqueous/non-aqueous hybrid electrolyte, in addition to the discharge process, proton intercalation into NCM622 also takes place during the charging process, which is dramatically severe at higher upper cut-off voltage (2.9 V), leading to a rapid degradation of the cathode material. The intercalated protons not only aggravate the electrochemical impedance by blocking Li+ diffusion, but also activate the higher potential redox pairs. This experimental study offers an in-depth understanding about the failure mechanism of NCM622 cathode materials in aqueous electrolytes.
1. Introduction
Due to the rapid growth of the market for electric vehicles (EVs), mobile electronics, and grid energy storage, the pursuit for green batteries with high energy densities has become a sensible direction and purpose.1–5 Importantly, high safety is defined as the foremost safeguard amid the wide commercialization of rechargeable lithium ion batteries (LIBs) because of serious concerns regarding fire accidents of EVs that rely on state-of-the-art flammable6 organic-solvent-based electrolytes.7–10 Based on this challenge, the implementation of aqueous electrolytes is considered a promising strategy due to their intrinsic safety, which is inspired by the reported “high concentration” aqueous electrolytes or similar attempts.11,12 Though this class of electrolytes exhibits a kinetically expanded electrochemical stability window (ESW) of up to ≈3.0 V, thus, making it possible to use more selected cathode‖anode cell chemistries, the commonly used cathode material, i.e., spinel LiMn2O4, shows low specific capacity and energy density.11,13The use of high-capacity positive electrodes (cathodes) is a valid strategy to further increase the energy density of LIBs, including aqueous lithium ion batteries (ALIBs).14 Among layered-, olivine-, and spinel-structural cathode materials, layered oxide materials are the most promising candidates due to their high theoretical specific capacities compared to others.15 However, state-of-the-art LiNixCoyMnzO2 (x + y + z = 1; NCM) cathode materials were previously not considered a choice for use in aqueous electrolytes because of their insufficient stability in water-based environments.16,17 The H+/Li+ exchange reaction would degrade the electrochemical performance of layered cathodes because intercalated H+ can detrimentally increase the barrier for Li+ ion transport.18
Despite this major drawback, several reports confirm the feasibility of layered oxide cathodes in highly concentrated aqueous electrolytes.13,19,20 For example, LiCoO2 was successfully stabilized by adding tris(trimethylsilyl) borate (TMSB) as an additive to a “water-in-salt” (21 molar LiTFSI in 1 kg H2O) electrolyte, and the assembled LiCoO2‖Mo6S8 full-cell delivered a high-energy density of 120 W h kg−1 (active material level) for an ALIB.13 Similarly, lithium bis (trifluoromethane sulfonyl) imide (LiTFSI) salt solubility in water strongly increases from 21 mol kg−1 to up to 60 mol kg−1 in the presence of an ionic liquid, and the NCM811‖Li4Ti5O12 full-cell exhibited a high initial energy density of 150 W h kg−1 (active material level) in the ternary electrolyte of LiTFSI–ionic liquid–water (molar ratio of 0.35![[thin space (1/6-em)]](https://www.rsc.org/images/entities/char_2009.gif) :
:![[thin space (1/6-em)]](https://www.rsc.org/images/entities/char_2009.gif) 0.18
0.18![[thin space (1/6-em)]](https://www.rsc.org/images/entities/char_2009.gif) :
:![[thin space (1/6-em)]](https://www.rsc.org/images/entities/char_2009.gif) 0.47).21 Despite significant progress, it is not completely understood yet if H+ intercalation can be sufficiently suppressed in high concentration aqueous electrolytes. Meanwhile, in addition to the H+ concentration in the electrolyte,16,22 other factors that can critically affect the H+ intercalation behavior, have not been systematically studied.
0.47).21 Despite significant progress, it is not completely understood yet if H+ intercalation can be sufficiently suppressed in high concentration aqueous electrolytes. Meanwhile, in addition to the H+ concentration in the electrolyte,16,22 other factors that can critically affect the H+ intercalation behavior, have not been systematically studied.
Therefore, this work aims at exploring the H+ intercalation behavior in layered cathode materials in highly concentrated aqueous electrolytes. LiNi0.6Co0.2Mn0.2O2 (NCM622) and TiO2@LiTi2(PO4)3 have been employed as cathode and anode materials, respectively, and 13 M LiTFSI in a 1 kg H2O/dimethyl carbonate (DMC) mixture (molar ratio: 1![[thin space (1/6-em)]](https://www.rsc.org/images/entities/char_2009.gif) :
:![[thin space (1/6-em)]](https://www.rsc.org/images/entities/char_2009.gif) 1) with 20 wt% ethoxy-(pentafluoro)-cyclotriphosphazene (PFN) co-solvent has been used as electrolyte, inspired by our previous work.23 The H+ intercalation behavior in the highly concentrated aqueous electrolyte was confirmed by X-ray diffraction (XRD) and thermogravimetric analysis (TGA-MS), and the dependency of protonation in the de-lithiated state of NCM622 is also investigated. Furthermore, the deterioration of intercalated H+ on the electrochemical performance of NCM622 in NCM622‖TiO2@LiTi2(PO4)3 full-cells was studied, in which, electrochemical impedance spectroscopy (EIS) measurements were employed to evaluate the blocking effect induced by intercalated protons. This study will serve as a guide to understand the degradation mechanism of NCM cathode materials in aqueous electrolytes.
1) with 20 wt% ethoxy-(pentafluoro)-cyclotriphosphazene (PFN) co-solvent has been used as electrolyte, inspired by our previous work.23 The H+ intercalation behavior in the highly concentrated aqueous electrolyte was confirmed by X-ray diffraction (XRD) and thermogravimetric analysis (TGA-MS), and the dependency of protonation in the de-lithiated state of NCM622 is also investigated. Furthermore, the deterioration of intercalated H+ on the electrochemical performance of NCM622 in NCM622‖TiO2@LiTi2(PO4)3 full-cells was studied, in which, electrochemical impedance spectroscopy (EIS) measurements were employed to evaluate the blocking effect induced by intercalated protons. This study will serve as a guide to understand the degradation mechanism of NCM cathode materials in aqueous electrolytes.
2. Results and discussion
2.1 Electrochemical stability of NCM622 electrodes after charging to different SOCs
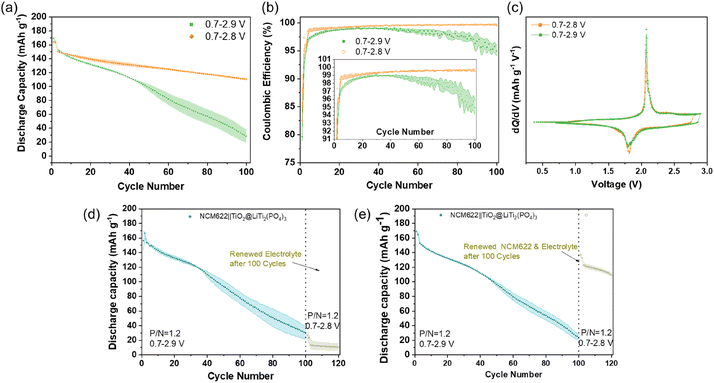
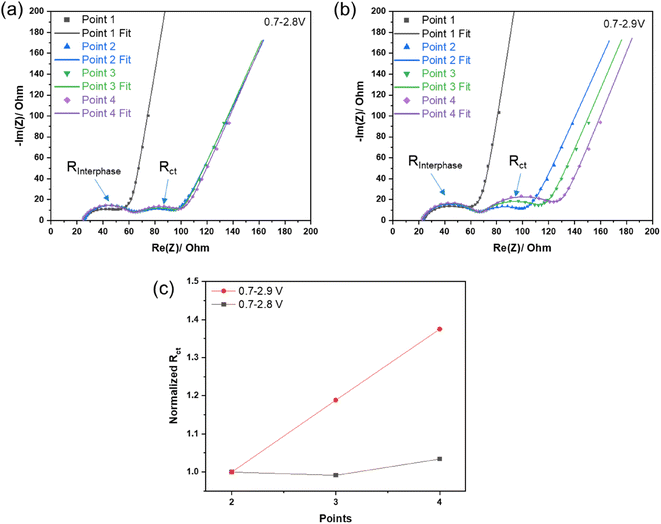
First, NCM622‖TiO2@LiTi2(PO4)3 full-cells were cycled in cell voltage operation ranges of 0.7–2.8 V or 0.7–2.9 V to investigate the impact of different charging protocols, i.e., with different upper cut-off voltages, on electrochemical performance. As shown in Fig. 1a, the full-cells exhibit an significantly improved capacity retention (73.6%, 100th/3rd) in the 0.7–2.8 V range than in the 0.7–2.9 V scope (18.5%, 100th/3rd), even if the latter cell exhibits a higher specific capacity in the initial cycle (169 vs. 164 mA h g−1, a corresponding an energy density of 143 vs. 138 W h kg−1 based on the active material level, Fig. S1†). From the potential profile of the 2nd cycle (Fig. S2†), it is clear that charging the full-cells to a higher cut-off voltage results in a higher potential of the cathode and thus a higher delithiated state of the NCM622 cathode.24 The rapid capacity fading for the cell operated at 0.7–2.9 V during cycling indicates the instability of this cell chemistry (with the hybrid aqueous electrolyte), which can be further confirmed by the evolutions of coulombic efficiency (CEff), as shown in Fig. 1b. Although, the upper figure shows that the initial CEff values of cells with different cycling protocols are close to 80% and increase to over 95% since the second cycle, the enlarged bottom image (Fig. 1b, inset) shows an obvious difference in the change in CEff between the two cycling protocols. The cells charged to 2.8 V quickly tend to show stable cycling after the initial cycles, with CEff reaching 99% and gradually increasing slightly until the 100th cycle. In contrast, the cells charged to 2.9 V exhibit a remarkably lower CEff, which cannot reach 99%, and even starts to decrease after 40 cycles. This unstable cycling performance is probably induced by enhanced electrolyte decomposition after charging to the higher cut-off voltage; however, the dQ/dV vs. voltage curves of the 1st cycle are shown in Fig. 1c, displaying similar redox peaks and no obvious decomposition peaks of the aqueous electrolyte. This finding also suggests that failure of electrolyte is not the main reason for the severe degradation of cycling performance. This conclusion is further confirmed by observing the post cycling performance of cycled cells (100 cycles) after renewing the electrolyte or (and) cathode. Fig. 1d shows the results of cycled cells with a renewed separator and electrolyte (13M20), and Fig. 1e exhibits the cycling behavior of cells with a renewed NCM622 cathode, a separator and electrolyte after 100 cycles. After renewing certain components in the cells, the cell voltage operation range of galvanostatic cycling was changed from 0.7–2.9 V (first 100 cycles) to 0.7–2.8 V (101–120 cycles). The NCM622‖TiO2@LiTi2(PO4)3 cells still exhibited a poor capacity after refreshing only the electrolyte (Fig. 1d), while, in contrast the cells using the new NCM622 cathode and electrolyte exhibited a notably increased specific capacity (Fig. 1e). This observation indicates that the degradation of the NCM622 cathode is the main reason for the failure of the full-cells when using the 2.9 V upper cut-off voltage. In addition, if the parasitic specific capacity contributed by parasitic side reactions, such as electrolyte decomposition, can be ignored, then the ‘x’ value in LixNi0.6Co0.2Mn0.2O2 regarding the initial charge can be roughly estimated. The basis for the estimation is that a theoretical specific capacity of 276.5 mA h g−1 for NCM622 (ref. 25 and 26) corresponds to 100% delithiation, and ≈58% (at a cut-off voltage of 2.8 V) and ≈63% (at a cut-off voltage of 2.9 V) of the Li+ were extracted from NCM622, respectively, which was calculated using the specific charge capacities of 160 and 173 mA h g−1 based on the cathode active material mass (Fig. S3†).In order to explore the evolution of the impedance of the NCM622‖TiO2@LiTi2(PO4)3 cells during cycling, electrochemical impedance spectroscopy (EIS) was performed after different cycles (Fig. S4†), and the corresponding results are plotted in Fig. 2a and b. The EIS data was fitted using an equivalent circuit model, as shown in Fig. S5.† The first semi-circle at high frequency corresponds to the interphase resistance (RInterphase) of the cell, showing only a minor increase during cycling for both cell voltage operation ranges, as illustrated in Fig. S6† (normalized values). This finding confirms that the PFN additive is helpful in forming an effective cathode electrolyte interphase (CEI) film on the cathode surface, as reported previously.23 In contrast, the second semi-circle corresponding to the charge-transfer resistance (Rct) shows a steep increase for cycling at the higher cut-off voltage, displaying an obvious difference between the two upper cut-off cell voltages, which can be clearly seen from the normalized values, as shown in Fig. 2c. With regard to the above discussion about the degradation of the NCM622 cathode at high state-of-charge (SOC; =high degree of de-lithiation), the increased Rct is found to be the main reason for the decline of reversible capacity upon cycling the full-cells when charging to 2.9 V. Referring to first principles calculations, Gu et al.18 found that H+ intercalation in LiCoO2 can increase the diffusion barrier of Li+. Therefore, the degradation at high SOC, in the case of NCM622 electrodes in aqueous based electrolytes, could probably be attributed to H+ intercalation, which in turn would decrease the dynamics of Li+ intercalation and promote the charge-transfer resistance control of the cell. This change will be progressively become more and more severe during prolonged cycling.
2.2 Morphology evolution of NCM622 electrodes after charging to different SOCs
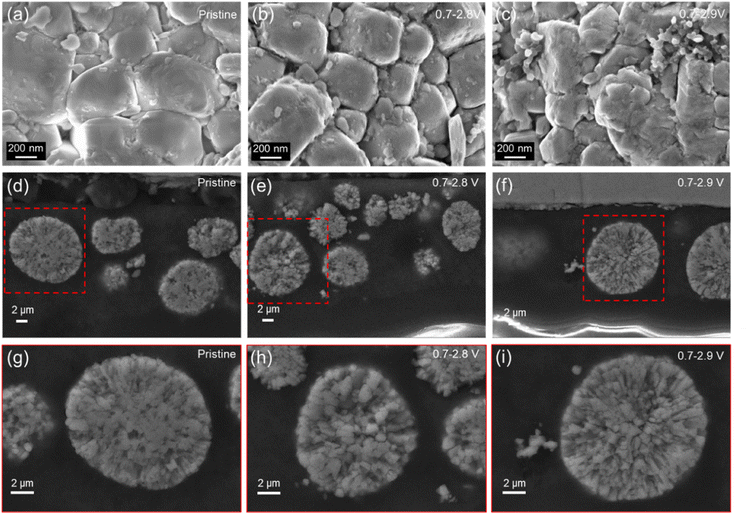
Furthermore, the surficial and cross-sectional morphologies of NCM622 cathodes, before and after cycling with different protocols, were analyzed by SEM, as shown in Fig. 3. Before cycling, the surface of the pristine NCM622 electrode looks rather clean (Fig. 3a) compared to those of cycled electrodes that are covered by uniform surficial CEI films (Fig. 3b and c). Both cycled electrodes show a similar CEI morphology, however, the film appears slightly messier for the electrode charged to 2.9 V. This finding is consistent with the RInterphase results (Fig. 2a and b), i.e., the RInterphase values of cells cycled within 0.7–2.9 V are slightly higher than those of cells cycled within 0.7–2.8 V, indicating that the stabilization of the cathode | electrolyte interface by the PFN co-solvent is still effective even after charging to high cell voltages. Moreover, cross-sectional views reveal an evolved interior morphology of cycled NCM622 particles (Fig. 3d–i). The calendaring process before cell assembly can also change the morphology of NCM622 particles, i.e., partially tightly contacted NCM622 particles were squeezed by surrounding particles and generate some cracks. In order to exclude any cracks generated in the calendaring process, the individual NCM622 particles that are isolated from other active material particles were analyzed. Among them, Fig. 3g–i show the enlarged images of particles that are marked with red boxes in Fig. 3d–f, respectively. While the pristine NCM622 particles are undamaged and do not depict any obvious cracks (Fig. 3d and g), particle cracking can be observed for cycled electrodes (Fig. 3e, f, h and i), and especially for the NCM622 particles cycled in the voltage operation range of 0.7–2.9 V (Fig. 3f and i). This generation of cracks is due to uneven distribution of strain pressure, which probably results from the continuously increased Li+ deficiency.27 The Li+ deficiency can be attributed to much fewer Li+ ions intercalating into NCM622 during discharge than the amount extracted during charge when a higher cut-off voltage was employed, which can be proved by the poorer CEff (Fig. 1b) during cycling.2.3 Investigation of the H+ intercalation phenomenon of NCM622 electrodes after charging to different SOCs
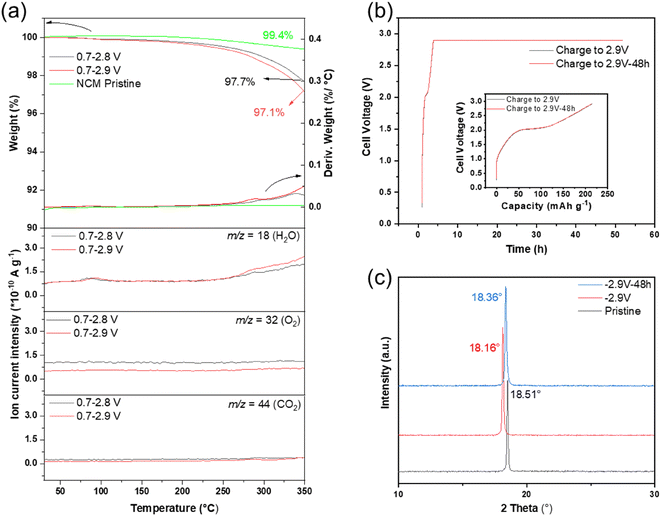
As the Li+ deficiency as well as H+ intercalation play a key role in cell degradation when charged to high cut-off voltage, the NCM622 electrodes at different SOCs were further analyzed by thermogravimetric and mass spectrometry (TGA-MS) analyses to confirm the existence of intercalated H+ (Fig. 4a). The pristine NCM622 electrode displays nearly no weight loss (≈0.6%) up to 350 °C. In contrast, the cycled NCM622 electrodes tend to lose weight starting at lower temperatures, which mainly derives from the release of water because of the increase in m/z = 18 at ≈80 °C and ≥270 °C according to the MS curves (baseline not subtracted). The former small “bump” at ≈80 °C is probably due to the release of surface-absorbed water. The latter water molecule evaporation at temperature over 270 °C corresponds to the bulk change, which indicates a water forming reaction between lattice oxygen and intercalated protons. The notable amount of H2O release, from both cycled electrodes, is a strong indication of the existence of intercalated protons. Meanwhile, a higher intensity of released H2O can be detected for NCM622 electrodes cycled up to 2.9 V, which can be concluded to be the result of more severe H+ intercalation behavior after charging to a higher SOC. Meanwhile, the weak signals of O2 and CO2 gas release up to 350 °C demonstrate that the thermal decomposition reactions that may come from/between other components in the electrode can be ignored. Therefore, severe H+ intercalation into the layered NCM622 structure is once again proved to be the main reason resulting in degradation of cycling performance, especially for cells operated at 0.7–2.9 V.Furthermore, the intercalation of protons at high SOC can also be characterized by the evolution of the NCM622 lattice structure. During the post XRD experiments, the charged full-cells were kept at an upper cut-off cell voltage after the first charge for 48 hours (shown in Fig. 4b) in order to promote the effects caused by protonation. Therefore, two de-lithiated cathodes were prepared by (i) charging to 2.9 V (marked as ‘2.9 V’) and by (ii) an additional constant voltage holding step at 2.9 V for 48 hours (marked as ‘2.9 V–48 h’). Fig. 4b (inset figure) shows the cell voltage vs. specific capacity profiles, thus, pointing out that the SOC of the cathode is the same before the holding step. The XRD patterns of electrodes at different SOCs that refer to (003) reflection (18.51° for the pristine NCM622 cathode) are plotted in Fig. 4c, which have been calibrated using the diffraction reflections of the current collector (Ti foil), as shown in Fig. S7.†
For the cathode charged to 2.9 V, Fig. 4c and S8† show that the (003) plane shifts to lower 2θ values, indicating that the NCM622 lattice is expanded along the c-axis after the de-lithiation process because of the enhancement of electrostatic repulsion originated from the absence of Li+ between the two oxygen layers.15,28 However, it is obvious that the (003) plane shifts back to higher 2θ values after 48 hours of holding time, indicating the shrinkage of the NCM622 lattice along the c-axis. This shrinkage would be due to H+ intercalation into the cathode lattice and the subsequent occupation of Li+ vacancies, demonstrating that H+ intercalation can be dramatically promoted by maintaining the cell at high SOC of the cathode for longer duration.
2.4 Increased Li+ diffusion barrier of NCM622 electrodes results from H+ intercalation
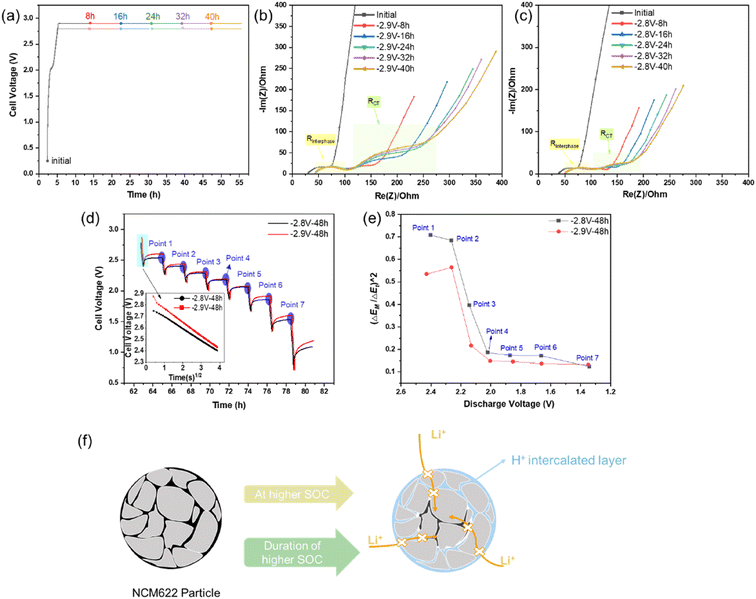
To further understand the failure mechanism of the NCM622 cathode in aqueous electrolyte, EIS and GITT analyses were used to reveal the negative impact of the protonation of the active material upon cycling. An accumulated protonation during long-term cycling was also simulated by a holding step at the upper cut-off voltage for 48 h. EIS spectra were collected every 8 h during this holding step, as shown in Fig. 5a. The impedance evolution of the NCM622‖TiO2@LiTi2(PO4)3 cells was compared for the two different upper cut-off voltages, i.e., 2.9 V (Fig. 5b) and 2.8 V (Fig. 5c), respectively. Both plots indicate a similar, less affected RInterphase evolution trend, indicating that the electrolyte is not continuously decomposed during the holding step at 2.9 V for 48 h. However, Rct shows an increase during the holding time, especially after charging to 2.9 V (Fig. 5b), displaying a significant increase after each 8 h step in contrast to a minor increase from the cell charged to 2.8 V (Fig. 5c). The increase in Rct most likely results from the continuous intercalation of H+ and subsequent blocking of Li+ intercalation. Therefore, GITT measurements were conducted to evaluate the practical Li+ diffusion coefficient (DLi+) in the discharge process after a 48 h holding time at 2.8 V or 2.9 V. Eventually, the DLi+ of the full-cells at individual discharge states (points 1–7, as labelled in Fig. 5d) were calculated based on the simplified formula (1), since the E–τ1/2 curve shows a linear relationship as shown in Fig. 5d29w | (1) |
In order to enable a fair comparison of DLi+ for the 2.8 V and 2.9 V samples, the electrode with the same mass loading were selected for different cells to guarantee the same value originated from the first part of formula (1), and thus only the later part  is calculated for comparison. The corresponding values are plotted vs. the discharge voltage, as depicted in Fig. 5e. It can be observed that the Li+ diffusion coefficients after charging to 2.9 V are always smaller than those after charging to 2.8 V. This finding further confirms the strong effect of high SOC of the cathode on the behavior of H+ intercalation.
By combining the previous analyses, the proposed mechanism of H+ intercalation can be summarized. As illustrated in Fig. 5f, both high SOC of the cathode and long duration at high SOC can promote the H+ intercalation. The intercalated H+ results in high Li+ impedance and a decreased Li+ diffusion rate, which in turn results in degradation of the cycling stability at higher cut-off voltage.
2.5 Exploration of the H+ intercalation mechanism during charging and discharging
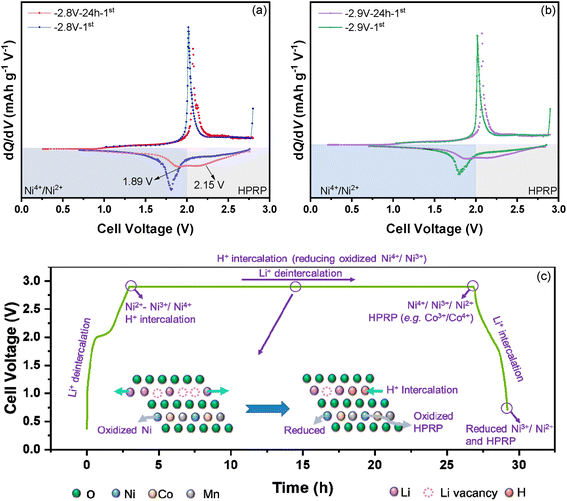
Based on the above discussions, electrochemical performance degradation of NCM622‖TiO2@LiTi2(PO4)3 full cells is attributed to a deteriorated electrochemical impedance, which results from intercalated protons. The extent of H+ intercalation is related to the SOC of the NCM622 electrodes. However, the H+ intercalation mechanism, especially the difference between the charge and discharge processes, is still unclear. Therefore, the electrochemical behavior of NCM622‖TiO2@LiTi2(PO4)3 full cells in the initial discharge process after a 24 h holding step at upper cut-off voltage (2.8 or 2.9 V) as well as the subsequent 2nd cycle was further characterized. The corresponding cell voltage vs. time profiles are shown in Fig. S9.† The additionally exhibited electrochemical redox pairs of charged NCM622 cathodes results from intercalated protons, which is investigated by comparing the differential capacity (dQ/dV) vs. voltage curves of the cells with/without the additional 24 h constant voltage holding process as shown in Fig. 6, wherein, the dQ/dV vs. voltage curve from regular charge/discharge cycling (Fig. 1c) was used as the reference. When charging to 2.8 V without a holding step, Ni3+/2+/Ni4+ is the main oxidization couple and no additional peaks appeared during discharging (Fig. 6a).34 However, after holding at 2.8 V for 24 h, a new reduction couple appeared, which can be attributed to higher potential redox pairs (HPRPs), e.g. Co4+/Co3+.34,35 Because the difference in redox potentials between Ni3+/Ni2+ (3.65 V vs. Li|Li+, in organic electrolyte)36 and Co4+/Co3+ (3.9 V vs. Li|Li+, in organic electrolyte)37 is roughly equal to the difference between the two observed reduction peaks Ni4+/Ni3+/Ni2+ (1.89 V of cell voltage) and the HPRP (2.15 V of cell voltage), as shown in Fig. 6a, it is reasonable to divide the discharge capacity into two parts at a cell voltage of 2.0 V, as the Ni4+/Ni2+ couple corresponds to ≤2.0 V, and the HPRP to ≥2.0 V. Similarly, a newly generated reduction peak can also be found for the “2.9 V–24 h” sample as shown in Fig. 6b.In order to clearly illustrate the proposed (de-)lithiation behaviors affected by intercalated H+ during charging and discharging, a schematic is depicted in Fig. 6c. During charging, the Li+ was extracted from the NCM622 structure, and Ni2+ was oxidized to Ni3+/Ni4+, and upon charging to high voltage, protons will start to intercalate into the structure. During the holding process, continuously intercalated H+ occupies the Li+ vacancies, meanwhile, reducing oxidized Ni4+ to Ni3+ or Ni2+. Hence, more Li+ must be extracted to maintain the cell voltage at a high value during the holding process, which will arouse more Li+ deintercalation and HPRPs, e.g. Co3+/Co4+. At the end of the holding procedure, reduced Ni2+ or Ni3+ and oxidized HPRPs would exist; thereafter, a newly generated reduction peak appeared during discharging.
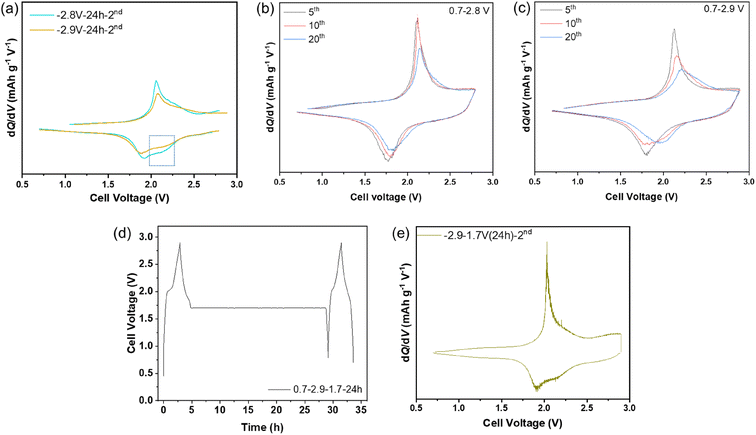
The corresponding dQ/dV vs. voltage profiles of the subsequent cycles with a 24 h holding step (only in the 1st cycle) are shown in Fig. 7a. A HPRP can still be observed for both cells in the 2nd discharge process, indicating that this reaction is reversible. However, its reversibility is quite poor, especially at higher cut-off voltages, as the cell operated at 2.9 V displays a dramatic decrease in the HPRP. The activation of the HPRP can also be observed during the prolonged cycling even though the 24 h holding step is skipped. Fig. 7b and c show the dQ/dV vs. voltage profiles of the cells with different cut-off voltages at the 5th, 10th and 20th cycles, respectively. Obviously, the redox pairs of the cell with a 2.8 V cut-off voltage maintain stability during cycling, while those of the cell with a cut-off voltage of 2.9 V gradually shift to higher voltage during cycling, suggesting an activation of the HPRP. Since the HPRP shows poor reversibility, it probably accelerates the degradation of the NCM622 lattice structure, which is another failure mechanism of NCM622 at high SOC besides deteriorated impedance owing to H+ intercalation.
Besides the charging process, the proton intercalation was explored during discharge as well by applying a holding step at 1.7 V. As shown in Fig. 7d, the NCM622‖TiO2@LiTi2(PO4)3 full cell was charged to 2.9 V and subsequently discharged to 1.7 V, holding for 24 h, then discharged to 0.7 V and then another cycle was performed. Similar to the curves shown in Fig. 7a, a HPRP can be observed in the dQ/dV vs. voltage profile of the 2nd cycle, as shown in Fig. 7e, demonstrating that the proton intercalation also takes place during the discharging process.
3. Conclusions
In this work, the electrochemical performance of NCM622‖TiO2@LiTi2(PO4)3 full-cells using a hybrid aqueous/non-aqueous electrolyte was systemically investigated with two different upper cut-off voltages (2.8 V and 2.9 V). Cells operated at 2.9 V displayed significantly reduced capacity retention after 100 cycles compared to the cells operated at 2.8 V (18.5% vs. 73.6%). A series of experimental studies enabled the exploration of the key reason for NCM622 degradation in aqueous-based electrolyte, which is the severe protonation (H+ intercalation) upon charging. The intercalated protons increase the Li+ transport barrier and activate higher potential redox pairs. It was found that protons are easier to intercalate into the NCM622 structure at a higher de-lithiation state, so moderating the upper cut-off voltage is a rational strategy to suppress the corresponding deterioration. In addition, H+ intercalation during the discharging process is also not negligible which causes a gradual decay of the electrochemical performance. This work offers a better fundamental understanding regarding the challenges of applying layered cathode materials in aqueous electrolytes, and hopefully it can provide inspiration to develop suitable approaches towards aqueous lithium ion batteries with improved electrochemical performance.Conflicts of interest
The authors declare that they have no conflict of interest.Acknowledgements
The authors are grateful for the financial support from the German Research Foundation (DFG, project Li 2916/2-1), the Ministry of Economic Affairs, Innovation, Digitalization and Energy of the State of North Rhine-Westphalia (MWIDE) within the project “GrEEn” (313-W044A), and the European Union through the Horizon 2020 framework program for research and innovation within the project “VIDICAT” (829145).References
- K. Turcheniuk, D. Bondarev, V. Singhal and G. Yushin, Nature, 2018, 14, 467–470 Search PubMed.
- W. Wu, M. Wang, J. Wang, Z. Wei, T. Zhang, S.-S. Chi, C. Wang and Y. Deng, Nano Energy, 2020, 74, 104867 CAS.
- R. Schmuch, R. Wagner, G. Hörpel, T. Placke and M. Winter, Nat. Energy, 2018, 3, 267–278 CAS.
- M. Winter, B. Barnett and K. Xu, Chem. Rev., 2018, 118, 11433–11456 CAS.
- S. Duehnen, J. Betz, M. Kolek, R. Schmuch, M. Winter and T. Placke, Small Methods, 2020, 4, 2000039 CAS.
- S. P. Kühn, K. Edström, M. Winter and I. Cekic-Laskovic, Adv. Mater. Interfaces, 2022, 2102078 Search PubMed.
- J.-Y. Luo, W.-J. Cui, P. He and Y.-Y. Xia, Nat. Chem., 2010, 2, 760–765 CAS.
- A. Manthiram, X. Yu and S. Wang, Nat. Rev. Mater., 2017, 2, 1–16 Search PubMed.
- D. G. Mackanic, X. Yan, Q. Zhang, N. Matsuhisa, Z. Yu, Y. Jiang, T. Manika, J. Lopez, H. Yan and K. Liu, Nat. Commun., 2019, 10, 1–11 CAS.
- I. Cekic-Laskovic, N. v. Aspern, L. Imholt, S. Kaymaksiz, K. Oldiges, B. R. Rad and M. Winter, Electrochem. Energy Storage, 2019, 1–64 Search PubMed.
- L. Suo, O. Borodin, T. Gao, M. Olguin, J. Ho, X. Fan, C. Luo, C. Wang and K. Xu, Science, 2015, 350, 938–943 CAS.
- X. He, B. Yan, X. Zhang, Z. Liu, D. Bresser, J. Wang, R. Wang, X. Cao, Y. Su and H. Jia, Nat. Commun., 2018, 9, 1–8 CAS.
- F. Wang, Y. Lin, L. Suo, X. Fan, T. Gao, C. Yang, F. Han, Y. Qi, K. Xu and C. Wang, Energy Environ. Sci., 2016, 9, 3666–3673 CAS.
- Y. Arinicheva, M. Wolff, S. Lobe, C. Dellen, D. Fattakhova-Rohlfing, O. Guillon, D. Böhm, F. Zoller, R. Schmuch and J. Li, in Advanced Ceramics for Energy Conversion and Storage, Elsevier, 2020, pp. 549–709 Search PubMed.
- W. Lee, S. Muhammad, T. Kim, H. Kim, E. Lee, M. Jeong, S. Son, J. H. Ryou and W. S. Yoon, Adv. Energy Mater., 2018, 8, 1701788 Search PubMed.
- J. Wu, X. Zhang, S. Zheng, H. Liu, J. Wu, R. Fu, Y. Li, Y. Xiang, R. Liu, W. Zuo, Z. Cui, Q. Wu, S. Wu, Z. Chen, P. Liu, W. Yang and Y. Yang, ACS Appl. Mater. Interfaces, 2020, 12, 7277–7284 CAS.
- I. Aleksandrova, E. A. Medina and M. Karppinen, J. Solid State Chem., 2020, 289, 121478 CAS.
- X. Gu, J.-l. Liu, J.-h. Yang, H.-j. Xiang, X.-g. Gong and Y.-y. Xia, J. Phys. Chem. C, 2011, 115, 12672–12676 CAS.
- J. Chen, J. Vatamanu, L. Xing, O. Borodin, H. Chen, X. Guan, X. Liu, K. Xu and W. Li, Adv. Energy Mater., 2019, 10, 1902654 Search PubMed.
- L. Xue, Q. Zhang, Y. Huang, H. Zhu, L. Xu, S. Guo, X. Zhu, H. Liu, Y. Huang and J. Huang, Adv. Mater., 2022, 2108541 CAS.
- M. Becker, D. Rentsch, D. Reber, A. Aribia, C. Battaglia and R. S. Kühnel, Angew. Chem., Int. Ed., 2021, 60, 14100–14108 CAS.
- T. Toma, R. Maezono and K. Hongo, ACS Appl. Energy Mater., 2020, 3, 4078–4087 CAS.
- L. Du, X. Hou, W. Zhao, L. Haneke, J. Wang, X. Ju, X. Liu, Y. Yang, J. M. Wrogemann and S. Künne, J. Power Sources, 2022, 541, 231670 CAS.
- J. Kasnatscheew, M. Evertz, R. Kloepsch, B. Streipert, R. Wagner, I. Cekic Laskovic and M. Winter, Energy Technol., 2017, 5, 1670–1679 CAS.
- H. Hyun, K. Jeong, H. Hong, S. Seo, B. Koo, D. Lee, S. Choi, S. Jo, K. Jung and H. H. Cho, Adv. Mater., 2021, 33, 2105337 CAS.
- S. Oswald, D. Pritzl, M. Wetjen and H. A. Gasteiger, J. Electrochem. Soc., 2020, 167, 100511 CAS.
- W. Li, X. Liu, Q. Xie, Y. You, M. Chi and A. Manthiram, Chem. Mater., 2020, 32, 7796–7804 CAS.
- J. Li, Z. Zhang, X. Guo and Y. Yang, Solid State Ionics, 2006, 177, 1509–1516 CAS.
- W. Weppner and R. A. Huggins, J. Electrochem. Soc., 1977, 124, 1569 CAS.
- C. Hong, Q. Leng, J. Zhu, S. Zheng, H. He, Y. Li, R. Liu, J. Wan and Y. Yang, J. Mater. Chem. A, 2020, 8, 8540–8547 CAS.
- K. Tang, X. Yu, J. Sun, H. Li and X. Huang, Electrochim. Acta, 2011, 56, 4869–4875 CAS.
- J. Liu, H. Chen, J. Xie, Z. Sun, N. Wu and B. Wu, J. Power Sources, 2014, 251, 208–214 CAS.
- Z. Shen, L. Cao, C. D. Rahn and C.-Y. Wang, J. Electrochem. Soc., 2013, 160, A1842 CAS.
- J. Liu, Z. Du, X. Wang, S. Tan, X. Wu, L. Geng, B. Song, P.-H. Chien, S. M. Everett and E. Hu, Energy Environ. Sci., 2021, 14, 6441–6454 CAS.
- S. S. Zhang, Energy Storage Mater., 2020, 24, 247–254 Search PubMed.
- Y. Mo, L. Guo, H. Jin, B. Du, B. Cao, Y. Chen and Y. Chen, J. Power Sources, 2020, 448, 227439 CAS.
- H. Xia, L. Lu and G. Ceder, J. Power Sources, 2006, 159, 1422–1427 CAS.
Footnotes |
| † Electronic supplementary information (ESI) available. See DOI: https://doi.org/10.1039/d2ta08650f |
| ‡ These authors contributed equally to this work. |
| This journal is © The Royal Society of Chemistry 2023 |

