 Open Access Article
Creative Commons Attribution 3.0 Unported Licence
Ion transport in semi-solid in-salt electrolytes: LiTFSI–H2O as a model system†
Yue
Guo
,
Maxwell W.
Terban
 ,
Igor
Moudrakovski
 ,
Andreas
Münchinger
 ,
Robert E.
Dinnebier
 ,
Jelena
Popovic
 * and
Joachim
Maier
*
Max Planck Institute for Solid State Research, Heisenbergstr.1, Stuttgart 70569, Baden-Württemberg, Germany. E-mail: popovic@fkf.mpg.de; office-maier@fkf.mpg.de
First published on 20th December 2022
Abstract
The water-in-salt (WIS) electrolyte represents a newly developed battery electrolyte system with high ionic conductivity that enables cells with a broader electrochemical window and improved cyclability. Several theories have been proposed to explain the co-existence of high conductivity and salt concentration in a WIS model system with lithium bis(trifluoromethanesulfonyl)imide salt — (LiTFSI)–H2O. However, experimental and theoretical studies focused on salt concentrations below 21 mol kg−1. Here, we have systematically measured the physical and electrochemical properties of the LiTFSI–H2O binary system in the salt concentration range from 21–55.5 mol kg−1 in the semi-solid regime. Based on the Raman spectroscopy and lithium transference number results, we propose that the majority of the species formed are neutral or negatively charged ion pairs or clusters in higher aggregation states. The transference number of elemental Li measured by pulsed-field gradient nuclear magnetic resonance (PFG)-NMR remains unexpectedly high (around 0.7) when the mole ratio of Li and H2O reaches 1![[thin space (1/6-em)]](https://www.rsc.org/images/entities/char_2009.gif) :
:![[thin space (1/6-em)]](https://www.rsc.org/images/entities/char_2009.gif) 1. On the other hand, the lithium transference numbers measured by the galvanostatic polarization method for various concentrations are lower than 0.1. We show that charged associates can provide a qualitative explanation for the observed ion transport behavior. We also report the existence of local minima in temperature-dependent conductivity at various concentrations, and details of the phase transition of LiTFSI monohydrate.
1. On the other hand, the lithium transference numbers measured by the galvanostatic polarization method for various concentrations are lower than 0.1. We show that charged associates can provide a qualitative explanation for the observed ion transport behavior. We also report the existence of local minima in temperature-dependent conductivity at various concentrations, and details of the phase transition of LiTFSI monohydrate.
1 Introduction
Aqueous electrolytes in lithium battery technologies generally suffer from poor electrochemical stability, chemical reactivity, and poor ionic conductivity linked with salt solubility issues.1–4 However, the water-in-salt (WIS) electrolyte based on the LiTFSI–H2O system offers both high ionic conductivity and high salt concentration, giving rise to a number of possible new applications of aqueous battery electrolytes including fast charging/discharging and high-voltage lithium-ion batteries.1,5,6 In the last several years, a similar strategy has been employed in other energy storage systems including sodium/magnesium/aluminum ion batteries, highlighting its broad application potential.7–11In a WIS system, there are typically just two or three water molecules per salt ion pair, depressing the chemical activity of water molecules.12 However, the heterogeneous structure of the prepared materials may be very complex, and phase diagrams indicate the existence of system-dependent liquid- and solid-state phases, wherein the material's history plays an important role in the non-equilibrium nature of the reported phase constellation. Ding and Xu determined the phase diagram from differential scanning calorimetry (DSC) measurements.13 This phase diagram shows that above 44 °C, the hydrated phase of salt disappears and a new LiTFSI liquid phase appears instead (Fig. 1). However, details of the phase structure at each concentration remain unclear. For example, the entities (H2O)4Li·TFSI and H2OLi·TFSI have been assumed to be in the solid state as the compounds between TFSI− and solvated Li+. The amount of crystallized water molecules in the precipitates of low concentration solutions is also uncertain, due to the lack of experimental data.13,14 Several theoretical models based on aggregation and gelation give insight into possible cluster composition and related transport in WIS electrolytes as a function of broad values of salt concentration.12,15 On the other hand, experimental studies linked with molecular dynamics simulation suggest the possibility of Li+ transport in percolating nano-domains or via a solvent exchange model.16–18 Most of these discussions are based on electrochemical impedance spectroscopy (EIS) for measuring ion transport under blocking conditions, Raman spectroscopy for determining the salt association, and pulsed-field gradient nuclear magnetic resonance (PFG-NMR) for understanding self-diffusion, measured on materials with concentrations only up to 21 mol kg−1.19 Thus, it remains necessary to measure and analyze physical and electrochemical behavior of this binary WIS system in the semi-solid regime, in order to better understand the ion conduction mechanism. Furthermore, no direct electrochemical measurements of cationic transference numbers have been performed on these materials.
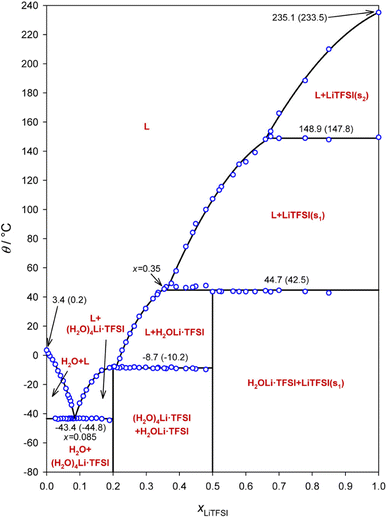 | ||
| Fig. 1 Phase diagram of the LiTFSI–H2O WIS system. The open circles show the measured phase transition points, the solid line shows different phase fields, and the nonvertical line segments show polynomial fits to the open circles in the appropriate segments. The phase transition temperatures are given both as peak temperatures determined from the DSC scan and as onset points in brackets. Reprinted with permission from ref. 13. Copyright 2018 American Chemical Society. | ||
In this article, we investigate the electrochemical and structural properties of the LiTFSI–H2O model WIS system in the semi-solid regime for molalities above 21 mol kg−1. Temperature-dependent powder X-ray diffraction (PXRD) and magic angle spinning (MAS)-NMR were used to study the structural states of the system. We report several new phenomena including the low electrochemical lithium transference number and the existence of local minima in temperature-dependent conductivity at various salt concentrations.
2 Results and discussion
2.1 Structural characterization of LiTFSI–H2O with concentrations above 21 mol kg−1
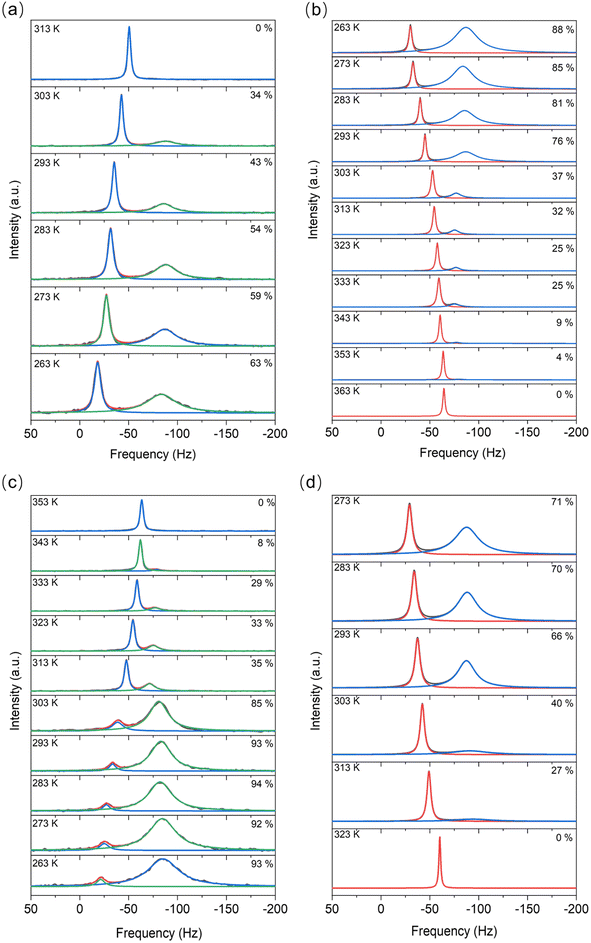
For the LiTFSI–H2O system above 40 mol kg−1, a mixture of both solid and liquid phases was observed by 6Li MAS-NMR at most considered temperatures (Fig. 2). The narrow signal (high frequencies/low field) remains with about the same line widths under magic angle spinning (MAS) conditions, but the broader signal (low frequencies/high field) becomes noticeably narrower and separates. In addition, the narrow signal has much shorter relaxation times at any temperature compared to the broader signal.Contrary to 6Li MAS-NMR, DSC measurements (Table S1 and Fig. S1†) show no significant difference between cooling and heating cycles for concentrations higher than 21 mol kg−1. The sharp and narrow DSC peaks (Fig. S1†) indicate that a phase transformation occurs with a fast kinetic response during both heating and cooling processes. Nevertheless, in the heating process, the melting point observed from NMR lies at about 313–323 K while in the cooling process, the crystallization points appear at about 293–303 K. Apart from these two main peaks, there is still a small endothermic process, the peak of which lies at around 353–373 K. The broadness and the low peak intensity here imply a gradual phase transformation process. Moreover, this peak fits well with the results of temperature dependent XRD measurements showing the transition from solid to liquid phase vide infra. We do not observe any micro-precipitations in the WIS at high concentrations during the heating/cooling step.
Integration of the signals in the 6Li MAS-NMR spectra provides the ratio between the liquid (high frequency signal) and solid (low frequency signal) phases throughout the melting/solidifying process. The quantitative conditions in the spectra were ensured by very short excitation pulses (π/10) and very long relaxation delays of 30–50 s, and were regularly verified by the measurements of T1 relaxation times. Variations of the relative ratios of the phases with the temperature are shown along the spectra in Fig. 1. By considering these data along with the results from DSC listed in Table S1,† we found that for both samples, the cooling process shows a fast kinetic response, meaning that a large change in the liquid-to-solid ratio appeared around the point where the solid phase forms. The phase transformations are different during the cooling versus heating processes over the same temperature range, with the cooling being faster than heating transformation . For instance, from 313 K to 263 K, a roughly 20% higher mole ratio of the solid-state phase has been observed in the cooling process (Fig. 2a and b), compared to the heating process, which is probably due to both kinetic and thermodynamic reasons. A more detailed study is called for in the future. Moreover, as the transformation to the liquid state progressed to completion, the liquid state peak shifts toward intermediate values between the peaks assigned to the liquid and crystalline phases in the mixed state. On heating the mixture of liquid and hydrated LiTFSI, dehydrated LiTFSI should appear and then gradually transform into the liquid state. Thus, the shift in the liquid phase peak (Fig. 2a and b) appears to correspond to the relatively increasing population of solvated LiTFSI interactions. Additionally, it has been shown that ion–ion association in the solvent can be favored at higher temperatures, for example, between solvated lithium and triflate ions in lithium triflate/diglyme electrolyte.20 The origin of this effect is the negative value of the enthalpy of dissociation in the van't Hoff equation – the increase in temperature shifts the equilibrium to the endothermic direction, thus decreasing the concentration of free ions on account of increasing the concentration of ion pairs.
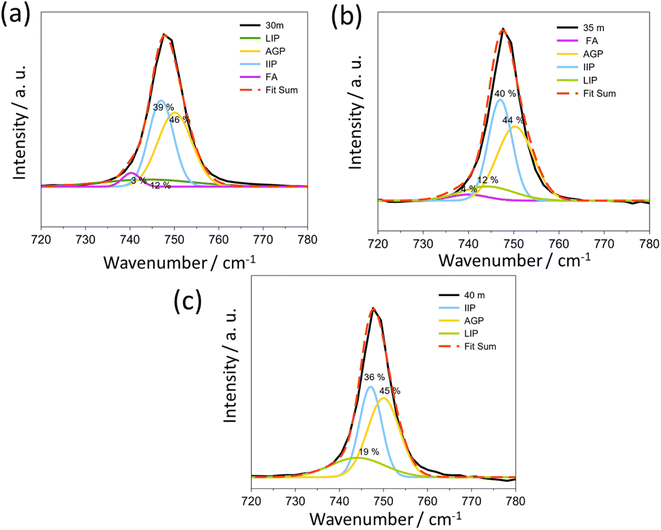
In WIS at higher salt concentrations, TFSI− anions are expected to coordinate to two or more Li+ cations, resulting in polymeric-like aggregates.21 Raman spectroscopy can be used to characterize both the solvent and anion coordination to Li+ cations. In Raman spectra, the peak corresponding to the S–N–S, C–S, and –CF3 stretches of the TFSI− anion (at around 740–750 cm−1) can help to characterize the aggregation state of the anion. According to previous publications, the peaks at 740, 744, 747, and 750 cm−1 correspond to the free anion (FA), loose ion pair (LIP), intimate ion pair (IIP) and aggregate ion pair (AGP), respectively.22
For 1 mol kg−1 solution (Fig. S2†), the LIP is the major species of TFSI in the solution, while the rest are present as free ions. When the concentration increases, the signal of highly aggregated anions appears at 5 mol kg−1 and becomes the dominant interaction at concentrations up to 21 mol kg−1 (Fig. S2†). From 30 mol kg−1 to 40 mol kg−1 (Fig. 3), the AGP and IIP are the two main components in the material, both around 40%.
The position of the peak assigned to aggregated pairs in Fig. 3 is slightly higher than that previously reported, but this is necessary to obtain a good fit as shown in Fig. S2.†22 In most cases, no Bragg peaks associated with the anhydrate crystal structure were observed in the XRD pattern (Fig. 4, below) at room temperature prior to temperature cycling. This suggests that the anhydrate LiTFSI crystal phase is typically negligible in the as-prepared samples, despite always nucleating upon cooling of the melt. The Raman peak related to this phase lies at about 748.6 cm−1. These results illustrate that a transition occurs for Li+ and TFSI− from free ions and anions to the LIP and then to the IIP and AGP. The “polymeric” aggregation between Li+ and TFSI− becomes much stronger with an increasing salt concentration. Conversely, as the ion aggregation becomes stronger, the values of viscosity also increase (Fig. S3†).
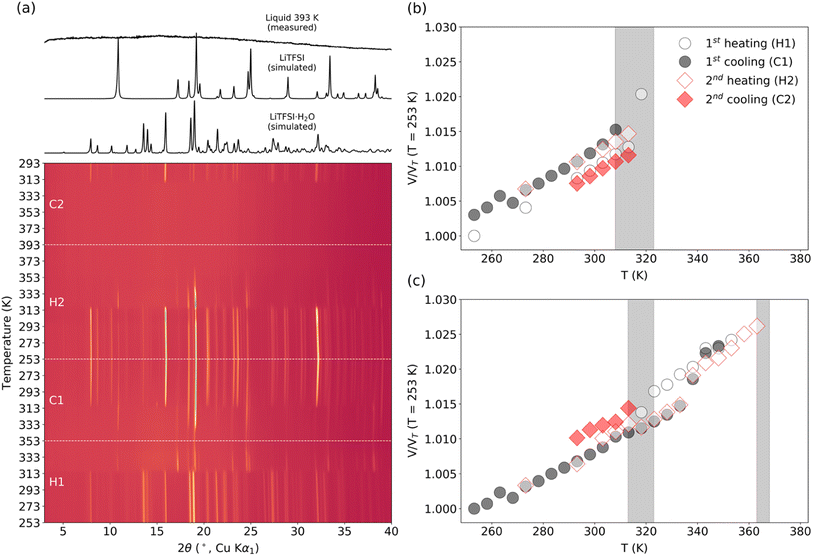
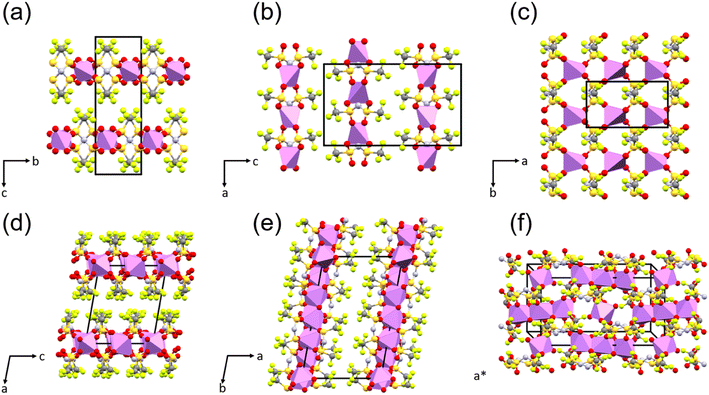
The structure of the sample can significantly influence the temperature-dependent electrochemical performance. Thus, it is necessary to monitor any changes associated with heating or cooling processes. Samples of WIS with 55.5 mol kg−1 LiTFSI were measured by temperature-dependent PXRD. In the first heat–cool cycle, the sample was heated to 353 K (below the melting point for LiTFSI) and then cooled back down to room temperature. In the second heat–cool cycle, the sample was heated to 393 K (see the ESI for more details about the measurements†). According to the phase diagram, two different crystalline forms can coexist at this composition: monohydrate LiTFSI·H2O and anhydrate LiTFSI.13 The structures of both have already been reported and are shown in Fig. 5.23,24 For a 55.5 mol kg−1 sample, the ratio between LiTFSI and H2O is almost 1![[thin space (1/6-em)]](https://www.rsc.org/images/entities/char_2009.gif) :
:![[thin space (1/6-em)]](https://www.rsc.org/images/entities/char_2009.gif) 1, so LiTFSI·H2O is expected to be the dominant phase at around room temperature. In fact, for most measurements, the as-synthesized samples only showed Bragg reflections associated with LiTFSI·H2O, although in some cases peaks with very small intensity could be associated with LiTFSI. As shown in Fig. 4a, upon heating the starting sample, LiTFSI·H2O was observed to disappear completely at 313–323 K, coinciding with a substantial increase in Bragg peaks associated with LiTFSI. An additional increase in diffuse scattering at around 2θ = 15° could also be associated with the presence of a liquid phase. This is in good agreement with the DSC measurement results (Table S1†), where we observed that the dehydration process occurred abruptly. Upon further temperature increase, disappearance of LiTFSI peaks was observed to occur at around 363–368 K. This value is significantly lower than the melting point reported in the published phase diagram (∼393 K). DSC measurement indicates a very broad endothermic feature at around 375.7 K. This is likely due to continuously increasing solvation of LiTFSI from the crystalline fraction as the liquidus curve approaches higher LiTFSI concentrations with increasing temperature up to the melting point. All measurements of LiTFSI in a capillary geometry were also subject to severe errors in relative Bragg intensities (despite spinning the capillaries at a high RPM), likely due to the poor orientational averaging of the crystalline fraction, which may further decrease the measurement sensitivity to very small fractions of LiTFSI in a predominantly liquid phase.
1, so LiTFSI·H2O is expected to be the dominant phase at around room temperature. In fact, for most measurements, the as-synthesized samples only showed Bragg reflections associated with LiTFSI·H2O, although in some cases peaks with very small intensity could be associated with LiTFSI. As shown in Fig. 4a, upon heating the starting sample, LiTFSI·H2O was observed to disappear completely at 313–323 K, coinciding with a substantial increase in Bragg peaks associated with LiTFSI. An additional increase in diffuse scattering at around 2θ = 15° could also be associated with the presence of a liquid phase. This is in good agreement with the DSC measurement results (Table S1†), where we observed that the dehydration process occurred abruptly. Upon further temperature increase, disappearance of LiTFSI peaks was observed to occur at around 363–368 K. This value is significantly lower than the melting point reported in the published phase diagram (∼393 K). DSC measurement indicates a very broad endothermic feature at around 375.7 K. This is likely due to continuously increasing solvation of LiTFSI from the crystalline fraction as the liquidus curve approaches higher LiTFSI concentrations with increasing temperature up to the melting point. All measurements of LiTFSI in a capillary geometry were also subject to severe errors in relative Bragg intensities (despite spinning the capillaries at a high RPM), likely due to the poor orientational averaging of the crystalline fraction, which may further decrease the measurement sensitivity to very small fractions of LiTFSI in a predominantly liquid phase.
In the first cooling run, LiTFSI remained in the sample, even after the reformation of LiTFSI·H2O between 313 and 308 K. This can be expected given that a mixture should be stable over the temperature ranges studied below 313 K. In the second cooling run, the sample was cooled from the molten state, and we did not observe any crystallization until 318–313 K when both LiTFSI and LiTFSI·H2O crystallized. This overcooling process agrees well with the DSC measurements shown in Table S1 and Fig. S1.† However, in separate heat cycle measurements, reformation of the anhydrate crystal phase between 373 and 353 K was observed. Variations in different measurements could be affected by slight differences in the composition of the full mixture, by small fluctuations in the water concentration (e.g., by water vapor remaining in the open volume within the capillary on cooling or possibly through off-gassing through imperfections in the capillary seal), or by formation of nonstoichiometric regions due to kinetic limitations.
The principle coefficients of thermal expansion determined using the PASCal software for LiTFSI·H2O from the unit cell values in the 1st cooling cycle over a range of 253–308 K and for LiTFSI over a range of 253–333 K are shown in Table S2† (see the ESI for principle directions along the lattice and more details of the PASCal output).25 Overall, LiTFSI shows a slightly smaller overall volumetric expansivity, but with more pronounced anisotropy. The primary expansion occurs along the [001] direction, perpendicular to the layered bonding network formed by Li and TFSI molecules, as might be expected. There is also a marked anisotropy within the layers, where expansion only occurs significantly along the [100] axis. This may indicate a weaker Li–TFSI interaction in this direction and might be expected to affect conduction pathways along [010]. Despite the distinct layered structure of LiTFSI·H2O, it displays less anisotropic, albeit larger, thermal expansion. The largest X3 component suggests a preference for non-orthogonal expansion between the layers, while the other components may suggest more significant intralayer expansion compared to LiTFSI. In this case, conduction pathways may be expected to exist within the (100) plane, where the 2D channel provides a rich plethora of oxygen coordination environments.
2.2 Ion transport in LiTFSI–H2O
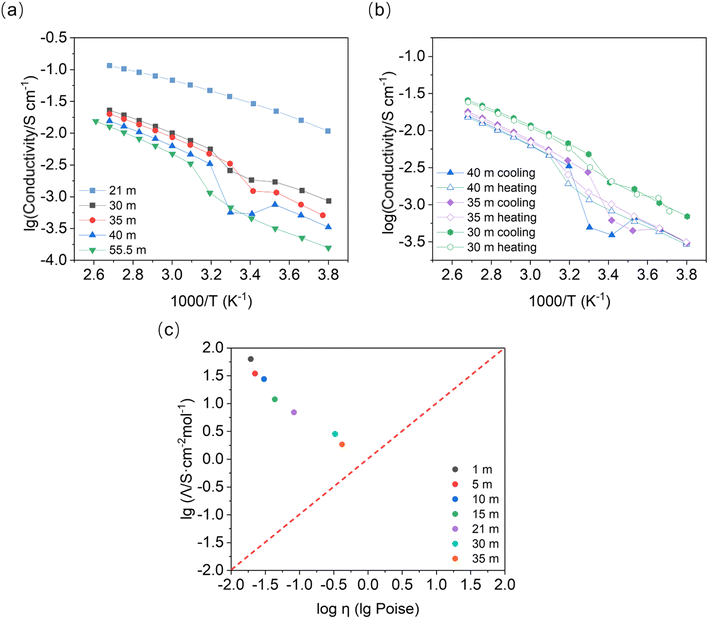
Variation in the temperature-dependent ionic conductivity during cooling of the binary system is reported to be linear due to the overcooling effect. An abrupt change in the slope (or activation energy) may occur in the heating process due to the slow phase transformation.26 We observe a local minimum in the concentration range of 30 mol kg−1 to 40 mol kg−1, at about 313–293 K in the cooling process (Fig. 6). This conductivity minimum may be present in the concentrations between 21 mol kg−1 and 30 mol kg−1, which were out of the scope of this study (note: prolonging measurement rest times at specific temperatures may lead to a more linear response). Interestingly, a similar process is not observed upon heating. We observed no change in the slope, indicating that melting has no influence on the activation energy (∼0.25 eV) within the given concentration range. According to the phase diagram, we find that the conductivity minimum appears at around the temperature of the phase transformation for LiTFSI·H2O to LiTFSI.13 However, the phase transformation here appears to happen at higher temperature than for the DSC peaks in Fig. S1† when the concentration of LiTFSI lies between 30 mol kg−1 and 55.5 mol kg−1 for both heating and cooling processes. This diminishes the influence of overcooling. Thus, it is more likely that the different phases present will behave differently in a full thermodynamic cycle. When heterogeneous nuclei were introduced into the system (e.g. nanoparticles in soggy-sand electrolyte), the decrease in conductivity became much stronger. When silica or alumina nanoparticles were added to the system (Fig. S5†), the liquid–solid phase transformation occurs even in the fully liquid system according to the phase diagram (21 mol kg−1, from 283 to 263 K) and the conductivity drop was much stronger than that shown in Fig. 6a (30 mol kg−1).Remarkably, the turning point of activation energy (slope change) in Fig. 6 during the cooling process appears higher than the phase transformation points measured by DSC (Table S1†). For example, the crystallization point for 40 mol kg−1 is about 246 K, while the slope change in Fig. 6 happens at around 313 K. Thus, it can be speculated that during the cooling process, a preferred phase orientation may form and decrease the ionic conductivity of the material. This may be supported by the observation of severe orientation/sampling effects in PXRD, although the sample geometries of the measurements are different. After cool-down, the conductivity recovery indicates that the solid phase formed later could be beneficial to the ionic conductivity. During the melting process, the phase transformation shows no alteration of the activation energy.
A Walden plot shows the correlation between the ionic conductivity and viscosity of the investigated materials. In Fig. 6c, the data points for the LiTFSI–H2O system lie in the upper part of the Walden plot above the ideal solution line (in red), where the aggregates are the dominating species.27 Here we confirm once more that the WIS electrolytes form a material class characterized by good ionic conductivity and relatively low viscosity. Most importantly, the phase transformation plays a crucial role in the ionic conductivity of these superionic liquid materials.
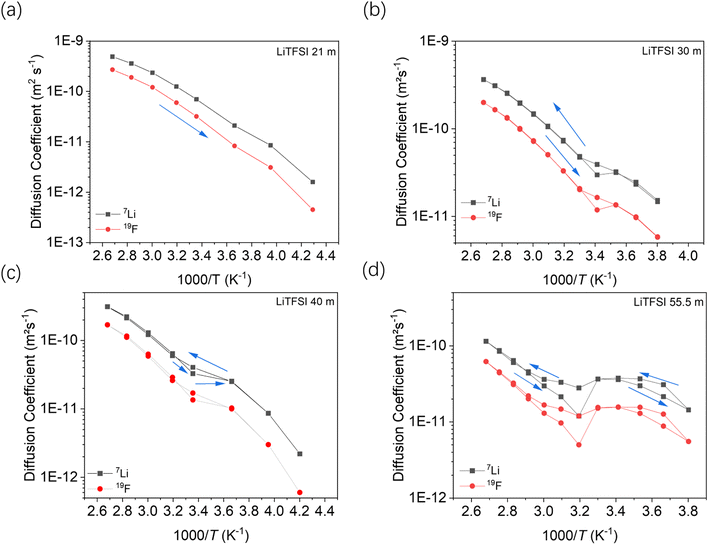
Fig. 7 shows the temperature dependent diffusion coefficients measured by PFG-NMR at different concentrations of the salt. According to the previous ion transport model, there are at least two kinds of ionic clusters or nano-domains participating in ionic conductivity, including a water-rich cation cluster and cluster with aggregated salt.16 In that model, the lithium ions are expected to move faster in the water-rich domain.
According to the phase diagram, 21 mol kg−1 WIS electrolyte is a mixture of the LiTFSI·4H2O and LiTFSI·H2O phases, and DLi should plummet when the concentration reaches 55.5 mol kg−1, for there will be no water-rich phase in the system.28 However, as we can see from Fig. 6a to Fig. 6d, the DLi declines only insignificantly by about 2 times from 21 mol kg−1 to 55.5 mol kg−1 at room temperature. Thus, the previous explanation cannot be valid for the system at higher concentrations. In previous studies, the authors claimed high cationic transference number following from the fact that DLi was higher than DF, as measured by PFG-NMR  . However, PFG-NMR gives an average of all ionic species containing Li, meaning that any cluster containing Li will be counted including the negatively charged ones.28,29 We also observe high transference numbers by PFG-NMR, namely 0.68 in 21 mol kg−1, 0.70 in 30 and 40 mol kg−1, and 0.71 in 55.5 mol kg−1. Meanwhile, electrochemical lithium transference number, tLi, can also be measured by combining the galvanostatic polarization technique with EIS (Fig. 8).30 Note that LiTFSI–H2O electrolytes are highly reactive with lithium metal, forming a solid electrolyte interphase (SEI). This is why it was not possible to perform any kind of equilibration before the polarization experiment. For the electrolytes in the medium concentration range (21 mol kg−1), we chose nanostructured Li0.5FePO4 electrodes (see the ESI†), exhibiting a stable SEI. The same electrodes were not applicable for solid-state electrolytes, as these cannot penetrate the nanostructured electrode. Thus, we were forced to use highly reactive lithium metal. However, in those cases (Fig. 8c and d), we carefully deduced the USEI (RSEI × I) contribution to the total U–t curve.) The tLi in the LiTFSI–H2O binary system is much lower than that in salt-in-solvent electrolytes, from 21 mol kg−1 to 55.5 mol kg−1, none of them being higher than 0.1 (Table 1). As previously stated, it has been speculated that the LiTFSI·4H2O (tetrahydrate) phase contributes the most to the ionic transport mechanism.1,7,16 If this is true and this phase is present in our system (expected from the phase diagram), with an increasing salt concentration, the amount of LiTFSI·4H2O should decrease and finally vanish at 55.5 mol kg−1 where LiTFSI·H2O and LiTFSI phases exist according to the phase diagram. Thus, the lithium transference number should also decrease accordingly.
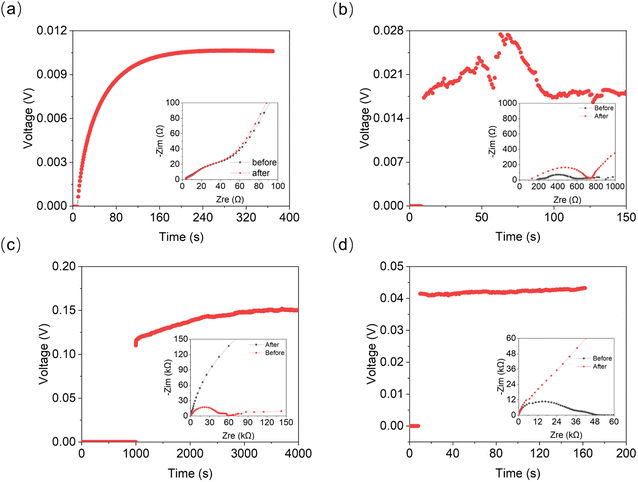 | ||
| Fig. 8 Galvanostatic polarization measurement linked with EIS for determination of cationic transference numbers of (a) 21 mol kg−1, (b) 30 mol kg−1, (c) 40 mol kg−1, and (d) 55 mol kg−1 LiTFSI solution. The full-scale EIS plots are given in Fig. S6, ESI.† | ||
| Salt concentration | 21 mol kg−1 | 30 mol kg−1 | 40 mol kg−1 | 55.5 mol kg−1 |
|---|---|---|---|---|
| t Li,PFG-NMR | 0.68 | 0.70 | 0.70 | 0.71 |
| t Li,pol | 0.0075 | 0.02 | 0.005 | 0.07 |
However, the NMR and electrochemically measured lithium transference number for 55.5 mol kg−1 is slightly higher than that of 21 mol kg−1. Thus, there is an increasing contribution of Li containing cations or positively charged aggregates to the transference number with an increasing concentration, which counteracts the effect of the decreasing LiTFSI·4H2O phase.
Ref. 31 derives – based on the concept of conservative ensembles – the detailed expressions for AC-conductivity, steady state DC-conductivity in a polarization experiment and conductivity derived from the PFG-NMR experiments, if discrete species can be identified and internal dissociation reactions are fast.30 Explicitly treated are the Li+, X−, LiX, Li2X+ and LiX2− species. Even though the situation in the LiTFSI–H2O system is more complex, the results from a numerically solvable system treated in ref. 31 may serve as guidance for the origin of lithium transference number depletion seen from the polarization experiment. While for the tracer experiment all the species containing the tracer atom contribute, the situation for the electric experiment is more intricate. Here Li+ and Li2X+ contribute as positive species and X− and LiX2− as negative species to the total conductivity. In the polarized state, only Li+ can be transferred, nonetheless LiX, LiX2− and Li2X+ still contribute to the total Li transport via dissociation reactions. For example, LiX can provide transferable Li+ by dissociation and back-transport of X−; similarly Li2X+ and LiX2− can contribute via the counter-flow of the respective associates and species containing less Li+ (e.g. LiX). The flow directions of Li2X+ and LiX2− are opposite. An explicit application of this concept by a multi-method approach was given in ref. 28 and 31 where σpol:
(The parameter s denotes the mobility of neutral LiX times the concentration times Faraday constant).
The effects of LiX, Li2X+ and LiX2− on the lithium transference number derived from a polarization experiment  are different. The neutral ion pair increases tpol owing to the counter-flow effect. The influence the ion triples (both Li2X+ and LiX2−) have on the lithium transference number is a result of two opposite effects, the above counter-flow effect and the explicit appearance of the conductivities of these two species in
  . The ESI† gives numerical examples for σLi+ = σX− showing that an increased
  and an increased σLi2X+/σLi+ lower the lithium transference number, tpol, as the second effect dominates. The lowering of tpol is even more efficient for
  than for σLi2X+ since the
  flow is opposite to the Li+ flow (note that we cannot tentatively ignore σX− as it may be needed for the counter flux). For the conductivity derived from PFG-NMR we simply have
A high number of associates drives  to high values yet not to extreme ones as σX− does not enter σLiPFG-NMR in accordance with the experimental values. Qualitatively speaking, charged associates, in particular negatively charged ones, can explain the experimental results that tpol ≪ tPFG. A numerical analysis can be found in the ESI.† Clearly, the concept of conservative ensembles provides a deeper insight, but cannot be expected to quantitatively account for the results, as at these high concentrations, very complex interactions take place and specific considerations are necessary for a detailed understanding.
3 Conclusion
In conclusion, we systematically measured the electrochemical and physical characteristics of the LiTFSI–H2O system in the semi-solid state (above 21 mol kg−1) and discovered some new phenomena including a low lithium transference number and local minima in the temperature-dependent conductivity at various concentrations. The transference number of elemental Li calculated from the results of PFG-NMR Li is still extremely high when the mole ratio of Li and H2O reaches 1![[thin space (1/6-em)]](https://www.rsc.org/images/entities/char_2009.gif) :
:![[thin space (1/6-em)]](https://www.rsc.org/images/entities/char_2009.gif) 1. Meanwhile, the transference numbers of cations calculated from the electrochemical measurements which we were able to perform for the first time in symmetric Li and Li0.5FePO4 cells for various concentrations from 21 mol kg−1 to 55.5 mol kg−1 are even lower than 0.1. This result shows that the previously suggested model of fast ion transport in a nanotunnel is not a good description for this system. It is more likely that aggregates predominantly contribute to the ion transport, which can also explain the large discrepancy between transference numbers derived from electric polarization experiments and PFG-NMR. Detailed thermal expansion properties of the LiTFSI·H2O and LiTFSI phases are also given, important for better understanding the solid-phase contribution to ionic conductivity. Our work may stimulate future development of theoretical models for ion transport in WIS and contributes to filling the gap in the physical and electrochemical properties of this binary system at very high salt concentrations. For the future development of energy storage devices based on water-in-salt electrolytes, an improvement of electrode/electrolyte interfacial reactivity is necessary.
1. Meanwhile, the transference numbers of cations calculated from the electrochemical measurements which we were able to perform for the first time in symmetric Li and Li0.5FePO4 cells for various concentrations from 21 mol kg−1 to 55.5 mol kg−1 are even lower than 0.1. This result shows that the previously suggested model of fast ion transport in a nanotunnel is not a good description for this system. It is more likely that aggregates predominantly contribute to the ion transport, which can also explain the large discrepancy between transference numbers derived from electric polarization experiments and PFG-NMR. Detailed thermal expansion properties of the LiTFSI·H2O and LiTFSI phases are also given, important for better understanding the solid-phase contribution to ionic conductivity. Our work may stimulate future development of theoretical models for ion transport in WIS and contributes to filling the gap in the physical and electrochemical properties of this binary system at very high salt concentrations. For the future development of energy storage devices based on water-in-salt electrolytes, an improvement of electrode/electrolyte interfacial reactivity is necessary.
Conflicts of interest
The authors declare no conflict of interest.Acknowledgements
The authors appreciate funding from the China Scholarship Council. We thank Zhiqiu Hu from the University of Science and Technology of China for measuring Raman data. M. W. T. gratefully acknowledges support from BASF. Open access funding was provided by the Max Planck Society.References
- L. Suo, O. Borodin, T. Gao, M. Olguin, J. Ho, X. Fan, C. Luo, C. Wang and K. Xu, Science, 2015, 350, 938 CrossRef CAS PubMed.
- H. Zhang, X. Liu, H. Li, I. Hasa and S. Passerini, Angew. Chem., Int. Ed., 2021, 60, 598 CrossRef CAS PubMed.
- F. Beck and P. Rüetschi, Electrochim. Acta, 2000, 45, 2467 CrossRef CAS.
- W. Li, J. R. Dahn and D. S. Wainwright, Science, 1994, 264, 1115 CrossRef CAS PubMed.
- C. Yang, J. Chen, X. Ji, T. P. Pollard, X. Lü, C.-J. Sun, S. Hou, Q. Liu, C. Liu, T. Qing, Y. Wang, O. Borodin, Y. Ren, K. Xu and C. Wang, Nature, 2019, 569, 245 CrossRef CAS PubMed.
- L. Droguet, A. Grimaud, O. Fontaine and J. Tarascon, Adv. Energy Mater., 2020, 10, 2002440 CrossRef CAS.
- O. Borodin, J. Self, K. A. Persson, C. Wang and K. Xu, Joule, 2020, 4, 69 CrossRef CAS.
- L. Jiang, L. Liu, J. Yue, Q. Zhang, A. Zhou, O. Borodin, L. Suo, H. Li, L. Chen, K. Xu and Y. Hu, Adv. Mater., 2019, 1904427 Search PubMed.
- Z. Hu, Y. Guo, H. Jin, H. Ji and L.-J. Wan, Chem. Commun., 2020, 56, 2023 RSC.
- F. Wang, O. Borodin, T. Gao, X. Fan, W. Sun, F. Han, A. Faraone, J. A. Dura, K. Xu and C. Wang, Nat. Mater., 2018, 17, 543 CrossRef CAS PubMed.
- J. Yue, J. Zhang, Y. Tong, M. Chen, L. Liu, L. Jiang, T. Lv, Y. Hu, H. Li and X. Huang, others, Nat. Chem., 2021, 13, 1061 CrossRef CAS PubMed.
- M. McEldrew, Z. A. Goodwin, S. Bi, A. A. Kornyshev and M. Z. Bazant, J. Electrochem. Soc., 2021, 168, 050514 CrossRef CAS.
- M. S. Ding and K. Xu, J. Phys. Chem. C, 2018, 122, 16624 CrossRef CAS.
- G. Perron, D. Brouillette and J. E. Desnoyers, Can. J. Chem., 1997, 75, 1608 CrossRef CAS.
- M. McEldrew, Z. A. H. Goodwin, S. Bi, M. Z. Bazant and A. A. Kornyshev, J. Chem. Phys., 2020, 152, 234506 CrossRef CAS PubMed.
- O. Borodin, L. Suo, M. Gobet, X. Ren, F. Wang, A. Faraone, J. Peng, M. Olguin, M. Schroeder and M. S. Ding, others, ACS Nano, 2017, 11, 10462 CrossRef CAS PubMed.
- J. Lim, K. Park, H. Lee, J. Kim, K. Kwak and M. Cho, J. Am. Chem. Soc., 2018, 140, 15661 CrossRef CAS PubMed.
- S. R. Dillon and R. C. Dougherty, J. Phys. Chem. A, 2003, 107, 10217 CrossRef CAS.
- M. Amiri and D. Bélanger, ChemSusChem, 2021, 14, 2487 CrossRef CAS PubMed.
- M. Petrowsky, R. Frech, S. Suarez, J. Jakody and S. Greenbaum, J. Phys. Chem. B, 2006, 110(46), 23012 CrossRef CAS PubMed.
- D. W. McOwen, D. M. Seo, O. Borodin, J. Vatamanu, P. D. Boyle and W. A. Henderson, Energy Environ. Sci., 2014, 7, 416 RSC.
- L. Suo, D. Oh, Y. Lin, Z. Zhuo, O. Borodin, T. Gao, F. Wang, A. Kushima, Z. Wang and H.-C. Kim, others, J. Am. Chem. Soc., 2017, 139, 18670 CrossRef CAS PubMed.
- J. L. Nowinski, P. Lightfoot and P. G. Bruce, J. Mater. Chem., 1994, 4, 1579 RSC.
- L. Xue, C. W. Padgett, D. D. DesMarteau and W. T. Pennington, Solid State Sci., 2002, 4, 1535 CrossRef CAS.
- M. J. Cliffe and A. L. Goodwin, J. Appl. Crystallogr., 2012, 45, 1321 CrossRef CAS.
- S. Deki, S. Nakamura, A. Kajinami, Y. Kanaji and M. Mizuhata, J. Chem. Soc., Faraday Trans., 1993, 89, 3805 RSC.
- C. A. Angell, Y. Ansari and Z. Zhao, Faraday Discuss., 2012, 154, 9 RSC.
- J. Popovic, C. Pfaffenhuber, J. Melchior and J. Maier, Electrochem. Commun., 2015, 60, 195 CrossRef CAS.
- W. S. Price and P. W. Kuchel, J. Magn. Reson., 1991, 94, 133 Search PubMed.
- J. Popovic, G. Hasegawa, I. Moudrakovski and J. Maier, J. Mater. Chem. A, 2016, 4, 7135 RSC.
- J. Maier, Electrochim. Acta, 2014, 129, 21 CrossRef CAS.
Footnote |
| † Electronic supplementary information (ESI) available. See DOI: https://doi.org/10.1039/d2ta08047h |
| This journal is © The Royal Society of Chemistry 2023 |

