
 Open Access Article
 This Open Access Article is licensed under a
 Creative Commons Attribution 3.0 Unported Licence
A one-step facile process for extraction of cellulose from rice husk and its use for mechanical reinforcement of dental glass ionomer cement†
Saif
El-Din Al-Mofty‡
 a,
Nehal H.
Elghazawy‡
a and
Hassan M. E.
Azzazy
*ab
a,
Nehal H.
Elghazawy‡
a and
Hassan M. E.
Azzazy
*ab
aDepartment of Chemistry, School of Sciences and Engineering, The American University in Cairo, New Cairo, Cairo 11835, Egypt. E-mail: hazzazy@aucegypt.edu
bDepartment of Nanobiophotonics, Leibniz Institute for Photonic Technology, Albert Einstein Str. 9, Jena 07745, Germany
First published on 22nd August 2023
Abstract
Cellulose is a widely available and renewable biopolymer that can be extracted from different natural sources such as plants, and bacteria. Rice husk is of special interest as a source of cellulose, as it is abundant and has a high cellulose content. The extraction of cellulose from rice husk has traditionally been a multi-step procedure that is time-consuming and involves the use of harsh chemicals. However, in this study, a one-step facile method was developed and optimized for the extraction of cellulose from rice husks. The process involved adjusting the ratio of sodium hypochlorite solution to the mass of solid rice husk and the progressive removal of non-cellulosic constituents was confirmed via scanning electron microscopy (SEM), and Maule lignin test. The extracted cellulose was then incorporated into glass ionomer cement (GIC) for dental applications. The mechanical properties of the GIC have increased in G12 and G18 vs. an observable decrease in G21 (p = 0.02 and p = 0.01, respectively), including increased compressive strength and stiffness. The addition of 3% cellulose extracted using C12 conditions (1![[thin space (1/6-em)]](https://www.rsc.org/images/entities/char_2009.gif) husk:12 hypochlorite for 6 h) to GIC has increased GIC mechanical strength by 130% as compared to control GIC. The addition of 1% cellulose extracted using C18 conditions (1 husk:18 hypochlorite for 6 h) to GIC has increased GIC mechanical strength by 58.5% as compared to the control. In conclusion, cellulose can be extracted from rice husks using a one-step facile method, and its incorporation into GIC can enhance its mechanical properties and improve its potential use for dental applications.
husk:12 hypochlorite for 6 h) to GIC has increased GIC mechanical strength by 130% as compared to control GIC. The addition of 1% cellulose extracted using C18 conditions (1 husk:18 hypochlorite for 6 h) to GIC has increased GIC mechanical strength by 58.5% as compared to the control. In conclusion, cellulose can be extracted from rice husks using a one-step facile method, and its incorporation into GIC can enhance its mechanical properties and improve its potential use for dental applications.
Sustainability spotlightThis study presents a one-step approach to extract cellulose from rice husks, an abundant, renewable resource. Meanwhile, it presents rice husk, which is traditionally considered an agricultural waste usually burned by local farmers, causing multiple environmental challenges, as a potential valuable source of pure cellulose. Our research aligns with UN Sustainable Development Goals (SDGs) 7 (Affordable and Clean Energy), 9 (Industry, Innovation, and Infrastructure), and 13 (Climate Action). The method reduces waste and environmental impact associated with conventional extraction processes, thereby contributing to cleaner energy solutions (SDG 7) and resource efficiency (SDG 9). Additionally, integration of extracted cellulose into dental applications demonstrates the potential for sustainable materials (SDG 9). By minimizing the environmental footprint of cellulose extraction, our work supports climate action efforts (SDG 13). In summary, our research highlights the potential of sustainable materials derived from rice husks as additives to improve mechnical properties of dental fillings and support multiple SDGs. |
Introduction
Rice husk is a major agricultural waste that results from the milling of rice, the most consumed grain in the whole world. With more than 50% of the world's population using rice as a primary diet component, the amounts of the produced rice husk are huge. Unfortunately, the easiest and cheapest way to get rid of rice husk, which constitutes about 20% of the rice weight, is burning which causes undesired environmental pollution and triggers respiratory disorders. Accordingly, industrial uses for rice husks came out as an ideal solution for rice husk disposal, especially with its high availability at low cost.1–4 Another fruitful use of rice husk is the extraction of its components such as cellulose (∼35%), hemicellulose (∼25%), lignin (∼20%), and silica (∼15%). With cellulose being the main component of rice husk, it seemed promising to use rice husk as a source of cellulose and for the production of cellulose fibers.5–7 On the other hand, the industrial uses of rice husk would encourage rice farmers to sell the husk instead of burning it which would contribute to environmental sustainability.Cellulose is considered the most abundant renewable biopolymer on Earth. It can be obtained from different plants as well as the biofilms secreted by some bacteria.8,9 The high yield of cellulose which can reach up to 1.5 trillion tons per year has made it an inexhaustible source that can be included in the manufacturing of environmentally friendly raw materials and products.10 Mostly, agro-waste is the most sustainable source for obtaining cellulosic fibers which are known for their outstanding properties including biocompatibility, significant mechanical properties, and high thermal stability. Accordingly, cellulosic fibers have been incorporated into versatile industries including food, pharmaceutical, packaging, and reinforcement of composites.8,11–15
The extraction of cellulose from plant waste varies according to the plant as well as the methodology utilized for the extraction. Cellulosic fibers in plants are attached to other components such as hemicellulose or lignin.16–18 Therefore, the extraction procedure must be efficient in removing all other plant components that may affect the purity as well as the properties of the cellulose.19–21 Obtaining cellulose from rice husks can be achieved via chemical degradation, mechanical processing, or a combination of both techniques.16–18 Still, choosing the most suitable technique relies on the required final size of the fibers which can be in the micro- or the nano-size range.
The extraction of cellulose from rice husk is typically a multi-step process that can be divided into three main reactions: pre-bleaching, bleaching, and post-bleaching. First, the pre-bleaching step aims at hydrolyzing the lignin and hemicellulose in the rice husk. Pre-bleaching is mainly done using a mixture of sodium hydroxide and/or hydrochloric acid. Second, the bleaching step removes the yellowish color in the rice husk to give the purely white cellulose. The reagents used in the bleaching vary greatly from one study to another and were reported to include peracetic acid, acetic acid, hydrogen peroxide, or hypochlorite. Finally, the post-bleaching step is where the bleached product is washed thoroughly to remove any remnants of impurities from the extracted cellulose.16–18 Of note, the treatment of the bleached cellulose with concentrated sulfuric acid is widely used for the removal of the amorphous cellulose and obtaining cellulose nanocrystals.
Glass ionomer cement (GIC) is a dental material used for the dental bonding of teeth during endodontic treatment or other dental restoration procedures. It has been used by dentists instead of dental amalgam fillings which have been discontinued mainly due to their adverse health effects owing to their mercury content. Still, the relatively low mechanical performance of the GIC has encouraged researchers to test the addition of different fillers, such as cellulose, to enhance its mechanical strength.22–26 The cellulose effect on the mechanical strength of the GIC was found to vary greatly depending on the cellulose fiber's size, purity, and the loaded amount. An additional point of consideration is the source and method of extraction, where multi-step extraction procedures introduce more variables that eventually affect the final properties of the extracted cellulose.26–29 Therefore, finding a sustainable source for cellulose as well as reducing the number of steps needed for its extraction can be a potential solution for the production of sustainable cellulose. Providing the reliable properties of cellulose could improve the mechanical properties of GIC.
We here report a detailed optimized protocol for using only sodium hypochlorite solution for extracting cellulose (purity >94%) from rice husk in a single step. The procedure was optimized in terms of time and the dilution ratio of rice husk to hypochlorite. In previous studies, sodium hypochlorite solution was exclusively used for the bleaching step following the acidic/alkaline hydrolysis of the husk. The extracted cellulose was characterized by its microscopic structure, purity, lignin content, and mechanical properties. Finally, cellulose extracted using different conditions was incorporated into GIC used for dental applications to explore its effect on the yield strength and stiffness of dental GIC. Therefore, this study aims to develop a facile one-step reaction for the extraction of cellulose from rice husk using sodium hypochlorite.
Materials and methods
Materials
Raw rice husk (Fig. S1†), was obtained from Egyptian rice farmers of Sharkia governorate in which Oryza sativa L. is the primary rice cultivated. Rice husk is the hard protective cover on the grains of rice, which is naturally yellow-brown with a very coarse surface. Sodium hypochlorite solution (12%) was obtained from Piochem (local vendor). Ammonium hydroxide (48%) and hydrochloric acid (9.0 M) were obtained from Sigma-Aldrich (St. Louis, MO, USA). Potassium permanganate was obtained from Fischer Scientific (Hampton, NH, USA). Glass ionomer cement, used commercially, was obtained from ChangShu ShangChi Dental Materials Co., Ltd. (Jiangsu, China).Methods
Cellulose extraction from rice husk
Fig. S2† illustrates the extraction of cellulose from rice husk. Briefly, the raw rice husk was washed with distilled water, dried (50 °C for 24 h), milled, and sieved through a 75 μm diameter mesh to filter homogeneous particles, in preparation for the chemical treatment. The rice husk was heated at 65 °C in 12% sodium hypochlorite solution for 6–24 h with variations in the rice husk (solid; S) to hypochlorite solution (liquid; L) ratios as 1:12, 1:15,1:18, 1:21, and 1:24. At each respective time point, the slurry was filtered off and washed several times with distilled water where the precipitated residue was suspended in water and sonicated for 15 min at 40 °C. Finally, the batches were freeze-dried for 48 h and the obtained powder was collected for characterization.
Morphological analysis
A scanning electron microscope (SEM) model Supra 55-VP FEGSEM Zeiss was used to analyze the morphological characteristics of the extracted cellulose. All samples were gold sputtered for 15 mA for 5 min and SEM imaging was set for the SE2 signal with an electron beam of 4 kV.Quantification of alpha cellulose
To determine the alpha-cellulose percentage in rice husk, the T203 method (a standardized method to determine the quality and purity of the cellulose extracted from pulp) published by the Technical Association of the Pulp and Paper Industry (TAPPI) was used.30 In brief, 1 g of dry rice husk was weighed and added to 75 mL of 17.5% NaOH in a 250 mL conical flask. The mixture is stirred for 30 min (to dissolve b and g cellulose) to which 100 mL of distilled water was added and mixed for another 30 min. The mixture was then vacuum filtered, in a clean Buchner flask to collect the filtrate. Then 12.5 mL of filtrate was added to 5 mL of 0.5 N potassium dichromate and 25 mL of distilled water and 25 mL of concentrated sulfuric acid (98%) were added. The previous mixture was left to cool for 10 min and back titrated using 0.1 N ammonium ferrous sulfate in 10 mL of concentrated sulfuric acid per L. The endpoint was determined potentiometrically using a chloride electrode as the working electrode and a calomel electrode as the reference electrode. Eqn (1) was used to determine the alpha-cellulose percentage in rice husk.30Eqn (2) was used to determine cellulose in the extracted samples (C12, C18, and C21); only 0.1 g was used for each cellulose extracted sample. Blank titration was used by adding 12.5 mL of 17.5% NaOH instead of the filtrate.| alpha cellulose% = 100 − (6.85(V2 − V1) × N × 20)/(A × W) | (1) |
| alpha cellulose% = 100 − (6.85(V2 − V1) × N × 10)/(A × W) | (2) |
Quantification of total hydrolyzable carbohydrates
To measure the total hydrolyzable carbohydrate content of the rice husk (and in cellulose extracted by different methods), 1 g of the sample was weighed, and 40 mL of 0.05 M acetate buffer (0.33 M sodium acetate, 0.163 M acetic acid, 2 mM CaCl2 and 0.02% sodium azide; pH 5.0) were added to the sample in a conical flask. The temperature was raised to 80 °C for 1 h for gelatinization and then cooled down to 50 °C. At that temperature, 0.01 g of amylase per gram sample and 0.02 g of glucoamylase per gram sample were added to the mixture and stirred for 16 h. The mixture was then filtered using vacuum filtration in a clean Buchner flask, where the filtrate was collected in a 100 mL conical flask. 100 μL of the filtrate was diluted 1:10 with distilled water in a test tube and 1 mL of 5% phenol was added to the diluted filtrate. Then, 5 mL of 98% sulfuric acid was added to the mixture and left to stand for 10 min till color development.31 Sample absorbance was read at 490 nm in a single beam spectrophotometer Jenway model No. 7615 (Jenway, London, UK). A calibration curve was developed using dextrose concentrations of 0.5, 0.25, 0.125, and 0.0625 mg mL−1.
Qualitative detection of lignin using the Maule test
The extracted samples (20–50 mg) were weighed and mixed with 1 mL of 1% KMnO4 solution, vortexed, and then left for 10 min. Afterward, the mixture was washed twice with distilled water and then centrifuged for 2 min at 10,000g. Then, 1 mL of 1 M HCl was added to the precipitate and allowed to sit for 30 min after which it was centrifuged. The supernatant was discarded, and the precipitate was washed with distilled water twice. Finally, the residual precipitate was suspended in 1 mL of ammonium hydroxide solution (28% v/v) where the solution color obtained was indicative of the presence/absence of lignin in the samples. Rice husk is considered the negative control in this test.Incorporation of cellulose batches in glass ionomer cement
Fig. S3† illustrates the incorporation of extracted cellulose into GIC cylindrical molds. Briefly, cellulose-reinforced GIC composites were prepared to include selected extracted cellulose conditions (C12, C18, and C21) at 1% and 3% w/w to the glass powder of commercial GIC. The selected extracted cellulose and powder were first mixed by vortexing for 1 min to achieve a homogeneous powder mixture. Afterward, the obtained powder was further mixed well, using a spatula, with the polyacrylic acid liquid in a mass ratio of 1:1. Finally, the paste was filled, and placed into a mold to dry for the recommended time according to the manufacturer's kit. The mold is removed and the obtained GIC cylinder was left to harden for 2 days before mechanical testing.
Compressive strength
Twenty-one test specimens of each of the experimental groups (n = 3) were prepared in a PLA mold of 4 mm diameter and 6 mm length, according to the standard ISO 9917-1:2007 protocol. After the GIC starts to settle the mold was disassembled to release the GIC cylinders. The GIC was left for 48 h to harden and then its compressive strength was tested using a universal testing machine Shimadzu 5 kN (Japan) with a load cell 5 kN and a crosshead speed of 1 mm min−1. The stress–strain curve was plotted, and the yield strength and Young's modulus were determined using R-studio (R program v. 4.2.2). Plain GIC is treated as the negative control.Data analysis
The analysis of the data is done via R program version 4.0.0 and R studio version 2022.02.03 Build 492 Prairie Trillium release. The statistical analysis used was the Shapiro–Wilk test for the normality test of the data, Kruskal Wallis tests for the non-parametric grouped test, and Dunn's test for identifying the significance between groups.Results
Extraction of cellulose from rice husk
Cellulose represents almost 35–40% of the rice husk content.32 Sodium hypochlorite solution was used for cellulose extraction while varying the solid rice husk to sodium hypochlorite solution ratio (S:L) as well as the treatment time where 15 different samples were prepared. The extracted cellulose samples were characterized in terms of existing functional groups (FTIR Fig. S4†), cellulose purity (TAPPI method30), morphology (SEM), and qualitative lignin content (Maule's test) to elucidate the optimal extraction conditions to obtain pure cellulose to be incorporated into GIC.
Determination of alpha cellulose and carbohydrate composition in rice husk
Alpha cellulose in rice husk was quantified using the TAPPI cellulose quantification method (using the back titration method and ammonium ferrous sulfate as the titrant). Alpha cellulose was then determined using eqn (1) for rice husk and eqn (2) for the extracted cellulose samples. The reported cellulose in rice husk is around 35–40%.32 The cellulose content of the local rice husk used in this study was 34% as quantified by the TAPPI method. According to the phenol-sulfuric acid test, the hydrolyzable carbohydrate in the rice husk was around 2.5%; however, the extracted cellulose contained no hydrolyzable carbohydrates. Therefore, the rice husk, used in this study, contained 63.5% hemicellulose and lignin. Previous reports indicate that rice husk contains around 20–25% lignin.32 The extracted cellulose samples of C12, C18, and C21 contained 95%, 93.4%, and 86.84% alpha-cellulose, respectively. These values were determined from the volumes of the titrant shown in Fig. S6† showing the plateau of the titration curve and the first derivative (Fig. S6†) identifying the endpoint of the titration. These data are in alignment with previous reports.32 Fig. S5† shows the calibration curve of dextrose measured using phenol-sulfuric acid method.Scanning electron microscopy
All batches of the extracted cellulose were visualized using SEM to examine the morphology of cellulose without any preprocessing such as mincing or crushing that could alter their fine morphology. The main goal while visualizing the samples was to confirm the presence of cellulose and, at the same time, to make sure that the extraction procedure eliminated or minimized the lignin content. SEM images obtained for all 15 analyzed extracts have clearly shown that the solid-to-liquid (S:L) ratio (husk:hypochlorite) significantly influences the contents of the sample in terms of cellulose as well as other rice husk components. As shown in Fig. 1, all C12 samples have shown observable rice husk bundled strands that were not degraded. On the other hand, celullose extracts of C15–C24 have shown no bundled strands which further confirms the effect of the solid-to-liquid ratio on the result obtained. Still, it is worth mentioning that C21 and C24 samples were quite similar which indicates that when the S:L ratio exceeded 1:21, the outcome is unchanged. So, there is a direct correlation between the amount of introduced hypochlorite solution and the amount of oxidized cellulose that eventually fused to form flakes as shown in C21 and C24 extracts (Fig. 1). The mean diameter of cellulose fibril-like structures obtained from SEM images in Fig. 1 is presented in Fig. 2.
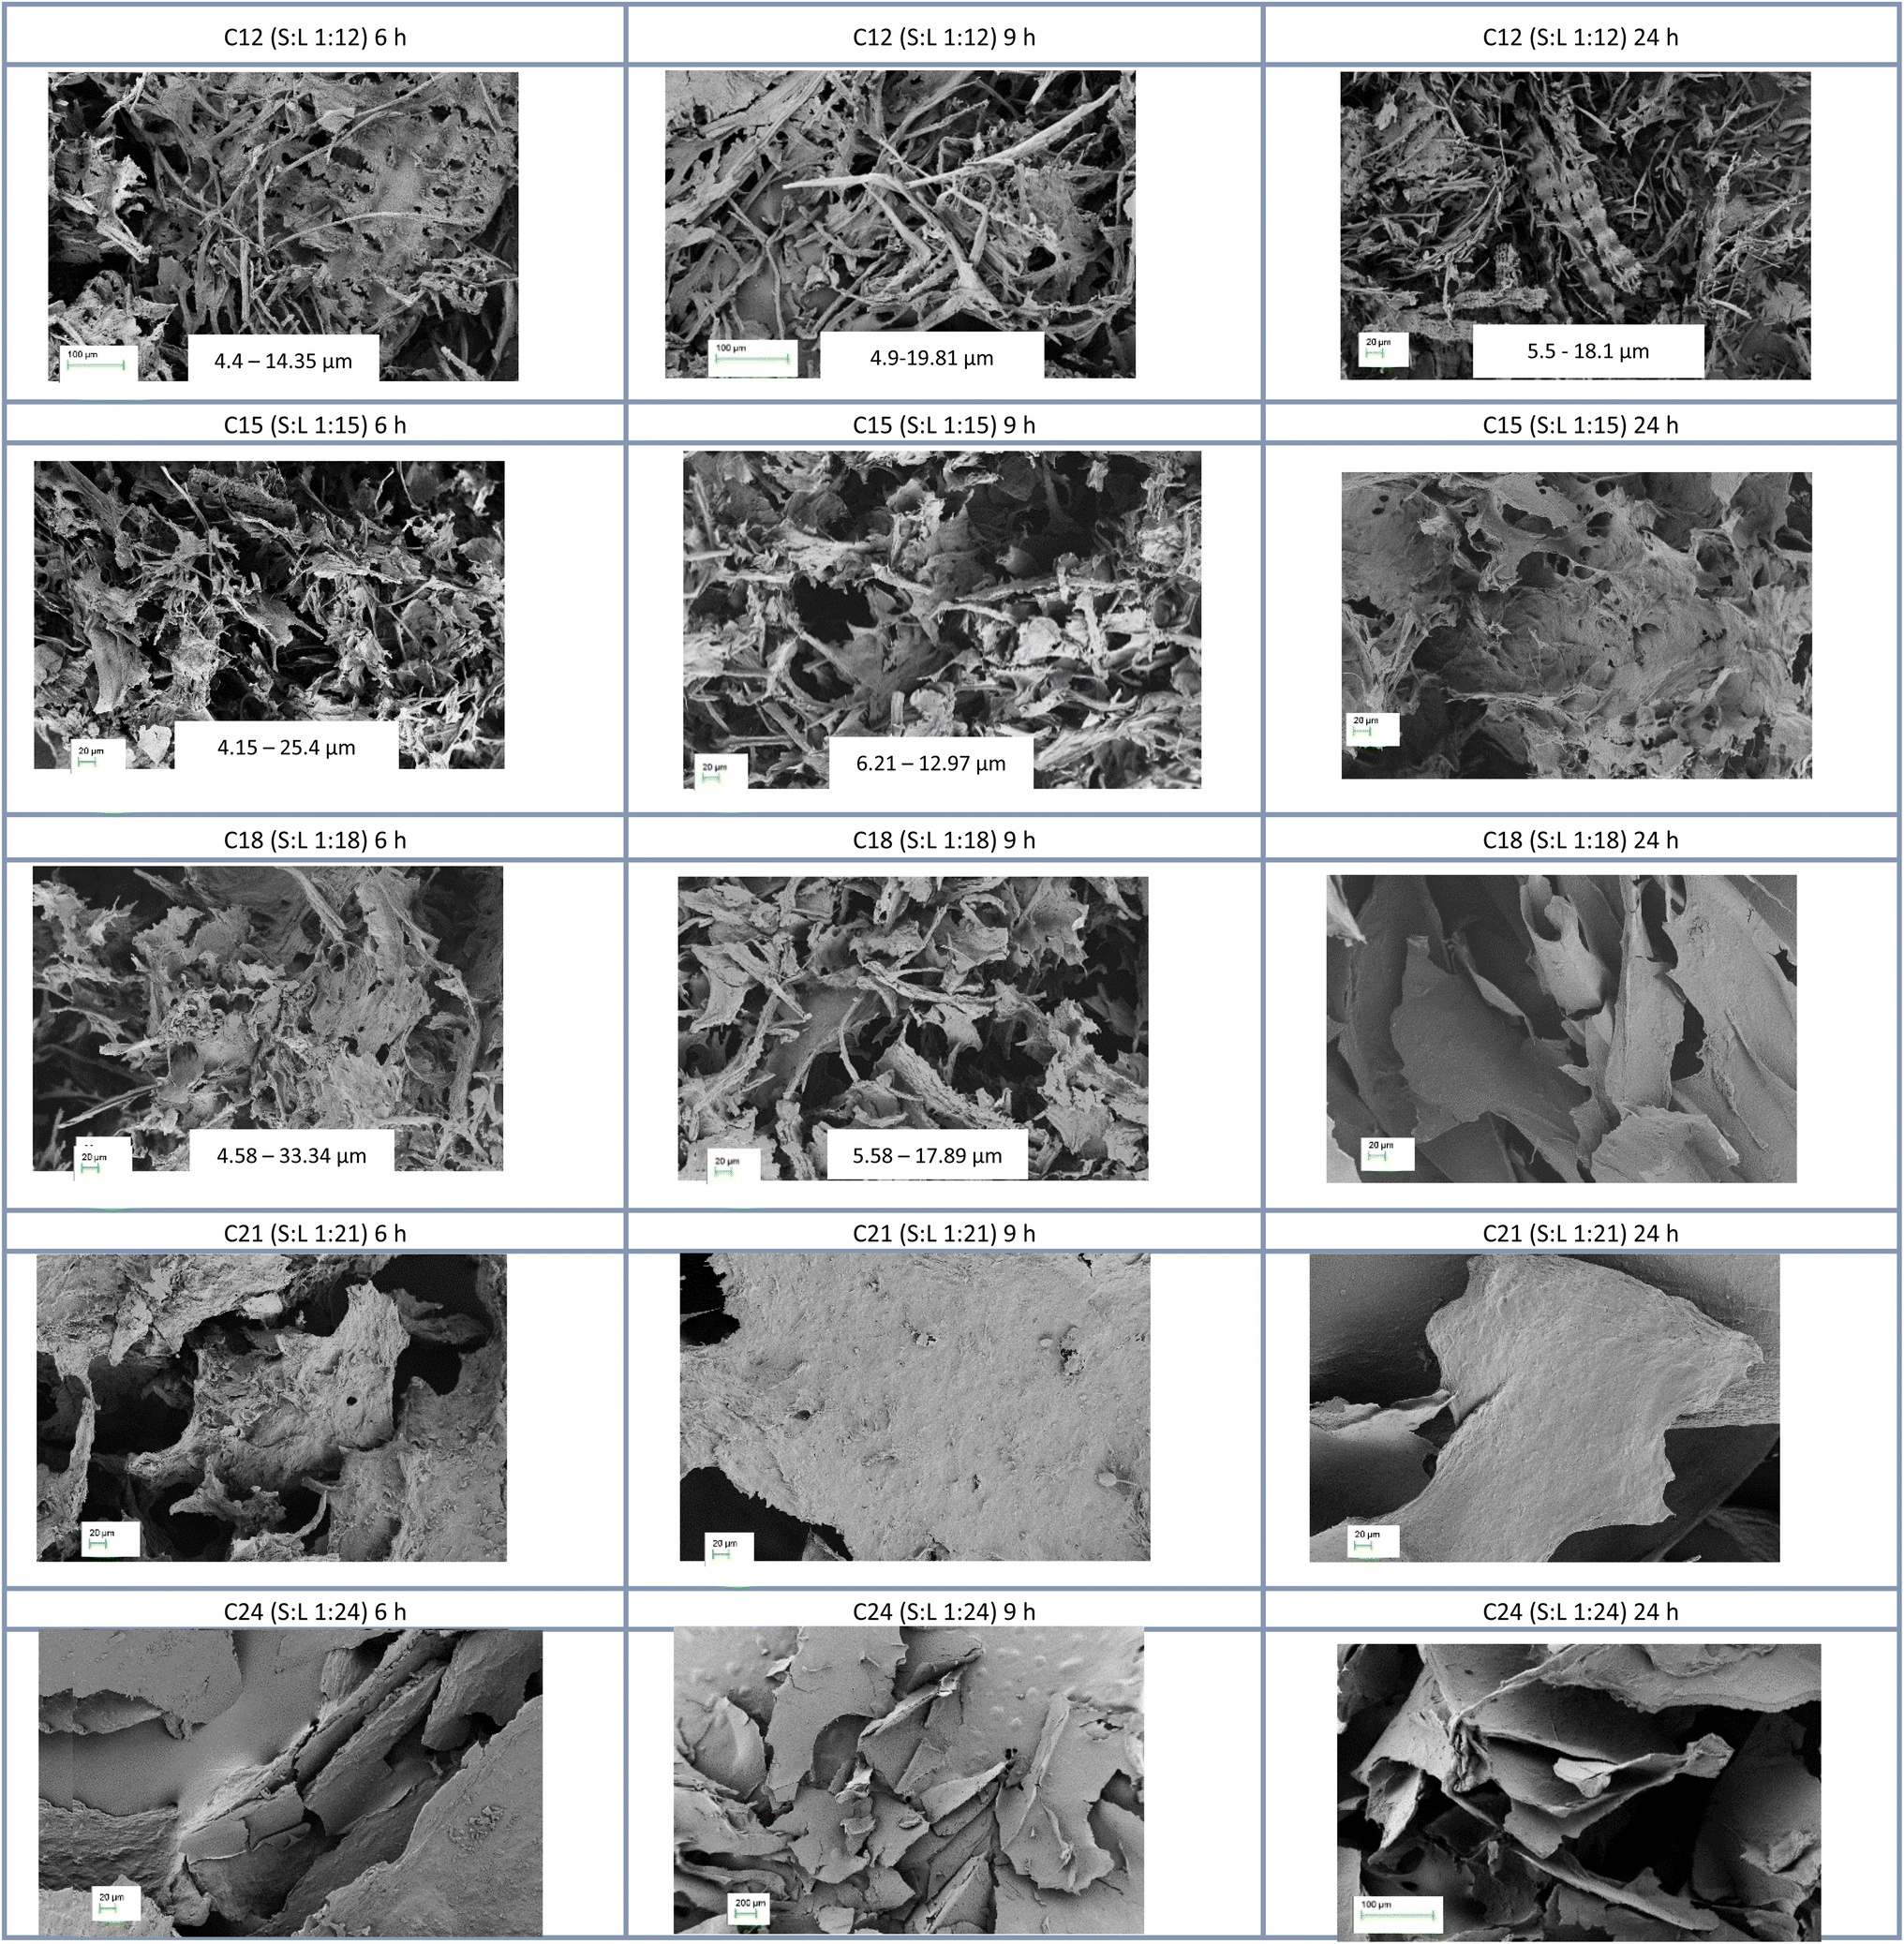 | ||
| Fig. 1 SEM images of the extracted cellulose were obtained using different ratios (1:12, 1:15, 1:18, 1:21, and 1:24) of solid rice husk to hypochlorite solution and different extraction times (6, 9, and 24 h). | ||
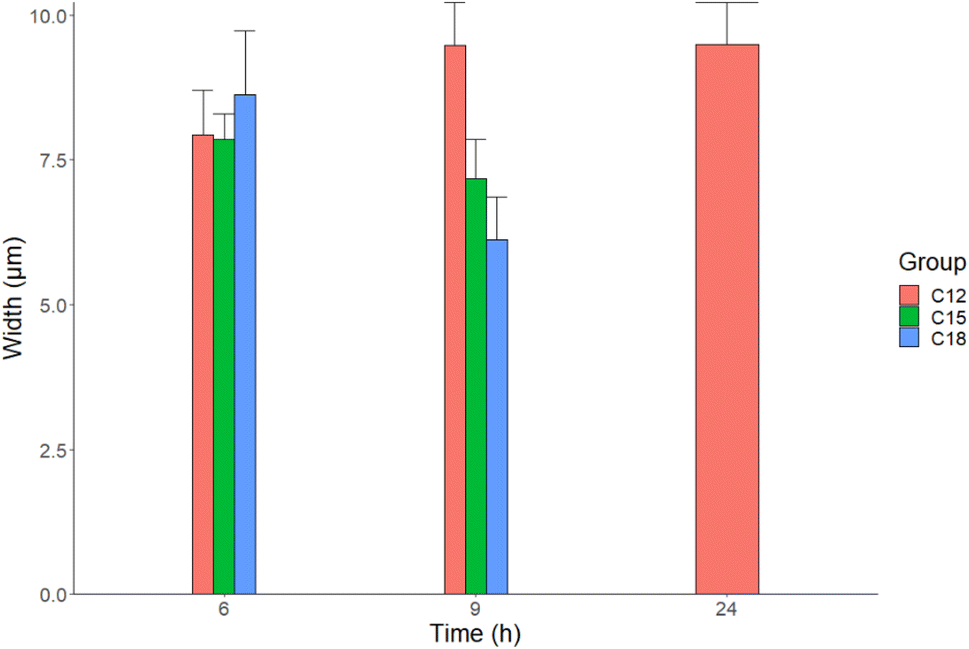 | ||
| Fig. 2 Width measurements of cellulose from SEM images that showed fiber-like structures. | ||
Maule lignin test
The Maule test is a qualitative test for lignin which is used to test pulp wood to differentiate between hard from soft wood fibers. The test generates a red brick color in the presence of lignin or no color in the absence of lignin. All 15 extraction conditions prepared in this study were tested using Maule test to detect the presence or absence of lignin following treatment of the rice husk with hypochlorite solution (Fig. 3). Initially, the clean rice husk gave a rather light reddish brick color (Fig. 3A). Out of the 15 studied extraction conditions, only 5 gave a reddish tinge color much lighter than that of the rice husk, indicating that the treatment with hypochlorite solution has indeed managed to get rid of the lignin present in the rice husk in most of the samples.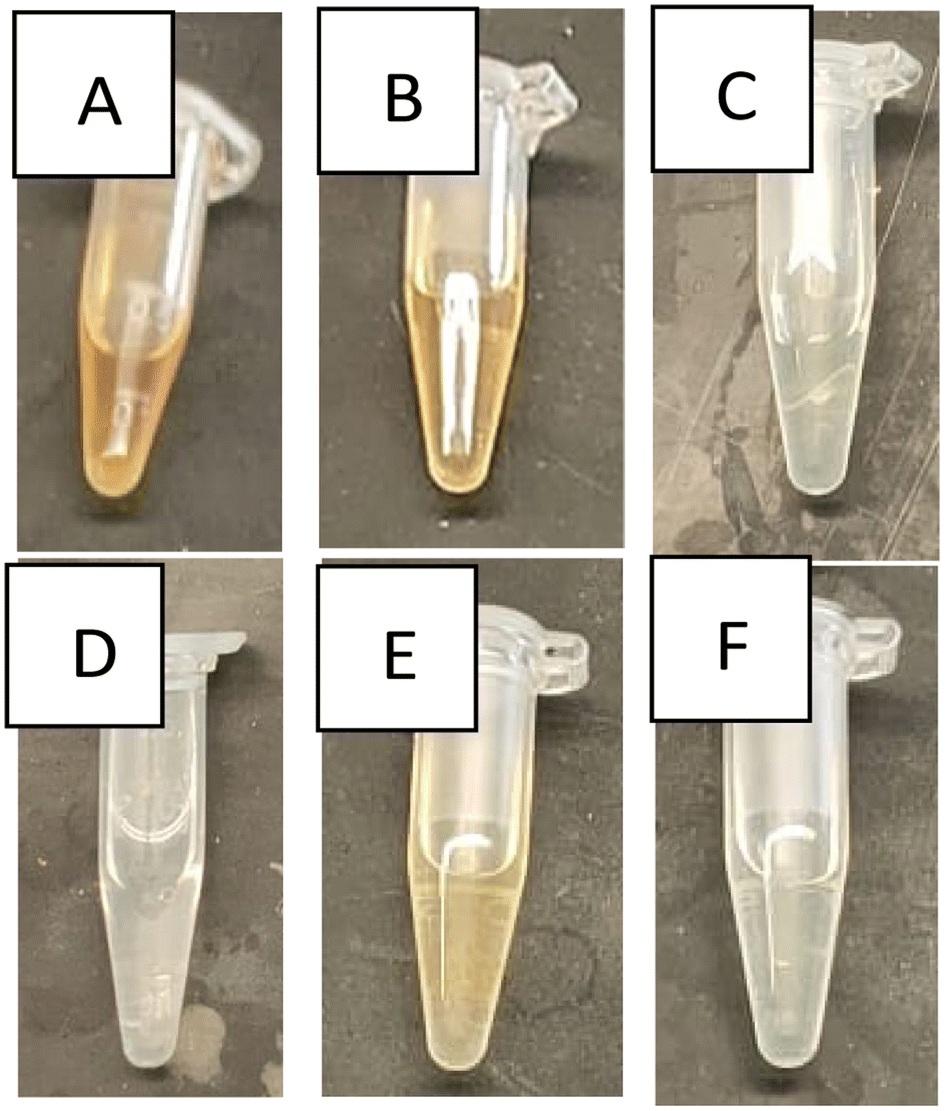 | ||
| Fig. 3 Maule's qualitative test results indicate the presence of a yellowish to brownish color in presence of lignin. (A) Raw rice husk. (B) C12: cellulose extracted using solid rice husk (S): liquid hypochlorite (L) ratio of 1:12 and 6 h of extraction. (C) C18: cellulose extracted using 1 S:18 L and 6 h of extraction. (D) C21: cellulose extracted using 1 S: 21L and 6 h of extraction. (E) C15: cellulose extracted using 1 S: 15 L and 9 h of extraction. (F) C15: cellulose extracted following 24 h of treatment with hypochlorite. | ||
Incorporation of cellulose in glass ionomer cement
The choice of the selected conditions for incorporation in glass ionomer cement (GIC) was based on the quality of the extracted cellulose as evidenced by the purity of the cellulose, SEM images, and the absence of lignin as confirmed by Maule's test. The characterization results showed that C12 and C15 batches contained observable husk components other than cellulose. On the other hand, C21 and C24 batches had no lignin; however, they contained no visible fibers but fused flakes which may hinder the functionality of the cellulose when added as a filler to GIC. Finally, the C18 batches were considered optimal for determining the effect of the extracted cellulose batches as fillers for the GIC. Consequently, C12 (6), C18 (6), and C21 (6) have been incorporated in the GIC in two different ratios, 1% and 3%. Accordingly, the formed samples are referred to as follows: G12-1, G12-3, G18-1, G18-3, G21-1, and G21-3, respectively. All 6 samples have been prepared and their mechanical strength was tested in triplicate to measure their elastic modulus and 0.2% yield strength.Fig. 4A shows bare GIC Young's modulus of 5.1 MPa ± 1.38 and an 0.2% offset yield strength of 2.66 MPa ± 0.24 (Fig. 4B). Generally, all G12 and G18 samples showed an increase in Young's modulus that is significantly higher than those of G21 samples (p = 0.02 and p = 0.01, respectively). Also, a significant increase in the elasticity was clear between G21-1 and G21-3 samples (p = 0.03). In contrast, G18-3 had a significant decrease in elasticity (p = 0.031) when compared to G18-1. Although all G12 and G18 samples provided better Young's modulus than the control GIC, these differences were not statistically significant (Fig. 4).
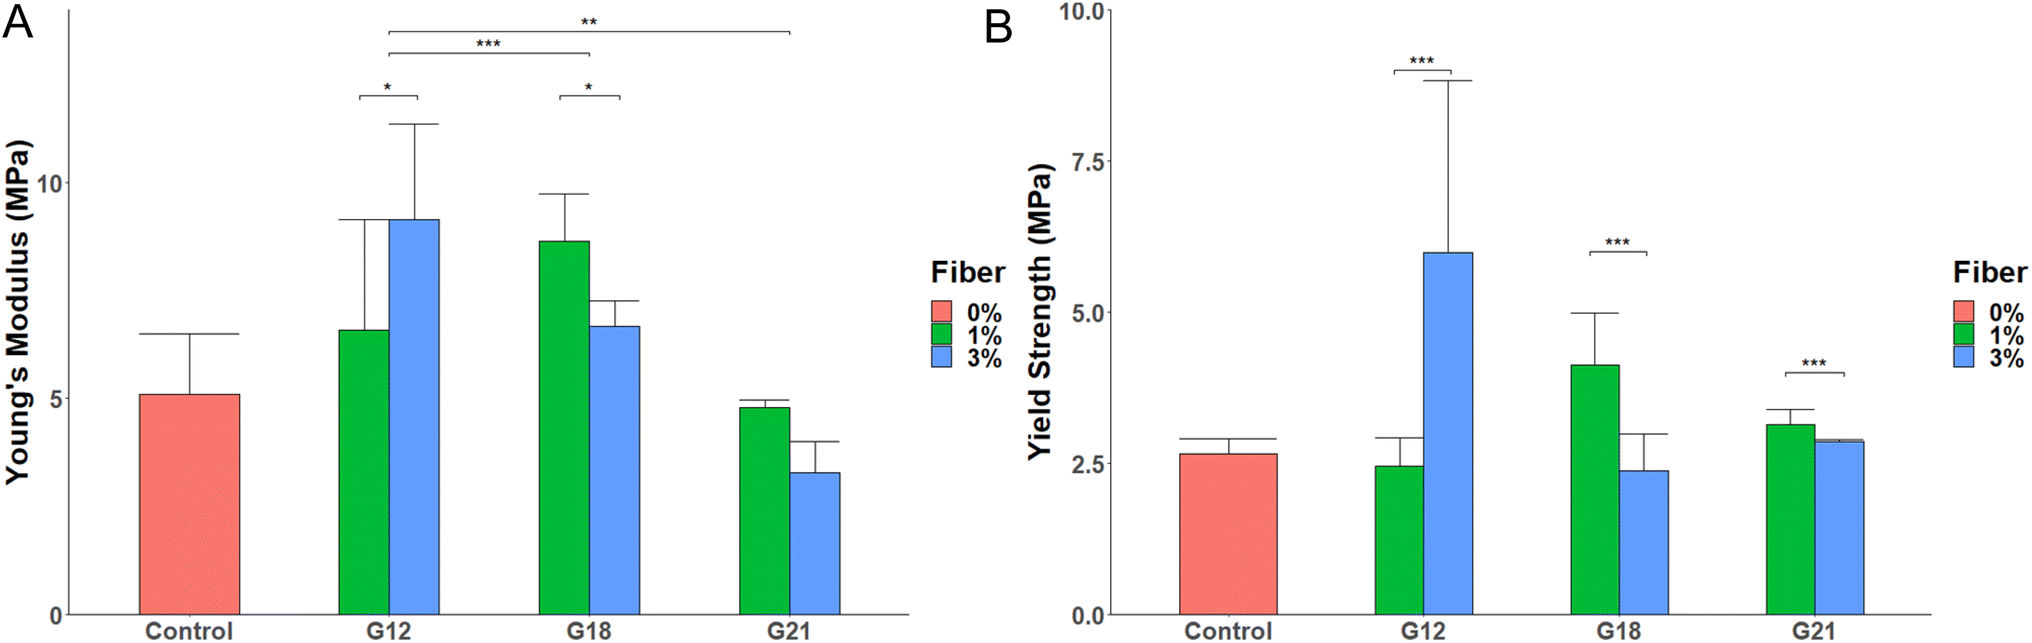 | ||
| Fig. 4 (A) Young's modulus of the GIC control and GIC augmented with cellulose (1% or 3%) and left to settle for 48 h. (B) Yield strength offset from the curve by 0.2% strain of the GIC control and GIC augmented with 1% or 3% cellulose fibers. G12, G18, and G21 represent glass ionomer cement augmented with cellulose fibrils extracted using rice husk: sodium hypochlorite ratios of 1:12, 1:18, and 1:21, respectively. *p < 0.04, **p < 0.03, and ***p < 0.02. | ||
Yield strength is used to measure the GIC resistance before reaching plastic deformation or fracturing. GIC used in this study had a yield strength of 2.6 MPa. However, the differences among G12, G18, and G21 on the one hand, and that of the control GIC, on the other hand, were insignificant (Fig. 4B). However, the maximum yield strength in GIC containing 3% cellulose (G12-3) was significantly higher than that of G12-1. In contrast, G18-1 and G21-1 were significantly better than G18-3 and G21-3, respectively (Fig. 4B).
Discussion
The TAPPI protocol (method T203), a standardized method to determine the quality and purity of the cellulose extracted from pulp, was adapted to quantify cellulose contents in rice husks and extracted samples. Rice husk had 34% alpha-cellulose,32 which represents the majority of the cellulose forms.30 C12 and C18 had the highest alpha-cellulose of 95% and 93.4%, respectively, and C21 had the lowest cellulose content of 86.8% which could suggest that the excess hypochlorite solution degraded some of the alpha-cellulose. Consequently, this reduced the quality of the GIC as shown in the mechanical strength tests (Fig. 4). The hydrolyzable carbohydrate only accounted for 2.5% of the rice husk, which disappeared completely (0.59% in C12) during hypochlorite treatment of the rice husk showing the purity of the cellulose produced by this method.It is quite clear that time has a major impact on the quality of the obtained cellulose fibrils. For C21 and C24 samples, the difference between 6, 9, and 24 h reaction times is unremarkable. Although the SEM images of all C12 samples had bundled regions, as the time of treatment with hypochlorite increased the abundance of those bundles declined (Fig. 1). The SEM images of C15 and C18 samples at 6 and 9 h have shown clear cellulose fibrils; however, those fibrils tend to assemble into flakes when the reaction time reached 24 h.
The presence of lignin in all C12 (Fig. 3B) samples, as well as C15 (6 h) and C15 (9 h), indicates that the S:L ratios of 1:12 and 1:15 and related extraction times were insufficient to eliminate all the lignin in the samples. The effect of extraction time has proven important when comparing C15 (9 h) and C15 (24 h) (Fig. 3E and F). The time difference between these 2 samples was sufficient to eliminate all lignin residues. Finally, all the C18 (Fig. 3C), C21, and C24 (Fig. 3D) samples have shown no color change after testing with the Maule test indicating the absence of lignin.
It is worth mentioning that Maule test identified the presence of lignin under C12 cellulose extraction conditions. Accordingly, it was anticipated that lignin would act as a binding material in all G12 samples.33 Hence, an increase in the lignin content would increase the stiffness of the GIC, which is evident when comparing the mechanical results of both G12-1 and G12-3. Lignin was absent in C18 batches, so the mechanical properties of the G18 samples were exclusively enhanced by the cellulose fibers added. It is generally better to keep the percentage of incorporated cellulose as low as possible, as in the G18-1 sample, which has a higher Young's modulus and yield strength than the G18-3 sample. In conclusion, both the G12 and G18 samples have comparable results, but they still outperform the GIC control and G21 samples in terms of stiffness and yield strength (Fig. 4).
Different composites were used as additives to enhance the mechanical strength of GIC such as resin composites (Grandio® SO/RC, VOCO), which increased the mechanical strength of GIC by 3.2 fold.34 While commercial grade resin (Vitremer™/VI, 3 M-ESPE) modified GIC showed an increased mechanical strength by only 1.15 fold.34 Adding metal alloys to increase the mechanical strength of GIC gave contradictory results.35 Finally, hydroxyapatite was also studied as an additive, but it weakened the GIC.35 Adding cellulose to GIC enhanced its mechanical strength. Cellulose is also known for its adhesive properties which was evident during the fabrication of cellulose-GIC as the addition of more cellulose reduced the time needed for GIC to harden inside the mold. Cellulose is also reported to protect GIC from moisture and oxygen when it is used as a filler in teeth.36
Several methods of extraction of cellulose from different sources such as Eucalyptus, Betula species & Populus tremolo, and commercial Cellulostar®, were reported.25,37,38 In comparison to this study, cellulose extracted using conditions C12 and C18 showed a better enhancement of 0.2% yield strength when incorporated into GIC (Table 1). Moreover, C21 which has 84% alpha-cellulose content showed a similar change in yield strength compared to other values reported. Therefore, the developed extraction method is not only facile but also yields cellulose which, when added to GIC, enhances its mechanical strength by 130% (in case of 3% cellulose extracted using C12 conditions) and 58.5% (in case of 1% cellulose extracted using C18 conditions).
| Source | Cellulose purity | Glass ionomer cement source | Cellulose (%) added to GIC | Mechanical strength change (%) | References |
|---|---|---|---|---|---|
| Mixture of Betula species & Populus tremolo | 93.5% | Fuji IX, shade A3; GC, Tokyo, Japan | 0 | 0 | 37 |
| 1 | 18.3 | ||||
| 2 | 2 | ||||
| 3 | −2 | ||||
| 4 | −29.6 | ||||
| 5 | −31.6 | ||||
| Eucalyptus | ND | Vidrion R, SS White, Brazil | 0 | 0 | 38 |
| 3.5 | 22.9 | ||||
| 6.7 | 21.9 | ||||
| 9.8 | 32.1 | ||||
| Cellulostar (STARLITE Co. Ltd., Osaka, Japan) | ND | Fuji VII®, GC Co., Ltd., Tokyo, Japan | 0 | 0 | 25 |
| 2 | 8.78 | ||||
| 4 | 16.9 | ||||
| 6 | 11.9 | ||||
| 8 | 14.7 | ||||
| Rice husk (Oryza sativa L.) | ChangShu ShangChi Dental Materials Co., Ltd. Jiangsu, China | 0 | 0 | This study | |
| C12 → 95% | 1 | −5 | |||
| 3 | 130 | ||||
| C18 → 93.4% | 1 | 58.5 | |||
| 3 | −8.85 | ||||
| C21 → 86.84% | 1 | 27.2 | |||
| 3 | 9.23 |
Conclusions
While cellulose can be extracted from different plants as well as micro-organism sources, rice husk is considered a promising source for cellulose. The conventional extraction of cellulose from rice husk is time-consuming and requires multiple steps to extract pure cellulose. In this study, we have developed a facile and fast method that requires as minimal chemicals as possible. It is also adjustable by varying the S:L ratio and extraction time. Moreover, the developed extraction method is easily scalable, reproducible, and environmentally sustainable. Cellulose extracted by this method was of high quality and did not contain other materials (namely lignin). The addition of 1% cellulose fibers (extracted using a S:L ratio of 1:18 to GIC) enhanced its mechanical strength. Lignin was shown to increase the stiffness and yield strength of the GIC due to its binding ability. Therefore, the developed method may be modified to extract lignin for use as a binding agent for other applications.
The limitations of this study include the need to investigate different concentrations of extracted cellulose to GIC. Also, there is a need to investigate the addition of extracted cellulose to different brands of commercial GIC. This would provide further insight into the best cellulose-GIC preparation with the highest mechanical strength and stiffness. Also, there is a need to investigate the effect of adding cellulose on the release of fluoride from the GIC material.
The incorporation of cellulose in dental GIC aimed to increase the strength of the GIC with an eco-friendly naturally extracted biopolymer while decreasing the amount of glass cement and consequently reducing the cost of GIC implants. Future work may include clinical investigation of the proposed cellulose enhanced dental GIC implant.
Author's contribution
SA and NE carried out the experimental work and wrote the first draft. H. M. E. A. guided, supervised, edited the manuscript, and provided funds for the project.Conflicts of interest
There are no conflicts to declare.Acknowledgements
This study was funded by a grant from the office of the Dean, School of Sciences & Engineering, The American University in Cairo to Professor Hassan Azzazy.References
- V. Jittin, A. Bahurudeen and S. D. Ajinkya, J. Cleaner Prod., 2020, 263, 121578 CrossRef CAS.
- S. S. Hossain, L. Mathur and P. K. Roy, J. Asian Ceram. Soc., 2018, 6, 299–313 CrossRef.
- M. Ramos, E. Laveriano, L. San Sebastián, M. Perez, A. Jiménez, R. M. Lamuela-Raventos, M. C. Garrigós and A. Vallverdú-Queralt, Trends Food Sci. Technol., 2023, 131, 14–27 CrossRef CAS.
- Z. Shamsollahi and A. Partovinia, J. Environ. Manage., 2019, 246, 314–323 CrossRef CAS PubMed.
- M. G. Jackson, Anim. Feed Sci. Technol., 1977, 2, 105–130 CrossRef CAS.
- A. R. Mankar, A. Modak and K. K. Pant, Adv. Sustainable Syst., 2022, 6, 2100299 CrossRef CAS.
- A. E. Karaca, C. Özel, A. C. Özarslan and S. Yücel, Polym. Compos., 2022, 43(10), 6838–6853 CrossRef CAS.
- T. Heinze, O. A. El Seoud and A. Koschella, in Cellulose Derivatives: Synthesis, Structure, and Properties, eds., T. Heinze, O. A. El Seoud and A. Koschella, Springer International Publishing, Cham, 2018, pp. 1–38, DOI:10.1007/978-3-319-73168-1_1.
- L. M. Kroon-Batenburg and J. Kroon, Glycoconjugate J., 1997, 14, 677–690 CrossRef CAS PubMed.
- S. D. Rohan, A. Sanjit and A. Noureddine, in Advanced Sorption Process Applications, ed., E. Serpil, IntechOpen, Rijeka, 2018, p. Ch. 1, DOI:10.5772/intechopen.80898.
- R. Quesada Cabrera, F. Meersman, P. F. McMillan and V. Dmitriev, Biomacromolecules, 2011, 12, 2178–2183 CrossRef CAS PubMed.
- F. Dias and C. Duarte, Cellulose and Its Derivatives Use in the Pharmaceutical Compounding Practice, InTech, 2013, DOI:10.5772/56637.
- Y. Liu, S. Ahmed, D. E. Sameen, Y. Wang, R. Lu, J. Dai, S. Li and W. Qin, Trends Food Sci. Technol., 2021, 112, 532–546 CrossRef CAS.
- R. Mu, X. Hong, Y. Ni, Y. Li, J. Pang, Q. Wang, J. Xiao and Y. Zheng, Trends Food Sci. Technol., 2019, 93, 136–144 CrossRef CAS.
- S. Venkatarajan and A. Athijayamani, Mater. Today: Proc., 2021, 37, 3620–3624 CrossRef CAS.
- M. Yunus, Jurnal Akta Kimia Indonesia (Indonesia Chimica Acta), 2019, 12, 79 CrossRef.
- S. Shukla, A. Bharadvaja and G. Dubey, Delhi Univ. J. Undergrad. Res. Innov., 2015, 1, 187–194 Search PubMed.
- N. Johar, I. Ahmad and A. Dufresne, Ind. Crops Prod., 2012, 37, 93–99 CrossRef CAS.
- Y. T. Girijappa, S. M. Rangappa, J. Parameswaranpillai and S. Siengchin, Front. Mater., 2019, 226 CrossRef.
- S. Gopi, P. Balakrishnan, D. Chandradhara, D. Poovathankandy and S. Thomas, Mater. Today Chem., 2019, 13, 59–78 CrossRef CAS.
- A. Vinod, M. R. Sanjay, S. Suchart and P. Jyotishkumar, J. Cleaner Prod., 2020, 258, 120978 CrossRef CAS.
- U. Lohbauer, Dental Glass Ionomer Cements as Permanent Filling Materials?—Properties, Limitations Future Trends, Materials, 2009, 3(1), 76–96, DOI:10.3390/ma3010076.eCollection.
- U. Meyer, D. H. Szulczewski, R. H. Barckhaus, M. Atkinson and D. B. Jones, Biomaterials, 1993, 14, 917–924 CrossRef CAS PubMed.
- N. Mohammadi, Z. Fattah and L. V. Borazjani, Int. Dent. J., 2022, 73(2), 243–250 CrossRef PubMed.
- T. Nishimura, Y. Shinonaga, C. Nagaishi, R. Imataki, M. Takemura, K. Kagami, Y. Abe, K. Harada and K. Arita, Materials, 2019, 12, 3077 CrossRef CAS PubMed.
- S. Garoushi, J. He, J. Obradovic, P. Fardim, P. Vallittu and L. Lassila, Eur. J. Oral Sci., 2020, 128, 81–88 CrossRef CAS PubMed.
- R. M. Silva, F. V. Pereira, F. A. Mota, E. Watanabe, S. M. Soares and M. H. Santos, Mater. Sci. Eng., C, 2016, 58, 389–395 CrossRef CAS PubMed.
- R. M. Silva, P. H. N. Santos, L. B. Souza, V. C. Dumont, J. A. Soares and M. H. Santos, Mater. Res. Bull., 2013, 48, 118–126 CrossRef CAS.
- S. B. Sheng, R. Alawi, Y. Johari, N. A. Abdul Muttlib, M. H. Hussin, D. Mohamad and M. I. Karobari, J. Funct. Biomater., 2023, 14, 184 CrossRef CAS PubMed.
- I. Advanced Solutions International, Alpha-, beta- and gamma-cellulose in pulp, test method T 203 cm-22, https://imisrise.tappi.org/TAPPI/Products/01/T/0104T203.aspx.2023 Search PubMed.
- F. Toldrá and L. M. Nollet, Handbook of Dairy Foods Analysis, CRC Press, 2021 Search PubMed.
- Y. Gao, X. Guo, Y. Liu, Z. Fang, M. Zhang, R. Zhang, L. You, T. Li and R. H. Liu, Sci. Rep., 2018, 8, 10482 CrossRef PubMed.
- M. Mili, S. A. R. Hashmi, M. Ather, V. Hada, N. Markandeya, S. Kamble, M. Mohapatra, S. K. S. Rathore, A. K. Srivastava and S. Verma, J. Appl. Polym. Sci., 2022, 139, 51951 CrossRef CAS.
- D. S. Rodrigues, M. Buciumeanu, A. E. Martinelli, R. M. Nascimento, B. Henriques, F. S. Silva and J. C. M. Souza, J. Bio-Tribo-Corros., 2015, 1, 24 CrossRef.
- J. W. Nicholson, S. K. Sidhu and B. Czarnecka, Materials, 2020, 13(11), 2510 CrossRef CAS PubMed.
- S. Zuppolini, A. Salama, I. Cruz-Maya, V. Guarino and A. Borriello, Pharmaceutics, 2022, 14, 386 CrossRef CAS PubMed.
- S. Garoushi, J. He, J. Obradovic, P. Fardim, P. K. Vallittu and L. Lassila, Eur. J. Oral Sci., 2020, 128, 81–88 CrossRef CAS PubMed.
- R. M. Silva, F. V. Pereira, F. A. Mota, E. Watanabe, S. M. Soares and M. H. Santos, Mater. Sci. Eng., C, 2016, 58, 389–395 CrossRef CAS PubMed.
Footnotes |
| † Electronic supplementary information (ESI) available. See DOI: https://doi.org/10.1039/d3su00230f |
| ‡ Saif El-Din Al-Mofty and Nehal H. ElGhazawy contributed equally to this work. |
| This journal is © The Royal Society of Chemistry 2023 |